")
Back to Journals » ClinicoEconomics and Outcomes Research » Volume 8
Cost versus utility of aclidinium bromide 400 μg plus formoterol fumarate dihydrate 12 μg compared to aclidinium bromide 400 μg alone in the management of moderate-to-severe COPD
Authors Ramos M, Haughney J , Henry N, Lindner L, Lamotte M
Received 24 February 2016
Accepted for publication 29 April 2016
Published 12 September 2016 Volume 2016:8 Pages 445—456
DOI https://doi.org/10.2147/CEOR.S107121
Checked for plagiarism Yes
Review by Single anonymous peer review
Peer reviewer comments 2
Editor who approved publication: Professor Giorgio Colombo
Mafalda Ramos,1 John Haughney,2 Nathaniel Henry,3 Leandro Lindner,4 Mark Lamotte1
1Real World Evidence, IMS Health, Zaventem, Belgium; 2Academic Primary Care Division of Applied Health Sciences, University of Aberdeen, Aberdeen, Scotland, 3Health Economics and Outcomes Research, Real World Evidence, IMS Health, London, UK; 4AstraZeneca, Barcelona, Spain
Purpose: Aclidinium–formoterol 400/12 µg is a long-acting muscarinic antagonist (LAMA) and a long-acting β2-agonist in a fixed-dose combination used in the management of patients with COPD. This study aimed to assess the cost-effectiveness of aclidinium–formoterol 400/12 µg against the long-acting muscarinic antagonist aclidinium bromide 400 µg.
Materials and methods: A five-health-state Markov transition model with monthly cycles was developed using MS Excel to simulate patients with moderate-to-severe COPD and their initial lung-function improvement following treatment with aclidinium–formoterol 400/12 µg or aclidinium 400 µg. Health states were based on severity levels defined by Global Initiative for Chronic Obstructive Lung Disease 2010 criteria. The analysis was a head-to-head comparison without step-up therapy, from the NHS Scotland perspective, over a 5-year time horizon. Clinical data on initial lung-function improvement were provided by a pooled analysis of the ACLIFORM and AUGMENT trials. Management, event costs, and utilities were health state-specific. Costs and effects were discounted at an annual rate of 3.5%. The outcome of the analysis was expressed as cost (UK£) per quality-adjusted life-year (QALY) gained. The analysis included one way and probabilistic sensitivity analyses to investigate the impact of parameter uncertainty on model outputs.
Results: Aclidinium–formoterol 400/12 µg provided marginally higher costs (£41) and more QALYs (0.014), resulting in an incremental cost-effectiveness ratio of £2,976/QALY. Sensitivity analyses indicated that results were robust to key parameter variations, and the main drivers were: mean baseline forced expiratory volume in 1 second (FEV1), risk of exacerbation, FEV1 improvement from aclidinium–formoterol 400/12 µg, and lung-function decline. The probability of aclidinium–formoterol 400/12 µg being cost-effective (using a willingness-to-pay threshold of £20,000/QALY) versus aclidinium 400 µg was 79%.
Conclusion: In Scotland, aclidinium–formoterol 400/12 µg can be considered a cost-effective treatment option compared to aclidinium 400 µg alone in patients with moderate-to-severe COPD.
Keywords: cost-effectiveness, Scotland, Markov model, lung-function improvement, LABA, LAMA
Introduction
In Scotland, COPD is a major health issue, with approximately 105,000 diagnosed COPD patients,1 representing 2% of the population. By 2027, this is projected to increase to 127,000 patients.2 COPD is a common, preventable, and incurable disease, characterized by persistent and progressive airflow limitation. Progressive dyspnea, chronic cough, and sputum production are the most common symptoms of COPD.3 The symptoms of COPD, rather than the airflow limitation, have the greatest impact on quality of life. Dyspnea in particular is a major cause of disability and anxiety,3 has been reported to be the most bothersome symptom of COPD, and is often the primary reason for patients seeking medical care.4
The focus of COPD management is on controlling symptoms, improving health status, and reducing exacerbations, with minimal side effects from treatment. Currently available drug therapies comprise bronchodilators (available as short- and long-acting β2-agonists and short- and long-acting muscarinic antagonists), corticosteroids, and phosphodiesterase-4 inhibitors. Nonetheless, a segment of patients remain uncontrolled with current COPD treatments, and hence alternative treatment options are needed to address current unmet need.
Aclidinium bromide 400 µg plus formoterol fumarate dihydrate 12 µg is a combination of two bronchodilators – aclidinium bromide 400 µg (a long-acting muscarinic antagonist [LAMA]) and formoterol fumarate dehydrate 12 µg (a long-acting β-adrenergic agonist [LABA]) – indicated as maintenance bronchodilator treatment to relieve symptoms in adult patients with COPD. The combination of two bronchodilators with different mechanisms of action results in significantly greater efficacy (reducing symptoms, including breathlessness) compared to that achieved with either monotherapy component alone.
The efficacy of aclidinium–formoterol 400/12 µg compared to aclidinium 400 µg alone was shown in two clinical trials (LAC 30/ACLIFORM5 and LAC-MD-31/AUGMENT6). The results from both studies showed a significant improvement with aclidinium–formoterol 400/12 µg compared to aclidinium 400 µg alone in bronchodilation and symptomatic end points.7 Bateman et al reported results of a prespecified pooled analysis of data from the two studies.8
In light of resource scarcity within health care systems, in addition to consideration of efficacy, whether the intervention represents good value for money also requires evaluation. The current study assessed the cost-effectiveness (CE) of aclidinium–formoterol 400/12 µg compared to aclidinium 400 µg alone in Scotland.
Materials and methods
Model structure
To predict the CE of aclidinium–formoterol 400/12 µg in the management of COPD, a state-transition (Markov) model was constructed using MS Excel. A Markov model permits categorization of a disease into distinct and mutually exclusive health states, to model patients’ movement between states over discrete time periods, and to estimate the long-term costs and outcomes associated with these states.
Five health states were defined: mild, moderate, severe, and very severe COPD, as well as death. Mild-to-very severe COPD health states were defined based on pulmonary function, measured by the postbronchodilator forced expiratory volume in 1 second (FEV1) percentage of predicted normal value, using the same severity classification as the Global Initiative for Chronic Obstructive Lung Disease (GOLD) 2010 criteria (which was used in the pivotal aclidinium–formoterol 400/12 µg clinical trials). This criteria is also in line with the 2010 National Institute for Health and Care Excellence COPD guidelines (mild, postbronchodilator FEV1 higher than 80% predicted; moderate, postbronchodilator FEV1 greater than or equal to 50% of predicted and lower than 80% predicted; severe, postbronchodilator FEV1 greater than or equal to 30% of predicted and lower than 50% predicted; very severe, postbronchodilator FEV1 lower than 30% predicted or lower than 50% predicted plus chronic respiratory failure).9 The structure of the model is shown in Figure 1.
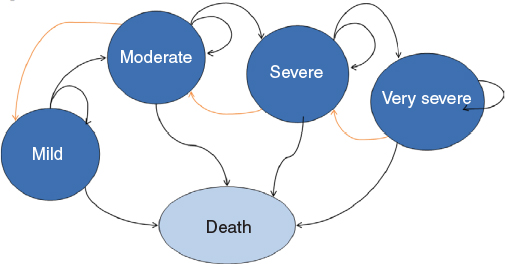 | Figure 1 Five-health-state model structure. Note: Patients can enter the model in the mild, moderate, severe, and very severe health states. Orange arrows represent the possibility for a patient to move to a less severe health state as a result of initiation of treatment. Black arrows represent the natural progression of the disease resulting in patients moving to a more severe health state. In each health state there is also the possibility to die. |
Within each health state, specific values for the associated utility, resource use, cost, and risk of exacerbation or pneumonia were assigned. It was assumed that an exacerbation could be treated in hospital (fatal and nonfatal) or in community care, each with different associated costs and disutilities. Pneumonia could also be fatal or nonfatal.
This analysis was a head-to-head comparison without step-up therapy. Step-up therapy was not included for the following reasons. Firstly, the treatment pathway in Scotland allows many step-up therapies, which are dependent on patient and physician preferences, making the modeling very complex. Second, switching between drugs will dilute the modeled impact of the initial interventions. Consequently, the model time horizon was curtailed at 5 years, to limit the impact of omitting treatment sequences on results. Over an extended time horizon, a range of additional treatments are likely to be administered. Many other COPD CE studies have adopted short time horizons and head-to-head comparisons for similar reasons, in COPD but also in hypertension.10–12
Monthly cycles were chosen because the risk of exacerbation available in the published literature was reported by month, and because the time point of measuring efficacy in the pooled analysis7 was 24 weeks and this could also be easily converted to monthly data. Monthly cycles also permitted a more detailed analysis of lung-function progression between comparators, and for this reason the same cycle length has been selected previously in published COPD-health economic models.10–12
The perspective of the third-party health care payer (NHS Scotland) was taken for the analysis. Costs and effects were discounted at an annual rate of 3.5%, and the summary outcome of the analysis was cost (£) per quality-adjusted life-year (QALY) gained. A half-cycle correction was not applied.
The initial cohort of patients represented the baseline population from the pooled analysis7 of aclidinium–formoterol 400/12 µg. The cohort had an initial baseline value of FEV1, which was used to assign patients into the appropriate lung function-dependent health state at the model start.
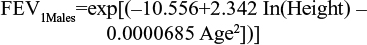
Among the several prediction equations available to predict lung-function capacity,13–19 the Langhammer et al18 equations were chosen to predict the average FEV1 of the baseline population (in liters). These equations are defined by sex, and estimate the lung function of a nonsmoking individual according to age (in years) and height (in centimeters), but also predict the lung-function capacity of these individuals over time. The prediction equations were estimated using the most recent set of data.
|
|
|
|
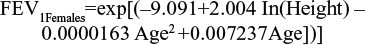
The age of the baseline population included within the pooled analysis and height by sex from the 2009 Health Survey for England20 (see Table 1) were applied to both equations. Multipliers were applied to estimate the lung-function capacity of patients by health state. These were the midpoints of GOLD-criteria postbronchodilator FEV1 thresholds for each health state: 90% for mild, 65% for moderate, 40% for severe, and 15% for very severe health states (Table 2). Outputs from the predictive equations were then multiplied by the midpoints of the relevant GOLD-criteria severity states to determine estimated lung-function capacity values at baseline. Therefore, moderate and severe health-state values of 1.61 L and 0.99 L for females and 2.30 L and 1.41 L for males were calculated.
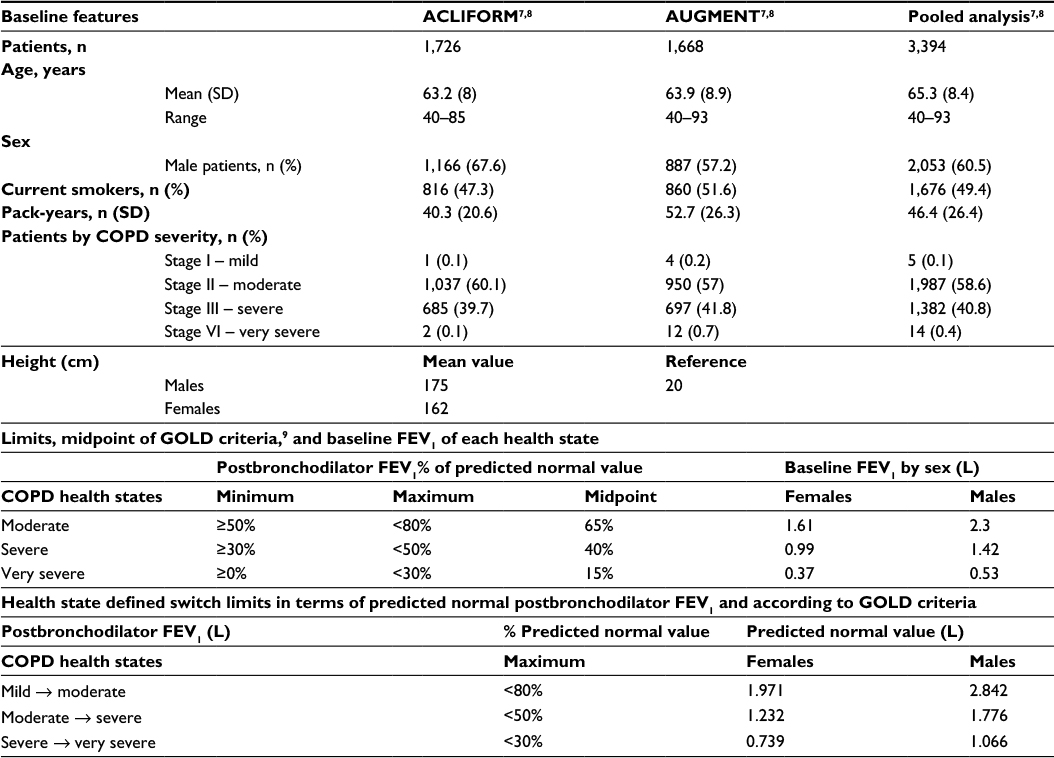 | Table 1 Summary of baseline features and stages of GOLD criteria Note: Reproduced from European Medicines Agency. Duaklir Genuair Assessement report. 2014. © European Medicines Agency, 2014;7 Reproduced from Bateman ED, Chapman KR, Singh D, et al. Aclidinium bromide and formoterol fumarate as a fixed-dose combination in COPD: pooled analysis of symptoms and exacerbations from two six-month, multicentre, randomised studies (ACLIFORM and AUGMENT). Respir Res. 2015;16:92.8 Abbreviations: SD, standard deviation; GOLD, Global Initiative of Chronic Obstructive Lung Disease; FEV1, forced expiratory volume in 1 second. |
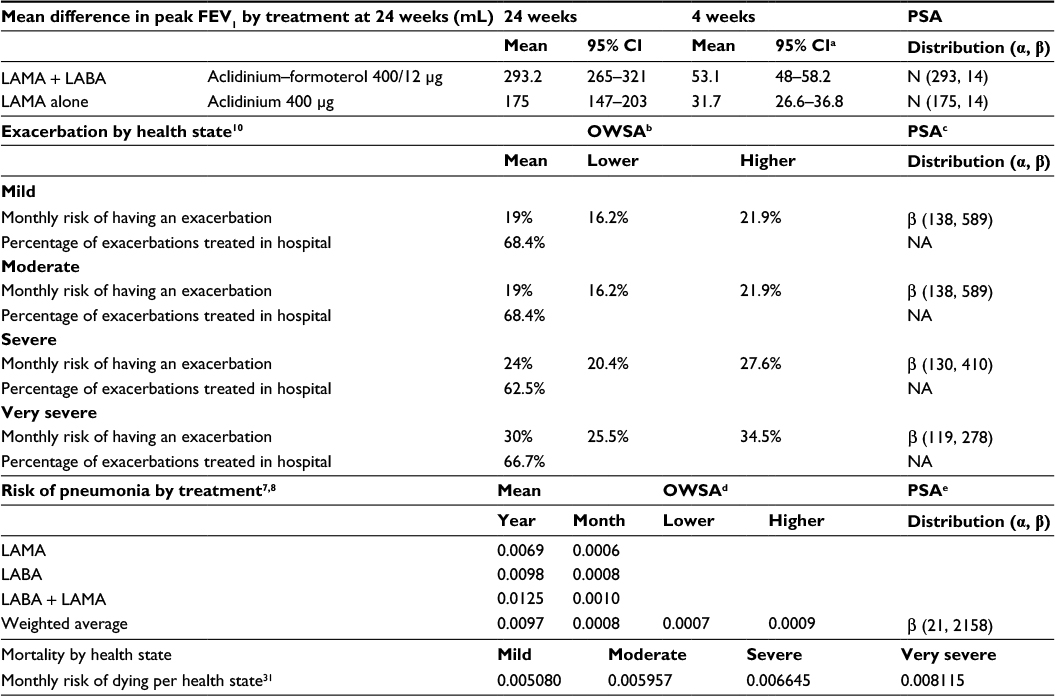 | Table 2 Lung-function improvement, exacerbation, and pneumonia and mortality data Notes: aConfidence intervals were used to define upper and lower bounds of OWSA and to estimate uncertainty around the mean of PSA; b15% variability was considered to estimate the upper and lower bounds; cα- and β-parameters were estimated based on the mean value and the extremes of confidence intervals; d30% variability was considered to estimate the upper and lower bounds; etotal number of events of pneumonia per month and total number of observed patients in subgroup analysis were considered as figures for the α- and β-parameters, respectively. Reproduced from European Medicines Agency. Duaklir Genuair Assessement report. 2014. © European Medicines Agency, 2014.7 Reproduced from Bateman ED, Chapman KR, Singh D, et al. Aclidinium bromide and formoterol fumarate as a fixed-dose combination in COPD: pooled analysis of symptoms and exacerbations from two six-month, multicentre, randomised studies (ACLIFORM and AUGMENT). Respir Res. 2015;16:92.8 Republished with permission of Dove Medical Press Limited, from Karabis A, Mocarski M, Eijgelshoven I, Bergman G. Economic evaluation of aclidinium bromide in the management of moderate to severe COPD: an analysis over 5 years. Clinicoecon Outcomes Res. 2014;6 © 2016; permission conveyed through Copyright Clearance Center, Inc.10 Abbreviations: CI, confidence interval; SD, standard deviation; FEV1, forced expiratory volume in 1 second; OWSA, one-way sensitivity analysis; PSA, probabilistic sensitivity analysis; LAMA, long-acting muscarinic antagonist; LABA, long-acting β2-agonist; NA, not applicable; β, Beta distribution; N, Normal distribution. |
The progression of COPD caused by decline or improvement of lung function informs patients’ transitions between health states. In the first six cycles, an initial linear lung-function improvement reflecting the 24-week FEV1 improvement observed in the pooled analysis was applied. Note that monthly cycles were used, and thus FEV1 improvement at 24 weeks was converted to monthly cycles of 4.348 weeks. Over 24 weeks, this equates to 5.5 cycles’ improvement, and so was rounded to six cycles.
In the pooled analysis,8 the FEV1 improvement is given by the clinical outcome peak (measure taken in the morning 1 hour postdose at week 24) or trough (measure taken in the morning predose at week 24). The initial increase in FEV1 from treatment allows patients to move from very severe to severe, severe to moderate, and moderate to mild health states (Figure 1 [orange arrows]). After the sixth cycle, the model assumes that the treatment effect is null, and only a decline in lung-function capacity typical in COPD patients is taken into account. At this point, patients can thus move from mild to moderate, moderate to severe, and severe to very severe (Figure 1 [black arrows]). The best treatments will have a higher initial increase in FEV1 and a delayed progression compared to less effective treatments over time.
Patients were assigned to the respective health states (defined by GOLD-criteria FEV1 thresholds for disease severity) within the model on the basis of their modeled FEV1 measurement. Table 1 shows the borders of the GOLD criteria between health states by sex.
Estimation of the lung-function decline in COPD patients was taken from a recent clinical trial, the UPLIFT study, because it used appropriate, contemporary treatment regimens.21 The UPLIFT study was a 4-year, randomized, double-blind, placebo-controlled, parallel-group trial involving patients with moderate-to-very severe COPD. It reported a lung-function decline of 41 mL per year.21 As the Markov model is defined by monthly cycles, the average annual lung-function decline was converted to a monthly rate (3.4 mL/month) by dividing the figure by 12.
Choice of the comparator
In Scotland, a range of current Managed Clinical Network guidelines22–25 recommend LAMA or LABA use in individuals with stable COPD who remain breathless or have exacerbations despite use of short-acting bronchodilators. Aclidinium 400 µg has been accepted for use within NHS Scotland, as a maintenance bronchodilator treatment to relieve symptoms in adult patients with COPD, since November 2012. As Scottish Medicines Consortium advice has upheld the equivalence of aclidinium 400 µg with the most widely prescribed LAMA in Scotland – tiotropium 18 µg – and as the clinical trial for aclidinium–formoterol 400/12 µg was compared to aclidinium 400 µg, this study focused on the comparison of aclidinium–formoterol 400/12 µg against aclidinium 400 µg alone.
Clinical data
The initial increase in FEV1 was taken from a pooled analysis8 of two trials: ACLIFORM5 and AUGMENT.6 Both were randomized, double-blind, placebo- and active-controlled, parallel-group studies. This analysis included patients, on average aged 63.5 years, who were current or ex-cigarette smokers with a smoking history of ≥10 pack-years. The proportion of females was 39.5%. Patients were diagnosed with stable moderate-to-severe COPD, as defined in the 2010 GOLD criteria.9 Table 1 shows the main features of the baseline intention to treat population of the pooled analysis.7,8 Change from baseline in FEV1 at 1 hour postdose (peak) was the primary end point. Symptom- and disease-based measures were selected as secondary end points: 1) improvement in Transition Dyspnea Index (TDI) focal score at week 24 (versus control); 2) change from baseline in St George’s Respiratory Questionnaire total score at week 24 (versus control); 3) reduction in risk of moderate or severe COPD exacerbations per patient per year in each dose of investigational product relative to control, based on pooled data from ACLIFORM and AUGMENT.
The results of the pooled analysis showed that at 24 weeks, aclidinium–formoterol 400/12 µg and aclidinium 400 µg showed an FEV1 improvement of 293.2 mL (95% confidence interval 265–321) and 175 mL (95% confidence interval 147–203), respectively (as peak FEV1 values vs placebo) (Table 2).7
The risk of exacerbation, both for treated-in-hospital (severe exacerbation) and treated-in-community/primary (nonsevere exacerbation) care, was taken from Karabis et al and Oostenbrink et al.10,26 These data were obtained from trials that assessed tiotropium, ipratropium, and salmeterol.27–29 In all cases, exacerbations were defined as a complex set of respiratory symptoms (new onset or an increase in at least one of cough, sputum, dyspnea, wheeze, and chest discomfort) lasting at least 3 days. Based on data collected from this study, the probability of a patient having an exacerbation and the percentage of exacerbation treated in hospital were estimated (Table 2). To estimate the overall probability of patients having an exacerbation, proportion of patients having both types of exacerbations were summed. The proportion of having an exacerbation treated in hospital was calculated as the ratio of the probability of having a serious exacerbation per month to the total probability of having an exacerbation per month, as reported by Karabis et al.10 Note that in the current analysis, the case fatality of an exacerbation was set at 0, given that this was already accounted for in COPD-related mortality per health state.
The risk of pneumonia was available from the pooled analysis8 of aclidinium–formoterol 400/12 µg, but significant differences were not demonstrated between treatment arms. Therefore, the weighted average value was applied in the two arms of the model. Table 2 shows the incidence of pneumonia at 24 weeks and 1 month. To estimate the figure for 1 month, the Miller and Homan equation was applied.30
Patients with COPD, apart from having a higher risk of dying from all causes than the general population, also have different mortality profiles according to disease severity. To account for both, COPD mortality data by health state were included in the model and estimated from four Kaplan–Meier survival curves.31 The curves described population groups categorized according to each GOLD stage. The survival curves showed a linear negative trend of survival after the first year, and based on that, the model linearly extrapolated the risk of dying per month. The linear coefficient (value incremented every month) was determined using data from the time after which 50% of the population in that health state died. For all health states, this parameter was estimated and defined as the monthly risk of dying. Mortality data were available for a maximum time horizon of 15 years.
Cost data
The following cost items were needed to populate the model: drug-acquisition costs, management cost per health state, and event costs (exacerbation treated in community, exacerbation treated in hospital, pneumonia treated in hospital). The cost per package and daily doses were collected from the British National Formulary in June 2014 and used to estimate the cost per month of aclidinium 400 µg (Table 3).32
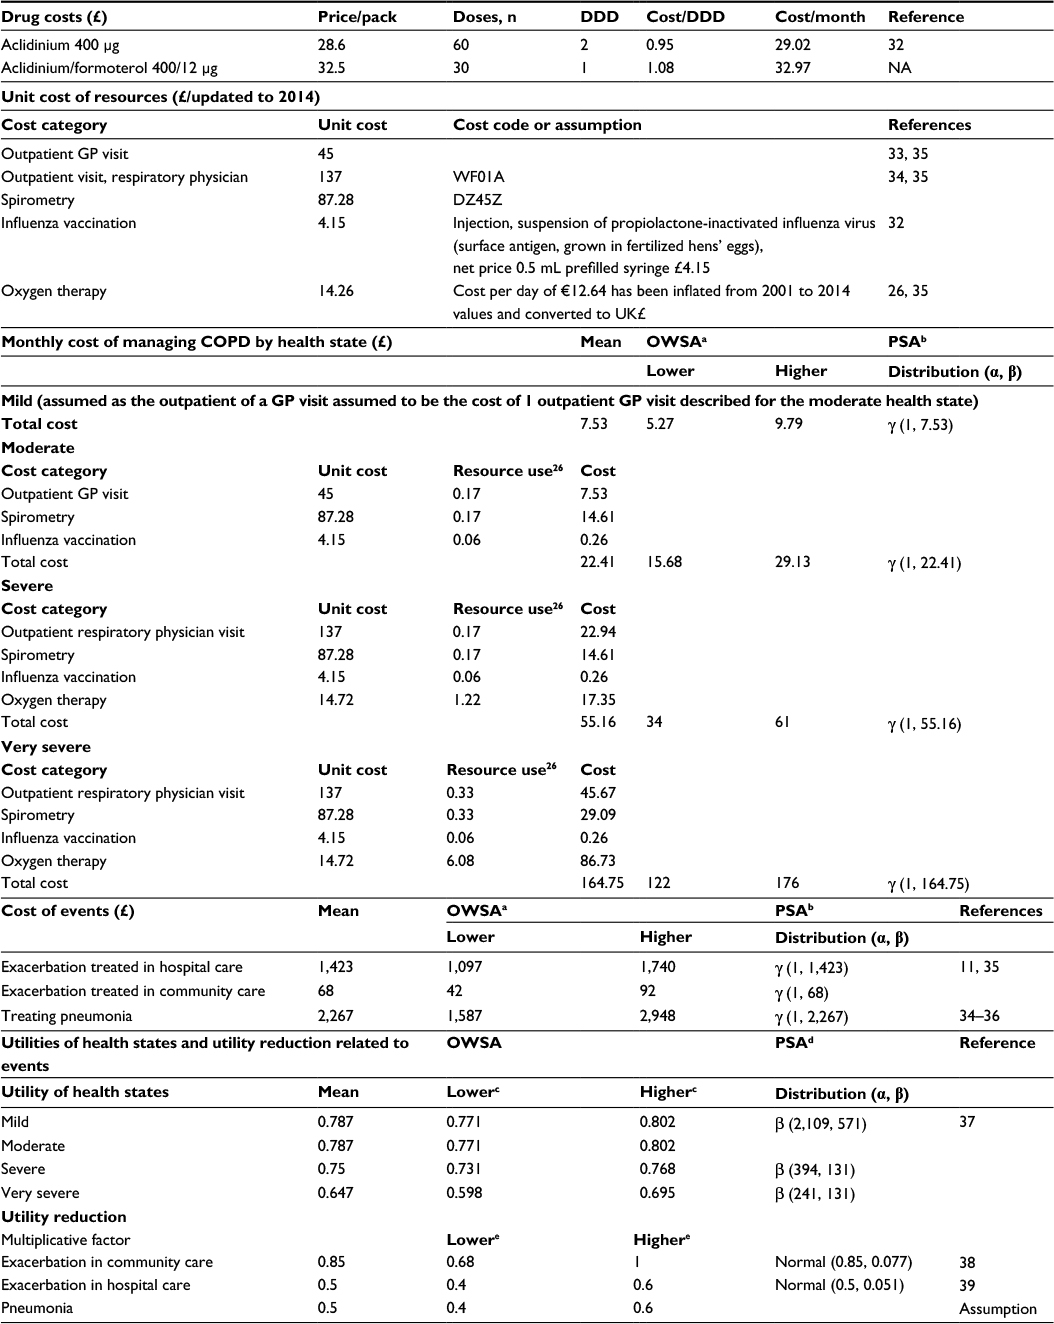 | Table 3 Unit costs, resource use, and utility data Notes: a30% variation of the mean applied; bα- and β-parameters estimated assuming uncertainty equal to mean40; c95% CIs used to define upper and lower bounds of OWSA; dα- and β-parameters determined based on mean value and extremes of CIs; e20% variation of the mean applied. Abbreviations: CI, confidence interval; SD, standard deviation; FEV1, forced expiratory volume in 1 second; OWSA, one-way sensitivity analysis; PSA, probabilistic sensitivity analysis; LAMA, long-acting muscarinic antagonist; LABA, long-acting β2-agonist; DDD, defined daily dose; γ, Gamma distribution; β, Beta distribution; N, Normal distribution; NA, not applicable; DZ45Z, Lung Volume Studies - Procedures in Outpatients - Lung Volume Studies ; WF01A, Consultant Led Outpatient Attendances - respiratory medicine - Non-Admitted Face to Face Attendance, Follow-up. |
The cost of managing COPD patients was defined per health state and estimated on a monthly basis. To estimate this cost, information on the resource consumption per health state was taken from the literature.11,26 Note that the reported resource consumption was for the Netherlands. In the absence of comprehensive local data, this was assumed applicable to Scotland (Table 3), similarly to another recent study by Samyshkin et al,11 which had assumed the data to be applicable to the UK. Unit costs of resources were collected from the literature and national databases.26,32–34 Inflation statistics were derived using UK consumer price data from the Organisation for Economic Co-operation and Development (OECD) statistics database.35
For patients who had an exacerbation treated in hospital, the same cost was applied, irrespective of whether mortality occurred. The cost of an exacerbation was retrieved from Samyshkin et al11 and inflated to 2014 values (inflation factor was estimated from UK consumer price data from the OECD statistics database)35 (Table 3).
In the model, pneumonia could result in a fatal or a nonfatal event. The same cost was applied to both. The cost of treating pneumonia was assumed to be the weighted average cost obtained using the Healthcare Resource Group (HRG) codes DZ11A–DZ11C (for lobar, atypical, or viral pneumonia with major complications, with complications, and without complications) of the Scottish National Tariff,36 and patient-activity data reported in the UK from the national reference cost list of 2012–2013.34 This cost was updated to 2014 (inflation factor was estimated from UK consumer price data from the OECD statistics database)35 (Table 3).
Utility data
Utility values for each health state and utility reductions when the patient suffered an exacerbation or pneumonia were modeled on the full-cycle duration (Table 3). Utilities per health state were collected from a quality-of-life study of COPD patients, using the EuroQol five-dimension questionnaire (EQ-5D) for the different COPD-severity stages.37 The study analyzed a subset of 1,235 patients from the UPLIFT trial, and concluded a negative association between the severity of COPD and utility scores. Utility scores were reported for three GOLD-defined COPD-severity stages (moderate, severe, very severe) for the UK and the US. As Scotland was the case country, UK values were selected for this analysis. As the utility value for the mild health state was missing, a conservative assumption was followed, by considering that this utility value would be the same as that of the moderate health state.
Depending on the severity of events, different utility reductions were considered. Using the methodology previously used in others’ health economic assessments of bronchodilators,12,26 for an exacerbation treated in community care and also for exacerbation treated in hospital or pneumonia, 15%38 and 50%39 utility reductions were applied, respectively.
Scenario and sensitivity analyses
As an approximate representation of the baseline population of the pooled analysis (Table 1), in the base case, the cohort of patients was distributed over the moderate (59%) and severe (41%) health states, and lung-function capacity by sex was estimated using predictive-risk equations. Nevertheless, an additional analysis was carried out based on the mean FEV1 of an average patient of the baseline population of the pooled analysis8 (1.37 L) to provide CE results. As mean FEV1 by sex was not available from the pooled analysis,8 recalculations were required, taking into account that 39.5% of patients were females. As a result, the new baseline FEV1 values for males and females were 1.55 L and 1.09 L, respectively. Mapping these figures against the GOLD-criteria disease-severity thresholds (Table 1) resulted in patients being categorized in the severe health state, and thus the initial cohort of the model was assumed to be 100% in this health state.
As the base-case time horizon was 5 years, additional scenarios were conducted testing 1- and 15-year time horizons. To assess the potential impact of key assumptions and overall robustness of the model, probabilistic sensitivity analysis (PSA) and one-way sensitivity analysis (OWSA) were conducted.
The OWSA allowed investigation of the impact of variation in key model-input values individually, within plausible fixed limits, on the base-case incremental CE ratio (ICER). Within the PSA, distributions were assigned to key inputs and the associated parameters sampled simultaneously. A total of 1,000 sampling iterations were conducted. In both analyses, for inputs where variability was known from the literature (eg, confidence intervals), this variability was applied directly. In the absence of such data, upper and lower bounds were calculated as fixed proportions of the mean point estimate. In the PSA, distributions were assigned based on appropriateness to the parameter in question. Distributions, parameters, and assumptions considered in both analyses are detailed in Table 2 and Table 3.
Results
The base case assumed an initial distribution of 59% and 41% within the moderate and severe health states, respectively. The estimated initial lung-function capacity (FEV1) was 1.61 L and 0.99 L for females and 2.30 L and 1.41 L for males in moderate and severe health states, respectively. Compared to aclidinium 400 µg alone, over a 5-year time horizon, aclidinium–formoterol 400/12 µg provided QALY gains of 0.014, with a cost increase of £41, resulting in an ICER of £2,976 per QALY.
In a scenario analysis, setting the cohort’s initial FEV1 to be equal to the baseline mean FEV1 of the pooled ACLIFORM–AUGMENT population,8 (equal to 1.55 L for males and 1.09 L for females), aclidinium–formoterol 400/12 µg produced a much greater incremental QALY gain than in the base case, equal to 0.119 over 5 years. Here, aclidinium–formoterol 400/12 µg was a less costly option compared to aclidinium 400 µg alone, saving £1,174. Therefore, in this scenario, aclidinium–formoterol 400/12 µg dominated aclidinium 400 µg. These substantial differences vs the base case were due to patients starting closer to the moderate/severe health-state threshold, and thus more patients moved up from the severe to the moderate health state, and the benefit from the increased efficacy (more increase in FEV1) offered by aclidinium–formoterol 400/12 µg was more pronounced.
When the time horizons were set to 1 year and 15 years, aclidinium–formoterol 400/12 µg was dominant compared to aclidinium 400 µg alone. At 1 year and 15 years, compared with aclidinium 400 µg alone, aclidinium–formoterol 400/12 µg generated greater incremental QALY gains, 0.005 and 0.046, and savings of £15 and £24, respectively. At 1 year, however, the cost of treating patients with aclidinium–formoterol 400/12 µg was higher than the comparator, while the cost of maintenance and treating exacerbations was higher for aclidinium 400 µg. This difference in results was due to the following factors. At 1 year, the acute improvement in lung-function capacity led patients in the severe health state to move to the moderate health state, and at 15 years patients in the severe health state moved later to the very severe health state in the aclidinium–formoterol 400/12 µg arm, and as such, dominance was obtained, since these patients had lower maintenance and exacerbation costs.
The OWSA showed that the five main drivers of this state-transition model were baseline FEV1 values of the severe and very severe health states, the risks of exacerbation within the moderate and severe health states, and the lung-function improvement provided by aclidinium–formoterol 400/12 µg (Figure 2). The PSA showed that compared to aclidinium 400 µg, aclidinium–formoterol 400/12 µg was dominant in 29% of cases. In 50% of cases, the ICER was between £0 and £20,000/QALY. Therefore, in a total of 79% of cases, aclidinium–formoterol 400/12 µg was cost-effective (Figure 3).
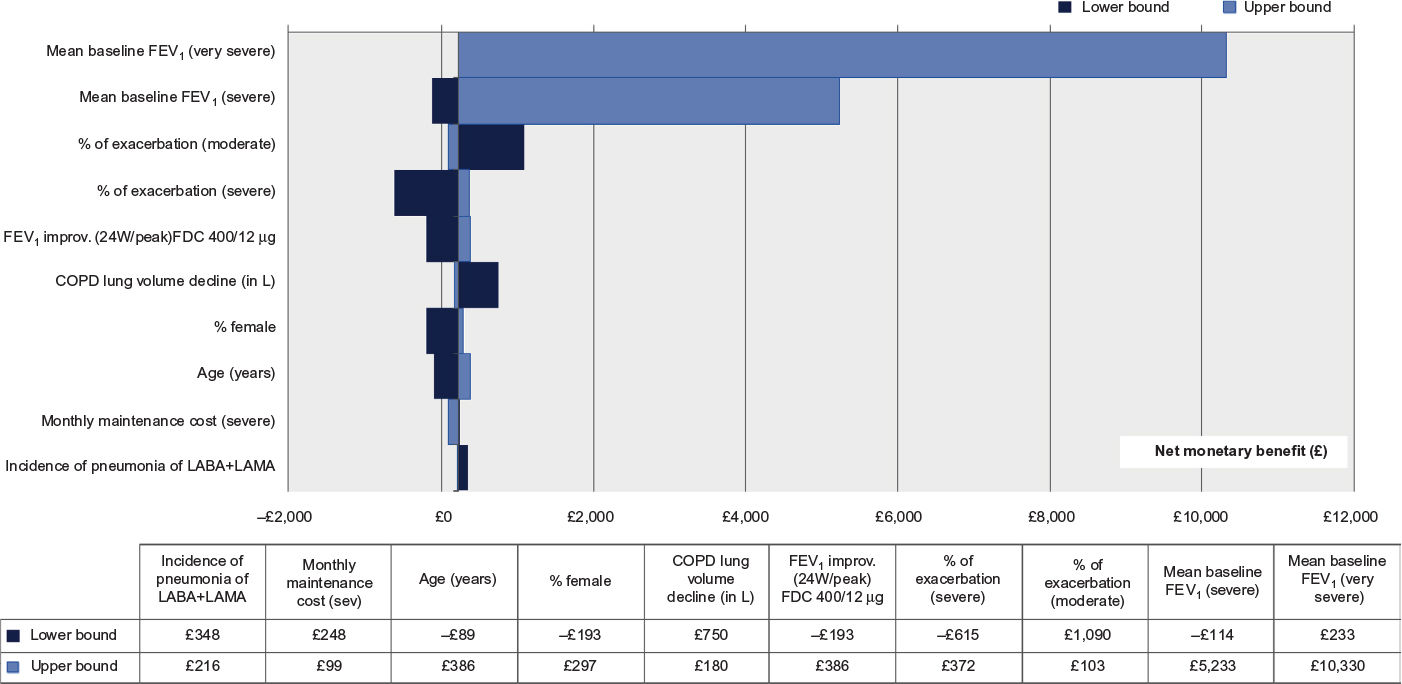 | Figure 2 Tornado diagram of top ten drivers in comparison of aclidinium–formoterol 400/12 µg and aclidinium 400 µg (based on NMB). Abbreviations: NMB, net monetary benefit; FEV1, forced expiratory volume in 1 second; LAMA, long-acting muscarinic antagonist; LABA, long-acting β2-agonist; FDC 400/12 µg, aclidinium–formoterol 400/12 µg. |
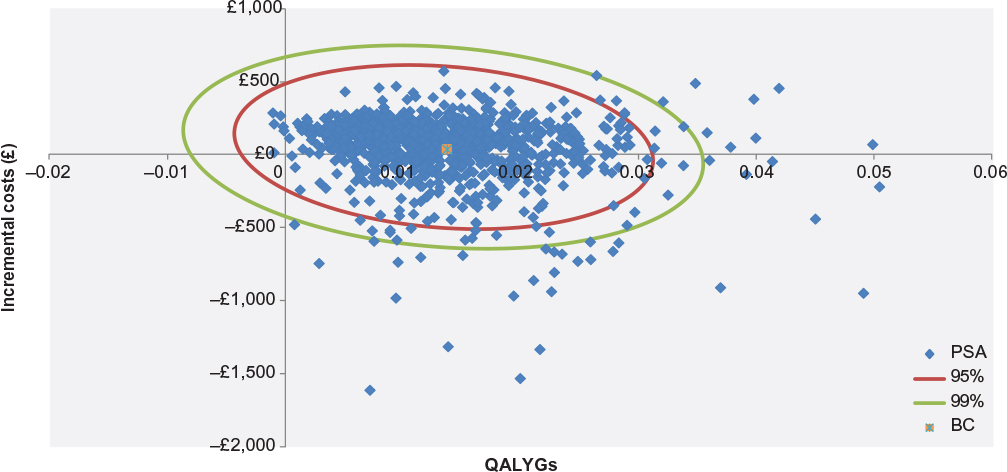 | Figure 3 Cost-effectiveness scatterplot of aclidinium–formoterol 400/12 µg versus aclidinium 400 µg. Abbreviations: PSA, probabilistic sensitivity analysis; BC, base case; QALYGs, quality-adjusted life-years gained. |
Discussion
The health economic analysis presented here provides evidence that aclidinium–formoterol 400/12 µg compared to aclidinium 400 µg is a cost-effective therapy in the management of COPD in Scotland. The results of this study showed that aclidinium–formoterol 400/12 µg was associated with marginally higher costs (£41) vs aclidinium 400 µg, but generated higher QALYs (0.014), resulting in an ICER of £2,976. This result was found to be robust following both OWSA and PSA. The main drivers of this state-transition model were mean baseline FEV1 of the severe and very severe health states, risks of exacerbation of moderate and severe health states, and lung-function improvement provided by aclidinium–formoterol 400/12 µg.
The main limitation of this health state-transition model was that the advantage of treatment alternatives only translated to benefits in the model when a patient changed health states. The real impact on quality of life may be higher than the model predicts, as lung-function improvements that did not result in changes in health state were not converted to quality-of-life improvements. The pivotal aclidinium–formoterol 400/12 µg trials also demonstrated that COPD-symptom improvements had a relevant impact on the quality of life of patients. These additional benefits were captured by improvements in the St George’s Respiratory Questionnaire and the Transition Dyspnea Index focal score.5,6 However, translation of these outcomes into utility scores (to capture additional QALYs) to be used within the analysis could be questioned by health authorities, and would introduce more uncertainty into the analysis.41 To avoid this, they were not included in the model. As a consequence, the advantages of aclidinium–formoterol 400/12 µg as a bronchodilator might not been completely accounted for within the model.
The baseline FEV1 value for patients was not available per health state in the pooled analysis8 or clinical trials,5,6 and consequently predictive equations for males and females were used. These equations included the mean age of patients in the pooled analysis and the mean UK national heights as predictors. This methodology was found to be the best available, and was implemented equally in both arms. Its impact was limited to determining the baseline FEV1 values of the initial cohort of patients.
Tashkin et al21 reported a decline in lung function of an average of 41 mL per year after bronchodilator treatment, a value lower than that found in older studies. The reasons presented by the authors for this difference were that the study design allowed for prescription of more recent respiratory therapies (including both short-acting and long-acting inhaled respiratory medications and aggressive treatment for exacerbations) than those used in older trials. Therefore, using this data may be more representative of what occurs in current practice vs older studies. This parameter was tested in sensitivity analyses to assess its uncertainty, and was found to have a minimal impact on model results.
According to good modeling-research practices,42 model simplicity is desirable for transparency and ease of validation, and at the same time it needs be able to answer the research question and to preserve face validity to clinical experts. In this context, instead of using stochastic simulation to represent patients with different severity levels within each GOLD stage, it was assumed that on average a patient in a health state had the FEV1 of the midpoint of the GOLD-criteria thresholds. A stochastic simulation would bring extra complexity to the model and reduce transparency, and was ultimately not considered necessary to explore the research question within this analysis.
Changes in treatment administered were not considered in the model, given the range of step-up therapies that would be permitted within the treatment pathway in Scotland. Additionally, switching between drugs would dilute the modeled impact of the initial interventions, and over extended time horizons a range of additional treatments are likely to be administered, bringing additional complexity to the model. To preserve simplicity within this head-to-head analysis of alternative treatments, switching was thus not considered, and the base-case analysis was limited to a time horizon of 5 years to limit the impact of omitting treatment switching from the analysis outputs. Many other COPD CE studies have adopted short time horizons and head-to-head comparisons for similar reasons, in COPD but also in hypertension.10–12,43,44 The time horizon was tested in the sensitivity analysis, for 1 and 15 years, and confirmed the CE profile of aclidinium–formoterol 400/12 µg.
According to Hoogendoorn et al,45 mortality is the most important factor determining the CE of treatments in the management of COPD. In this study, we assumed an overall mortality risk per health state and the additional risk of death due to pneumonia. This mortality risk, apart from including other causes of death, also includes death due to exacerbations, typical of COPD patients. To avoid double counting, mortality related to exacerbations was thus not included. For pneumonia, the pivotal trials were not powered to detect significant differences in the risk of pneumonia between treatments, so an equal risk of pneumonia was assumed for both treatments.
Following Rutten-van Mölken et al,37 the model assumed the same utility for mild and moderate COPD. Ideally, the analysis should include a higher utility for the mild health state. However, the base-case and scenario analyses did not include patients in the mild health state, and this assumption would not have had an impact on results.
With regard to the cost data used in this analysis, published studies and official national databases were used as sources; however, the following limitations were apparent: 1) resource consumption per health state in Scotland was assumed to be similar to the Netherlands, due to the absence of comprehensive local data; and 2) to estimate the cost of pneumonia, the codes DZ11A–DZ11C were collected, (HRG codes related to pneumonia) from the Scotland National Tariff list,36 but the distribution of patients between the HRG codes was assumed to be the same as the UK, due to a lack of data on patients’ activity by code in Scotland.
Despite the noted limitations, aclidinium–formoterol 400/12 µg was shown to be a cost-effective treatment compared to aclidinium 400 µg, with an ICER of £2,976 per QALY. Results were found to be robust to plausible variation in key parameter values, as explored within sensitivity analyses.
Author contributions
All authors made substantial contributions to all of the following: 1) the conception and design of the study, or acquisition of data, or analysis and interpretation of data; 2) drafting the article or revising it critically for important intellectual content; and 3) final approval of the version to be submitted.
Disclosure
This submission represents original work that was presented on November 9, 2015 at the International Society of Pharmacoeconomic Outcomes Research (ISPOR) European Congress (as a podium presentation), and currently it is not being considered by any other journal. This study was sponsored by AstraZeneca SA. JH received consulting fees for providing information on the treatment pathway in Scotland. MR, NH, and ML received consulting fees for developing the model and/or writing the manuscript. LL is an employee of AstraZeneca. The authors report no other conflicts of interest resulting from this work.
References
Information Services Division Scotland. Chronic obstructive pulmonary disease (COPD). 2013. Available from: http://www.isdscotland.org/Health-Topics/General-Practice/GP-Consultations/Health-Conditions/COPD. Accessed May 13, 2016. | ||
Audit Scotland. Managing Long-Term Conditions. Edinburgh: Audit Scotland; 2007. Available from: http://www.audit-scotland.gov.uk/docs/health/2007/nr_070816_managing_long_term.pdf. Accessed May 13, 2016. | ||
Global Initiative for Chronic Obstructive Lung Disease. Global Strategy for the Diagnosis, Management, and Prevention of COPD. Bethesda (MD): GOLD; 2014. | ||
van der Molen T, Miravitlles M, Kocks JW. COPD management: role of symptom assessment in routine clinical practice. Int J Chron Obstruct Pulmon Dis. 2013;8:461–471. | ||
Almirall SA. Long-term efficacy and safety of aclidinium/formoterol fixed-dose combination. Available from: https://clinicaltrials.gov/ct2/show/NCT01462942. NLM identifier: NCT01462942. Accessed May 13, 2016. | ||
Forest Laboratories. Efficacy, safety and tolerability of aclidinium bromide/formoterol fumarate compared with formoterol fumarate in patients with moderate to severe chronic obstructive pulmonary disease (COPD) (LAC). Available from: https://clinicaltrials.gov/ct2/show/NCT01437397. NLM identifier: NCT01437397. Accessed May 13, 2016. | ||
European Medicines Agency. Duaklir Genuair Assessement report. 2014. Available from: http://www.ema.europa.eu/docs/en_GB/document_library/EPAR_-_Public_assessment_report/human/003745/WC500178415.pdf. Acessed May 30, 2016. | ||
Bateman ED, Chapman KR, Singh D, et al. Aclidinium bromide and formoterol fumarate as a fixed-dose combination in COPD: pooled analysis of symptoms and exacerbations from two six-month, multicentre, randomised studies (ACLIFORM and AUGMENT). Respir Res. 2015;16:92. | ||
Gruffydd-Jones K, Jones MM. NICE guidelines for chronic obstructive pulmonary disease: implications for primary care. Br J Gen Pract. 2011;61(583):91–92. | ||
Karabis A, Mocarski M, Eijgelshoven I, Bergman G. Economic evaluation of aclidinium bromide in the management of moderate to severe COPD: an analysis over 5 years. Clinicoecon Outcomes Res. 2014;6:175–185. | ||
Samyshkin Y, Kotchie RW, Mörk AC, Briggs AH, Bateman ED. Cost-effectiveness of roflumilast as an add-on treatment to long-acting bronchodilators in the treatment of COPD associated with chronic bronchitis in the United Kingdom. Eur J Health Econ. 2014;15(1):69–82. | ||
Rutten-van Mölken MP, Oostenbrink JB, Miravitlles M, Monz BU. Modelling the 5-year cost effectiveness of tiotropium, salmeterol and ipratropium for the treatment of chronic obstructive pulmonary disease in Spain. Eur J Health Econ. 2007;8(2):123–135. | ||
Hedenström H, Malmberg P, Fridriksson HV. Reference values for lung function tests in men: regression equations with smoking variables. Ups J Med Sci. 1986;91(3):299–310. | ||
Forche G, Stadlober E, Harnoncourt K. Neue spirometrische bezugswerte für kinder, jugendliche und erwachsene [New spirometric reference values for children, adolescents and adults]. Austrian Physician Journal. 1988;43(43):40–42. German. | ||
Quanjer PH, Tammeling GJ, Cotes JE, Pedersen OF, Peslin R, Yernault JC. Lung volumes and forced ventilatory flows. Eur Respir J. 1993;6 Suppl 16:5–40. | ||
Roca J, Burgos F, Sunyer J, et al. References values for forced spirometry. Eur Respir J. 1998;11(6):1354–1362. | ||
Hankinson JL, Odencrantz JR, Fedan KB. Spirometric reference values from a sample of the general U.S. population. Am J Respir Crit Care Med. 1999;159(1):179–187. | ||
Langhammer A, Johnsen R, Gulsvik A, Holmen TL, Bjermer L. Forced spirometry reference values for Norwegian adults: the Bronchial Obstruction in Nord-Trøndelag study. Eur Respir J. 2001;18(5):770–779. | ||
Falaschetti E, Laiho J, Primatesta P, Purdon S. Prediction equations for normal and low lung function from the Health Survey for England. Eur Respir J. 2004;23(3):456–463. | ||
Health and Social Care Information Center. Health Survey for England, 2009: trend tables. Table 2: Mean height, by survey year, age, and sex. 2010. Available from: http://www.hscic.gov.uk/pubs/hse09trends. Accessed May 13, 2016. | ||
Tashkin DP, Celli B, Senn S, et al. A 4-year trial of tiotropium in chronic obstructive pulmonary disease. N Engl J Med. 2008;359(15):1543–1554. | ||
NHS Tayside. Respiratory update – COPD. Tayside Prescriber. 2014;(131). Available from: http://www.nhstaysideadtc.scot.nhs.uk/approved/bulletin/taypres/2014/Tayside%20Prescriber%20131%20-%20Respiratory%20Update%20%20COPD%20April%202014%20final.pdf. Accessed May 13, 2016. | ||
NHS Greater Glasgow and Clyde. NHS GGC primary care COPD guideline. 2013. Available from http://library.nhsggc.org.uk/mediaAssets/My%20HSD/COPD%20guidelines.pdf. Accessed May 13, 2016. | ||
NHS Forth Valley. Guideline on the management of chronic obstructive pulmonary disease: version 2. 2012. Available from: http://www.nhsforthvalley.com/__documents/qi/ce_guideline_copd/nhsfvcopdguideline.pdf. Accessed October 3, 2014. | ||
NHS Fife. COPD resource pack – section 5: Drug treatment & inhalers in stable COPD. 2013. [cited 2014 Dec]. Available from: http://publications.1fife.org.uk/weborgs/nhs/uploadfiles/publications/c64_Section5-DrugTreatmentInhalersinStableCOPD-2014.pdf. Accessed May 13, 2016. | ||
Oostenbrink JB, Rutten-van Mölken MP, Monz BU, FitzGerald JM. Probabilistic Markov model to assess the cost-effectiveness of bronchodilator therapy in COPD patients in different countries. Value Health. 2005;8(1):32–46. | ||
Casaburi R, Mahler DA, Jones PW, et al. A long-term evaluation of once-daily inhaled tiotropium in chronic obstructive pulmonary disease. Eur Respir J. 2002;19(2):217–224. | ||
Brusasco V, Hodder R, Miravitlles M, Korducki L, Towse L, Kesten S. Health outcomes following treatment for six months with once daily tiotropium compared with twice daily salmeterol in patients with COPD. Thorax. 2003;58(5):399–404. | ||
Vincken W, van Noord JA, Greefhorst AP, et al. Improved health outcomes in patients with COPD during 1 yr’s treatment with tiotropium. Eur Respir J. 2002;19(2):209–216. | ||
Miller DK, Homan SM. Determining transition probabilities: confusion and suggestions. Med Decis Making. 1994;14(1):52–58. | ||
Boutou AK, Shrikrishna D, Tanner RJ, et al. Lung function indices for predicting mortality in COPD. Eur Respir J. 2013;42(3):616–625. | ||
Royal Pharmaceutical Society. British National Formulary. London: Pharmaceutical Press; 2014. Available from: http://www.bnf.org/products/bnf-online. Accessed May 13, 2016. | ||
Personal Social Services Research Unit. Unit Costs of Health & Social Care 2013. Canterbury, UK: PSSRU; 2013. | ||
Department of Health. NHS Reference Costs 2012 to 2013. London: Department of Health; 2013. Available from: https://www.gov.uk/government/publications/nhs-reference-costs-2012-to-2013. Accessed May 13, 2016. | ||
Organisation for Economic Co-operation and Development. Statistics Directorate. Available from: http://www.oecd.org/std. Accessed May 13, 2016. | ||
ISD Scotland. Scottish National Tariff 2013/14. Edinburgh: ISD; 2013. Available from: http://www.isdscotland.org/Health-Topics/Finance/Scottish-National-Tariff. Accessed May 13, 2016. | ||
Rutten-van Mölken MP, Oostenbrink JB, Tashkin DP, Burkhart D, Monz BU. Does quality of life of COPD patients as measured by the generic EuroQol five-dimension questionnaire differentiate between COPD severity stages? Chest. 2006;130(4):1117–1128. | ||
Spencer M, Briggs AH, Grossman RF, Rance L. Development of an economic model to assess the cost effectiveness of treatment interventions for chronic obstructive pulmonary disease. Pharmacoeconomics. 2005;23(6):619–637. | ||
Paterson C, Langan CE, McKaig GA, et al. Assessing patient outcomes in acute exacerbations of chronic bronchitis: the measure your medical outcome profile (MYMOP), medical outcomes study 6-item general health survey (MOS-6A) and EuroQol (EQ-5D). Qual Life Res. 2000;9(5):521–527. | ||
Briggs A, Sculpher M, Claxton K. Decision Modelling for Health Economic Evaluation. Oxford, UK: Oxford University Press; 2006. | ||
Starkie HJ, Briggs AH, Chambers MG, Jones P. Predicting EQ-5D values using the SGRQ. Value Health. 2011;14(2):354–360. | ||
Caro JJ, Briggs A, Siebert U, Kuntz KM. Modeling good research practices – overview: a report of the ISPOR-SMDM Modeling Good Research Practices Task Force-1. Value Health. 2012;15(6):796–803. | ||
National Collaborating Centre for Chronic Conditions. Hypertension: Management in Adults in Primary Care – Pharmacological Update. London: Royal College of Physicians; 2006. Available from: http://www.ncbi.nlm.nih.gov/books/NBK45886/pdf/Bookshelf_NBK45886.pdf. Accessed May 13, 2016. | ||
Canadian Agency for Drugs and Technologies in Health. Thiazide Diuretics as First-Line Treatment for Hypertension: Meta-analysis and Economic Evaluation. Ottawa: CADTH; 2007. Available from: https://www.cadth.ca/thiazide-diuretics-first-line-treatment-hypertension-meta-analysis-and-economic-evaluation-0. Accessed May 13, 2016. | ||
Hoogendoorn M, Rutten-van Mölken M, Hoogenveen R, Maiwenn A, Feenstra T. Comparing the cost-effectiveness of a wide range of COPD interventions using a stochastic, dynamic, population model for COPD. Available from http://repub.eur.nl/pub/20172/Comparing%20the%20cost-effectiveness%20of%20a%20wide%20range%20of%20COPD.pdf. 2010. Accessed May 30, 2016. |
 © 2016 The Author(s). This work is published and licensed by Dove Medical Press Limited. The full terms of this license are available at https://www.dovepress.com/terms.php and incorporate the Creative Commons Attribution - Non Commercial (unported, v3.0) License.
By accessing the work you hereby accept the Terms. Non-commercial uses of the work are permitted without any further permission from Dove Medical Press Limited, provided the work is properly attributed. For permission for commercial use of this work, please see paragraphs 4.2 and 5 of our Terms.
© 2016 The Author(s). This work is published and licensed by Dove Medical Press Limited. The full terms of this license are available at https://www.dovepress.com/terms.php and incorporate the Creative Commons Attribution - Non Commercial (unported, v3.0) License.
By accessing the work you hereby accept the Terms. Non-commercial uses of the work are permitted without any further permission from Dove Medical Press Limited, provided the work is properly attributed. For permission for commercial use of this work, please see paragraphs 4.2 and 5 of our Terms.