")
Back to Journals » ClinicoEconomics and Outcomes Research » Volume 12
The Cost of Illness of Hypertension and Associated Factors at the University of Gondar Comprehensive Specialized Hospital Northwest Ethiopia, 2018
Authors Adane E, Atnafu A , Aschalew AY
Received 15 October 2019
Accepted for publication 26 February 2020
Published 6 March 2020 Volume 2020:12 Pages 133—140
DOI https://doi.org/10.2147/CEOR.S234674
Checked for plagiarism Yes
Review by Single anonymous peer review
Peer reviewer comments 2
Editor who approved publication: Professor Giorgio Colombo
Elsabet Adane,1 Asmamaw Atnafu,2 Andualem Yalew Aschalew2
1University of Gondar Comprehensive Specialized Hospital, Gondar, Ethiopia; 2Department of Health Systems and Policy, Institute of Public Health, College of Medicine and Health Sciences, University of Gondar, Gondar, Ethiopia
Correspondence: Andualem Yalew Aschalew P. O. Box 196, Gondar, Ethiopia
Tel +251 918151825
Email [email protected]
Purpose: Non-communicable diseases impose a significant social, economic and health burden. Hypertension, the leading contributor to the global burden of disease and a growing public health problem worldwide, is one of the most serious non-communicable diseases. In Ethiopia, empirical evidence on the economic burden of hypertension is limited. Therefore, this study aimed to measure the cost of hypertension and associated factors at the University of Gondar comprehensive specialized hospital, northwest Ethiopia.
Patients and Methods: An institution-based cross-sectional study was conducted on 442 adult hypertensive patients using a semi-structured questionnaire to estimate the direct and indirect costs of hypertension. The human capital approach was used to calculate indirect costs. A generalized linear model was fitted to identify factors associated with the cost of hypertension at a 95% confidence level and < 0.05 p-value.
Results: A total of 442, 56.3% female and 64.3% stage one hypertension patients were included. The total cost of hypertension was ETB 2510.32 ($91.72) ± 2152.80 (78.65) per patient per year; The direct medical and non-medical cost constituted 60.81% and 12.17% of the total cost of hypertension, respectively. Hospitalized (exp(b)=1.87, p< 0.001), using multidrug (exp(b)=1.32, p< 0.000), high socioeconomic status (exp(b)=1.41,p< 0.000), college and above education(exp(b)= 1.35, p< 0.016), government employment (exp(b)= 1.30, p< 0.012), retirement (exp(b)= 0.71, p< 0.001) and co-morbidity (exp(b)= 1.20, p< 0.004) were factors significantly associated with the cost of hypertension.
Conclusion: The total cost of illness of hypertension is high, and direct medical cost has the highest component of the total cost of illness. Hospitalization, using multidrug, co-morbidity, attending college and above education, highest socioeconomic status and government employment were factors significantly associated with the high cost of hypertension. Therefore, prevention and early detection of complications and co-morbidity are essential to reduce hospitalization and the number of drugs to reduce the direct medical and indirect costs.
Keywords: burden of disease, hypertension, Ethiopia
Introduction
Non-communicable diseases (NCDs) impose a large burden, and it causes disability, death, and productivity loss that affect individuals, families, and communities. The increasing incidence of NCDs will lead to greater dependency and mounting costs of care on patients and their families. Moreover, it has a huge impact on human health, economic development and growth.1 The prevalence of NCDs has shifted from high-income countries (HIC) to low and middle-income countries (LMIC), and are emerging as challenges to socioeconomic progress.2–4
Cardiovascular diseases (CVD), cancer, chronic respiratory diseases and diabetes are the four main NCDs that account for the large share of morbidity and mortality.5,6 In 2016, the estimated 71% of the 57 million deaths were due to NCDs and 44% were due to CVDs.5 Over the period 2011–2025, the cumulative lost output associated with NCD in LMIC was projected to be $7.28 trillion with $500 billion annual loss, that is, approximately 4% of the gross domestic product.7
Hypertension is the leading contributor to the global burden of disease and a growing public health problem worldwide.8 A review of current trends shows that the number of adults with hypertension increased from 594 million in 1975 to 1.13 billion in 2015; two-third of the increase was noted in low-and middle-income countries. The World Health Organization (WHO) African Region reported that the highest prevalence of hypertension (HTN) was 27%.9 There have been no studies on the nationwide prevalence of CVD and HTN in Ethiopia.10 But a systematic review of nine studies indicated a 19% prevalence of HTN.11
The increasing prevalence of hypertension is attributed to population growth, aging population and behavioral risk factors like unhealthy diet, harmful use of alcohol, lack of physical activity, excess weight and exposure to persistent stress.5,6,12 Since the main causes of HTN are preventable, we can reduce the morbidity and premature death. However, Ethiopia like many developing countries is facing the chronic diseases epidemic.13
The 2003–2014 pooled data from the United State of America (USA) indicated that the mean annual medical expenditure attributable to patients with hypertension was $9089. Compared to individuals without hypertension, individuals with the disease had $1920 higher annual expenditure. The estimated annual incremental cost is $131 billion per year higher for the hypertensive adult population compared with the non-hypertensive population.14 Loss of disability-adjusted life-years (DALYs) associated with HTN increased from 95.9 million to143.0 million.15
The fundamental goal of the cost of illness (COI) study is to evaluate the economic burden the illness imposes on individuals or society. Information about the disease COI is essential to formulate and prioritize health care policies and to allocate scarce resources efficiently. It is also important to know about medical or social costs. The COI studies traditionally stratify costs into categories, like direct, indirect, and intangible costs.16,17 Therefore, the assessment of economic costs of hypertension includes direct medical and nonmedical and indirect costs or productivity losses. Direct medical costs are spent on medical products and services used to prevent, detect, or treat a disease and its complications.18
Thus, assessing the economic impacts of CVD and HTN is often recommended to inform NCDs policymakers in LMICs.19 Existing empirical evidence in Ethiopia which mainly focuses on the prevalence of hypertension and its complication,20–23 do not provide the full picture of the impact of the disease. Complementing such evidence with economic consequences will provide a full picture of the burden of the disease.24 To date, only one study has estimated the out of pocket expenditure of hypertension patients,25 as the study failed to measure indirect costs, there has been no clear classification of direct medical and nonmedical costs.
Therefore, this study aimed to identify the cost of illness of hypertension patients and associated factors at the University of Gondar comprehensive specialized hospital. The study would also show the impact of hypertension on patients and the importance of its prevention and early treatment for policymakers.
Materials and Methods
Setting and Design
A one year (2017–2018) retrospective institution-based cross-sectional study was done at the University of Gondar comprehensive specialized hospital (UoGCSH) Chronic Illness Outpatient department from Nov to Dec 2018. The hospital serves the community in its outpatient, inpatient and emergency departments. The Chronic Illness Outpatient department delivers services for hypertension patients twice a week.
Study Participants
A total of 442 hypertensive patients or hypertension plus other chronic diseases aged over 18 years and were on follow-ups for at least one year as from 1st Nov 2017 or before were included. When the patients arrived at the clinic, their medical record cards were assessed and those who fulfilled the inclusion criteria were included. Every consecutive patient who met the criteria was selected until the required sample size was achieved. Patients who were seriously ill and with chronic diseases other than hypertension were excluded from the study.
Data Collection Instruments
A semi-structured questionnaire that contained information on socio-demographics, economic and clinical factors, as well as direct medical and non-medical and indirect costs, were used to collect retrospective data on patients who were already diagnosed with hypertension. The data were mainly collected through face-to-face interviews. Some clinical data (co-morbidities, stage of hypertension, complications, number of drugs prescribed) were collected by reviewing patients’ medical record cards based on the diagnosis and confirmations of physicians.
Data Quality Assurance
The questionnaire was prepared in the Amharic language, and a pretest was done on 10% of the sample size out of the study area before the actual data collection. To ensure the quality of data, a two-day training was given on the contents of the questionnaire and the purpose of the study to data collectors.
Data Processing and Analysis
Data were coded and entered into EPI-INFO version 7 and exported to STATA 12 software for further analysis. Descriptive statistics (means, standard deviations, medians, interquartile ranges (IQR) were calculated to determine the total and the component costs of hypertension. Having considered the non-normal distribution of total cost, generalized linear model (GLM) with gamma family and log link function was constructed to evaluate independent factors associated with total cost.26–29 To validate the distribution used in the GLM, the modified Park test was applied. Only variables that were independently associated with p-value <0.2 with total costs were included in the final GLM. Variables with p-values < 0.05 at 95% confidence level were taken as statistically significant. Principal components analysis was used to characterize the wealth status of the participants.
Measurements
The COI showed financial aspects including direct and indirect expenditures that result from disability or injury due to corresponding disease and/or its comorbidities. The COI studies traditionally stratify costs into three categories direct, indirect, and intangible costs. Since the intangible prices have rarely been quantified in COI studies, here we have a tendency to in the main concentrate on the primary two classes. First, all the resources were identified and measured in each category of costs. Then values were attached for all identified resources and finally calculated into total costs.
Direct Costs
Direct costs are the costs of medical and non-medical resources to treat the disease. Direct medical costs related to inpatient and outpatient services, such as medications, laboratory tests, hospitalizations, and rehabilitation. Direct non-medical costs were associated with what was spent on transportation.16
Indirect Cost
Indirect costs also called productivity lost, were related to loss of income associated with the loss of the working time of a person who was ill and their caregivers due to absenteeism. For those in the labor force, we used the human capital approach to calculate indirect costs. For those who were out of the labor market replacement value approach was used.30
All cost data obtained from the cost questionnaire were calculated as mean values per patient per year in the observation period. The cost currency was adjusted with international cash, the United States dollar (USD). According to the commercial bank of Ethiopia, the annual exchange rate between the USD and the Ethiopian Birr (ETB) in 2017 was USD 1.0 = ETB 27.735.31
Ethical Considerations
Ethical approval was obtained from the Ethical Review Board of the Institute of Public Health, College of Medicine and Health Science, the University of Gondar (Ref. No.: IPH/77/2018). An official permission letter was given to the Chronic Illness Outpatient department. All study participants were oriented on the objectives and purpose of the study. Written informed consent was obtained from each participant. Patients at health facility and sick individuals were informed that participation had no impact on the provision of their health care. Study team members safeguarded the confidentiality and anonymity of study participants throughout the entire study. Participation in the study was voluntary and individuals were free to withdraw or stop the interview at any time. This study was conducted in accordance with the Declaration of Helsinki.
Results
Sociodemographic and Economic Characteristics
A total of 442 hypertensive patients participated in the study with a response rate of 100%. The majority (62.2%), of the participants were 45–64 years of age. Participants who had no formal education and college and above graduates were 191 (43.3%) and 81 (18.3%), respectively. Most, 276 (62.4%), of the participants were private workers. The lowest and highest SES were 147 (33.3%) and 147 (33.3%), correspondingly. The overall characteristics of the participants are reported in Table 1.
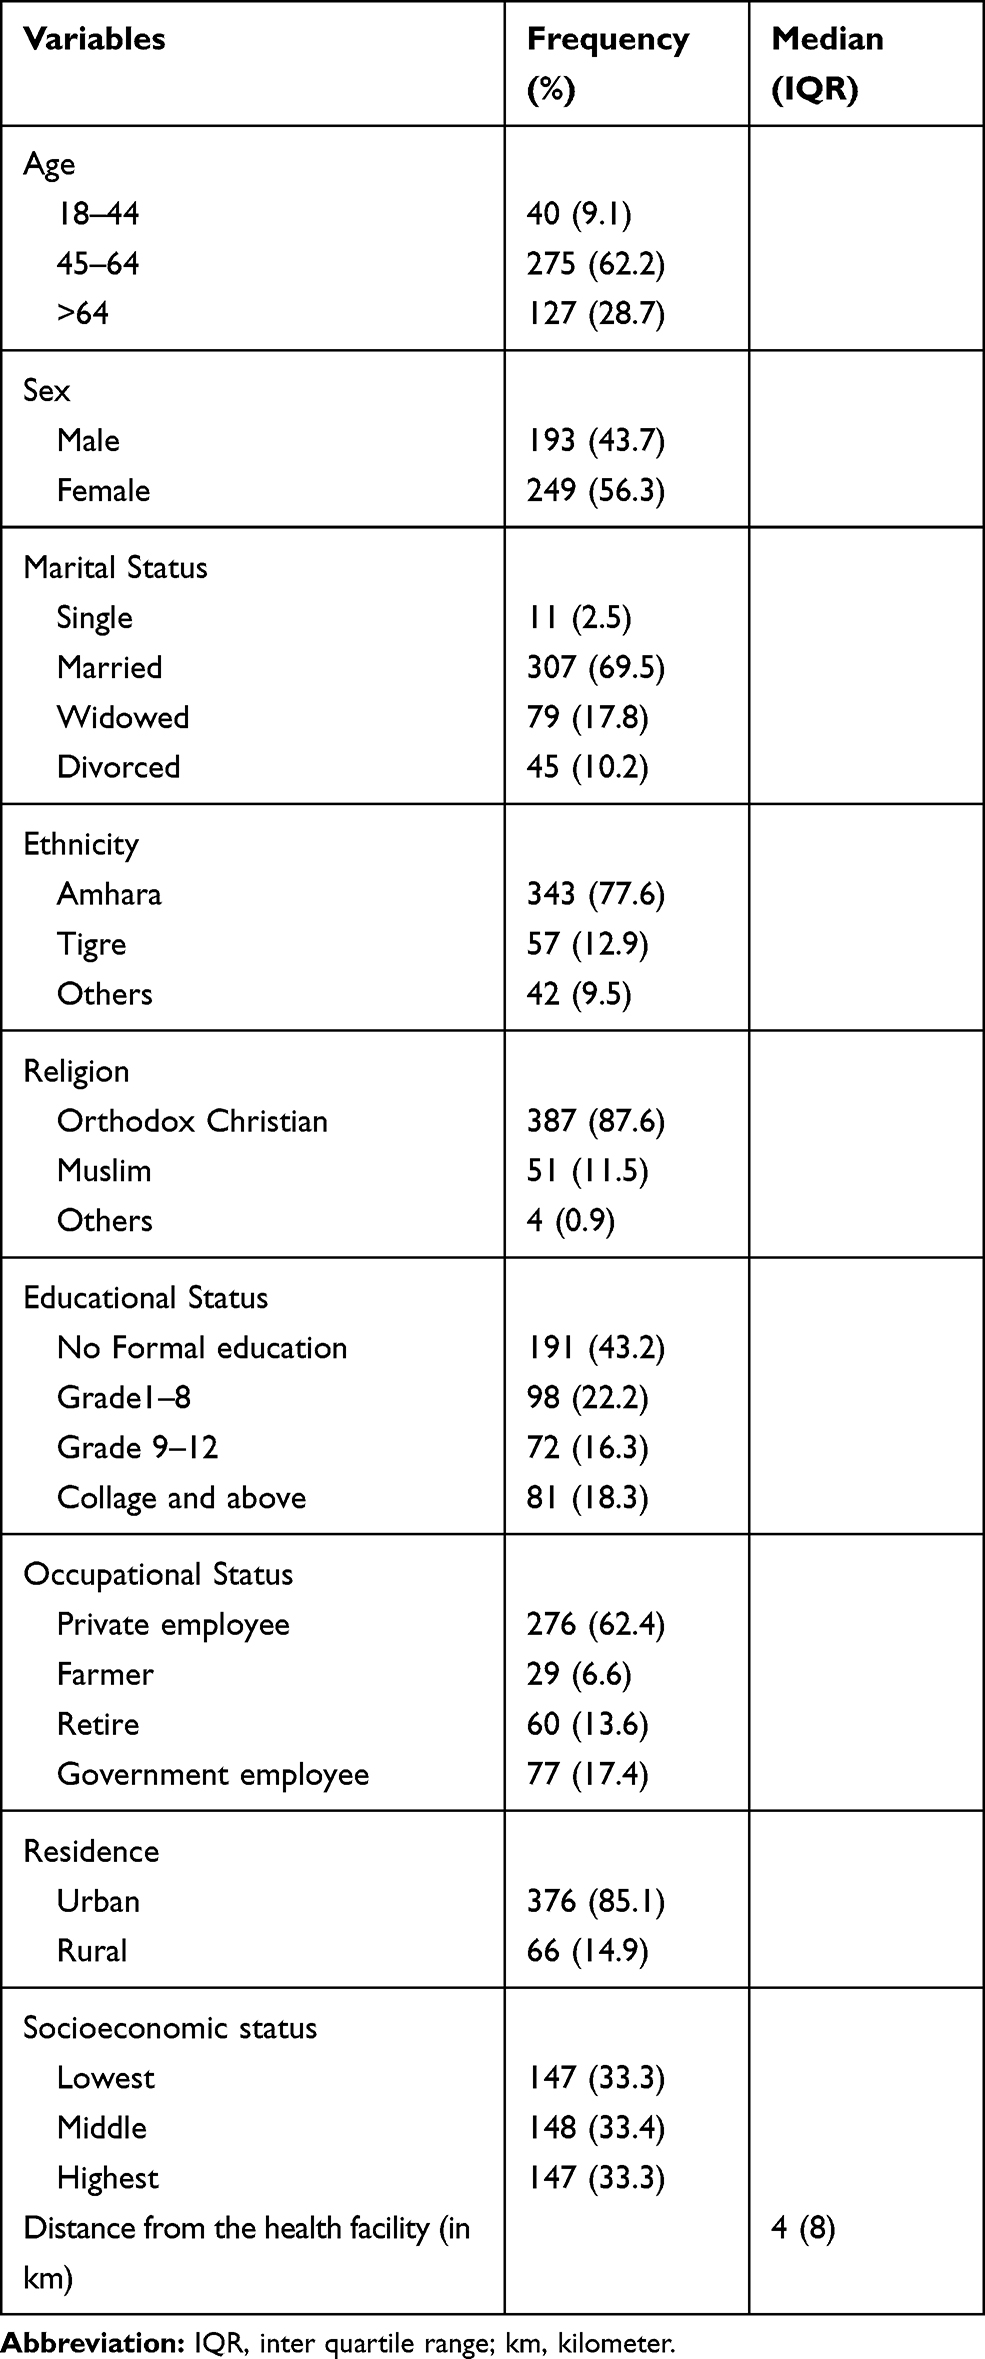 |
Table 1 Sociodemographic and Economic Characteristics of Participants at UoGCSH 2018 (n=442) |
Clinical Characteristics
The median (IQRs) duration of the disease was 4 (5) years. Most, 284 (64.3%), of the participants were in stage one hypertension, while complications and comorbid diseases were detected in 175 (39.6%) and 215 (48.6%), respectively (Table 2).
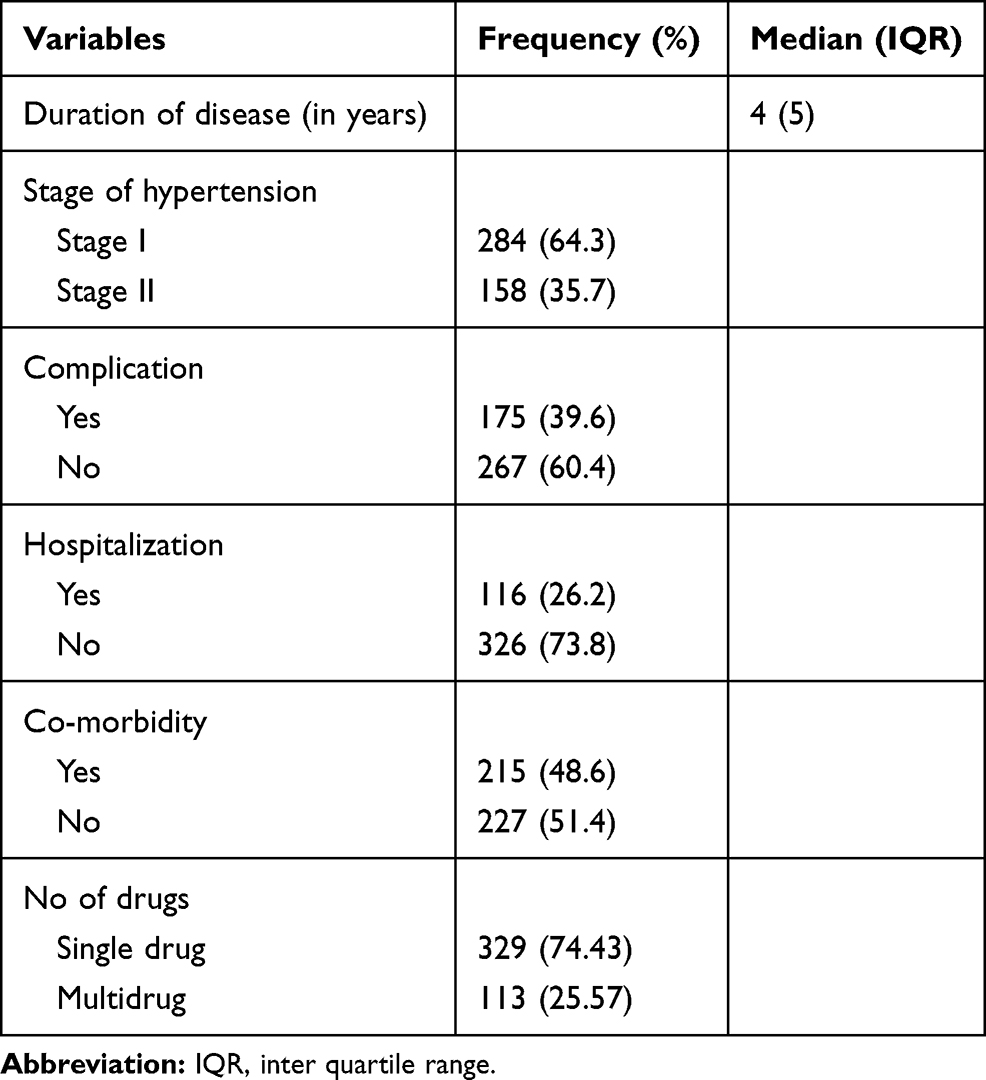 |
Table 2 Clinical Characteristics of Participants at UoGCSH 2018 (n=442) |
Cost of Hypertension
The overall annual mean cost of hypertension was ETB 2510.32 ($91.72) ± 2152.80 (78.65). The direct medical and nonmedical components of the cost of hypertension were 61.81% and 12.17%, respectively. The overall cost components is reported in Table 3.
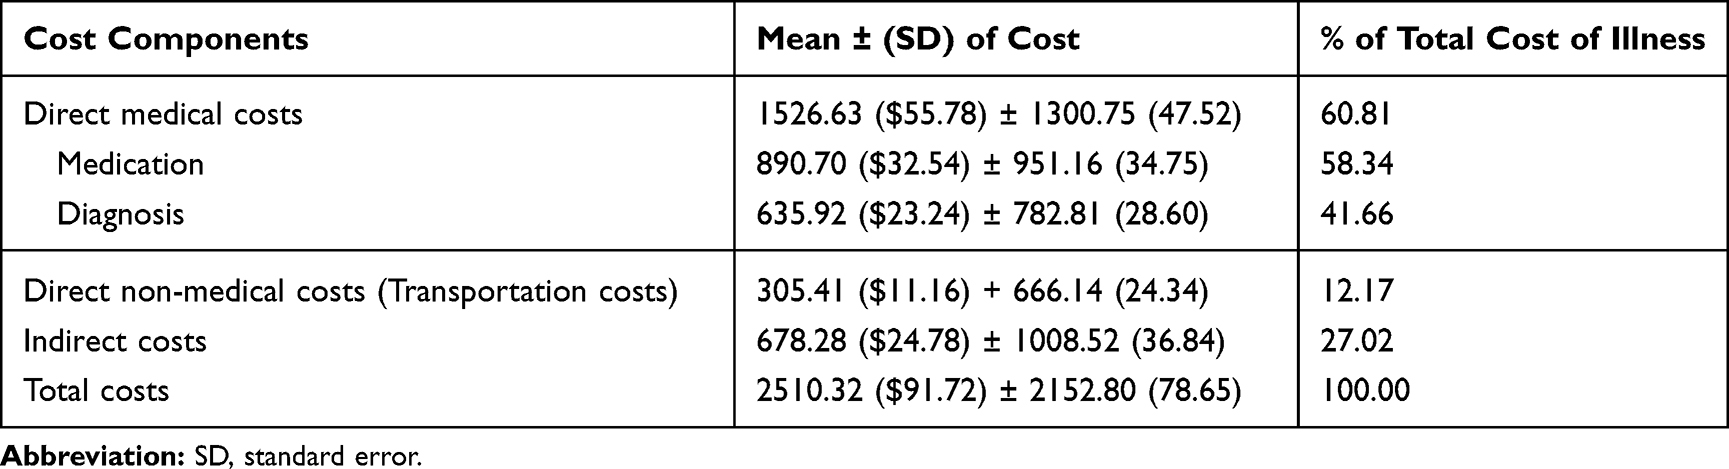 |
Table 3 Annual Mean Costs of Illness of Hypertension ETB (US$) at UoGCSH 2018 |
Factors Associated with the Cost of Hypertension
GLM was fitted to identify factors that had associations with the overall annual mean cost of hypertension. The modified Park test result showed that the overall annual mean cost of hypertension was within the gamma distribution (coefficient 2.09, p-value = 0.000). Sociodemographic and clinical variables independently associated with the costs of hypertension illness at p< 0.05 included education, occupation, SES, hospitalization, co-morbidity and the number of drugs. Table 4 displays the results of the GLM analysis for the annual cost of the illness of hypertension patients. Our analysis found that hospitalization (exp(b)=1.87, p<0.001), multidrug (exp(b)=1.32, p<0.000), highest SES (exp(b)=1.41,p<0.000), college and above education (exp(b)= 1.35, p<0.016), government employment (exp(b)= 1.30, p<0.012) and co-morbidity (exp(b)= 1.20,p<0.004) had a significant association with higher cost, whilst retirement (exp(b)= 0.71, p< 0.001) had a significant association with lower cost. Sex, age and complications did not have a significant impact on total cost in the GLM analysis (Table 4).
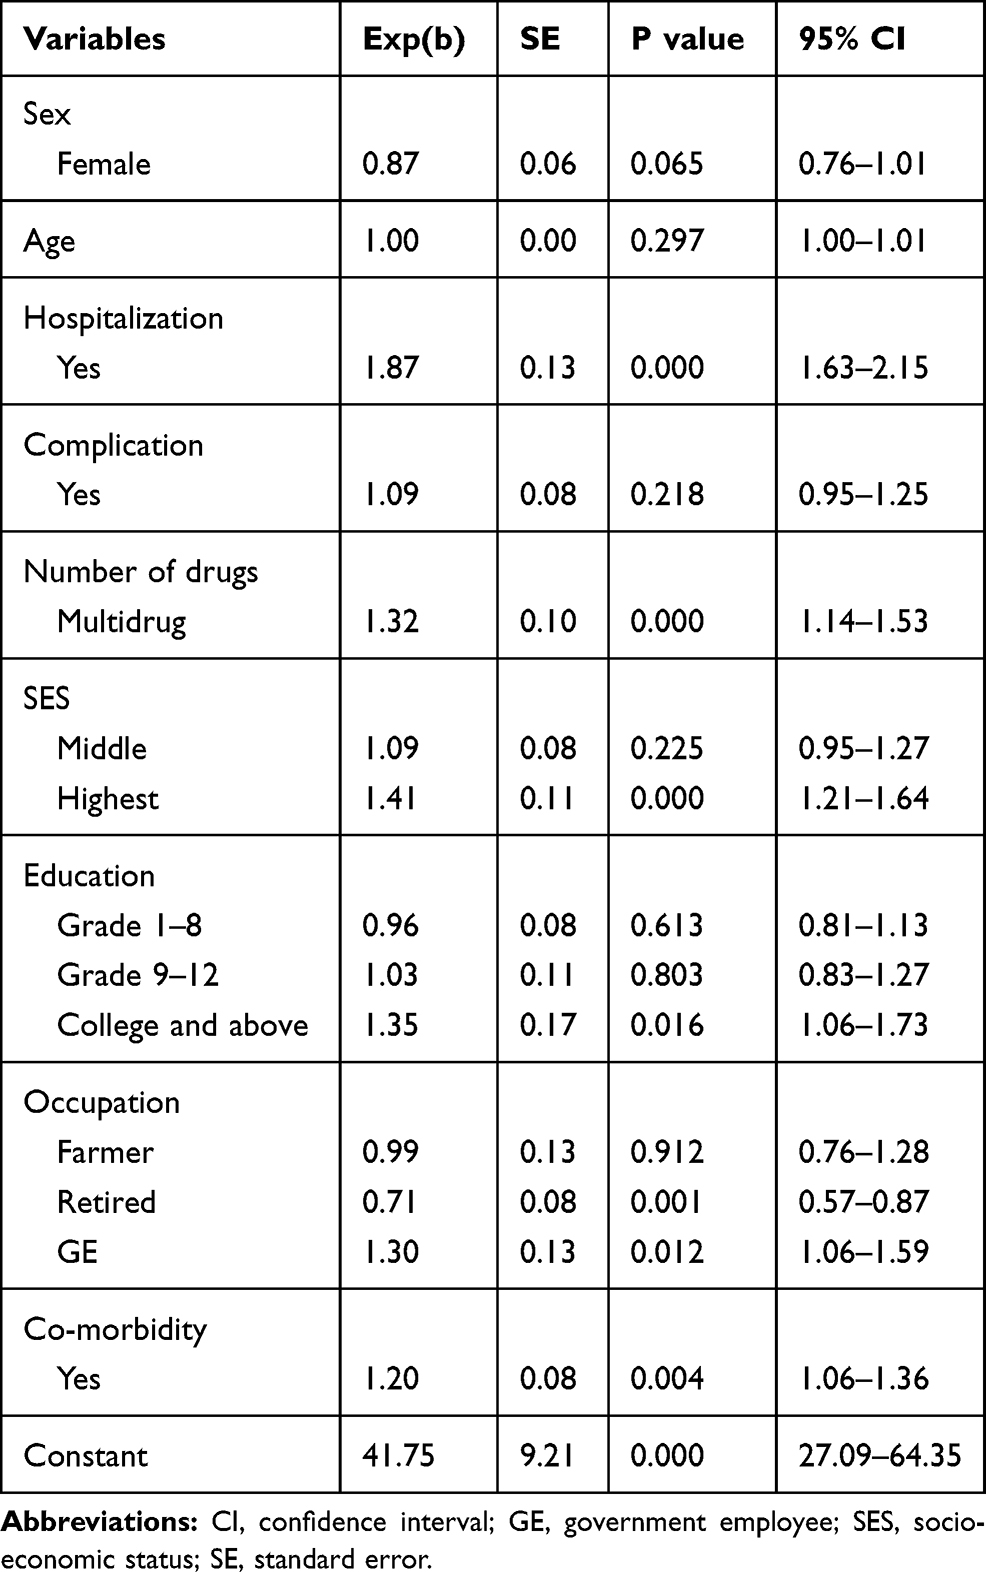 |
Table 4 Generalized Linear Model Analysis to Identify Factors Associated with Annual Mean Costs of Illness of Hypertension |
Discussion
A retrospective prevalence-based cost of illness study was carried out on patients with hypertension. The study revealed that the cost of the disease was ETB 2510.32 ($91.72) per patient per year; education, occupation, SES, hospitalization, co-morbidity and number of drugs had a significant association with the total cost of illness.
A study on the cost of illness is important to examine the burden of the disease on the patient or society. However, comparing the costs of illness reported by various studies is difficult across countries because of the difference in currency and exchange rates. However, considering the percentage contributions of the various components of the cost of illness might provide a better way for comparison.
The present study is the first to estimate both the direct and indirect costs associated with hypertension in Ethiopia. In the study, the total cost of illness was ETB 2510.32 ($91.72) per patient per year. To contextualize the national data, this finding is higher than the national per capita health expenditure report ($33.22) in 2017/18.32 The direct medical cost comprised the largest (60.81%) component of the total cost of illness. This is in line with a study in China.33 The percentage of drug cost was higher. Previous studies also revealed that the contribution of drug expense to the direct medical cost was high.34,35 This might indicate that the patients were on medication, and 48.6% of the hypertensive patients sampled had other co-morbidities. Moreover, hypertension is a chronic disease that needs a lifelong treatment that forces patients to spend their money on drugs on a regular basis. The direct non-medical cost/transportation expense was the lowest (12.17%) of the total cost component. In this study, the majority (85.1%) of the participants came from urban areas, and the median distance from a health facility was 4km. This means, the health facility was easily accessible to clients who did not need to expend a great deal on transportation. The study from Nigeria revealed that geographical accessibility of a health facility lowers transportation costs.36 Additionally, completions of follow up visits in a day help them to avoid extra spending on accommodation. Indirect cost, also called productivity lost was the second highest (27%) cost component of the total cost of illness.
Compared to non-hospitalized patients, hospitalized ones had to spend 1.87 times the mean annual total cost of illness. This was supported by other studies in India and Canada.37 Of the hospitalized patients, 58.6% had complications that needed more diagnoses, drugs and procedures that increased the cost of illness. Co-morbidities and multidrug significantly increased the cost of illness. For example, patients who had co-morbidities spent ETB 2917.11 ($ 106.57), while those who had no similar problems expended only ETB 2125.03. Multidrug users also spent ETB 3444.55 ($125.85), whereas single drug users had to pay only ETB 2189.44 ($79.99) annually. Other studies are in line with ours.38,39 College and above educational level was associated with a higher cost of illness. A study in USA also supports this finding.14 A possible explanation for this finding is that more educated people may have better information about diseases, understand the benefits of specialist care and adhere to treatment regimen. These further increases health care utilization and expenditure. Government employees had a higher cost of illness than the privately employed, perhaps because most of the time government-employees are a full-time worker with regular incomes which enable them to cover their follow up costs, whereas, retired patients have lower cost of illness compared to private employed. Retired patients are less productive and earn less income which reduces their expenditure on the disease. Patients in the highest SES had higher costs of illness than those who belong to the lowest SES. This might be because differences in wealth status lead to varying levels of health care utilization. Those who belong to the highest SES have a better capacity to pay for health care services, expensive drugs and diagnosis modalities. This view is supported by a study in Nigeria which reported that people in the highest SES spent more than those in the lower SES.36 The total cost of illness increase as we move from the lowest SES to the highest SES.40,41
Limitation
Having been retrospective, our work could not be free from recall bias. Besides, intangible costs were not estimated. On top of that, as the study has focused on a specific institution, it may be difficult to generalize the findings.
Conclusion
The present study provides a general estimation of the direct and indirect costs of illness among hypertension patients. The total cost of illness of hypertension is high compared to the national per capita health expenditure. Direct medical cost is the highest component of the total cost of illness. Hospitalization, multiple drugs, co-morbidity, college and above education, highest SES and government employment had a significant association with high cost of hypertension. This study tried to show the economic burden on hypertension patients and communities. Prevention and early detection of complications and co-morbidities are essential to reduce hospitalization and the number of drugs to cut the direct medical and indirect costs. Therefore, emphasis should be given to prevent the development of complications that leads to hospitalization of patients. Moreover, as hypertension is a preventable disease, we can avoid these burdens on individuals by adopting an appropriate lifestyle.
Data Sharing Statement
Data reported in this manuscript are available from the corresponding author on reasonable request.
Acknowledgments
The authors would like to thank data collectors. The authors would also like to thank the study participants for participating in the study.
Author Contributions
All authors contributed to data analysis, drafting or revising the article, gave final approval of the version to be published, and agree to be accountable for all aspects of the work.
Disclosure
The authors report no conflicts of interest in this work.
References
1. Bloom DE, Cafiero E, Jané-llopis E, et al. The Global Economic Burden of Noncommunicable Diseases. Program on the Global Demography of Aging; 2012.
2. Salem H, Hasan DM, Eameash A, El-mageed HA, Hasan S, Ali R. Worldwide prevalence of hypertension: a pooled meta-analysis of 1670 studies in 71 countries with 29.5 million participants. J Am Coll Cardiol. 2018;71(11 Supplement):A1819. doi:10.1016/S0735-1097(18)32360-X
3. Di Cesare M, Khang Y-H, Asaria P, et al. Inequalities in non-communicable diseases and effective responses. Lancet. 2013;381(9866):585–597. doi:10.1016/S0140-6736(12)61851-0
4. Organization WH, Canada PHAo, Canada CPHAo. Preventing Chronic Diseases: A Vital Investment. World Health Organization; 2005.
5. World Health Organization. Noncommunicable diseases country profiles 2018. 2018. Available from: https://apps.who.int/iris/handle/10665/274512.
6. Boutayeb A. The double burden of communicable and non-communicable diseases in developing countries. Trans R Soc Trop Med Hyg. 2006;100(3):191–199. doi:10.1016/j.trstmh.2005.07.021
7. Organization WH. World Economic Forum. (2011) from Burden to “Best Buys”: Reducing the Economic Impact of Non-Communicable Diseases in Low-And Middle-Income Countries. Geneva: WEF; 2011.
8. Wang G, Grosse SD, Schooley MW. Conducting research on the economics of hypertension to improve cardiovascular health. Am J Prev Med. 2017;53(6):S115–S117. doi:10.1016/j.amepre.2017.08.005
9. Zhou B, Bentham J, Di Cesare M, et al. Worldwide trends in blood pressure from 1975 to 2015: a pooled analysis of 1479 population-based measurement studies with 19· 1 million participants. Lancet. 2017;389(10064):37–55. doi:10.1016/S0140-6736(16)31919-5
10. Federal Democratic Republic of Ethiopia Ministry of Health. National Strategic Action Plan (NSAP) for Prevention & Control of Non-Communicable Diseases in Ethiopia; 2014-2016.
11. Kibret KT, Mesfin YM. Prevalence of hypertension in Ethiopia: a systematic meta-analysis. Public Health Rev. 2015;36(1):14. doi:10.1186/s40985-015-0014-z
12. World Health Organization. A Global Brief on Hypertension: Silent Killer, Global Public Health Crisis: World Health Day 2013. World Health Organization; 2013.
13. Ethiopian Public Health Association (EPHA). Emerging Public Health Problems in Ethiopia: Chronic Non-Communicable Diseases. 2012.
14. Kirkland EB, Heincelman M, Bishu KG, et al. Trends in healthcare expenditures among US adults with hypertension: national estimates, 2003–2014. J Am Heart Assoc. 2018;7(11):e008731. doi:10.1161/JAHA.118.008731
15. Forouzanfar MH, Liu P, Roth GA, et al. Global burden of hypertension and systolic blood pressure of at least 110 to 115 mm Hg, 1990-2015. JAMA. 2017;317(2):165–182. doi:10.1001/jama.2016.19043
16. Jo C. Cost-of-illness studies: concepts, scopes, and methods. Clin Mol Hepatol. 2014;20(4):327. doi:10.3350/cmh.2014.20.4.327
17. Igberaese FI, Iseghohi J. Burden of disease calculation, cost of illness analysis and demand for death: a theoretical review. Int J Dev Manage Rev. 2017;12(1):32–44.
18. Eisenberg JM. Clinical economics: a guide to the economic analysis of clinical practices. JAMA. 1989;262(20):2879–2886. doi:10.1001/jama.1989.03430200123038
19. Gheorghe A, Griffiths U, Murphy A, Legido-quigley H, Lamptey P, Perel P. The economic burden of cardiovascular disease and hypertension in low-and middle-income countries: a systematic review. BMC Public Health. 2018;18(1):975. doi:10.1186/s12889-018-5806-x
20. Awoke A, Awoke T, Alemu S, Megabiaw B. Prevalence and associated factors of hypertension among adults in Gondar, Northwest Ethiopia: a community based cross-sectional study. BMC Cardiovasc Disord. 2012;12(1):113. doi:10.1186/1471-2261-12-113
21. Bonsa F, Gudina EK, Hajito KW. Prevalence of hypertension and associated factors in Bedele Town, Southwest Ethiopia. Ethiop J Health Sci. 2014;24(1):21–26. doi:10.4314/ejhs.v24i1.3
22. Gudina EK, Michael Y, Assegid S. Prevalence of hypertension and its risk factors in southwest Ethiopia: a hospital-based cross-sectional survey. Integr Blood Press Control. 2013;6:111. doi:10.2147/IBPC.S47298
23. Helelo TP, Gelaw YA, Adane AA. Prevalence and associated factors of hypertension among adults in Durame Town, Southern Ethiopia. PLoS One. 2014;9(11):e112790. doi:10.1371/journal.pone.0112790
24. Organization WH. WHO Guide to Identifying the Economic Consequences of Disease and Injury. Geneva: WHO; 2009. Available from: http://wwwwhoint/choice/publications/discussion_papers/en/index.html.
25. Bedane S. Out of pocket expenditures among hypertensive patients and their households who visit public hospitals in Addis Ababa, Ethiopia, 2016. Health Econ Outcome Res Open Access. 2018;4(147):2. doi:10.4172/2471-268X.1000147
26. Malehi AS, Pourmotahari F, Angali KA. Statistical models for the analysis of skewed healthcare cost data: a simulation study. Health Econ Rev. 2015;5(1):11. doi:10.1186/s13561-015-0045-7
27. Gregori D, Petrinco M, Bo S, Desideri A, Merletti F, Pagano E. Regression models for analyzing costs and their determinants in health care: an introductory review. Int J Qual Health Care. 2011;23(3):331–341. doi:10.1093/intqhc/mzr010
28. Blough DK, Ramsey SD. Using generalized linear models to assess medical care costs. Health Serv Outcomes Res Methodol. 2000;1(2):185–202. doi:10.1023/A:1012597123667
29. Ni W, Colayco D, Hashimoto J, et al. Reduction of healthcare costs through a transitions-of-care program. Bull Am Soc Hosp Pharm. 2018;75(10):613–621.
30. Tarricone R. Cost-of-illness analysis: what room in health economics? Health Policy. 2006;77(1):51–63. doi:10.1016/j.healthpol.2005.07.016
31. Comercial Bank of Ethiopia. Comercial bank of Ethiopia exchange rate. 2017. Available from: https://www.combanketh.et/More/CurrencyRate.aspx.
32. Minstry of Health. 2019. Available from: http://www.moh.gov.et/ejcc/am/node/130.
33. Le C, Zhankun S, Jun D, Keying Z. The economic burden of hypertension in rural south‐west China. Trop Med Int Health. 2012;17(12):1544–1551. doi:10.1111/tmi.2012.17.issue-12
34. Thakare BS, Adhav A, Kadam S. Economic burden of hypertension care on households of Malwani slum of Mumbai: a cross-sectional study. Int J Res Med Sci. 2015;3(9):2376. doi:10.18203/2320-6012.
35. Al-efan QMA. Cost of treating hypertension in Malaysia. Asian J Pharm Clin Res. 2009;2(1):1–5.
36. Janssens W, Goedecke J, De Bree GJ, Aderibigbe SA, Akande TM, Mesnard A. The financial burden of non-communicable chronic diseases in rural Nigeria: wealth and gender heterogeneity in health care utilization and health expenditures. PLoS One. 2016;11(11):e0166121. doi:10.1371/journal.pone.0166121
37. Biswas A, Singh RK, Singh S. Medical and non-medical cost of hypertension and heart diseases in India. Cogent Soc Sci. 2016;2(1):1250616. doi:10.1080/23311886.2016.1250616
38. Kar SS, Kalidoss VK, Vasudevan U, Goenka S. Cost of care for hypertension in a selected health center of urban Puducherry: an exploratory cost-of-illness study. Int J Noncommun Dis. 2018;3(3):98. doi:10.4103/jncd.jncd_49_17
39. Mutowo MP, Lorgelly PK, Laxy M, Renzaho A, Mangwiro JC, Owen AJ. The hospitalization costs of diabetes and hypertension complications in Zimbabwe: estimations and correlations. J Diabetes Res. 2016;2016. doi:10.1155/2016/9754230
40. Onwujekwe O, Uzochukwu B. Socio-economic and geographic differentials in costs and payment strategies for primary healthcare services in Southeast Nigeria. Health Policy. 2005;71(3):383–397. doi:10.1016/j.healthpol.2004.06.006
41. Kapur K, Rogowski JA, Freedman VA, Adams JL, Escarce JJ. Socioeconomic Status and Medical Care Expenditures in Medicare Managed Care. National Bureau of Economic Research; 2004.
 © 2020 The Author(s). This work is published and licensed by Dove Medical Press Limited. The full terms of this license are available at https://www.dovepress.com/terms.php and incorporate the Creative Commons Attribution - Non Commercial (unported, v3.0) License.
By accessing the work you hereby accept the Terms. Non-commercial uses of the work are permitted without any further permission from Dove Medical Press Limited, provided the work is properly attributed. For permission for commercial use of this work, please see paragraphs 4.2 and 5 of our Terms.
© 2020 The Author(s). This work is published and licensed by Dove Medical Press Limited. The full terms of this license are available at https://www.dovepress.com/terms.php and incorporate the Creative Commons Attribution - Non Commercial (unported, v3.0) License.
By accessing the work you hereby accept the Terms. Non-commercial uses of the work are permitted without any further permission from Dove Medical Press Limited, provided the work is properly attributed. For permission for commercial use of this work, please see paragraphs 4.2 and 5 of our Terms.