")
Back to Journals » Journal of Inflammation Research » Volume 15
The Complement and Coagulation Cascades Pathway is Associated with Acute Necrotizing Pancreatitis by Genomics and Proteomics Analysis
Authors Zhang X , Li Z , Liu W , Du J , Liu Y , Yu N , Liu C , Zeng M , Zhang XM
Received 3 December 2021
Accepted for publication 29 March 2022
Published 13 April 2022 Volume 2022:15 Pages 2349—2363
DOI https://doi.org/10.2147/JIR.S351416
Checked for plagiarism Yes
Review by Single anonymous peer review
Peer reviewer comments 3
Editor who approved publication: Dr Monika Sharma
Xinyu Zhang,1,* Zenghui Li,1,* Wei Liu,1 Juanjuan Du,1 Yun Liu,2 Ningjun Yu,1 Chao Liu,1 Mei Zeng,3 Xiaoming Zhang1
1Medical Imaging Key Laboratory of Sichuan Province and Department of Radiology, Affiliated Hospital of North Sichuan Medical College, Nanchong, Sichuan, 637000, People’s Republic of China; 2Department of Forensic Medicine, North Sichuan Medical College, Nanchong, Sichuan, 637000, People’s Republic of China; 3Institute of Rheumatology and Immunology, Affiliated Hospital of North Sichuan Medical College, Nanchong, Sichuan, 637000, People’s Republic of China
*These authors contributed equally to this work
Correspondence: Xiaoming Zhang, Medical Imaging Key Laboratory of Sichuan Province and Department of Radiology, Affiliated Hospital of North Sichuan Medical College, No.1 South Maoyuan Road, Nanchong, Sichuan, 637000, People’s Republic of China, Tel +86 13808271001, Email [email protected] Mei Zeng, Institute of Rheumatology and Immunology, Affiliated Hospital of North Sichuan Medical College, 63 # Wenhua Road, Nanchong, Sichuan, 637000, People’s Republic of China, Tel +86 13990807850, Email [email protected]
Purpose: Acute pancreatitis can be classified histologically as interstitial edema pancreatitis (IEP) or as acute necrotizing pancreatitis (ANP). ANP has a higher mortality and long-term or short-term sequelae than IEP. Therefore, this work aims to explore the differences in pathogenesis between ANP and IEP and it has great clinical importance for the treatment and prevention of ANP.
Methods: In this work, whole blood samples from IEP and ANP patients were analyzed by whole gene sequencing (WGS). Serum samples from IEP and ANP patients were evaluated via enzyme-linked immunosorbent assay (ELISA). Meanwhile, pancreatic tissues of IEP and ANP rat models were subjected to data independent acquisition (DIA) proteomics assays. Then, the WGS analysis and DIA proteomics assay data were analyzed comprehensively.
Results: Six pathways were found to be significantly different in the ANP/IEP groups through WGS analysis. DIA proteomics found eleven different pathways. In both assays, the complement and coagulation cascades pathway was the most significantly different (p < 0.01) pathway between the two groups. WGS analysis showed base mutations in ten genes in the complement and coagulation cascades pathway. These results were consistent with the ten proteins detected by DIA proteomics analysis, which were significantly upregulated in the ANP/IEP groups. In addition, five of these proteins, complement C3, complement Factor I, alpha-2-macroglobulin, complement C9, and serpin family C member 1, were successfully verified by parallel reaction monitoring analysis and ELISA.
Conclusion: C3, CFI, A2m, C9, and Serpinc1, which belong to complement and coagulation cascades pathway, may promote pancreatic necrosis and aggravate the severity of ANP.
Keywords: acute necrotizing pancreatitis, complement and coagulation cascades pathway, data independent acquisition proteomics, interstitial edema pancreatitis, whole gene sequencing genomics
Introduction
Acute pancreatitis (AP) is a prevalent and possibly fatal gastrointestinal disease. The incidence rate is rising.1 According to histology, AP is classified into acute necrotizing pancreatitis (ANP) and interstitial edema pancreatitis (IEP). Necrosis of pancreatic parenchyma and/or peripancreatic tissue may occur in about 10–20% of AP cases, which can exacerbate the severity of AP. About 45% of ANP patients will develop organ failure, leading to prolonged intensive care unit admission and a complex course of disease, most often requiring multiple invasive interventions.2 ANP has a mortality rate of approximately 15%, the necrotic pancreatic (peripancreatic) tissue is susceptible to infection.3 Mortality can be as high as 30% if infection develops in necrotic collection.3 Previous studies have also confirmed that the mortality, length of intensive care unit admission, morbidity of complications and need for invasive intervention of ANP are significantly higher than those of IEP under the same conditions.2,4,5 Therefore, ANP will lead to a large use of medical resources and an increase in costs.
However, due to the incomplete understanding of the pathogenesis of ANP, there is still a lack of specific medicine for the treatment of ANP, and the treatment method and timing of infectious ANP are not clear enough.6 If we can further understand the pathogenesis of ANP, it may be helpful for clinical intervention in advance to prevent the occurrence of pancreatic necrosis. Therefore, the study of the pathogenesis of ANP has great clinical importance. Previous reports have suggested that AP may be associated with genetic variation.7–9 It has also been reported that only a portion of patients exposed to AP risk factors develop AP, and only a small number of AP patients develop more severe AP with necrosis or organ failure.10 This suggests that genetic mutations may regulate the occurrence of necrosis in AP. However, we have not found reports about the difference between IEP and ANP in genomics.
As a result, the purpose of this paper is to explore the differences in pathogenesis between ANP and IEP through genomics and proteomics, which may guide the development of specific drugs to treat ANP and clinical treatment of ANP.
Materials and Methods
Patients
This research was authorized by the Ethical Committees of the Affiliated Hospital of North Sichuan Medical College. Written informed consent was obtained from all patients and all procedures involving humans maintained adherence to the Declaration of Helsinki.
ANP patients hospitalized in the hospital from November 2016 to August 2017 were consecutively recruited. The diagnosis of AP needs to meet at least two of the following three criteria: (1) meet the abdominal pain characteristics of AP, such as severe, acute and persistent upper abdominal pain radiating into the back; (2) imaging findings were consistent with AP; (3) serum amylase or lipase activity was more than 3 times higher than the normal upper limit. Patients enrolled must undergo abdominal contrast-enhanced magnetic resonance (CEMR)/contrast-enhanced computed tomography (CECT) examination and with relevant laboratory data, medical records within 3 days of admission. The exclusion criteria were as follows: (1) acute attack of chronic pancreatitis; (2) AP due to pancreatic tumor; (3) complicated with cancer, severe chronic wasting diseases; (4) AP patients with a family history of genetic disease (hemophilia, inherited heart disease, etc.) or congenital anatomic abnormalities of the pancreas, such as pancreatic divisum; and (5) unsatisfactory images or incomplete medical records. The flowchart of ANP patients is shown in Figure 1. IEP patients who matched with age and sex of ANP patients during the same period were recruited, and the exclusion and inclusion criteria are the same as ANP patients’ criteria. Diagnosis of IEP and ANP by CECT/CEMRI. The main imaging findings of ANP were local or diffuse hypo-density (hypointensity) non-enhanced areas of pancreas parenchyma and/or heterogeneous density (signal intensity) of peripancreatic fluid collection on CT/MRI. However, IEP showed local or diffuse enlargement of pancreas parenchyma, blurred peripancreatic fat space, and homogeneous enhancement of pancreas parenchyma on CT/MRI.11 The information of sex, age, etiology, length of hospital stay, C-reactive protein (CRP), serum amylase and lipase of patients was collected. The diagnostic criteria for different etiologies of AP were shown in Supplemental Methods and Materials. Other clinical characteristics, including computed tomography severity index (CTSI)/magnetic resonance severity index (MRSI) score, severity based on the 2012 revised Atlanta Classification (RAC), Acute Physiology and Chronic Health Evaluation (APACHE)-II score, extra-pancreatic inflammation on CT (EPIC) score, systemic inflammatory response syndrome (SIRS) score, bedside index of severity in acute pancreatitis (BISAP) score were calculated within 3 days of admission. Blood samples of the two groups were collected by professionals from the patients who were recruited to participate in the experiment within 3 days after admission and stored at −80°C for whole gene sequencing (WGS).
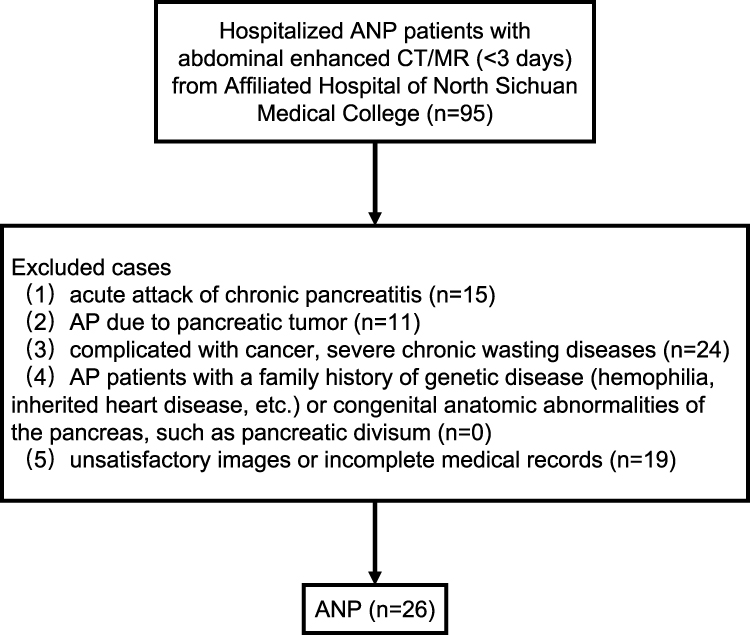 |
Figure 1 Flowchart of ANP patients’ recruitment. |
We also collected serum samples from 84 AP patients during the first 3 days of hospitalization in the Affiliated Hospital of North Sichuan Medical College from June 2020 to May 2021. The enrollment and exclusion criteria were consistent with those of the above patients, and they were classified into ANP and IEP groups by CEMR or CECT, with 42 patients in each group. Serum samples were placed at −80°C for further analysis by enzyme-linked immunosorbent assay (ELISA).
WGS Analysis
Blood samples of IEP patients (n = 21) and ANP patients (n = 26) were analyzed by WGS. Genomics DNA sequencing was performed using the Illumina NovaSeq 6000 platform (Illumina Inc., San Diego, CA, USA) at Novogene Bioinformatics Technology Co., Ltd. (Beijing, China). For details of sequencing and bioinformatics analysis, see Supplemental Methods and Materials.
Establishment of IEP and ANP Rat Models
The animal protocols for rat studies were approved by the Animal Care and Use Committee of North Sichuan Medical College. The animal studies were implemented at the Experimental Animal Center of North Sichuan Medical College and were managed in full compliance with China Animal Welfare Act, the China Public Health Service Policy on Humane Care and Use of Laboratory Animals and the National Research Council’s Guide for the Care and Use of Laboratory Animals.
Male adult Sprague–Dawley rats (n = 10, 6–8 weeks, 200–250 g) were provided by the Experimental Animal Center of North Sichuan Medical College. They were randomly classified into two groups of five rats each. In one group, IEP was established by retrograde pancreaticobiliary duct injection with 0.9% saline, and another group, ANP was established by similar injections with 5% sodium taurocholate (Solarbio Science Technology, Beijing, China). Then, rats were killed six hours later for the collection of blood samples and pancreatic tissues. Blood was immediately centrifuged at 3000 g for 5 min after collection. The serum was retained and stored at −80°C until detection. The pancreas was removed and divided into two parts for later analyses. One part was stored at −80°C for data independent acquisition (DIA) proteomics assay and validation via parallel reaction monitoring (PRM). One part was fixed in formalin for histological analysis. Serum levels of amylase in AP rats were measured by using an enzymatic colorimetric assay (Roche Diagnostics, Indianapolis, IN). Hematoxylin and eosin (H&E) were used to stain the pancreatic sections to conduct the histopathologic analyses under light microscopy. Schmidt’s scale was used to classify AP degree.12 This scale scored edema, acinar necrosis, hemorrhage and fat necrosis, and inflammatory and perivascular infiltration extent.
DIA Proteomics Analysis and PRM Validation of Target Proteins
DIA proteomics analysis and PRM validation were performed on pancreatic tissues of IEP (n = 5) and ANP (n = 5) rats. This process was carried out in Shanghai Applied Protein Technology Co., Ltd., see Supplemental Methods and Materials for details.
Validation of Target Proteins in Patient Serum by Enzyme-Linked Immunosorbent Assay (ELISA)
The levels of complement C3 (C3), complement Factor I (CFI), alpha-2-macroglobulin (A2m), complement C9 (C9), and serpin family C member 1 (Serpinc1) in the serum of AP patients were determined using double antibody ELISA (Shanghai Enzyme-linked Biotechnology Co., Ltd., China) commercial kits (ml058121-J, ml063609-J, ml060470-J, ml060470-J, and ml060054-J, respectively) according to the manufacturer’s instructions.
Statistical Analysis
The hierarchical and categorical variables were expressed as percentages. The continuous variables were described as medians (range) or mean ± SEM. Etiology and sex were compared through Fisher’s exact test or chi-squared test. On the basis of data distribution, other clinical features of the two groups were compared via Mann–Whitney U-test or independent t-test. Histopathologic investigation and the analysis of enzyme levels were performed using Kruskal–Wallis and analysis of variance (ANOVA) test. All statistical analyses were implemented by applying the statistical analysis software SPSS version 25.0 (SPSS Inc., Chicago, IL). A p value less than 0.05 was regarded as statistically significant.
Result
Patient Characteristics
Statistical analysis results of basic clinical data and various scoring data of the patients in the IEP and ANP groups were shown in Tables 1 and 2. Between the ANP and IEP groups, there did not exist statistical differences in etiology, age, sex, BISAP score, or EPIC score. The CTSI/MRSI score, severity based on RAC, CRP level, and SIRS score in the ANP group were much higher than those in the IEP group (p < 0.05). Although there was no significant difference in hospital stay or APACHE II score between the two groups, the average value of the ANP group was higher than that of the IEP group. The levels of amylase and lipase in the IEP group were much higher, compared with ANP group.
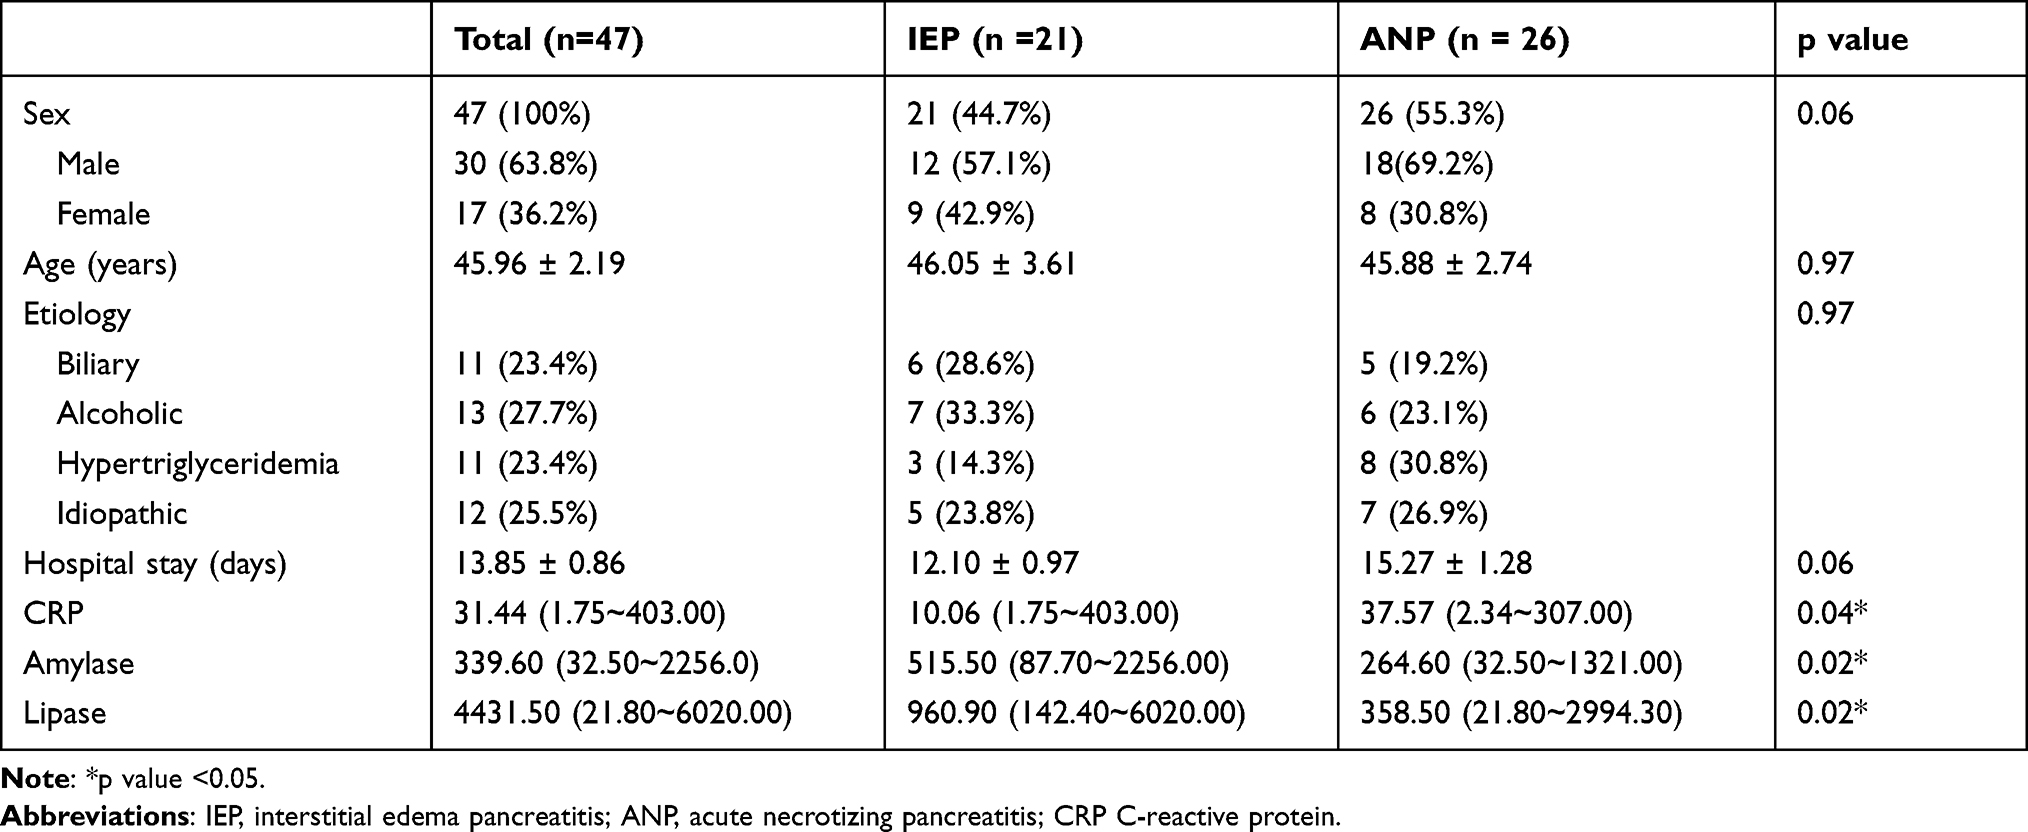 |
Table 1 Basic Clinical Characteristics of Patients with IEP and ANP |
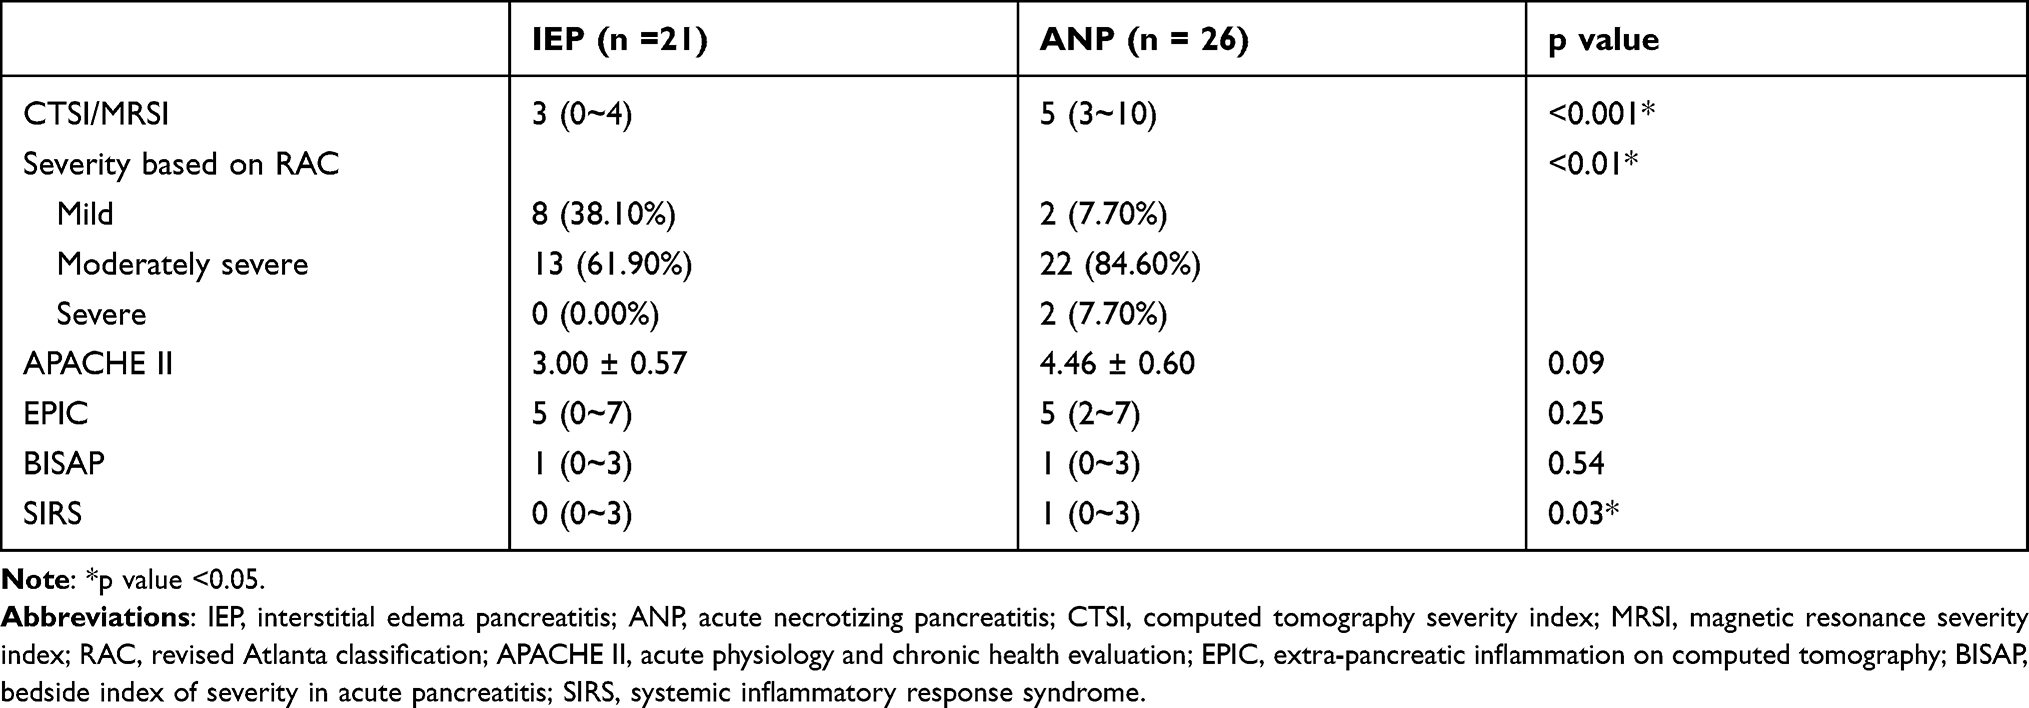 |
Table 2 Severity Scores Comparison Between IEP and ANP Patients |
Genetic Mutations in the Complement and Coagulation Cascades Pathway May Contribute to ANP
To study the differences in genomes between ANP and IEP, patients in ANP group (n = 26) or IEP group (n = 21) underwent WGS. Through Kyoto Encyclopedia of Genes and Genomes (KEGG) pathway analysis, six pathways were significantly different (p < 0.05) between the two groups (Table 3). As seen from the KEGG bubble diagram (Figure 2), the difference in the complement and coagulation cascades pathway was most significant (p < 0.01), with more genes enriched in this pathway. In the complement and coagulation cascades pathway, 22 patients in the ANP group had gene mutations in the exon or splice region, including 39 sites in 29 genes and Nine patients in the IEP group had mutations in their exons, including 16 sites in 14 genes. Among them, 6 mutation sites of ANP groups were located in the splicing region, and there was no annotation information in ANNOVAR. The annotation of one mutation site in each group was unknown in ANNOVAR. Specific mutation sites in the complement and coagulation cascades pathway in the ANP group and IEP group are shown in Table 4
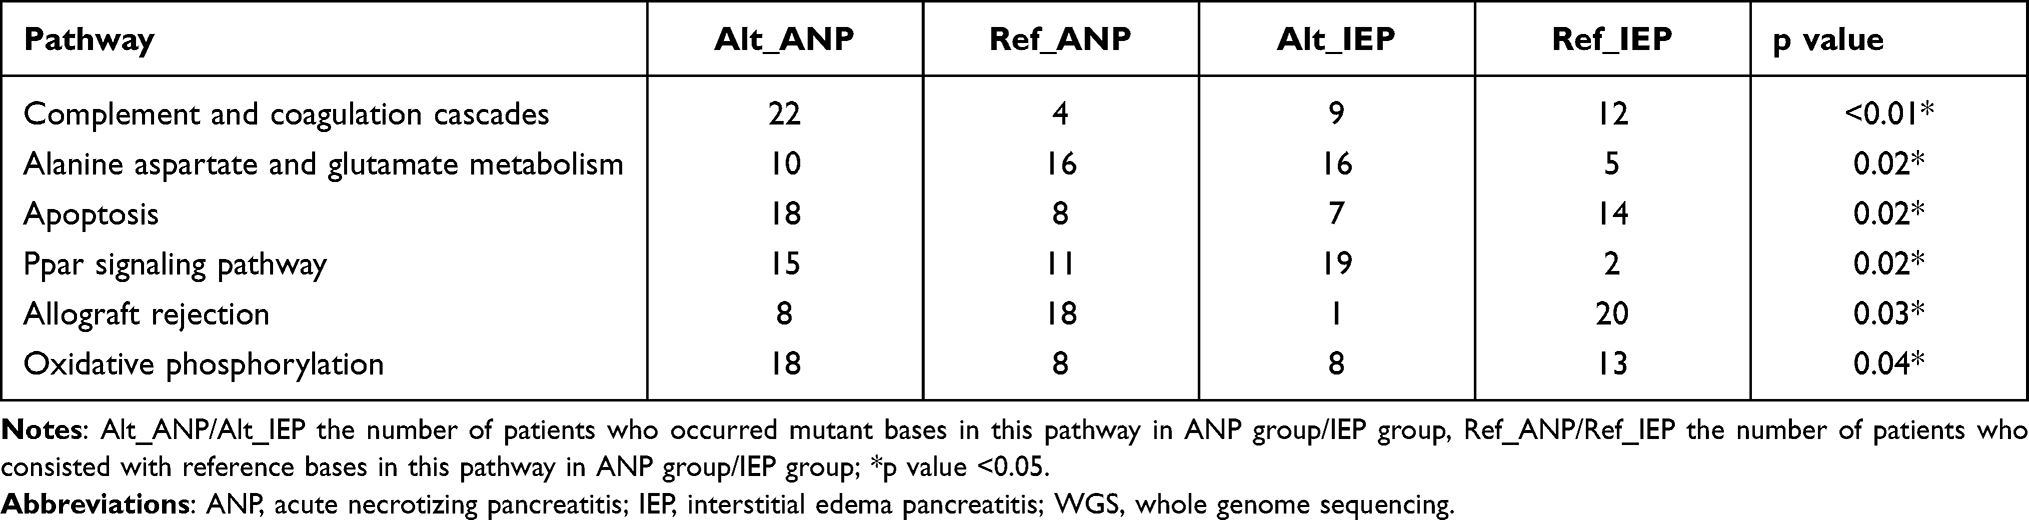 |
Table 3 Differential Pathways in WGS Analysis Between ANP and IEP Patients |
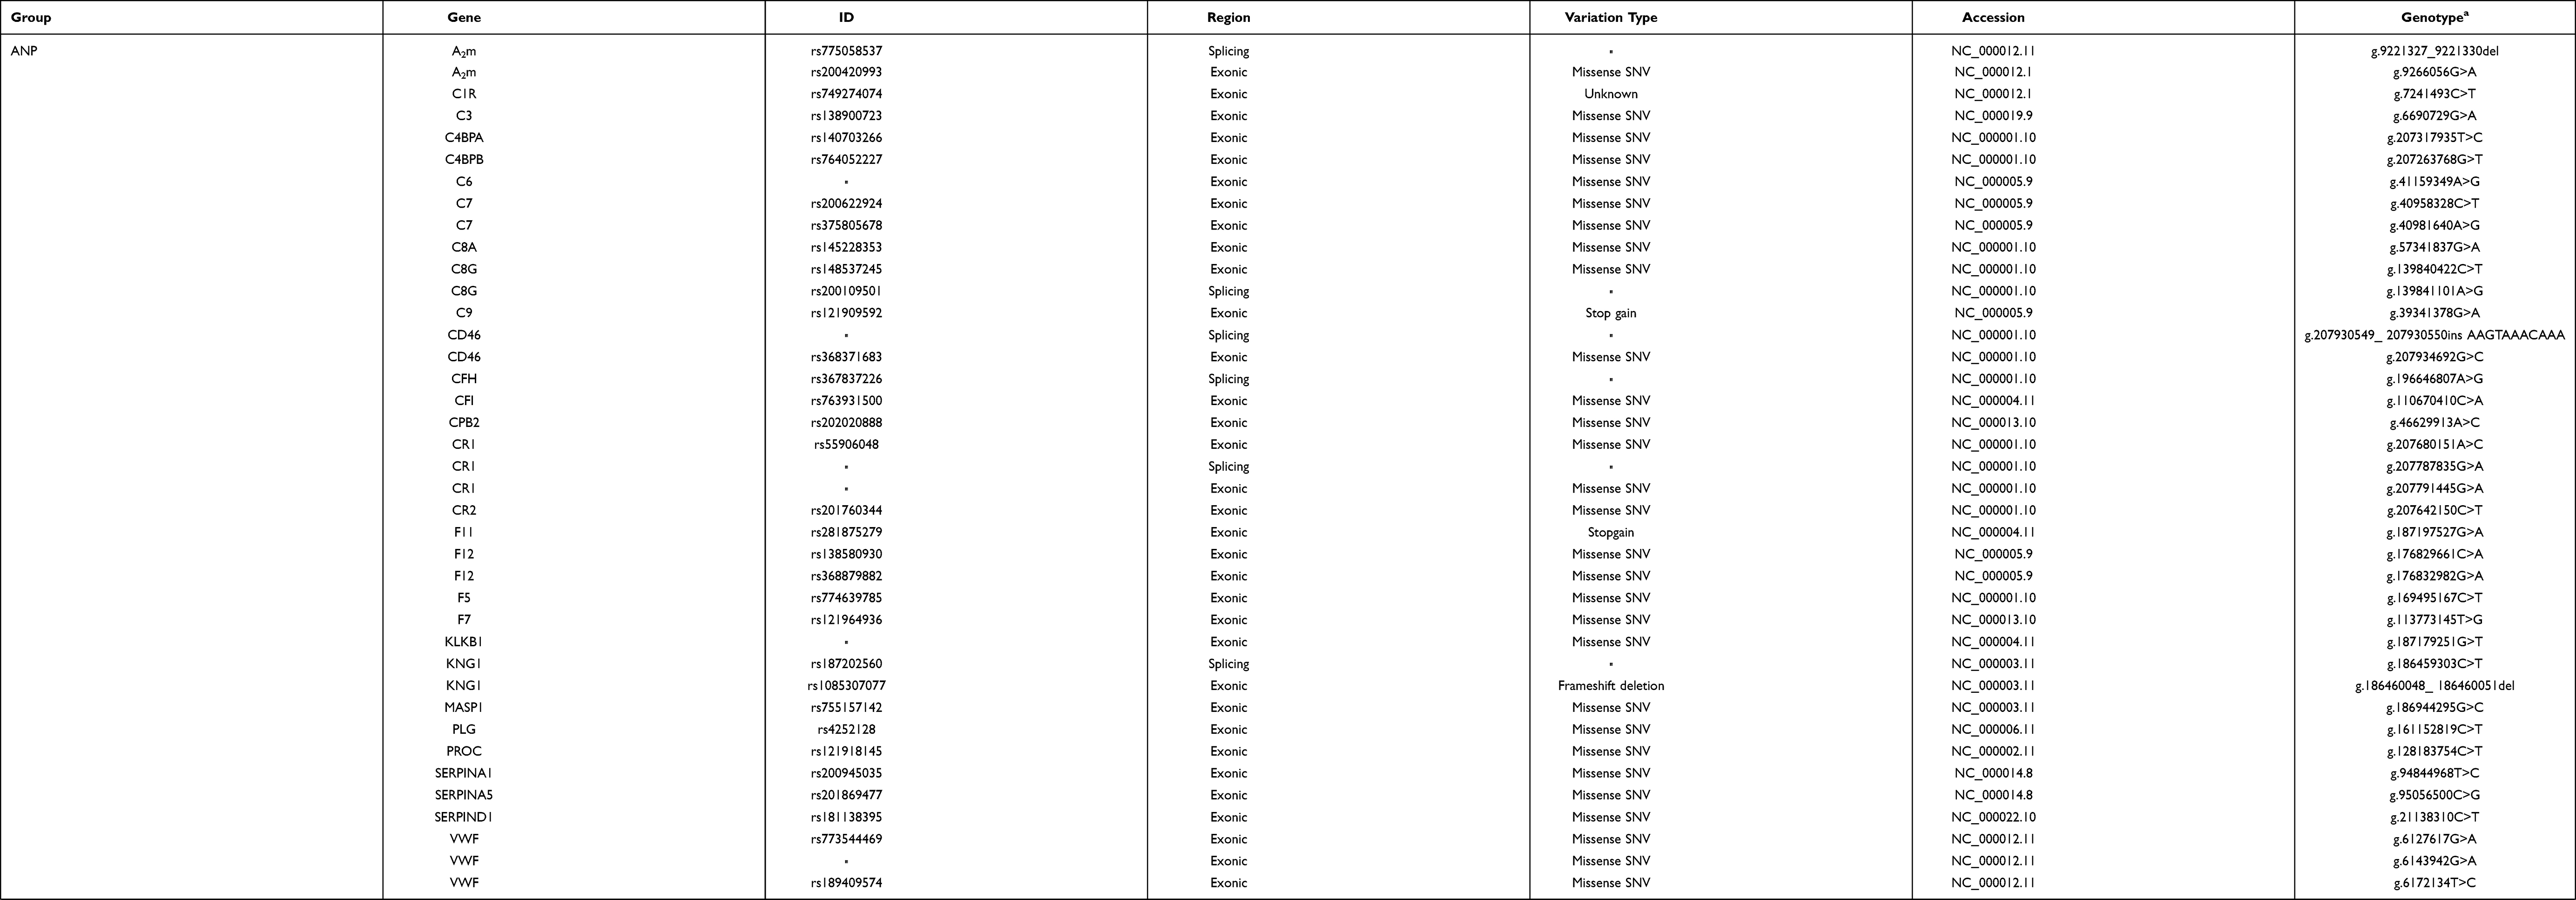 |
Table 4 Mutations in Complement and Coagulation Cascades Pathway in Patients with ANP and IEP |
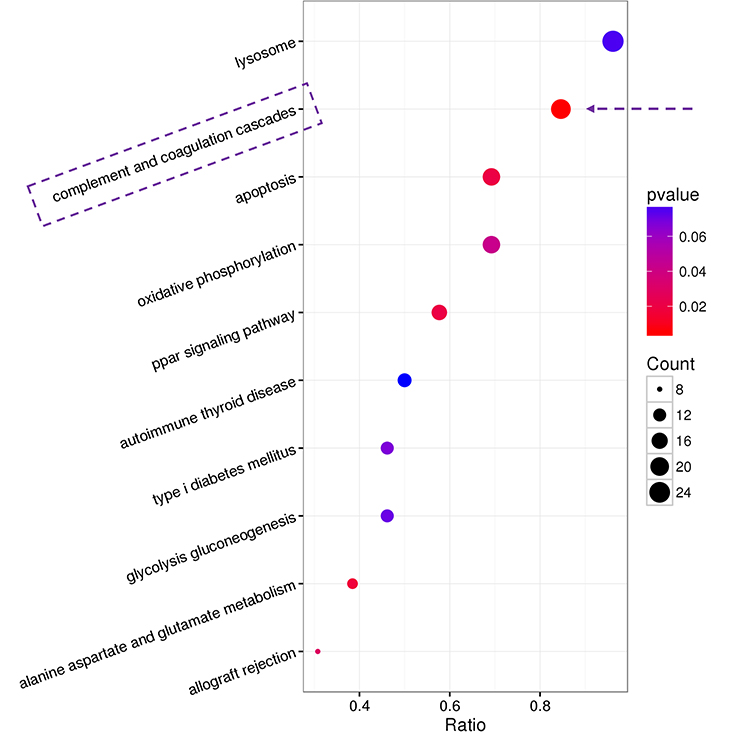 |
Figure 2 Differential pathways between IEP and ANP patients analyzed by WGS. Note: The pathway with the most significant difference (p < 0.01) is highlighted by dotted box and arrow. |
C3, CFI, A2m, C9, and Serpinc1 Were Significantly Upregulated in ANP
H&E-stained pancreatic sections of rats from the control group, IEP group, and ANP group were investigated under a light microscope (Figure 3A). The results showed that the control group had normal pancreatic structure without edema and inflammation. The IEP group showed pancreatic edema with fluid accumulation in interlobular septa but no cell necrosis. The ANP group showed pancreatic edema, inflammation, and acinar cell necrosis. Histological scores were 0 in the control group, 2–5 in the IEP group, and 3–6 in the ANP group (Figure 3B). Serum amylase levels of rats in the IEP group (5924 ± 546.30 U/L, n = 5) and ANP group (4369 ± 287.80 U/L, n = 5) were both higher than that in the control group (2386 ± 49.87 U/L, n = 5) (Figure 3C).
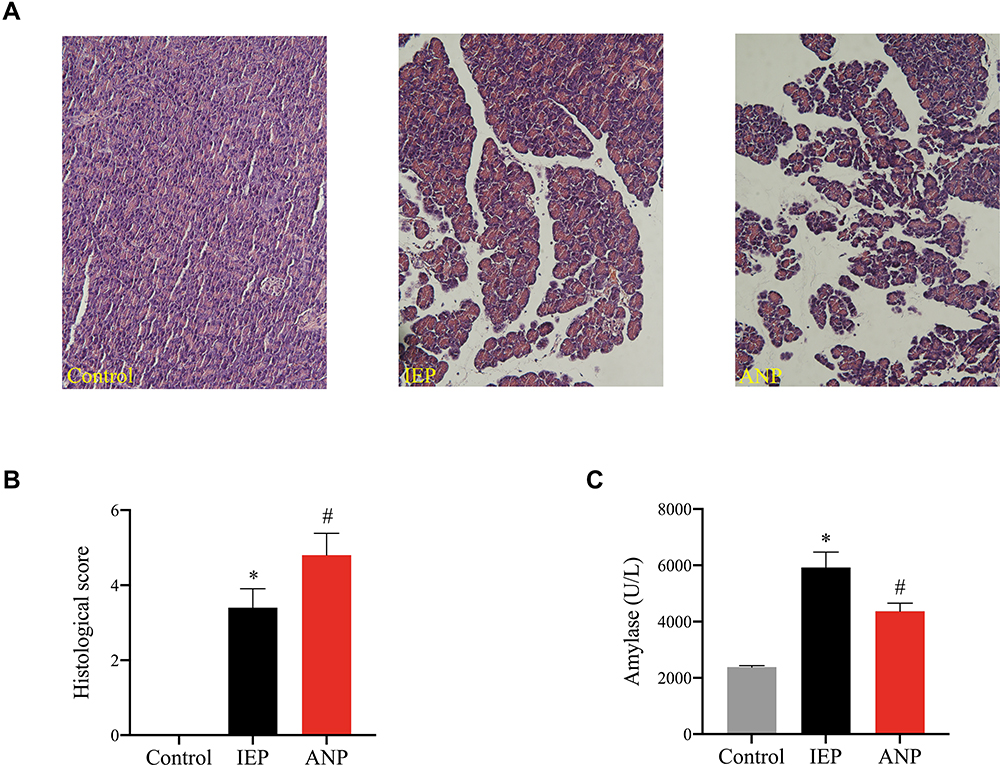 |
Figure 3 Evaluation of IEP and ANP rat models. Abbreviations: ANP, acute necrotizing pancreatitis; IEP, interstitial edema pancreatitis. Notes: (A) Representative H&E staining sections of pancreatic tissues of rats in the three groups were obtained under a 20×10 times light microscope. (B) Histogram of pathological scores of pancreatic tissue sections of rats in the three groups. (C) Histogram of serum amylase levels in three groups of rats. *Statistically significant differences between the IEP and control groups (p < 0.05). #Statistically significant differences between the ANP and control groups (p < 0.05). |
A total of 367 differentially expressed protiens (DEPs) in pancreas of rats between the ANP and IEP groups were selected by significant difference protein screening. Among them, 254 DEPs were upregulated in the ANP group, whereas 113 DEPs were downregulated when compared with the IEP group. The results are illustrated by a volcano plot (Figure 4A). In addition, the hierarchical clustering heatmap of 367 DEPs was obtained after normalization with z score, and according to the Euclidean distance, the proteins were grouped into four clusters and effectively separated IEP samples from ANP samples (Figure 4B).
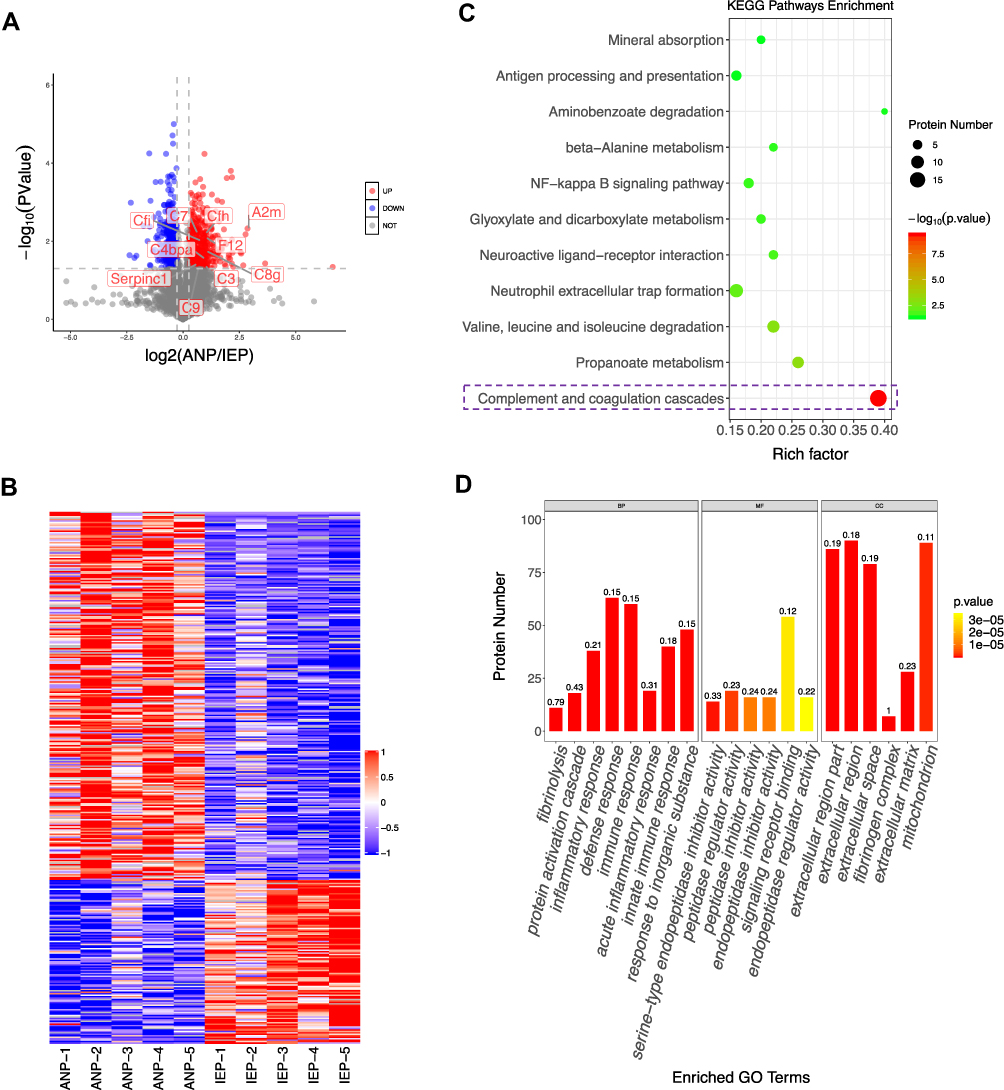 |
Figure 4 DIA proteomics analysis of IEP and ANP rats. Abbreviations: ANP, acute necrotizing pancreatitis; IEP, interstitial edema pancreatitis; KEGG, Kyoto Encyclopedia of Genes and Genomes; GO, Gene Ontology. Notes: (A) DEPs between the two groups are displayed by a volcano plot. Compared with the IEP group, the upregulated proteins in the ANP group are shown in red, downregulated proteins are shown in blue, and those with no difference are shown in gray. (B) Hierarchical clustering heatmap of DEPs between the IEP and ANP groups. Each column represents a sample, and each row represents a DEP. Red represents significantly upregulated proteins, blue represents significantly downregulated proteins, and gray represents no quantitative protein information. (C) The top 11 pathways of the KEGG pathway enrichment analysis in the IEP and ANP groups, which are marked with a dotted box, were the most significantly different pathways (p < 0.05). (D) The abscissa represents the GO function category, and the ordinate represents the rich factor and number of proteins associated with this GO function. The shade of color indicates the p value, which is how significantly a function is affected. |
To further understand the pathological differences between IEP and ANP, KEGG and Gene Ontology (GO) enrichment analysis was used to investigate the DEPs. There were eleven pathways between the IEP and ANP groups with significant differences (p < 0.05), including the complement and coagulation cascades pathway, neutrophil extracellular trap formation, and NF-kappa B signaling pathway (Figure 4C). The difference in the complement and coagulation cascades pathway was most significant, which was consistent with the WGS analysis. GO analysis of DEPs was performed to understand the biological pathways, functions, and localization of proteins in the organism. In Figure 4D, the top twenty GO enrichment analyses are displayed. For a biological process (BP), these proteins principally participate in the inflammatory response and immune response. Molecular functions (MF) mainly included the regulator and inhibitor activities of enzymes. For the cellular components (CC), these DEPs mainly existed in the extracellular space and mitochondria. In combination with KEGG and GO analysis, eighteen proteins in the complement and coagulation cascades pathway were significantly different between the two groups. Ten of the proteins were identical to the gene with base mutations in WGS (Table 5). Compared with the IEP group, these ten proteins were significantly upregulated in the ANP group.
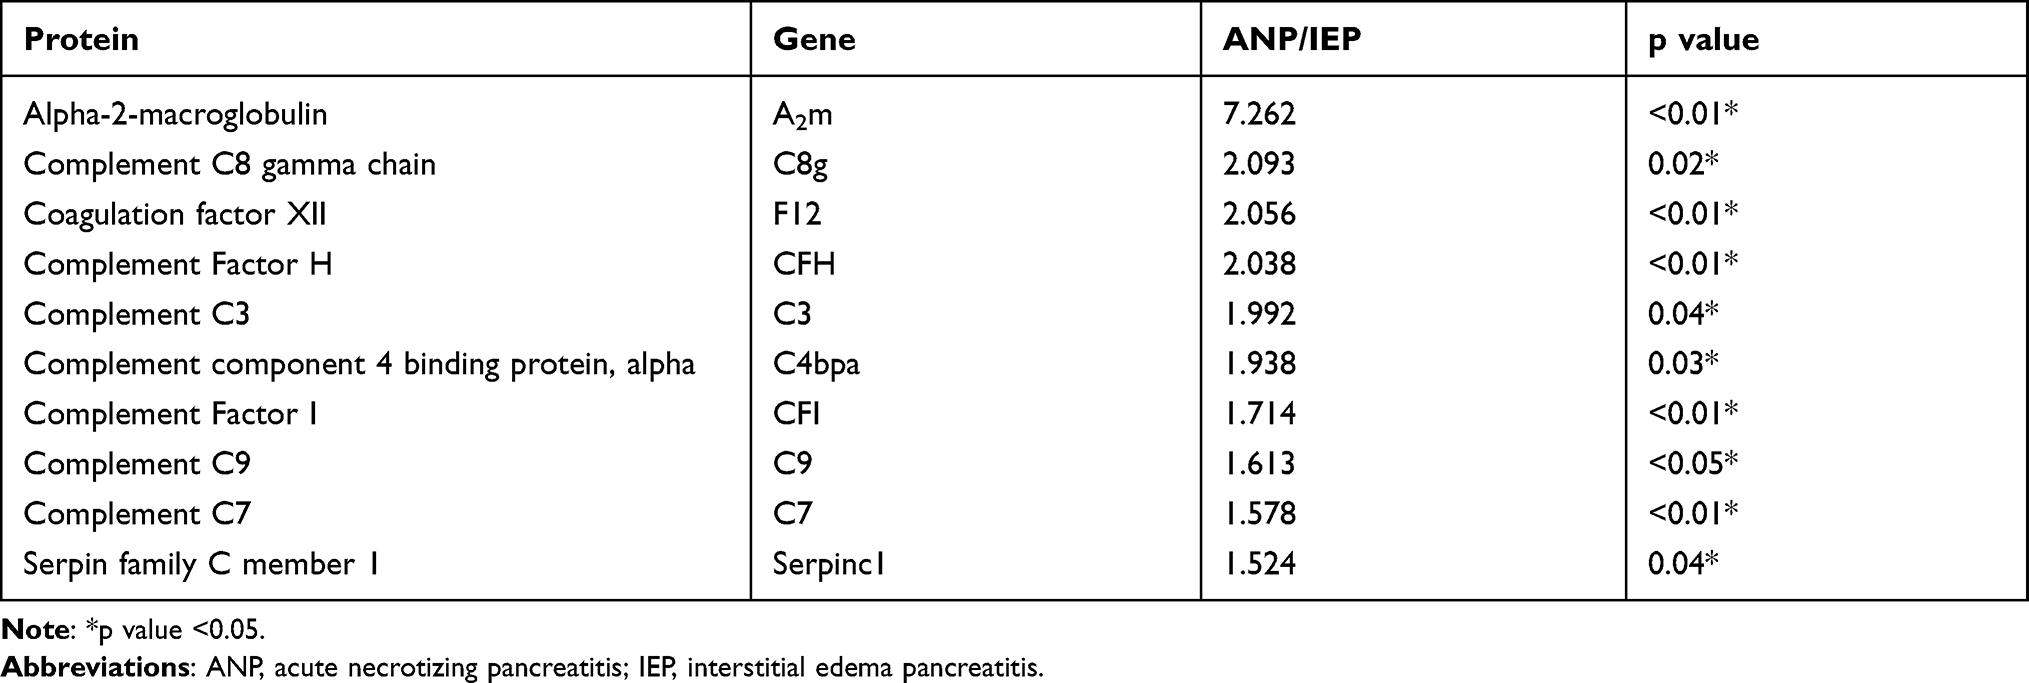 |
Table 5 Differential Proteins of ANP and IEP in Complement and Coagulation Cascades Pathway |
Finally, five proteins were successfully verified by PRM. They were C3, CFI, A2m, C9, and Serpinc1. These proteins are primarily involved in inflammatory reactions and immune responses. Compared with the IEP group, the expression of C3, CFI, A2m, C9, and Serpinc1 in the ANP group was upregulated by 1.71, 1.38, 4.65, 1.48, and 1.06 times, respectively. The upregulation trend of each protein was almost consistent with the results of the DIA proteomics assay. The fold change of the five proteins in the DIA proteomics assay and PRM are shown in Figure 5.
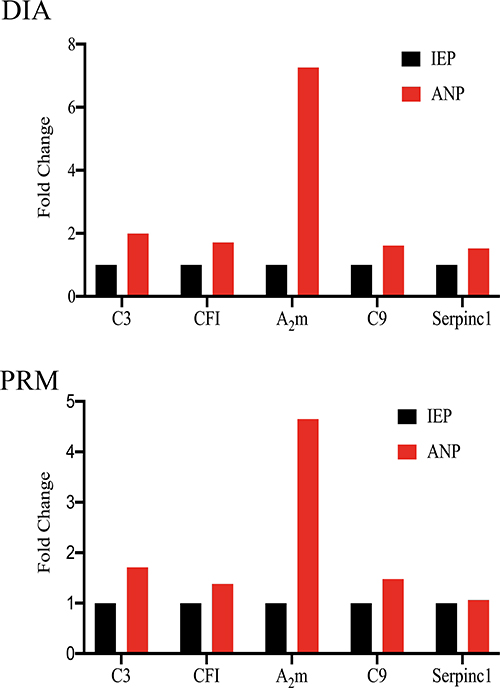 |
Figure 5 Fold changes of C3, CFI, A2m, C9, and Serpinc1 in the ANP/IEP group detected by DIA proteomics and PRM. Abbreviations: PRM, parallel reaction monitoring; DIA, data independent acquisition; ANP, acute necrotizing pancreatitis; IEP, interstitial edema pancreatitis. |
In combination with the results of genomics sequencing, three of the genes consistent with these five proteins were mutated only in ANP group, including C3 (NC_000019.9: g.6690729G>A); CFI (NC_000004.11: g.110670410C>A), and A2m (NC_000012.11: g.9266056G>A). One mutation, Serpinc1 (NC_000001.10: g.173876643G>A), occurred only in the IEP group. In addition, C9 was mutated in both groups, but the sites and types of mutations were different. The mutation type of C9 in ANP group was stop gain (C9 (NC_000005.9: g.39341378G>A)), while in IEP group it was missense SNV (C9 (NC_000005.9: g.39308359A>G)).
CFI and Serpinc1 Levels in ANP Patients Were Increased, While A2m Levels Were Reduced
The levels of C3, CFI, A2m, C9, and Serpinc1 in the serum of patients with IEP and ANP were detected by ELISA. The results are shown in scatter diagrams in Figure 6. Although there was no significant difference in the level of C3 between the IEP and ANP groups, the proportion of high levels (100–150 µg/mL) in the IEP group (31.03%) was significantly higher than that in the ANP group (18.52%). The levels of CFI, A2m, and Serpinc1 in the serum of patients in the two groups were significantly different (p = 0.02, p = 0.04, and p < 0.05, respectively). The average levels of CFI and Serpinc1 in the ANP group were higher than those in the IEP group, while the average level of A2m in the ANP group was lower than that in the IEP group. There existed no evident difference in the levels of serum C9 between the ANP and IEP groups, but the ANP group had a higher mean (9.63 ±1.76 µg/mL) than the IEP group (7.89 ±1.76 µg/mL).
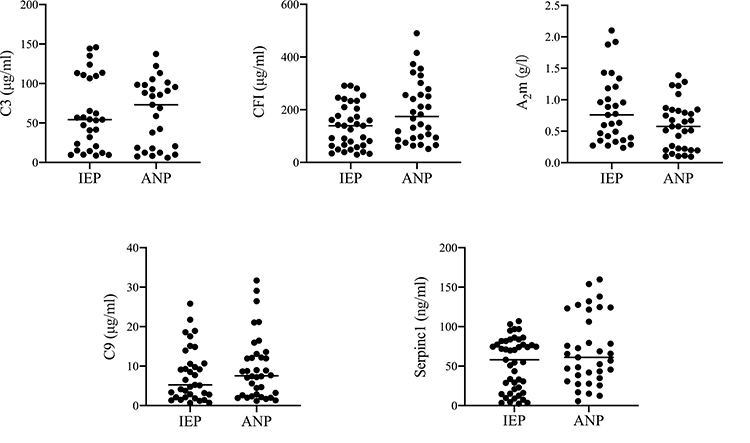 |
Figure 6 The levels of C3, CFI, A2m, C9, and Serpinc1 in IEP and ANP patients were detected by ELISA. Abbreviations: ANP, acute necrotizing pancreatitis; IEP, interstitial edema pancreatitis. |
Discussion
This study includes imaging and genomics in patients with AP and proteomics with rat model of AP. Based on imaging classification, the differences in genes and proteins between ANP and IEP were studied to better understand the molecular mechanism of pancreatic necrosis. In our study, the CTSI/MRSI, SIRS scores, severity based on RAC, and CRP of ANP patients were significantly higher than those of IEP patients. Combined with WGS analysis of AP patients and DIA proteomics assays of AP rats and found that the complement and coagulation cascades pathway was significantly different between the ANP and IEP groups. And in this pathway C3 (NC_000019.9: g.6690729G>A); CFI (NC_000004. 11: g.110670410C>A); A2m (NC_000012. 11: g. 9266056G>A); C9 (NC_000005.9: g.39341378G>A) mutation occurred in ANP group, and C9 (NC_000005.9: g.39308359A>G); Serpinc1 (NC_000001.10: g.173876643G>A) gene mutation occurred in IEP group. DIA proteomics found that C3, CFI, A2m, C9, and Serpinc1 proteins in ANP group was significantly higher than those in IEP group. The accumulated data show that neutrophils can be recruited by the complement system and that the system can also adjust inflammation and tissue injury under various inflammatory conditions.13–15 Studies have proven that complement system activation in AP is related to the severity of disease, particularly in ANP models.14
The data show that C3 expression is higher in the pancreatic tissues of ANP rats than in those of IEP rats. Interestingly, although the average levels of C3 in serum of ANP patients were only slightly higher than those in IEP patients, and there was no statistical difference between the two groups, the proportion of high C3 levels in the IEP group was higher than that in the ANP group. This finding is consistent with the findings of Seelig et al, who showed that in a taurocholate-induced rat model of AP, massive C3 deposits could be detected in the vicinity of acinar necroses and necrobioses.16 Multiple studies have found that serum C3 levels were significantly reduced in ANP patients,14,17 suggesting that C3 consumption may play a role in the development of ANP. A recent study demonstrated that C3 is an effective promoter of systemic inflammation, pancreatic tissue damage, neutrophil recruitment, and neutrophil extracellular trap (NET) generation in the pathogenesis of AP.15 There is sufficient evidence that neutrophil recruitment together with subsequent NET generation is one of the pivotal components of SAP development.18 In addition, C3 is involved in all complement activation pathways and can interact with many complement components and factors. For example, CFI can cleave C3 to C3b with assistance from cofactors.19 C3b is an effective humoral inflammatory mediator. CFI further cleaves C3b to C3bi, which can bind to complement receptors CR3 (and probably CR4) on neutrophils to trigger inflammation.20 CFI also inactivates C3b, reduces the production of C3 convertase (C3bBb), and prevents excessive consumption of C3 in plasma. Both an increase or decrease in CFI may upset this balance. Our data showed that CFI levels were markedly higher in the ANP group than in the IEP group. This indicates that CFI may be correlated with ANP. However, the exact mechanism is unclear. In addition, trypsin can cleave C3 as well.21 As a broad-spectrum protease inhibitor in human plasma, A2m can inhibit trypsin22,23 and play a central role in defense proteinase-induced release of C3 cleavage products.24 In AP, trypsin is rapidly inhibited to form a stable compound with A2m.25 Therefore, in patients with AP, concentrations of A2m are typically depressed but decrease profoundly and for longer periods in more severe cases.26–28 This has been interpreted as A2m being consumed by activated trypsin and subsequent clearance of the A2m protease complexes from the intravascular space by cells of the reticuloendothelial system within approximately 10 minutes.29 However, clearance of complexes from the peritoneal fluid is probably much slower.30 This is consistent with our results that A2m in the serum of ANP patients was markedly lower than that in IEP patients, while A2m was overtly increased in the inflamed pancreatic tissue of ANP rats compared with IEP rats.
The experimental data also showed that the content of C9 in the pancreas of ANP rats was observably higher than that of IEP rats. The mean level of serum C9 in ANP patients was higher than that in IEP patients. Many studies have proposed that C9 is associated with necrosis, apoptosis, and the proinflammatory response. As one of the key components of the membrane attack complex (MAC),31,32 the presence of C9 on the cell surface indicates the formation of MAC.33 MAC is the terminal complement cascade effector.34 It binds to the target cell surface and leads to cell lysis by generating transmembrane channels or pores on the cell membrane.35,36 These assembled pores are thought to allow lysozymes to degrade the peptidoglycan layer through the outer membrane.37,38 In addition, Triantafilou et al proposed that MAC insertion into the cell membrane could trigger Ca2+ influx, increase cytosolic Ca2+ concentration, and then accumulate in the mitochondrial matrix, ultimately resulting in mitochondrial dysfunction, apoptosis, inflammasome activation, and the secretion of IL-1β.39 MAC-activated cells can express proinflammatory proteins via NF-κB-dependent transcription, assemble inflammasomes, activate processing, and promote IL-1β and IL-18 secretion.40,41 This may explain the higher levels of C9 in the pancreas of the rats in the ANP group in this study.
Proteomics analysis of the pancreas of AP rats and ELISA analysis of the serum of AP patients showed that Serpinc1 expression was increased when ANP occurred. This suggests that Serpinc1 is likely to be associated with ANP and may be a biomarker for predicting ANP. However, there have been no reports about the relationship between Serpinc1 and AP.
Our study has some limitations. First, our research involved a single-center study, and a few patients underwent WGS analysis, which may lead to selection bias. Second, although we found base mutations in the C3, CFI, A2m, C9, and Serpinc1 genes in IEP and ANP patients and verified their protein expression levels in IEP and ANP rat models, the molecular mechanism was not further studied through in vivo and in vitro investigations. Finally, the network of interrelationships among the five genes is not fully understood. Therefore, the molecular mechanism and network of these five genes in the development of ANP should be investigated in detail in future studies.
Conclusion
C3, CFI, A2m, C9, and Serpinc1, which belong to complement and coagulation cascades pathway could play an important role in the pathogenesis of ANP. Moreover, C3, CFI, A2m, C9, and Serpinc1 in serum of patients may be used as biomarkers to predict ANP in the future.
Acknowledgments
This work was supported by National Natural Science Foundation of China (to XMZ, No. 81871440).
Author Contributions
All authors made a significant contribution to the work reported, whether that is in the conception, study design, execution, acquisition of data, analysis and interpretation, or in all these areas; took part in drafting, revising or critically reviewing the article; gave final approval of the version to be published; have agreed on the journal to which the article has been submitted; and agree to be accountable for all aspects of the work.
Disclosure
The authors declare that there are no conflicts of interest in this work.
References
1. Forsmark CE, Campion EW, Swaroop Vege S, Wilcox CM. Acute pancreatitis. N Engl J Med. 2016;375(20):1972–1981. doi:10.1056/NEJMra1505202
2. Schepers NJ, Bakker OJ, Besselink MG, et al. Impact of characteristics of organ failure and infected necrosis on mortality in necrotising pancreatitis. Gut. 2019;68(6):1044–1051. doi:10.1136/gutjnl-2017-314657
3. Trikudanathan G, Wolbrink DRJ, van Santvoort HC, Mallery S, Freeman M, Besselink MG. Current concepts in severe acute and necrotizing pancreatitis: an evidence-based approach. Gastroenterology. 2019;156(7):1994–2007 e1993. doi:10.1053/j.gastro.2019.01.269
4. Chua TY, Walsh RM, Baker ME, Stevens T. Necrotizing pancreatitis: diagnose, treat, consult. Cleve Clin J Med. 2017;84(8):639–648. doi:10.3949/ccjm.84a.16052
5. Balthazar EJ, Robinson DL, Megibow AJ, Ranson JH. Acute pancreatitis: value of CT in establishing prognosis. Radiology. 1990;174(2):331–336. doi:10.1148/radiology.174.2.2296641
6. Boxhoorn L, Voermans RP, Bouwense SA, et al. Acute pancreatitis. Lancet. 2020;396(10252):726–734. doi:10.1016/S0140-6736(20)31310-6
7. Hansen SEJ, Madsen CM, Varbo A, Tybjaerg-Hansen A, Nordestgaard BG. Genetic variants associated with increased plasma levels of triglycerides, via effects on the lipoprotein lipase pathway, increase risk of acute pancreatitis. Clin Gastroenterol Hepatol. 2020;19:1652–1660.e6. doi:10.1016/j.cgh.2020.08.016
8. Whitcomb DC, LaRusch J, Krasinskas AM, et al. Common genetic variants in the CLDN2 and PRSS1-PRSS2 loci alter risk for alcohol-related and sporadic pancreatitis. Nat Genet. 2012;44(12):1349–1354. doi:10.1038/ng.2466
9. Whitcomb DC. Genetic risk factors for pancreatic disorders. Gastroenterology. 2013;144(6):1292–1302. doi:10.1053/j.gastro.2013.01.069
10. Barreto SG, Habtezion A, Gukovskaya A, et al. Critical thresholds: key to unlocking the door to the prevention and specific treatments for acute pancreatitis. Gut. 2021;70(1):194–203. doi:10.1136/gutjnl-2020-322163
11. Banks PA, Bollen TL, Dervenis C, et al. Classification of acute pancreatitis–2012: revision of the Atlanta classification and definitions by international consensus. Gut. 2013;62(1):102–111. doi:10.1136/gutjnl-2012-302779
12. Schmidt J, Rattner DW, Lewandrowski K, et al. A better model of acute pancreatitis for evaluating therapy. Ann Surg. 1992;215(1):44–56. doi:10.1097/00000658-199201000-00007
13. Berends ET, Kuipers A, Ravesloot MM, Urbanus RT, Rooijakkers SH. Bacteria under stress by complement and coagulation. FEMS Microbiol Rev. 2014;38(6):1146–1171. doi:10.1111/1574-6976.12080
14. Hartwig W, Klafs M, Kirschfink M, et al. Interaction of complement and leukocytes in severe acute pancreatitis: potential for therapeutic intervention. Am J Physiol Gastrointest Liver Physiol. 2006;291(5):G844–850. doi:10.1152/ajpgi.00016.2006
15. Linders J, Madhi R, Morgelin M, King BC, Blom AM, Rahman M. Complement component 3 is required for tissue damage, neutrophil infiltration, and ensuring NET formation in acute pancreatitis. Eur Surg Res. 2020;61(6):163–176. doi:10.1159/000513845
16. Seelig R, Lankisch PG, Koop H, Winckler K, Kaboth U, Seelig HP. Complement system in sodium taurocholate pancreatitis in the rat. Res Exp Med (Berl). 1978;174(1):57–65. doi:10.1007/BF01851939
17. Zhang L, Qiao Z, Feng H, Shen J. The early predictive role of complement C3 and C4 in patients with acute pancreatitis. J Clin Lab Anal. 2020;34(5):e23205. doi:10.1002/jcla.23205
18. Merza M, Hartman H, Rahman M, et al. Neutrophil extracellular traps induce trypsin activation, inflammation, and tissue damage in mice with severe acute pancreatitis. Gastroenterology. 2015;149(7):1920–1931 e1928. doi:10.1053/j.gastro.2015.08.026
19. Sim RB, Day AJ, Moffatt BE, Fontaine M. Complement factor I and cofactors in control of complement system convertase enzymes. Methods Enzymol. 1993;223:13–35.
20. Brown EJ. Complement receptors and phagocytosis. Curr Opin Immunol. 1991;3(1):76–82. doi:10.1016/0952-7915(91)90081-B
21. Roxvall L, Bengtson A, Sennerby L, Heideman M. Activation of the complement cascade by trypsin. Biol Chem Hoppe Seyler. 1991;372(4):273–278. doi:10.1515/bchm3.1991.372.1.273
22. Travis J, Salvesen GS. Human plasma proteinase inhibitors. Annu Rev Biochem. 1983;52:655–709. doi:10.1146/annurev.bi.52.070183.003255
23. Roberts RC. Protease inhibitors of human plasma. Alpha-2-macroglobulin. J Med. 1985;16(1–3):129–224.
24. Balldin G, Eddeland A, Ohlsson K. Studies on the role of the plasma protease inhibitors on in vitro C3 activation and in acute pancreatitis. Scand J Gastroenterol. 1981;16(5):603–609. doi:10.3109/00365528109182018
25. Ohlsson K. Elimination of 125-I-trypsin alpha-macroglobulin complexes from blood by reticuloendothelial cells in dogs. Acta Physiol Scand. 1971;81(2):269–272. doi:10.1111/j.1748-1716.1971.tb04900.x
26. Lasson Å, Ohlsson K. Protease inhibitors in acute human pancreatitis. Scand J Gastroenterol. 2018;19(6):779–786. doi:10.1080/00365521.1984.12005808
27. Buchler M, Malfertheiner P, Schoetensack C, Uhl W, Beger HG. Sensitivity of antiproteases, complement factors and C-reactive protein in detecting pancreatic necrosis. Results of a prospective clinical study. Int J Pancreatol. 1986;1(3–4):227–235. doi:10.1007/BF02795248
28. Wilson C, Heads A, Shenkin A, Imrie CW. C-reactive protein, antiproteases and complement factors as objective markers of severity in acute pancreatitis. Br J Surg. 1989;76(2):177–181. doi:10.1002/bjs.1800760224
29. Ohlsson K, Laurell CB. The disappearance of enzyme-inhibitor complexes from the circulation of man. Clin Sci Mol Med. 1976;51(1):87–92. doi:10.1042/cs0510087
30. Balldin G, Ohlsson K. Demonstration of pancreatic protease-antiprotease complexes in the peritoneal fluid of patients with acute pancreatitis. Surgery. 1979;85(4):451–456.
31. Serna M, Giles JL, Morgan BP, Bubeck D. Structural basis of complement membrane attack complex formation. Nat Commun. 2016;7:10587. doi:10.1038/ncomms10587
32. Dudkina NV, Spicer BA, Reboul CF, et al. Structure of the poly-C9 component of the complement membrane attack complex. Nat Commun. 2016;7:10588. doi:10.1038/ncomms10588
33. Tjernberg J, Ekdahl KN, Lambris JD, Korsgren O, Nilsson B. Acute antibody-mediated complement activation mediates lysis of pancreatic islets cells and may cause tissue loss in clinical islet transplantation. Transplantation. 2008;85(8):1193–1199. doi:10.1097/TP.0b013e31816b22f3
34. Tegla CA, Cudrici C, Patel S, et al. Membrane attack by complement: the assembly and biology of terminal complement complexes. Immunol Res. 2011;51(1):45–60. doi:10.1007/s12026-011-8239-5
35. Walport MJ, Mackay IR, Rosen FS. Complement. First of two parts. N Engl J Med. 2001;344(14):1058–1066. doi:10.1056/NEJM200104053441406
36. Walport MJ, Mackay IR, Rosen FS. Complement. Second of two parts. N Engl J Med. 2001;344(15):1140–1144. doi:10.1056/NEJM200104123441506
37. Martinez RJ, Carroll SF. Sequential metabolic expressions of the lethal process in human serum-treated Escherichia coli: role of lysozyme. Infect Immun. 1980;28(3):735–745. doi:10.1128/iai.28.3.735-745.1980
38. Glynn AA, Milne CM. Lysozyme and immune bacteriolysis. Nature. 1965;207(5003):1309–1310. doi:10.1038/2071309a0
39. Triantafilou K, Hughes TR, Triantafilou M, Morgan BP. The complement membrane attack complex triggers intracellular Ca2+ fluxes leading to NLRP3 inflammasome activation. J Cell Sci. 2013;126(Pt 13):2903–2913. doi:10.1242/jcs.124388
40. Xie CB, Qin L, Li G, et al. Complement membrane attack complexes assemble NLRP3 inflammasomes triggering IL-1 activation of IFN-gamma-primed human endothelium. Circ Res. 2019;124(12):1747–1759. doi:10.1161/CIRCRESAHA.119.314845
41. Xie CB, Jane-Wit D, Pober JS. Complement membrane attack complex: new roles, mechanisms of action, and therapeutic targets. Am J Pathol. 2020;190(6):1138–1150. doi:10.1016/j.ajpath.2020.02.006
42. den Dunnen JT, Dalgleish R, Maglott DR, et al. HGVS recommendations for the description of sequence variants: 2016 update. Hum Mutat. 2016;37(6):564–569. doi:10.1002/humu.22981
 © 2022 The Author(s). This work is published and licensed by Dove Medical Press Limited. The full terms of this license are available at https://www.dovepress.com/terms.php and incorporate the Creative Commons Attribution - Non Commercial (unported, v3.0) License.
By accessing the work you hereby accept the Terms. Non-commercial uses of the work are permitted without any further permission from Dove Medical Press Limited, provided the work is properly attributed. For permission for commercial use of this work, please see paragraphs 4.2 and 5 of our Terms.
© 2022 The Author(s). This work is published and licensed by Dove Medical Press Limited. The full terms of this license are available at https://www.dovepress.com/terms.php and incorporate the Creative Commons Attribution - Non Commercial (unported, v3.0) License.
By accessing the work you hereby accept the Terms. Non-commercial uses of the work are permitted without any further permission from Dove Medical Press Limited, provided the work is properly attributed. For permission for commercial use of this work, please see paragraphs 4.2 and 5 of our Terms.