")
Back to Journals » OncoTargets and Therapy » Volume 12
The combination of the glycolysis inhibitor 2-DG and sorafenib can be effective against sorafenib-tolerant persister cancer cells
Authors Wang L, Yang Q, Peng S, Liu X
Received 16 April 2019
Accepted for publication 18 June 2019
Published 8 July 2019 Volume 2019:12 Pages 5359—5373
DOI https://doi.org/10.2147/OTT.S212465
Checked for plagiarism Yes
Review by Single anonymous peer review
Peer reviewer comments 2
Editor who approved publication: Prof. Dr. Geoffrey Pietersz
Li Wang,1 Qian Yang,2 Shaoyong Peng,3 Xiaoxia Liu1,3
1Department of Pharmacy, Zhujiang Hospital, Southern Medical University, Guangzhou 510282, People’s Republic of China; 2Department of Orthopedics, Luoyang No.1 Hospital of TCM, Luoyang 471000, People’s Republic of China; 3The Sixth Affiliated Hospital, Sun Yat-sen University, Guangzhou 510655, People’s Republic of China
Background: Chemotherapy remains a major clinical option for the successful treatment of cancer by eliminating fast-growing populations of cancer cells. However, drug resistance causes the failure of antitumor treatment. Increasing evidence suggests that a small subpopulation of cancer cells will enter a “persister state” under drug pressure. The persister cell pool constitutes a reservoir from which drug resistance may emerge. Therefore, targeting persister cells presents a therapeutic opportunity to prevent drug resistance and impede tumor relapse.
Materials and methods: RT-qPCR, Western blot, Seahorse, apoptosis assay, clonogenic assay, and xenografted mouse model were used for this study.
Results: We showed that a similar therapy-resistant cell state underlies the behavior of persister cells derived from sorafenib treatments with reversible, nonmutational mechanisms. Then, we demonstrated that persister cells showed upregulated glycolysis, as evidenced by higher ECAR, as well as increased glucose consumption and lactate production. A database analysis showed that sorafenib-tolerant persister cells exhibited the increased expression of the glycolytic enzyme hexokinase 2, which is closely related to the poor prognosis in liver cancer. We found that the combined treatment with the glycolytic inhibitor 2-DG and sorafenib increased persister cell apoptosis and inhibited colony formation. Consequently, we demonstrated that when persister cells were exposed to a low concentration of sorafenib, they suffered mitochondrial dysfunction but showed compensatory increases in glycolysis, which contributes to cell growth and proliferation. Finally, we showed that the combination of 2-DG and sorafenib reduced persister tumor growth in mice.
Conclusions: These findings suggest that such a combination can effectively hamper persister cell growth and may represent a promising therapeutic strategy to prevent persister cell resistance.
Keywords: persister cells, drug-resistance, sorafenib, glycolysis inhibitor, antitumor
Introduction
Hepatocellular carcinoma (HCC) is one of the leading causes of cancer mortality. Surgical resection plus adjuvant and systemic chemotherapy are currently the most meticulously followed treatment procedures. However, the complex etiology and high metastatic potential of the disease, as well as the acquired resistance to drugs, results in disease relapse and treatment futility in the majority of cases.1 Persister cells are the remaining, nonmutational and small subpopulations of cancer cells that can evade strong selective drug pressure. Chemotherapy has traditionally focused on eliminating fast-growing populations of cells and still plays an important role in the treatment of cancer. However, acquired drug resistance prevents cancer therapies from achieving stable and complete responses.2,3 Therefore, targeting persister cell therapy can effectively prevent resistance and impede tumor relapse.
Systemic chemotherapy using a multitargeted tyrosine kinase inhibitor is an established treatment for HCCs.4 Sorafenib is a small inhibitor of several tyrosine protein kinases, such as VEGFR, PDGFR and Raf family kinases (more avidly C-Raf than B-Raf).5 Currently, sorafenib is the most effective molecular-targeted drug against advanced primary liver cancer (HCC). However, the sorafenib resistance rate is very high. The molecular mechanism of this resistance has not been fully elucidated. Additionally, researchers have shown that sorafenib treatment can induce autophagy, which may suppress tumor growth. However, autophagy can also cause drug resistance.6,7 Therefore, it is extremely important to explore an effective strategy to deal with drug resistance. Understanding the mechanism of persister cell emergence is therefore critical to designing more effective combination therapies that can achieve a cure. Aerobic glycolysis was increased in HCC cell lines, and the downregulation of HK2 expression can enhance sorafenib-induced cell growth inhibition.8 DeWaal et al also showed that HCC cells are metabolically distinct from normal hepatocytes by expressing HK2 and suppressing glucokinase (GCK). In addition, they also demonstrated that HK2 silencing synergizes with sorafenib to inhibit tumor growth.9 Huang et al showed the upregulation of glycolytic activity in sorafenib-resistant leukemia cells.10 However, little is known about the glycolytic activity in sorafenib-tolerant persister liver cancer cells.
Here, we began with a population of cancer cells that were treated with targeted therapy to reveal a small subpopulation of persisters, which eventually gained the ability to proliferate in sorafenib. Then, we showed the metabolic characteristics and high aerobic glycolysis of these cells. The mRNA and protein levels and enzyme activity of HK2 were also upregulated in persister cells. In addition, high HK2 expression in HCC is also closely related to its poor clinical prognosis. The glycolysis inhibitor 2-Deoxy-D-glucose (2-DG), an inhibitor of all forms of HK, which is used as a tumor therapeutic, has been suggested, and in fact, 2-DG is in clinical trials.11 Therefore, we used a combination of 2-DG and sorafenib to show that these compounds can effectively inhibit drug-tolerant persister cell survival and colony formation in vitro and significantly inhibit persister cell growth in vivo. These findings suggest that a combination glycolysis inhibitor and sorafenib may represent a therapeutic strategy to prevent persister cell drug resistance.
Materials and methods
Reagents and antibodies
Sorafenib (Selleck, Houston, TX, USA) was dissolved in DMSO at a stock concentration of 10 mM, aliquoted and stored at −20 °C, and 2-DG (Sigma-Aldrich, St. Louis, MO, USA) was dissolved in PBS at a stock concentration of 10 M. The MTS assay (CellTiter 96 Aqueous One Solution reagent) was purchased from Promega Corporation (Madison, WI, USA). The PI and Annexin V-FITC apoptosis Detection Kit was purchased from Keygen Company (Nanjing, China). The antibodies used in this study were purchased from the following sources: anti-HK2 from Abcam and α-Tubulin from Cell Signaling Technologies.
Cell culture
Hep3B and Huh7 cells were obtained from the American Type Culture Collection. The cells were maintained in DMEM (Gibco, Grand Island, NY, USA) supplemented with 10% FBS (BI, Israel) in a 37 °C humidified incubator under an atmosphere of 5% CO2 in air. Persister cell derivation: Persister cells were derived from the treatment of liver cancer cell lines Hep3B and Huh7 with 10 μM sorafenib for at least 8 days with fresh drug added every 3 days. Then, the sorafenib was removed and the cells were cultured for approximately 28 days.
Quantitative real-time polymerase chain reaction (PCR) analysis
Total RNA was extracted from cells as described previously.12 The primer sequences for the genes to be measured are as follows: 5′- TTGACCAGGAGATTGACATGGG′ (forward) and 5′- CAACCGCATCAGGACCTCA′ (reverse) for HK2; and 5′- AACTCCATCATGAAGTGTGACG -3′ (forward) and 5′- GATCCACATCTGCTGGAAGG -3′ (reverse) for β-actin. The real-time PCR analysis was performed by using the SYBR Premix Ex Taq II Kit (TaKaRa Bio, Otsu, Shiga, Japan) and a real-time PCR detection system (Bio-Rad, Hercules, CA, USA).
Western blotting analysis
The cells were homogenized in protein lysis buffer, and the debris was removed by centrifugation at 12,000 g for 10 min at 4 °C. The protein concentrations in all samples were determined by using the PierceTM BCA Protein Assay Kit (Thermo Scientific, Waltham, MA,USA). After the addition of sample loading buffer, the protein samples were electrophoresed and then transferred to poly-vinylidene difluoride transfer membranes. The blots were blocked for 1 h at room temperature with fresh 5% nonfat milk in TBST and then incubated with specific primary antibody in TBST overnight at 4 °C. Following three washes with TBST, the blots were incubated with horseradish peroxidase-conjugated secondary antibodies for 1 h, and the immunoreactive bands were visualized by using an ECL kit (Thermo Scientific, Waltham, MA,USA). The density of the immunoreactive bands was analyzed using ImageJ.
Measurement of ROS generation
Cancer cells were incubated with serum-free medium supplemented with 2 μM MitoSOX (Invitrogen, Carlsbad, CA, USA) for 20 min at 37 °C. Following staining, the cells were washed twice with 4 °C PBS and then collected for flow cytometry analysis.
Mitochondria membrane potential (MMP) evaluation
The MMP was assessed using 5,5ʹ,6,6ʹ-tetrachloro-1,1ʹ,3,3ʹ-tetraethylbenzimidazolylcarbocyanine iodide (JC-1) staining according to the manufacturer’s protocol. After treatment with sorafenib, persister cells were incubated with JC-1 (10 µg·mL−1) at 37 °C for 30 min in the dark and then washed with PBS, followed by flow cytometry analysis.
Cell proliferation and cell viability assay
Cell proliferation was measured using the MTS assay (CellTiter 96 AQueous One Solution, Promega). The MTS assay was used to test cell viability as previously reported (10). Briefly, the indicated cells were treated with various concentrations of sorafenib for 72 h and subjected to MTS assay. Then, the cell viability was calculated by the following formula: cell viability (%) = (average absorbance of treated group-average absorbance of blank)/(average absorbance of untreated group - average absorbance of blank) ×100%. The IC50 was calculated by GraphPad Prism 5 software.
Detection of apoptosis by annexin V-FITC assay
The death of the indicated cells induced by sorafenib, 2-DG or sorafenib+2-DG was analyzed with flow cytometry using annexin V/propidium iodide (PI) assays according to the manufacturer’s instructions. The cells were finally subjected to flow cytometry, and the results were analyzed using CellQuest Pro software.
Glucose uptake and lactate production
Cells in the exponential growth phase were seeded in triplicate at a density of 1×10⁶ cells/well onto 6-well plates. The culture media was collected after a 24-h incubation for the analysis of glucose and lactate levels by using an SBA-40C Biosensor (Biology Institute of the Shandong Academy of Science, Jinan, Shandong Province, China). Glucose uptake or lactate production was determined by the concentration difference between the cell culture medium and fresh medium without cells.
Hexokinase activity detection
HK2 activity was measured by using the ScienCell™ Hexokinase Assay Kit (Carlsbad, CA, USA). A total of 1×10⁵ cells were collected and washed with PBS, and 100 μL of lysis buffer was added to each sample before incubation at 4 °C for 20 min. The samples were then centrifuged at 1000× g for 10 min to remove the insoluble material. Additionally, 10 μL of sample lysate was transferred to a 96-well microplate and mixed with 90 μL of Master Mix. The HK activity signal was measured immediately with a fluorescence plate reader and recorded for 20 min.
Extracellular acidification rate and basal oxygen consumption rate
Oxygen consumption rates (OCR) and extracellular acidification rates (ECAR) were measured using an XF24 extracellular analyzer (Seahorse Bioscience, USA). Cells in the exponential growth phase were seeded in triplicate at a density of 2.5×10⁵ cells/well onto a 24-well cell culture microplate. After calibration of the analyzer, sequential compound injections, including oligomycin A, carbonyl-cyanide p-trifluoromethoxyphenylhydrazone (FCCP), antimycin A and rotenone, were applied on the microplate to test mitochondrial respiration. Sequential compound injections, including glucose, oligomycin A and 2-DG, were applied to test glycolytic activity.
Measurement of intracellular ATP levels
The level of intracellular ATP was measured by the CellTiter-Glo Luminescent Cell Viability Assay (Promega, Madison, WI, USA). A total of 5×10⁵ cells/mL were seeded in triplicate onto 6-well plates and treated with the indicated compounds for 24 h. After normalization, 100 μL of cells was transferred to a 96-well plate and mixed with 100 μL of reagents. The mixture was incubated at room temperature for 10 min before the luminescence was detected by a SYNERGY HT microplate reader.
Clonogenic assay
Hep3B persister cells were plated onto 6-well plates (500 cells/well) and treated with 2-DG 5 mM or 2 μM sorafenib or 2-DG 5 mM and 2 μM sorafenib for 72 h and then replaced with 2 mL of fresh complete growth medium. Normal medium containing 10% FBS served as a negative control. Hep3B persister cells were incubated for 12 days at 37 °C in an atmosphere containing 5% CO2. Then, the colonies were fixed with 4% paraformaldehyde (Thermo Scientific, USA) and stained with 0.1% crystal violet (Keygen Company, China). Images of the colonies were taken with the G: Box Gel Imaging Analysis System (Alpha Imager HP, USA) and analyzed by calculating the number of colonies.
Xenograft tumor growth
Female Balb/c nude mice aged 5–6 weeks were obtained from Beijing Vital River Laboratory Animal Technology Co., Ltd. All experimental procedures using these mice were performed in accordance with the protocols approved by the Institutional Laboratory Animal Care and Use Committee of SYSU University and the committee also approved the experiment (Approval No 17040H). Each mouse was inoculated s.c. in the dorsal flank with 2×10⁶ Hep3B persister cells suspended in 0.1 mL of serum-free DMEM. When the tumors reached approximately 50 mm3, the mice randomly divided into four groups, n=5 per group: 2-DG (500 mg/kg) intraperitoneally three times a week, sorafenib tosylate (5 mg/kg) orally once daily, 2-DG + sorafenib tosylate or saline. The tumors were measured every 2–3 days using calipers, and the tumor volumes were calculated using the following standard formula: width2×length×0.52.12
Database analysis
The database was used to analyze the prognostic significance of HK2 in liver cancer patients. The liver cancer patient cohort from The Cancer Genome Atlas (TCGA) database included 361 cases, including 234 cases with low HK2 expression and 147 cases with high HK2 expression. Another prognostic analysis was retrieved from the Gene Expression Omnibus (GEO) database. The data set (GSE10186) comprised 44 cases with low HK2 expression and 36 cases with high HK2 expression and was submitted by Hoshida Y et al.13 The hazard ratio was estimated by fitting a CoxPH (Surv(time, status) model using the risk group as the covariate.
Statistical analysis
The data are expressed as the means ± SEM. The difference between two groups of data was evaluated by Student’s paired t-test or two-way ANOVA, and the difference between more than two groups was evaluated by one-way ANOVA (Prism GraphPad 5.0, La Jolla, CA, USA). Survival curves were estimated by the Kaplan-Meier method, and significance was assessed by the log-rank test. p<0.05 was considered statistically significant. All statistical calculations were performed using the SPSS Statistics 16.0 software package.
Results
Persister cells are resistant to sorafenib in liver cancer
Persister cells are a small subpopulation of cells that survive cytotoxic exposure to chemotherapy or targeted drugs. First, we established Hep3B persister liver cancer cells against sorafenib. We focused our initial work on the liver cancer cell line Hep3B, which was treated for approximately 8 days with cytotoxic concentrations of the tyrosine kinase inhibitor sorafenib (10 μM). The results revealed that a small fraction of Hep3B cells (4~5%) entered a quiescent (persister) state to evade the strong selective pressure of high concentrations of sorafenib (Figure 1A, upper right panel). We tested whether our obtained persister cells were consistent with the previous observation of a reversible state of drug resistance. The removal of sorafenib (cultured the cells in sorafenib-free media for over 28 days) allowed the persister cells to regrow (Figure 1A, lower right panel). Subsequent sorafenib treatment rederived persister cells and showed that these cells reacquired sensitivity to sorafenib (Figure 1A, lower left panel). The reversibility of drug resistance in Hep3B persister cells, which is also observed in Huh7 persister cell models, is indicative of a nonmutational resistance mechanism (Figure S1). Then, we observed the rederived persister cell sensitivity to sorafenib. The results showed that persister cells were considerably more resistant to sorafenib than parental cells. We noted that the IC50 of Hep3B parental cells was approximately 3.562 μM. In contrast, the IC50 of Hep3B persister cells was approximately 9.926 μM, which is approximately 3× the IC50 of Hep3B parental cells (Figure 1B). This phenomenon has also been demonstrated in other liver cancer cells (Huh7) (Figure 1C). As our persister cells did not appear to have reverted to the original level of parental sorafenib sensitivity, we wondered what drug-resistance mechanisms they had acquired.
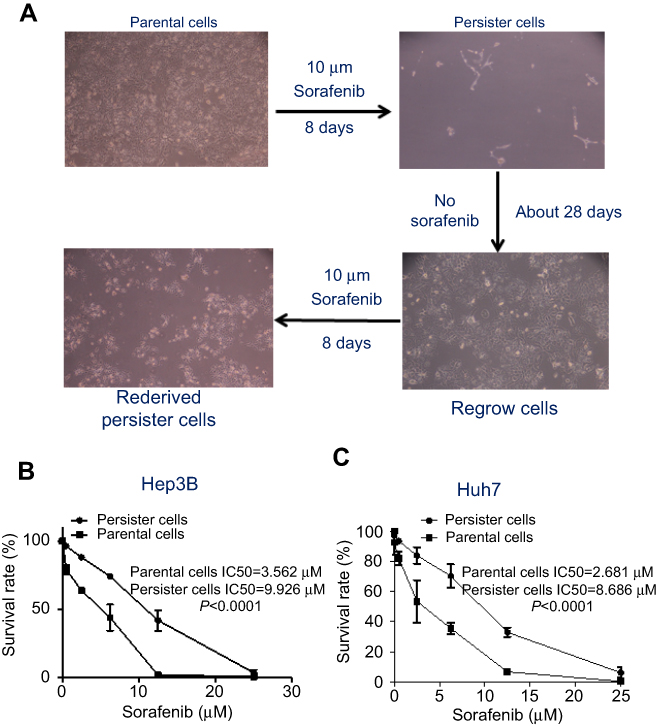 |
Figure 1 Drug-tolerant persister cells established and resistant to sorafenib. (A) A small fraction of Hep3B cells enter into a reversible, quiescent, drug-tolerant persister state in response to 8 or more days of treatment with 10 μM sorafenib. Magnification: 100×. (B) Hep3B and (C) Huh7 cells were treated with various concentrations of sorafenib for 72 h and subjected to MTS assay. The numbers above the curves indicate the IC50 of these compounds in each cell line. The results were statistically significant as shown by p-values. Error bars represent SEM. The images in (A) are representative of two independent experiments. |
Glycolysis significantly increased in liver cancer persister cells
Cancer cells generally exhibit increased Warburg effects, which are frequently associated with resistance to chemotherapeutic drugs.14,15 To investigate the sorafenib-resistance mechanism present in our liver cancer persister cells, previous reports showed that increased drug resistance is associated with reduced glucose levels, and an enhanced glycolysis phenotype prompted us to examine glycolysis by the Seahorse XF Glycolysis Stress Test. The glycolysis of parental and persister cells was detected by Seahorse XF Glycolysis Stress Test according to the instructions in the Procedures Manual. As shown in Figure 2A, the addition of glucose induced a rapid increase in ECAR by both Hep3B and Huh7 persister cells when compared to the parental cells. After the injection of 1 μM oligomycin, more lactate production and higher maximum glycolytic capacity were observed in both persister liver cancer cell lines (Figure 2B). In addition, we also demonstrated a 50% increase in glucose uptake and a 2-fold increase in lactate production in persister cells (Figure 2C).
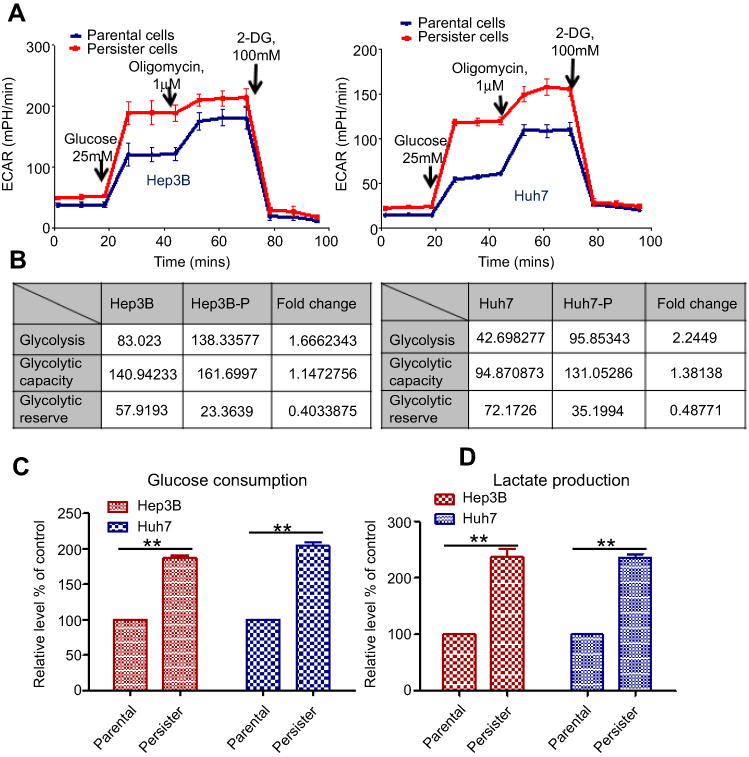 |
Figure 2 Upregulation of glycolytic activity in persister cells. (A) Pharmacological profile of the extracellular acidification rate (ECAR) was monitored with the Seahorse XF24 analyzer for 100 min. The metabolic inhibitors glucose, oligomycin A and 2-DG were injected sequentially at different time points as indicated. Left panel: Hep3B persister and parental cells. Right panel: Huh7 persister and parental cells. (B) The value and fold change in glycolysis, glycolytic capacity, and glycolytic reserve in Hep3B-persister/parental cells (left panel) and Huh7-persister/parental cells (right panel). (C) Relative levels (% of control) of glucose uptake (left panel) and lactate production (right panel) in persister cells compared with the parental Hep3B and Huh7 cells. Bars, means ± SEM. **p<0.01, n=3. Notes: Glycolysis: the process of converting glucose to pyruvate. The XF Glycolysis Stress Test presents the measure of glycolysis as the ECAR rate reached by a given cell after the addition of saturating amounts of glucose. Glycolytic Capacity: this measurement is the maximum ECAR rate reached by a cell following the addition of oligomycin, effectively shutting down oxidative phosphorylation and driving the cell to use glycolysis to its maximum capacity. Glycolytic Reserve: this measure indicates the capability of a cell to respond to an energetic demand as well as how close the glycolytic function is to the theoretical maximum of the cell. |
Hexokinases catalyze the first and irreversible step of glucose metabolism (ATP-dependent phosphorylation of glucose to yield glucose-6-phosphate).16 Hexokinase 2 (HK2) is the only major isozyme that is overexpressed in tumors and this enzyme catalyzes the first and rate-limiting reaction during glycolysis; thus, HK2 is documented as a pivotal player in the Warburg effect and is proposed as a metabolic target for cancer therapeutic development.17–19 Therefore, we detected the HK2 level in persister and parental cells. As shown in Figure 3A and B, both the mRNA and protein levels of persister cells were significantly upregulated. We also observed increased HK2 enzyme activity in persister cells compared to the parental cells (Figure 3C).
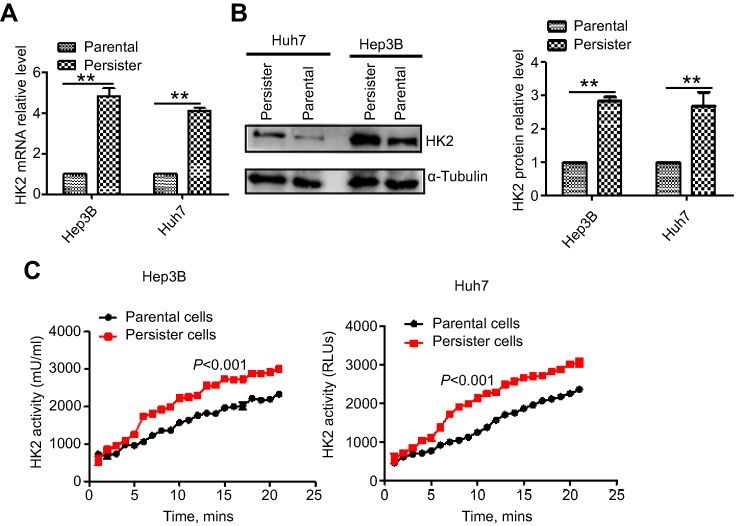 |
Figure 3 HK2 high expression in persister cells. (A) Comparison of the mRNA expression of glycolytic enzyme HK2 in parental and persister cells by real-time PCR analysis. Bars, means ± SEM. **p<0.01, n=3. (B) Immunoblotting analysis of the major glycolytic enzymes in parental and persister cells. (C) A HK2 enzyme activity assay in HK2 in parental and persister cells was performed as described in the Materials and methods section. The results were statistically significant (p<0.001). |
High levels of HK2 are closely related to poor prognosis in liver cancer
To investigate the prognostic significance of HK2 expression in liver cancer patients, we analyzed the survival time of a liver cancer patient cohort from Gene Expression Omnibus (GEO) database and The Cancer Genome Atlas (TCGA) database. We found that there was a significant association between HK2 expression and overall survival time in liver cancer patients (p=0.02184, Figure 4A) (data from GSE10186). A similar result was also observed in the liver cancer patient cohort by analyzing TCGA survival data (p=0.0003786, Figure 4B). Both results showed that high HK2 expression is associated with malignant and poor survival.
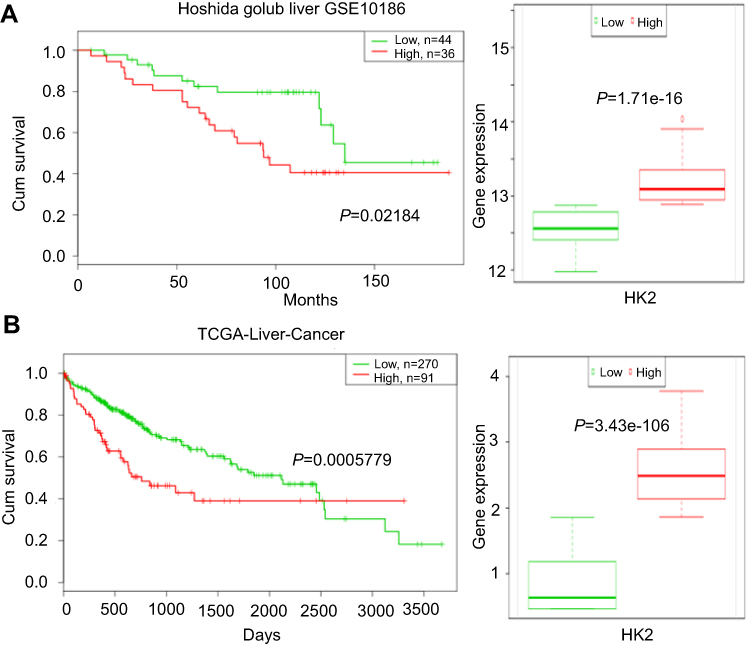 |
Figure 4 The prognostic significance of HK2 expression in liver cancer patients. Survival time and HK2 gene expression in the liver cancer patient cohort from the Gene Expression Omnibus (GEO) database (A) and The Cancer Genome Atlas (TCGA) database (B). |
The combination of glycolysis inhibitor 2-DG and sorafenib can effectively kill persister cells in vitro by reducing ATP production
The metabolic alterations observed in persister cells and the upregulation of the major glycolytic enzyme HK2 prompted us to examine whether we could overcome drug resistance in persister cells by using glycolytic inhibitors. First, we used siRNA targeting HK2 to knockdown HK2 protein expression in persister cells. Then, we detected the ECAR by using the Seahorse XF Glycolysis Stress Test. The results showed that the glycolytic capacity was significantly decreased in HK2 knockdown Hep3B-P cells (Figure 5A). 2-DG can accumulate in cells and inhibit hexokinase by producing 2-deoxyglucose-phosphate-mediated inhibition.10,20 Cells generate ATP through glycolysis and mitochondrial oxidative phosphorylation. 2-DG combined with sorafenib caused a dose-dependent depletion of cellular ATP in Hep3B-P cells at 24 h and a nearly >95% depletion when exposed to 10 mM 2-DG and 2 μM sorafenib (Figure 5B). In addition, the cytotoxicity against the persister cells to sorafenib in combination with the glycolytic inhibitors 2-DG was tested. As shown in the apoptosis assay in Figure 5C, Hep3B-P cells were treated with various drugs for 48 h and subjected to annexin-V/PI staining. The results demonstrated that 5 mM 2-DG and 10 μM sorafenib caused cell death rates of approximately 11% and 38%, respectively. However, the combination can increase the cell death rate significantly, and the inhibition rate could reach ~90%. However, 10 μM sorafenib caused massive cell death (>95%) in Hep3B cells (Figure 5C, right panel). The effect of the combination of these drugs on the colony formation of Hep3B-P cells was determined, and the results showed that the combination reduced the number of colonies significantly, while 2-DG or sorafenib alone showed no effect on this parameter (Figure 5D and E). Interestingly, the low concentration of sorafenib (2 μM) treatment seemed to promote colony formation. Then, we showed that mitochondria-associated ROS production was increased (Figure 5F, left panel) and the mitochondrial membrane potential slightly decreased (Figure 5F, right panel) after treatment with low-dose sorafenib in Hep3B persister cells. This decrease may cause mitochondrial dysfunction, as evidenced by lower OCA (Figure 5G, left panel), but compensatory ECAR was increased (Figure 5G, right panel). These results also confirmed in Huh7 persister cells (Figure S2)
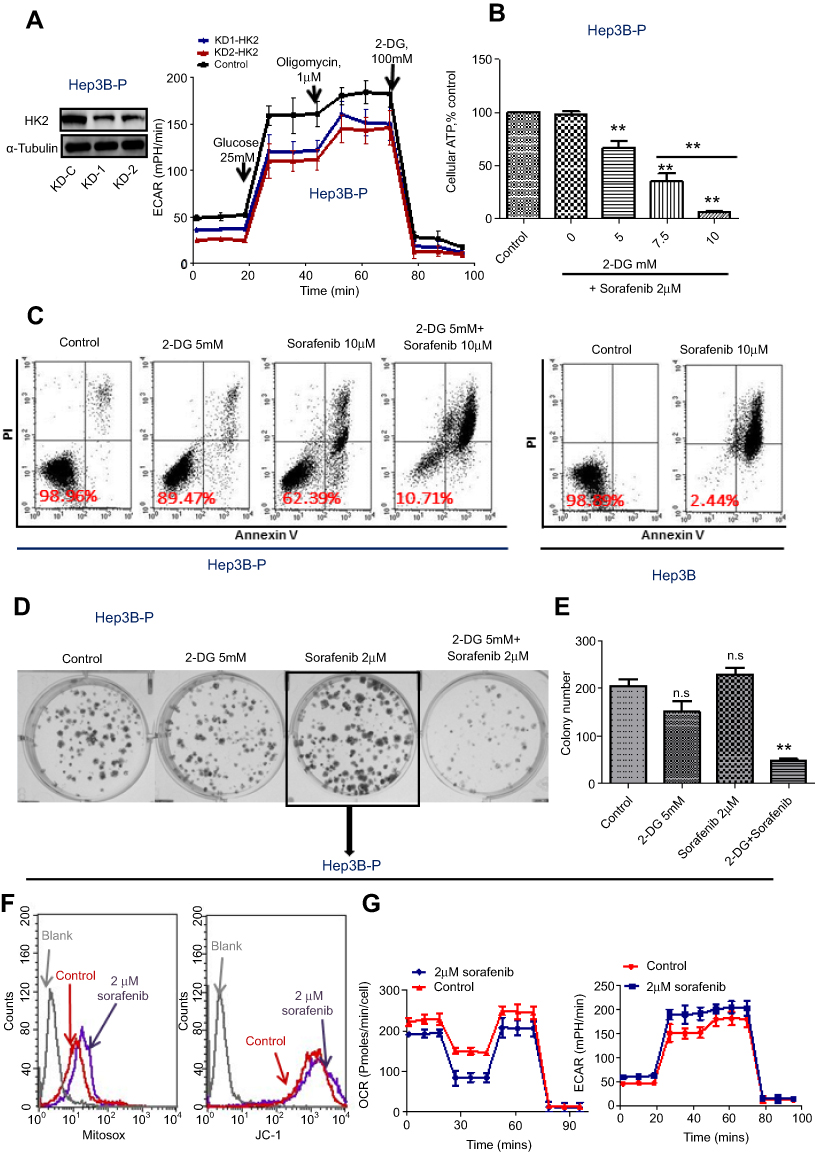 |
Figure 5 Sorafenib-persister cells are sensitive to the combination of glycolytic inhibitors 2-DG and sorafenib. (A) ECAR was monitored with a Seahorse XF24 analyzer for 100 min for HK2 knockdown persister cells. (B) Quantitative analysis of total ATP generation in the persister cells after different treatments. Bars, means ± SEM. **p<0.01, n=3. (C) Hep3B persister cells were treated with the indicated drugs for 72 h and subjected to annexin-V/PI assay. Percentage values indicate cell survival populations. (D) The colony formation assay showing cell growth inhibition of persister cells in response to the indicated treatment. Representative colony images are shown. (E) Data analysis of the number of colonies. **p<0.01, n=3. . (F) ROS generation in mitochondria (left panel) and the mitochondrial membrane potential (right panel) of persister cells after 2 μM sorafenib treatment detected by flow cytometry. (G) OCR (left panel) and ECAR (right panel) were monitored with the Seahorse XF24 analyzer in persister cells after treatment with 2 μM sorafenib for 12 h.Abbreviations: n.s, not significant; ECAR, extracellular acidification rates; OCR, oxygen consumption rates. |
The combination of the glycolysis inhibitor 2-DG and sorafenib can effectively inhibit the growth of sorafenib-tolerant persister cells in vivo
Next, we evaluated the effects of 2-DG and sorafenib on the tumorigenesis of Hep3B-P cells in vivo. Consistent with previous reports,21,22 treatment with 2-DG alone failed to suppress tumor growth (Figure 6B) or reduce tumor burden (Figure 6C and D). However, combined treatment (2-DG+sorafenib) significantly inhibited tumor growth (Figure 6B). This synergistic effect was also accompanied by decreased tumor weight (Figure 6C and D) and no weight loss (Figure 6A), which indicated that this combined treatment was well tolerated and highly efficacious against the human liver cancer persister cell xenograft model.
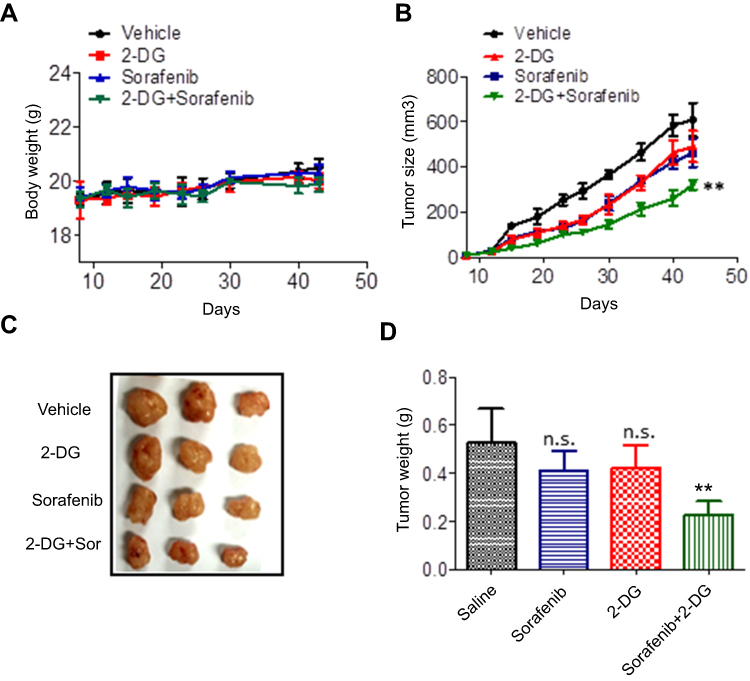 |
Figure 6 2-DG combined with sorafenib exhibits antitumor effects in persister cell xenograft tumors in vivo. (A) The body weight of Hep3B-P human liver cancer xenografts in nude mice after treatment with the indicated drugs for 43 days. (B) The tumor volume, (C) tumor image and (D) tumor weight of Hep3B-P human liver cancer xenografts in nude mice after treatment with the indicated drugs for 43 days. Bars, means ± SD. **p<0.01, n=5.Abbreviation: n.s, not significant. |
Discussion
Persister cells are nonmutational but drug-tolerant. These cells have recently gained attention for their potential role in acquired drug resistance, and they may constitute a reservoir of surviving cells from which fully drug-resistant cells eventually emerge to cause tumor relapse.23–25 Here, we have shown that both Hep3B and Huh7 persister cells acquired sorafenib resistance (Figure 1). Sorafenib, as a first-line treatment for advanced hepatocellular carcinoma (HCC), has opened a window of hope after searching for effective agents to combat HCC for decades. However, the intratumor heterogeneity of HCC results in resistance to sorafenib, which further leads to poor overall survival. Previous studies of therapy resistance have reported acquired resistance or adaptive resistance to systemic chemotherapies in different human cancers.26–29 Adaptive transcriptional responses have been well characterized to promote persister cell tolerance and cancer cell survival.24,30 One study recently proposed an alternative route for acquiring resistance via a drug-tolerant persister state.23,31,32 Ramirez et al also showed that the drug-tolerant persister state does not limit—and may even provide a latent reservoir of cells for—the emergence of heterogeneous drug-resistance mechanisms.33 Understanding the pathways that facilitate drug tolerant persister emergence is therefore critical to designing more effective combination therapies that can achieve cure.
There was a small population of quiescent surviving persister cells when the liver cancer parental cells were treated with a high concentration of sorafenib. Then, the removal of sorafenib allowed the persister cells to regrow and reacquire sensitivity to sorafenib. Subsequent sorafenib treatment rederived persister cells (Figure 1A). The reversibility of drug resistance in persister cells is indicative of a nonmutational resistance mechanism. As shown in Figure 1B and C, drug resistance emerges from drug-tolerant persisters, which was also confirmed by Ramirez et al.33
Cancer cells frequently exhibit increased glycolysis and depend largely on this metabolic pathway for the generation of ATP to meet their energy needs.34 A number of studies have identified that increased glycolysis is frequently associated with resistance to therapeutic agents.10,15 In the current study, we hypothesized that persister cells will increase dependency on glycolysis and more sensitive to glycolytic inhibition. Indeed, we showed that the two liver cancer persister cell lines both exhibited higher glycolysis and glycolytic capacity, as well as higher glucose uptake and lactate production (Figure 2). The role of HK2 in coupling ATP from oxidative phosphorylation to the rate-limiting step of glycolysis may help drive the tumor cell growth.35,36 Notably, the inhibition of HK2 has demonstrably improved the effectiveness of anticancer drugs and sensitized resistant cancer cells to chemotherapeutic agents.37–39 As expected, the HK2 level (both mRNA and protein) and HK2 enzyme activity were significantly upregulated in persister cells (Figure 3). In addition, the database analysis showed that high expression of HK2 was associated with statistically significant worse survival (p<0.05) (Figure 4). These data provide proof of principle that it is possible to use glycolytic inhibitors (especially the HK2 inhibitor) to effectively kill persister cells, overcome drug resistance and improve patient survival. The knockdown of HK2 expression effectively inhibited glycolysis (Figure 5A) but rarely caused apoptosis (data not shown). Previous studies have suggested that apoptosis is an ATP-dependent process and that the depletion of ATP tends to cause cell death.40,41 Here, we showed that treatment with different concentrations of HK2 inhibitor (2-DG) combined with 2 μM sorafenib significantly depleted cellular ATP in Hep3B persister cells in a concentration-dependent manner (Figure 5B). Furthermore, the combination of 2-DG and sorafenib also caused massive cell death (>95%) in Hep3B persister cells (Figure 5C) and inhibited colony formation (Figure 5D and E). Notably, the low concentration of sorafenib not only can’t reduce colony formation but also slightly promote colony growth. The increase in ROS levels in mitochondria likely led to the downregulation of mitochondrial membrane potential, which further resulted in mitochondrial dysfunction but was not sufficient to induce cell apoptosis (Figure 5F). Increased compensatory glycolysis upon increased ATP demand in sorafenib-treated Hep3B persister cells promoted survival and proliferation (Figure 5G). These data most likely reflect the necessity of high glycolytic metabolism to maintain sufficient ATP supply in persister cells. As such, the use of glycolytic inhibitors combined with sorafenib as anticancer agents might provide a preferred therapeutic for persister cells. Lastly, we revealed that the combined inhibition of glycolysis with 2-DG and sorafenib exerts enhanced tumor-suppressive effects in vivo. We also showed that persister cells become desensitized to sorafenib (Figure 6). Tomizawa et al have shown that 2-DG and sorafenib synergistically suppress the proliferation and motility of HCC.42 Ledoux et al showed that glucose deprivation by 2-DG can enhance P-gp expression and transport function in liver cancer cells, which might help cancer cells develop chemoresistance.43 In our study, we showed that using 2-DG alone had no antitumor effect on HCC, but whether this treatment can help cancer cells develop chemoresistance or not is still unknown. But it indicated that this combination strategy is unsuited to long-term treatment to avoid drug resistance.
Here, our study suggests that the feasibility and effectiveness of the combination of glycolytic inhibitors and sorafenib to kill persister cells and overcome drug resistance associated with high glycolysis. Eliminating, modulating or even anticipating the range of drug-resistance solutions that can emerge from the persister state will help guide the treatment of cancer. This combination strategy may have broad applications in cancer treatment by effectively eliminating persister cell formation, improving the therapeutic effect, and prolonging the survival time of the patients.
Acknowledgments
The study was supported by the National Natural Science Foundation of China (No. 81602609), the Natural Science Foundation of Guangdong (2014A030310114) and the Science and Technology Planning Project of Guangdong Province (2017ZC0109).
Disclosure
The authors report no conflicts of interest in this study.
References
1. Lohitesh K, Chowdhury R, Mukherjee S. Resistance a major hindrance to chemotherapy in hepatocellular carcinoma: an insight. Cancer Cell Int. 2018;18:44. doi:10.1186/s12935-018-0538-7. eCollection 2018.
2. Groenendijk FH, Bernards R. Drug resistance to targeted therapies: déjà vu all over again. Mol Oncol. 2014;8:1067–1083. doi:10.1016/j.molonc.2014.05.004
3. Hangauer MJ, Viswanathan VS, Ryan MJ, et al. Drug-tolerant persister cancer cells are vulnerable to GPX4 inhibition. Nature. 2017;551(7679):247–250. doi:10.1038/nature24297
4. Eso Y, Marusawa H. Novel approaches for molecular targeted therapy against hepatocellular carcinoma. Hepatol Res. 2018;48(8):597–607. doi:10.1111/hepr.13181.
5. Keating GM, Santoro A. Sorafenib: a review of its use in advanced hepatocellular carcinoma. Drugs. 2009;69(2):223–240. doi:10.2165/00003495-200969020-00006
6. Zhang Y. Screening of kinase inhibitors targeting BRAF for regulating autophagy based on kinase pathways. J Mol Med Rep. 2014;9(1):83–90. doi:10.3892/mmr.2013.1781
7. Gauthier A, Ho M. Role of sorafenib in the treatment of advanced hepatocellular carcinoma: an update. Hepatol Res. 2013;43(2):147–154. doi:10.1111/j.1872-034X.2012.01113.x
8. Dai W, Wang F, Jie L, et al. By reducing hexokinase 2, resveratrol induces apoptosis in HCC cells addicted to aerobicglycolysis and inhibits tumor growth in mice. Oncotarget. 2015;6(15):13703–13717. doi:10.18632/oncotarget.3800
9. DeWaal D, Nogueira V, Terry AR, et al. Hexokinase-2 depletion inhibits glycolysis and induces oxidative phosphorylation in hepatocellular carcinoma and sensitizes to metformin. Nat Commun. 2018;9(1):446. doi:10.1038/s41467-017-02733-4
10. Huang A, Ju HQ, Liu K, et al. Metabolic alterations and drug sensitivity of tyrosine kinase inhibitor resistant leukemia cells with a FLT3/ITD mutation. Cancer Lett. 2016;377(2):149–157. doi:10.1016/j.canlet.2016.04.040
11. Pelicano H, Martin DS, Xu RH, et al. Glycolysis inhibition for anticancer treatment. Oncogene. 2006;25(34):4633–4646. doi:10.1038/sj.onc.1209597
12. Liu X, Wang W, Samarsky D, et al. Tumor-targeted in vivo gene silencing via systemic delivery of cRGD-conjugated siRNA. Nucleic Acids Res. 2014;42(18):11805–11817. doi:10.1093/nar/gku831
13. Hoshida Y, Nijman SM, Kobayashi M, et al. Integrative transcriptome analysis reveals common molecular subclasses of human hepatocellular carcinoma. Cancer Res. 2009;69(18):7385–7392. doi:10.1158/0008-5472.CAN-09-1089
14. Xu RH, Pelicano H, Zhou Y, et al. Inhibition of glycolysis in cancer cells: a novel strategy to overcome drug resistance associated with mitochondrial respiratory defect and hypoxia. Cancer Res. 2005;65:613–621.
15. Bhattacharya B, Low SH, Soh C, et al. Increased drug resistance is associated with reduced glucose levels and an enhanced glycolysis phenotype. Br J Pharmacol. 2014;171:3255–3267. doi:10.1111/bph.12668
16. Robey RB, Hay N. Mitochondrial hexokinases, novel mediators of the antiapoptotic effects of growth factors and Akt. Oncogene. 2006;25:4683–4696. doi:10.1038/sj.onc.1209595
17. Mathupala SP, Ko YH, Pedersen PL. Hexokinase-2 bound to mitochondria: cancer’sstygian link to the “Warburg effect” and a pivotal target for effective therapy. Semin Cancer Biol. 2009;19:17–24. doi:10.1016/j.semcancer.2008.11.006
18. Vander Heiden MG. Targeting cancer metabolism: a therapeutic window opens. Nat Rev Drug Discov. 2011;10:671–684. doi:10.1038/nrd3504
19. Liu X, Wang L, Jiang W, et al. B cell lymphoma with different metabolic characteristics show distinct sensitivities to metabolic inhibitors. J Cancer. 2018;9(9):1582–1591. doi:10.7150/jca.24331
20. Chen Z, Lu W, Garcia-Prieto C, et al. The Warburg effect and its cancer therapeutic implications. J Bioenerg Biomembr. 2007;39(3):267–274. doi:10.1007/s10863-007-9086-x
21. Prasanna VK, Venkataramana NK, Dwarakanath BS, et al. Differential responses of tumors and normal brain to the combined treatment of 2-DG and radiation in glioablastoma. J Cancer Res Ther. 2009;5(Suppl 1):S44–S47. doi:10.4103/0973-1482.55141
22. Zhao X, Jiang P, Deng X, et al. Inhibition of mTORC1 signaling sensitizes hepatocellular carcinoma cells to glycolytic stress. Am J Cancer Res. 2016;6(10):2289–2298.
23. Sharma SV, Lee DY, Li B, et al. A chromatin-mediated reversible drug-tolerant state in cancer cell subpopulations. Cell. 2010;141:69–80. doi:10.1016/j.cell.2010.02.027
24. Hata AN, Niederst MJ, Archibald HL, et al. Tumor cells can follow distinct evolutionary paths to become resistant to epidermal growth factor receptor inhibition. Nat Med. 2016;22:262–269. doi:10.1038/nm.4040
25. Oxnard GR. The cellular origins of drug resistance in cancer. Nat Med. 2016;22(3):232–234. doi:10.1038/nm.4058
26. Ding L, Ley TJ, Larson DE, et al. Clonal evolution in relapsed acute myeloid leukaemia revealed by whole-genome sequencing. Nature. 2012;481:506–510. doi:10.1038/nature10738
27. Kim H, Zheng S, Amini SS, et al. Whole-genome and multisector exome sequencing of primary and post-treatment glioblastoma reveals patterns of tumor evolution. Genome Res. 2015;25:316–327. doi:10.1101/gr.180612.114
28. Kolodziejczyk AA, Kim JK, Svensson V, et al. The technology and biology of single-cell RNA sequencing. Mol Cell. 2015;58:610–620. doi:10.1016/j.molcel.2015.04.005
29. Kurtova AV, Xiao J, Mo Q, et al. Blocking PGE2-induced tumour repopulation abrogates bladder cancer chemoresistance. Nature. 2015;517:209–213. doi:10.1038/nature14034
30. Zawistowski JS, Bevill SM, Goulet DR, et al. Enhancer remodeling during adaptive bypass to MEK inhibition is attenuated by pharmacologic targeting of the P-TEFb complex. Cancer Discov. 2017;7:302–321. doi:10.1158/2159-8290.CD-16-0653
31. Dawson CC, Intapa C, Jabra-Rizk MA. ‘Persisters’: survival at the cellular level. PLoS Pathog. 2011;7(7):e1002121. doi:10.1371/journal.ppat.1002121
32. Tetsu O, Phuchareon J, Eisele DW, et al. AKT inactivation causes persistent drug tolerance to EGFR inhibitors. Pharmacol Res. 2015;102:132–137. doi:10.1016/j.phrs.2015.09.022
33. Ramirez M, Rajaram S, Steininger RJ, et al. Diverse drug-resistance mechanisms can emerge from drug-tolerant cancer persister cells. Nat Commun. 2016;7:10690. doi:10.1038/ncomms10690
34. Warburg O. The Metabolism of Tumors. London: Constable Co. Ltd; 1930.
35. Ahn KJ, Kim J, Yun M, et al. Enzymatic properties of the N- and C-terminal halves of human hexokinase II. BMB Rep. 2009;42(6):350–355. doi:10.5483/bmbrep.2009.42.6.350
36. Printz RL, Osawa H, Ardehali H, Koch S, Granner DK. Hexokinase II gene: structure, regulation and promoter organization. Biochem Soc Trans. 1997;25(1):107–112.
37. Schindler A, Foley E. Hexokinase 1 blocks apoptotic signals at the mitochondria. Cell Signal. 2013;25(12):2685–2692. doi:10.1016/j.cellsig.2013.08.035
38. Palmieri D, Fitzgerald D, Shreeve SM, et al. Analyses of resected human brain metastases of breast cancer reveal the association between up-regulation of hexokinase 2 and poor prognosis. Mol Cancer Res. 2009;7(9):1438–1445. doi:10.1158/1541-7786.MCR-09-0234
39. Peng Q, Zhou J, Zhou Q, et al. Silencing hexokinase II gene sensitizes human colon cancer cells to 5-fluorouracil. Hepatogastroenterology. 2009;56(90):355–360.
40. Leist M, Single B, Castoldi AF, Kühnle S, Nicotera P. Intracellular adenosine triphosphate (ATP) concentration: a switch in the decision between apoptosis and necrosis. J Exp Med. 1997;185:1481–1486. doi:10.1084/jem.185.8.1481
41. Lelli JL
42. Tomizawa M, Shinozaki F, Motoyoshi Y, et al. 2-Deoxyglucose and sorafenib synergistically suppress the proliferation and motility of hepatocellular carcinoma cells. Oncol Lett. 2017;13(2):800–804. doi:10.3892/ol.2016.5510
43. Ledoux S, Yang R, Friedlander G, Laouari D. Glucose depletion enhances P-glycoprotein expression in hepatoma cells: role of endoplasmic reticulum stress response. Cancer Res. 2003;63(21):7284–7290.
Supplementary materials
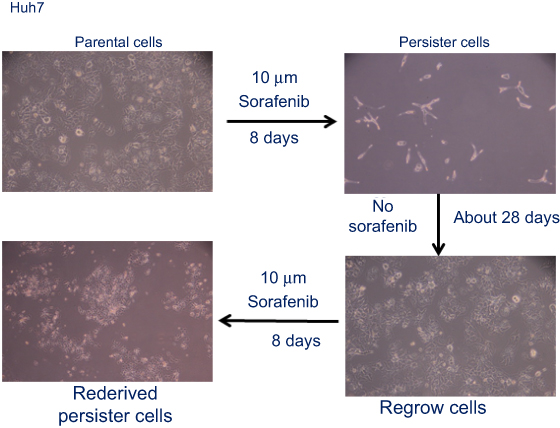 |
Figure S1 Drug-tolerant persister cells established and resistant to sorafenib. A small fraction of Huh7 cells enter into a reversible, quiescent, drug-tolerant persister state in response to 8 or more days of treatment with 10 μM sorafenib. Magnification: 100×. |
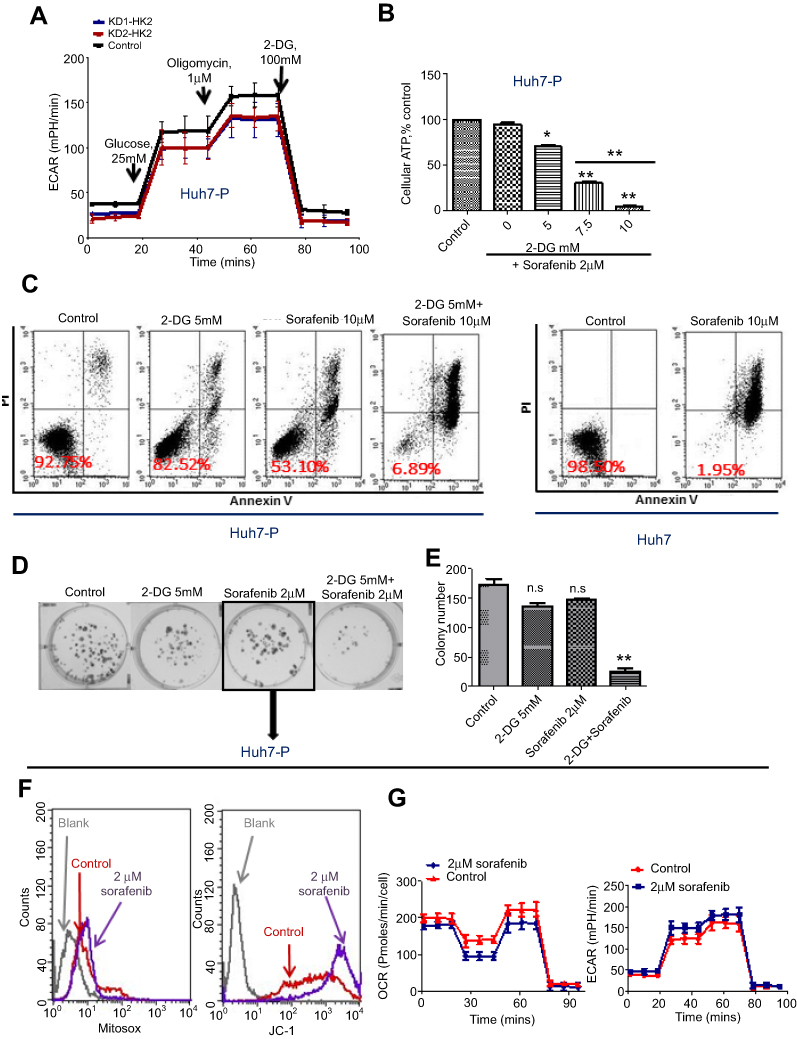 |
Figure S2 Sorafenib-persister cells are sensitive to the combination of glycolytic inhibitors 2-DG and sorafenib. (A) ECAR was monitored with a Seahorse XF24 analyzer for 100 min for HK2 knockdown Huh7 persister cells. (B) Quantitative analysis of total ATP generation in the persister cells after different treatments. Bars, means ± SEM. **p<0.01, n=3. (C) Huh7 persister cells were treated with the indicated drugs for 72 h and subjected to annexin-V/PI assay. Percentage values indicate cell survival populations. (D) The colony formation assay showing cell growth inhibition of Huh7 persister cells in response to the indicated treatment. Representative colony images are shown. (E) Data analysis of the number of colonies. **p<0.01, n=3. (F) ROS generation in mitochondria (left panel) and the mitochondrial membrane potential (right panel) of Huh7 persister cells after 2 μM sorafenib treatment detected by flow cytometry. (G) OCR (left panel) and ECAR (right panel) were monitored with the Seahorse XF24 analyzer in Huh7 persister cells after treatment with 2 μM sorafenib for 12 h.Abbreviations: n.s, not significant; ECAR, extracellular acidification rates; OCR, oxygen consumption rates. |
 © 2019 The Author(s). This work is published and licensed by Dove Medical Press Limited. The full terms of this license are available at https://www.dovepress.com/terms.php and incorporate the Creative Commons Attribution - Non Commercial (unported, v3.0) License.
By accessing the work you hereby accept the Terms. Non-commercial uses of the work are permitted without any further permission from Dove Medical Press Limited, provided the work is properly attributed. For permission for commercial use of this work, please see paragraphs 4.2 and 5 of our Terms.
© 2019 The Author(s). This work is published and licensed by Dove Medical Press Limited. The full terms of this license are available at https://www.dovepress.com/terms.php and incorporate the Creative Commons Attribution - Non Commercial (unported, v3.0) License.
By accessing the work you hereby accept the Terms. Non-commercial uses of the work are permitted without any further permission from Dove Medical Press Limited, provided the work is properly attributed. For permission for commercial use of this work, please see paragraphs 4.2 and 5 of our Terms.