")
Back to Journals » Diabetes, Metabolic Syndrome and Obesity » Volume 13
The Clinical Utility of Salivary Biomarkers in the Identification of Type 2 Diabetes Risk and Metabolic Syndrome
Authors Desai P , Donovan L , Janowitz E , Kim JY
Received 3 June 2020
Accepted for publication 4 September 2020
Published 9 October 2020 Volume 2020:13 Pages 3587—3599
DOI https://doi.org/10.2147/DMSO.S265879
Checked for plagiarism Yes
Review by Single anonymous peer review
Peer reviewer comments 2
Editor who approved publication: Prof. Dr. Antonio Brunetti
Priya Desai, Lorin Donovan, Elizabeth Janowitz, Joon Young Kim
Department of Exercise Science, Syracuse University, Syracuse, NY, USA
Correspondence: Joon Young Kim
Department of Exercise Science, Syracuse University, Women’s Building 204E, 820 Comstock Ave, Syracuse, NY 13244, USA
Tel +1 315-443-1411
Fax +1 315-443-9375
Email [email protected]
Abstract: Type 2 diabetes is traditionally diagnosed by the use of an oral glucose tolerance test and/or HbA1c, both of which require serum collection. Various biomarkers, which are measurable biological substances that provide clinical insight on disease state, have also been effective in the early identification and risk prediction of inflammatory diseases. Measuring biomarker concentrations has traditionally been obtained through serum collection as well. However, numerous biomarkers are detectable in saliva. Salivary analysis has more recently been introduced into research as a potential non-invasive, cost-effective diagnostic for the early identification of type 2 diabetes risk in adults and youth. Therefore, the purpose of this review was to compare 6 established inflammatory biomarkers of type 2 diabetes, in serum and saliva, and determine if similar diagnostic effectiveness is seen in saliva. A lack of standardized salivary analysis, processing, and collection accounts for errors and inconsistencies in conclusive data amongst studies. Proposing a national standardization in salivary analysis, coupled with increased data and research on the utility of saliva as a diagnostic, poses the potential for salivary analysis to be used in diagnostic settings.
Keywords: saliva, inflammation, type 2 diabetes, biomarkers, metabolic syndrome, oxidative stress
Introduction
Type 2 diabetes is a chronic metabolic disorder characterized by a progressive loss of ß-cell function relative to insulin resistance, resulting in persistent hyperglycemia.1–4 A complex interplay between genetics and environment attribute to the development of type 2 diabetes, with increased adiposity, energy-dense diet, physical inactivity, and low socioeconomic status being risk factors.5 Development of insulin resistance is associated with low-grade inflammation, which can be induced by oxidative stress mediators and pro-inflammatory mediators such as cytokines and adipocytokines.6,7 Furthermore, altered inflammatory cytokine profiles are commonly reported in diabetic patients, suggesting that heightened inflammation plays a vital role in the pathophysiology of type 2 diabetes.7–9
The global and national prevalence of type 2 diabetes is substantial. In 2019, 463 million cases of diabetes were estimated globally,10 with studies suggesting that by the year 2025–2030 incidence of type 2 diabetes cases will increase an additional 130–200 million cases globally.11–13 According to the CDC, more than 34 million Americans have diabetes, with 90–95% being type 2 diabetes.14 Moreover, the CDC’s most recent data show approximately 71.6% of adults over 20 years old in the United States are overweight or obese, and 20.6% of youth age 12–19 are obese, putting them at higher risk for type 2 diabetes (https://www.cdc.gov/obesity/data/index.html). In parallel with the widespread pediatric obesity epidemic, type 2 diabetes, once thought to be an adult disease, is increasing evidently in obese youth.4,15 In recent years, as many as 5000 new cases of youth type 2 diabetes are reported per year in the United States, with disproportionate burden on racial and ethnic minorities.15 Additionally, mortality is a major cause of concern for individuals diagnosed with diabetes. Per the CDC, type 2 diabetes was the seventh leading cause of death in the United States in 2019, with 83,564 total deaths (https://www.cdc.gov/nchs/data/nvsr/nvsr68/nvsr68_09-508.pdf). Likewise, the economic burden of diabetes is massive. In 2017, diagnosed diabetes of all ages, undiagnosed diabetes and prediabetes in adults, and gestational diabetes treatment reached a combined $404 billion in the United States, totaling an annual burden of $13,240 per diagnosed patient.10,16 Given its high mortality, cost, and prevalence, type 2 diabetes carries a significant burden on the healthcare system, with an urgent need for expanded treatment and early identification of individuals at high-risk.
Interestingly, biomarkers provide great contributions in understanding the etiology of diseases, monitoring treatment, and providing information with respect to risk prediction, disease prevention, and early intervention.17,18 In recent years, biomarkers have been a prospective area of research, specifically, novel plasma and serum biomarkers of type 2 diabetes.19,20 Numerous biomarkers have displayed strong, positive correlations to type 2 diabetes, and are now recognized as risk factors. As such, these parameters have been obtained exclusively through drawing blood. Given the invasive nature of needles, along with a potential blood-injection-injury phobia in patients, and especially children, this introduces the question of whether there are less-invasive measures that can be introduced in clinical settings in order to obtain biomarker concentrations.
More recently, saliva sampling has been introduced into research as a potential indicator of type 2 diabetes risk. Numerous molecular components are detectable in saliva; however, its effectiveness and utility in clinical and diagnostic settings is not well known. Thus, the purpose of this review was to compare several established biomarkers of type 2 diabetes, in serum and saliva, and determine if similar effectiveness is seen in saliva, including adiponectin, leptin, C-reactive protein (CRP), interleukin-6 (IL-6), tumor necrosis factor-alpha (TNF-α), and 1,5-anhydroglucitol (1,5-AG).
Methods
Search Strategy
This scientific literature review conducted until May 2020 was executed using the following databases: Pubmed, Google Scholar, Science Direct, Proquest, Elsevier, Scopus, and Embase. The literature search was limited to papers in English language with defined data collection and analysis. The reference section of the articles included were further screened for relevant additional sources. A total of six biomarkers were selected based on relevance in research related to type 2 diabetes and metabolic syndrome (Figure 1). The primary search strategy was conducted using the following terms: saliva, biomarkers, type 2 diabetes, adiponectin, leptin, C-reactive protein, interleukin-6, tumor necrosis factor-alpha, 1,5-anhydroglucitol, and inflammation.
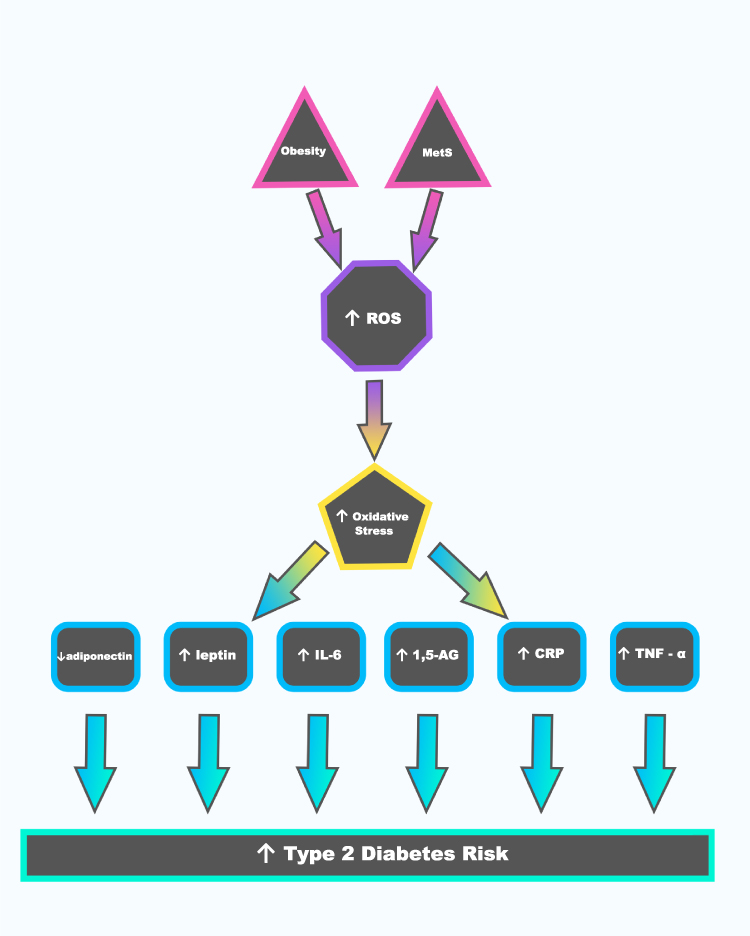 |
Figure 1 Linkage between obesity, metabolic syndrome, inflammation, and type 2 diabetes. |
Saliva
Saliva is an antimicrobial oral fluid produced and secreted by salivary glands that contains a variety of molecular components, such as water, proteins, enzymes, hormones, growth factors, metabolites, immunoglobulins, vitamins, and electrolytes.21–25 Saliva has a variety of functions, including lubrication of the oral cavity, binding of masticated food, initiation of digestion through starch breakdown by salivary amylase, and oral hygiene.23,26 To date, standardization of saliva collection and analyzation has not been introduced. Generally, unstimulated whole saliva (UWS) is collected, centrifuged, and stored at −80°C until analyzation using an enzyme-linked immunosorbent assay (ELISA) test or commercial enzyme immunoassay kit.27–29
Prior to our review of six inflammatory biomarkers, we have acknowledged any possibilities regarding the limitations of salivary biomarkers that could be affected by dental health. A total of 10 previous literatures that compared salivary samples and blood biomarkers of inflammation were mainly included in this review (Table 1); however, only two studies addressed oral health by including participants with periodontitis while the remaining studies did not.30,31 It is noted that saliva plays a role in the maintenance of dental health to prevent dental caries.32 In other words, poor dental health often results from reduced salivary flow.32 Collectively, poor dental health may potentially affect salivary composition, thereby suggesting that any future research involving salivary collection should address the dental health status of the participants.
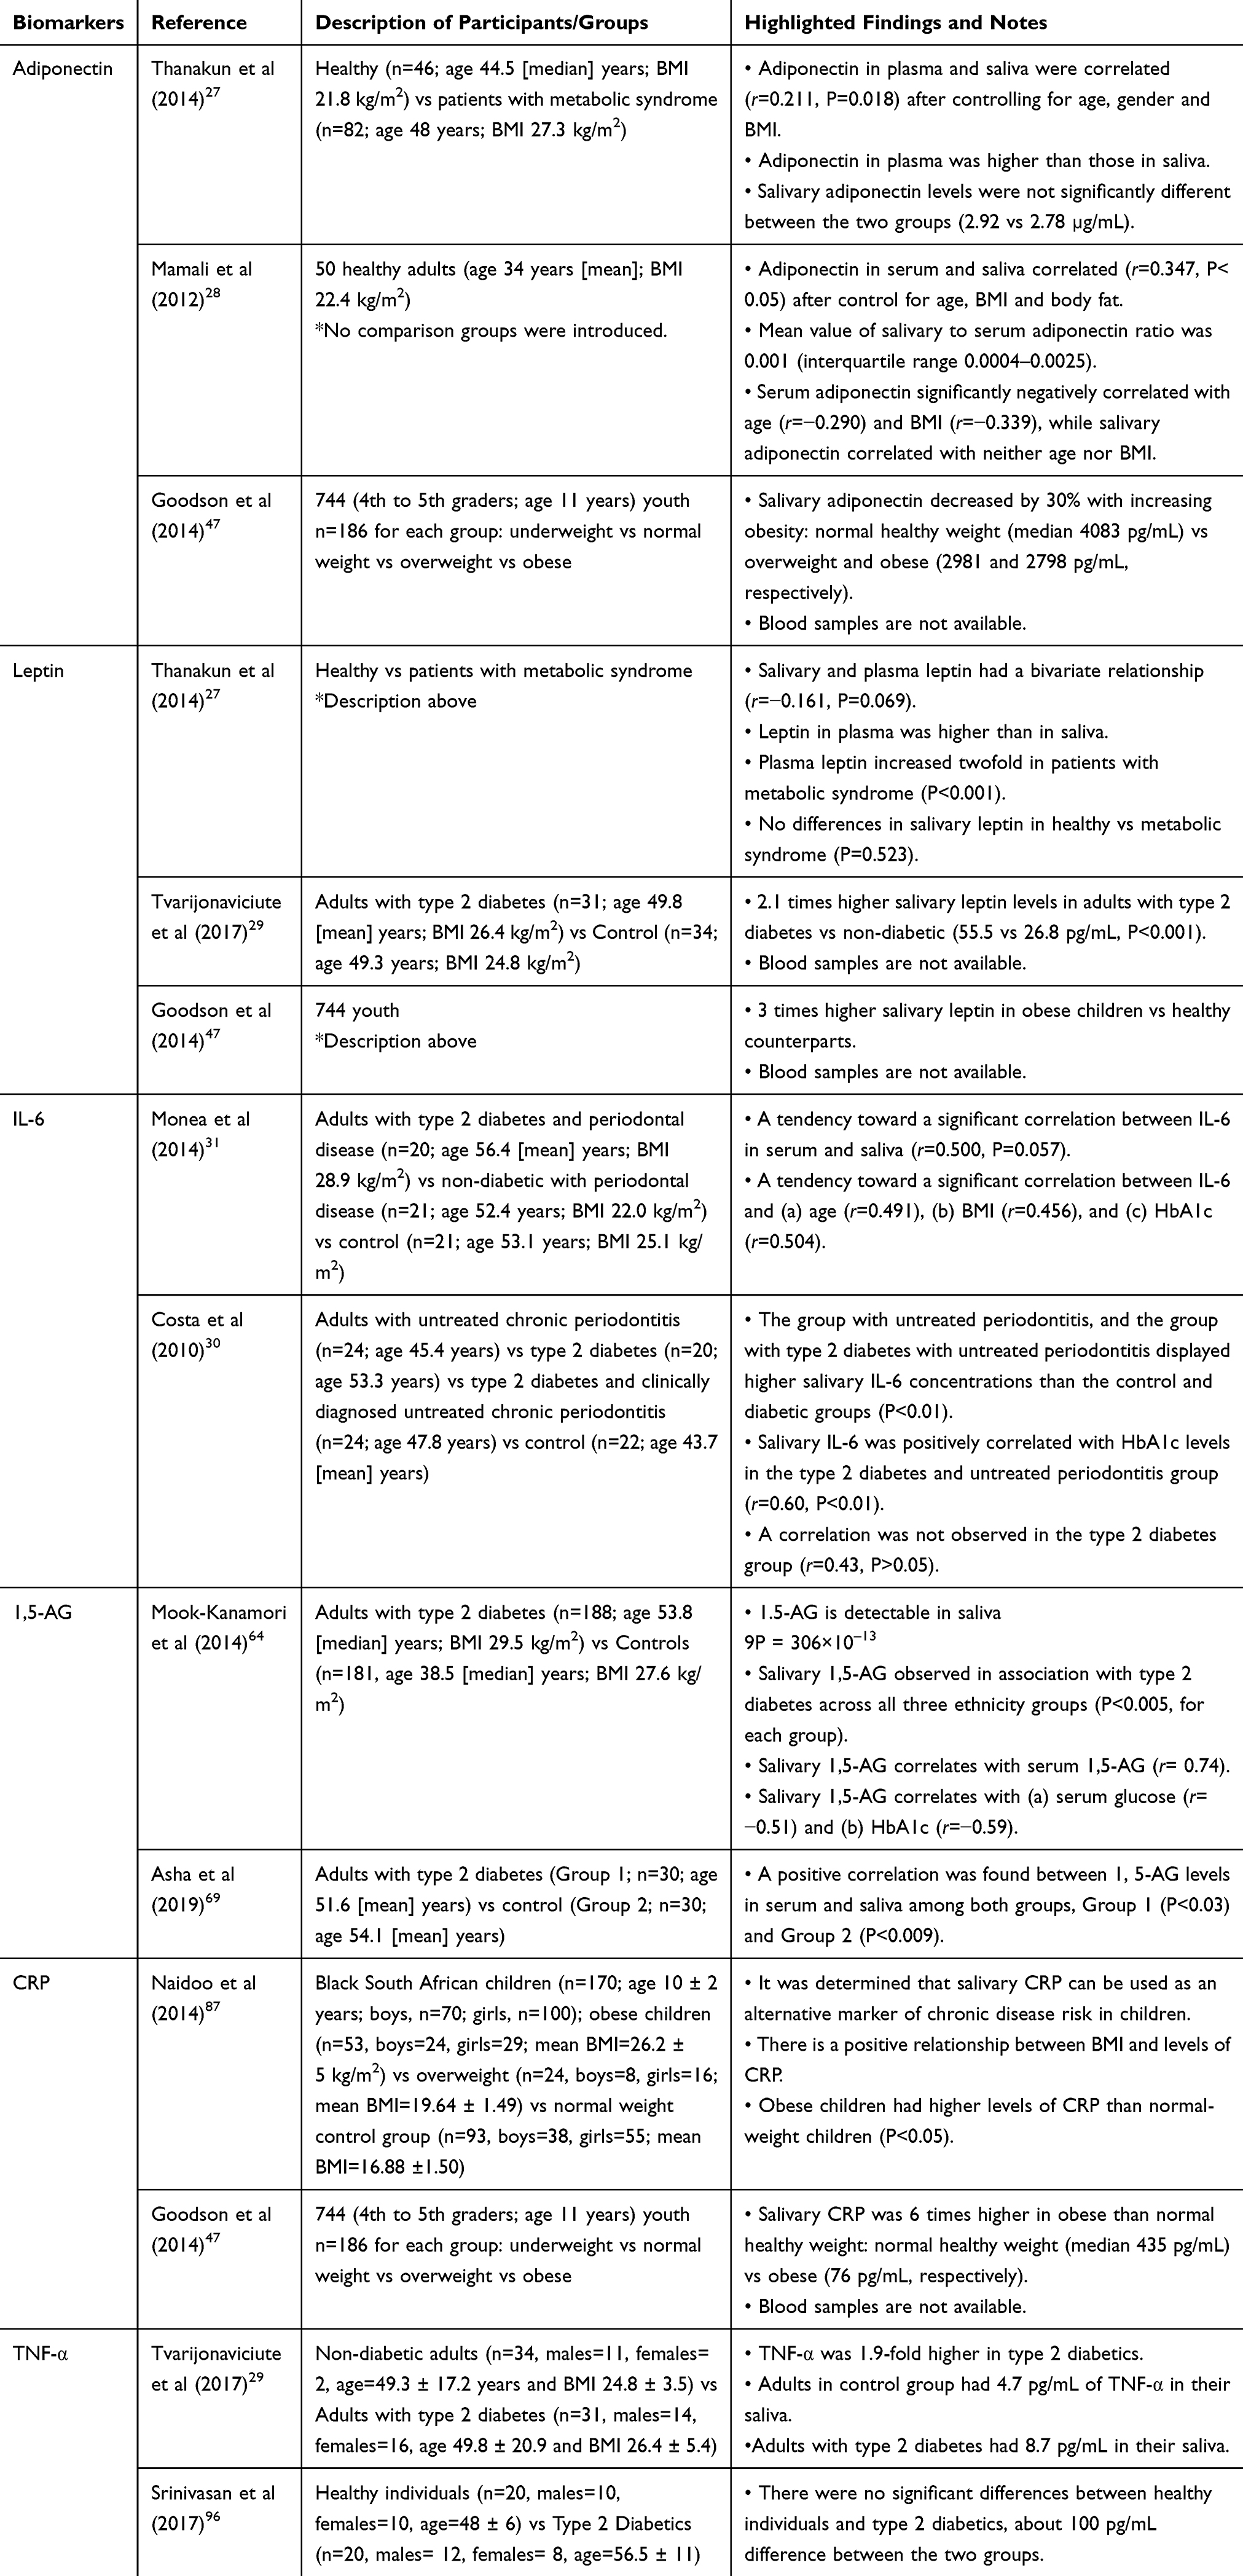 |
Table 1 Review of Six Biomarkers |
Review of Six Inflammatory Biomarkers
Adiponectin
Adiponectin is an adipose-derived plasma protein strictly secreted by adipocytes.33–35 It is an anti-inflammatory adipokine that functions in sensitizing insulin action and regulating glucose and lipid metabolism.35,36 In healthy individuals, plasma adiponectin is abundant in circulation, accounting for approximately 0.01% of total plasma protein.37,38 Adiponectin is anti-diabetic, as it increases insulin sensitivity by inhibiting hepatic glucose production and promoting fatty acid oxidation.36,39 Additionally, it is considered an anti-atherogenic hormone, due to its suppression of atherosclerotic events and promotion of vasodilation.40 Low plasma concentrations of adiponectin have notably been reported in overweight and obese individuals.41 Adiponectin is inversely correlated with visceral adiposity, a component of metabolic syndrome and an important determinant of insulin sensitivity, and positively correlated to high-density lipoprotein (HDL).35,41,42 Furthermore, individuals with metabolic syndrome reported a 15–44% decreased plasma adiponectin level than in controls, with each study reporting the metabolic syndrome patients having a higher BMI and waist circumference than the control group.43,44 A number of studies reported hypoadiponectinemia resulting in insulin resistance and type 2 diabetes.45,46 Likewise, low plasma adiponectin concentration increases the risk of type 2 diabetes, suggesting adiponectin as a potential biomarker for type 2 diabetes (Figure 1).
To date, few studies exist in the salivary analysis of adiponectin in relation to type 2 diabetes risk in both youth and adults. Goodson et al47 studied metabolic disease risk in children by salivary biomarker analysis (Table 1). The proposal of this study was to test a non-invasive approach to study inflammatory parameters in at-risk children. A total of 744 eleven-year-old children were selected from underweight, normal-weight, overweight, and obese categories (n=186 for each sub-group).47 Results showed that salivary adiponectin concentrations were 30% lower in obese children compared with their healthy counterparts (P<0.0001). Median and interquartile ranges (pg/mL) for salivary adiponectin were obtained, respectively: Underweight: 4421, 6424 (M) and 5060, 4573 (F); Normal weight: 4220, 5303 (M), and 3994, 5052 (F). Overweight: 2402, 3785 (M), and 3322, 3693(F). Obese: 2548, 2779 (M) and 3062, 3752 (F).47 Given their findings for salivary adiponectin, along with additional promising correlations with several other biomarkers tested, there is a potential to use salivary biomarker analysis as a non-invasive tool for diabetes risk. However, to date, findings have not been consistent. Thanakun et al27 compared both salivary and plasma adiponectin and leptin concentrations in 46 healthy participants and 82 patients with newly diagnosed metabolic syndrome (Table 1). Total plasma adiponectin (μg/mL) was 2.3 times higher in the control group than the metabolic syndrome patients (P<0.001).27 In contrary to the results from the blood, total salivary adiponectin was similar between the two groups (Control: 2.92 μg/mL; Metabolic Syndrome: 2.78 μg/mL), with additional results showing no correlation between salivary concentrations of adiponectin and metabolic syndrome.27 However, despite the observations that adiponectin in plasma was 11.0 times higher than in saliva in the control group and 5.0 times higher in the metabolic syndrome group (P<0.001), a positive correlation between salivary and plasma adiponectin was observed (r=0.211, P=0.018).27 Collectively, this study concluded that only plasma adiponectin may be useful for the prediction of metabolic syndrome. Similarly, Mamali et al28 studied the measurement of salivary resistin, visfatin and adiponectin levels with the purpose of evaluating their associations with serum levels (Table 1). Resistin, visfatin, and adiponectin were measured in both serum and saliva of 50 healthy adult volunteers (17M, 33F).28 Mean serum and salivary adiponectin levels were 12.27 μg/mL (interquartile range 8.15–14.70) and 10.92 ng/mL (interquartile range 3.22–28.71), respectively.28 Levels of adiponectin in saliva and serum showed a significant correlation (r=0.347, P<0.05), confirming their association to each other.28 Data from this study suggest that salivary adiponectin may be combined with serum adiponectin in the field of research for clinical conditions such as obesity, insulin resistance, energy imbalance, and more, given more research is conducted with advanced technical procedures with standardized analytical tools. From the previous literatures, there is a common agreement on the significant correlation between salivary and plasma adiponectin concentrations.28,47
Leptin
Leptin is a pro-inflammatory, adipose-derived hormone that is mainly secreted by adipocytes as well as in the stomach, placenta, vascular smooth muscle cells, and cardiomyocytes.48,49 Leptin receptors are located in the hypothalamus, pancreas, kidneys, liver, and heart.50,51 Leptin functions as a satiety signal in the hypothalamus to regulate body weight and metabolism, with low postprandial levels, and high levels during hunger.48,49 It mediates the suppression of thyroid hormone, growth hormone, and reproductive hormones.49 Hyperleptinemia is seen exclusively in obese humans, with obese individuals showing resistance to the effects of leptin on appetite.49 A number of studies have reported elevated leptin concentrations in obese individuals, type 2 diabetics, and patients with metabolic syndrome (Figure 1).52–54 Metabolic syndrome participants are shown to have dramatically higher serum leptin concentration levels, with studies reporting a 56–237% increase in serum leptin concentrations in participants with metabolic syndrome vs controls.44,54,55 Obese diabetic patients report a 31–54% increase in serum leptin levels than non-obese diabetic patients.52,56 Additionally, drastic differences are seen in serum leptin concentrations between obese and normal-weight participants, with studies showing an average 318% increase in serum leptin concentrations in obese participants.53,57
In contrast to the aforementioned studies focusing on the leptin concentrations in blood, conclusive findings on salivary leptin are limited. Tvarijonaviciute et al29 conducted a pilot study on leptin in the saliva of adults (n=65; 34 control and 31 type 2 diabetics) (Table 1). The aims of this study were to compare salivary concentrations of leptin in patients with type 2 diabetes and healthy participants, examine the changes that occur in the saliva of type 2 diabetic patients, and determine the potential of finding additional biomarkers to identify patients at greater risk of developing type 2 diabetes.29 Results showed that salivary leptin was 2.1 times higher in the adults with type 2 diabetes compared with non-diabetic adults (P<0.001).29 Additionally, leptin was positively correlated with insulin and pro-inflammatory cytokines (r=0.393), suggesting salivary leptin be further explored as a non-invasive biomarker of type 2 diabetes.29 Similar to the aforementioned study, Goodson et al47 showed promising results in 744 children with salivary leptin demonstrating a threefold increase in obese children compared to their healthy counterparts (Table 1). Furthermore, Thanakun et al27 compared salivary and plasma adiponectin and leptin concentrations, as noted previously. Leptin concentration was higher in plasma (total plasma=6.04 ng/mL in healthy, 13.23 ng/mL in T2D) than in saliva (total saliva=33.80 pg/mL in healthy, and 34.88 pg/mL in T2D), (P<0.001).27 Salivary and plasma leptin had a tendency toward significant bivariate relationship (r=−0.161, P=0.069).27 Plasma leptin increased twofold in patients with metabolic syndrome (P<0.001); however, salivary leptin showed no differences between healthy participants and metabolic syndrome patients.27 Body mass index and high-density lipoprotein cholesterol were associated with a high level of plasma leptin (OR = 1.621; 95% CI 1.212–2.168 and OR = 0.966; 95% CI 0.938–0.996).27 A significant correlation was found between the salivary adiponectin/salivary leptin ratio and plasma adiponectin (r=0.371, P<0.001); however, no association with metabolic syndrome was found.27 It should be noted that such inconsistent results could be potentially caused by the heterogeneity of study design (i.e. participant characteristics and methodological protocols).27,29,47 Two studies included adult participants,27,29 whereas Goodson et al examined children only.47 Furthermore, Goodson et al conducted their study based on increasing weight status, not diabetic status.47 Taken together, it is not conclusive that salivary leptin is useful in the prediction of metabolic syndrome.
1,5-Anhydroglucitol (1,5-AG)
1,5-AG is a monosaccharide similar in molecular structure to glucose that is maintained at high concentrations in circulation under normal physiological conditions via filtration by the kidneys and reabsorption into the blood.58–62 1,5-AG is commonly used to measure short-term glucose status and hyperglycemia.58,60,63 Studies report a 35–58% decrease in concentrations of 1,5-AG in type 2 diabetics versus healthy controls.64,65 Decreased serum concentrations of 1,5-AG result from its ability to be reabsorbed by renal tubules, a process inhibited by glucosuria.58,60,64 The greater the degree of glucosuria, the lower the amount of 1,5-AG present in circulation, and the greater the amount of glucose in blood.58,60,64,66 Moreover, increased serum glucose concentrations are associated with limited glucose reabsorption by the kidneys in diabetic patients.58,60,64
To date, limited data exist on salivary 1,5-AG and its associate to type 2 diabetes. 1,5-AG is a reliable marker for glycemic control in serum, with detectable concentrations in saliva,58,60,64,67,68 suggesting its potential use as an noninvasive marker for screening at-risk diabetic patients. Mook-Kanamori et al64 conducted a cross-sectional study on salivary metabolic biomarkers of type 2 diabetes with the objective of identifying a non-invasive metabolic marker of type 2 diabetes (Table 1). A total of 188 type 2 diabetic patients and 181 controls of Arab and Asian ethnicities was included (n=369), testing a total of 2178 metabolites in their saliva, plasma, and urine.64 After the standardization and adjusting for covariates, a mere total of 94 metabolites were significantly associated with type 2 diabetes (after Bonferroni correction, P<0.000023).64 Notably, only 3 of the 94 metabolites were detectable in saliva, with 1.5-anhydroglucitol (P=3.6×10⁻¹³) being one of them.64 Salivary 1,5-AG’s association to type 2 diabetes was observed equally across all three ethnicity groups (P<0.005, for each group) and 1,5-AG in saliva correlates with 1,5-AG in serum (r=0.74), while it anti-correlates with serum glucose (r=−0.51) and HbA1c (r=−0.59).64 It was concluded that salivary 1,5-AG can be used in national screening programs for undiagnosed diabetes. Moreover, Asha et al evaluated 1,5-AG as a salivary biomarker in type 2 diabetes patients (60 participants were recruited and divided into two groups) (Table 1).69 The first group consists of 30 adult participants that have HbA1c-confirmed type 2 diabetes and the second group consists of 30 healthy adult controls confirmed by HbA1c.69 The relationship between salivary and serum 1,5‐AG levels in both groups was found using the Spearman correlation test.69 A moderate, positive correlation between 1,5-AG levels in serum and saliva was found among both groups (P<0.03 and 0.009, respectively).69 Statistical analysis of the obtained data found that the group with type 2 diabetes demonstrated decreased salivary and serum concentrations of 1,5-AG compared to the healthy group.69 As such, the study concludes that serum 1,5-AG levels can be predicted when using salivary 1,5-AG levels. Despite the limited number of studies on salivary 1,5-AG as a diabetes risk, consistent findings from the studies reviewed here would potentially suggest that salivary 1,5-AG levels can be used as a biomarker for increased risk of type 2 diabetes.64,69
Interleukin-6 (IL-6)
IL-6 is a pro-inflammatory cytokine involved in the formation and progression of diabetic dyslipidemia and hyperinsulinemia.9,70,71 Studies report a 47–76% increase in serum IL-6 concentrations in type 2 diabetic patients compared to healthy controls.9,71 Likewise, altered IL-6 profiles are reported in conditions associated with the pathophysiology of type 2 diabetes (Figure 1), such as inflammation,9,30,71 insulin resistance,30,72–74 and β-cell dysfunction.74,75 Moreover, IL-6 utilizes classic and trans-signaling pathways, where classic signaling utilizes anti-inflammatory and regenerative processes, and trans-signaling utilizes pro-inflammatory responses.74,76 Elevated circulating levels of IL-6 lead to an inflammatory response, which poses concern, as a chronic, low-grade inflammatory state is associated with the pathogenesis of type 2 diabetes.9,30,71,73,74
Research on salivary IL-6 as a biomarker is emerging. Monea et al31 examined IL-6 as a salivary biomarker in three subgroups of patients (Table 1). Twenty adult participants with type 2 diabetes and periodontal disease, 21 systemically healthy adult participants with periodontal disease, and 21 healthy adult participants were enrolled (n=62). Salivary IL-6 levels were highest (91.1 ± 36.9 pg/mL) in patients with type 2 diabetes and periodontal disease, and the healthy controls showed the lowest (7.4 ± 2.5 pg/mL) concentration of salivary IL-6 (P<0.0001).31 A significant correlation was found between salivary and serum IL-6 concentrations (r=0.500, P=0.057) after Spearman’s nonparametric test was applied.31 It was hypothesized that cells, in diabetic patients, exert a stronger inflammatory response compared to controls. The data obtained confirmed their hypothesis. However, these findings have not been consistent amongst studies. Costa et al30 analyzed salivary IL-6 in patients with periodontal disease and type 2 diabetes (Table 1). Ninety adult participants were enrolled and categorized into four groups; healthy (n=22), untreated periodontitis (n=24), type 2 diabetes (n=20, glycated hemoglobin [HbA1c] test >6%), and untreated periodontitis and type 2 diabetes (n=24).30 All subjects in the untreated periodontitis or type 2 diabetes groups were receiving insulin and/or oral hypoglycemic agents. The untreated periodontitis, and untreated periodontitis and type 2 diabetes groups exhibited higher salivary IL‐6 concentrations than the control and diabetic groups (P<0.01).30 Thus, elevated salivary IL‐6 concentrations are reported in patients with periodontitis independent of diabetic status. However, given that Costa et al30 examined patients with untreated periodontitis with or without type 2 diabetes, there might be a possibility that salivary IL-6 concentrations were overestimated. Such possibility could explain inconsistent results among the studies described above. Additional studies on salivary IL-6 in relation to type 2 diabetes risk are required to draw a conclusion on its clinical utility.
C-Reactive Protein (CRP)
CRP is a liver-derived, sensitive and systematic biomarker of low-grade inflammation that is commonly used to predict type 2 diabetes (Figure 1).77–79 Elevated CRP can contribute to inflammatory responses by activating complement proteins, which can lead to an increase in the production of thrombogenic components, which are bound to the membranes of injured vascular cells, thus contributing to the development of insulin resistance.80,81 Furthermore, CRP is regulated by pro-inflammatory cytokines, like IL-6 and TNF-α, that have correspondingly been reported as elevated in diabetic patients.80,81 Altered profiles of these regulatory cytokines can directly impact CRP concentrations as well.81–83 Elevated CRP concentrations can result from insufficient insulin-induced suppression of CRP synthesis.81–83 CRP has shown to be effective in the risk identification of type 2 diabetes in all races, genders, and ages.77,78,80–82,84 Moreover, studies report type 2 diabetic participants having a 41–125% increase in serum CRP concentrations compared to non-diabetic patients.77,79,84 Inconsistencies exist regarding the relationship between CRP concentrations and BMI; however, a number of studies have found a significant correlation between the two.77,79,84 Strikingly, non-diabetic participants who later developed type 2 diabetes had elevated baseline median CRP levels, suggesting CRP as a potential biomarker of type 2 diabetes.77–79,84
Contrary to the well-established data of serum CRP, there is an increasing interest in measuring salivary CRP as a less invasive diagnostic tool.47,85,86 Naidoo et al87 conducted a cross-sectional study, examining the association between salivary CRP, low cardiorespiratory fitness, and body composition in South African children (Table 1). A total of 170 South African children, ages 9.4 ± 1.6 years (grades 3 to 7), were enrolled and categorized into groups based on their weight status as either normal-weight, overweight, or obese, using the CDC guidelines.87 Obese participants showed elevated CRP concentrations (7.3 ± 0.9 pg/mL) compared to normal-weight children (6.7 ± 0.9 pg/mL, P<0.05).87 Serum samples were analyzed and CRP concentrations in saliva and serum displayed a significant correlation (r=0.70).87 The data reported poor cardio-respiratory fitness (OR 2.7, 95% CI: 1.2–6.1, P=0.02) and overweight and obesity weight status (BMI ≥ 85th percentile; OR 2.5, 95% CI: 1.1–5.9, P=0.03) as independent predictors of elevated salivary CRP secretion rate.87 These findings show a strong correlation between weight status, cardiorespiratory fitness, and inflammatory status in children. In the aforementioned study, Goodson et al47 examined metabolic disease risk in children by salivary biomarker analysis, categorizing 744 children into four categories based on their weight status (Table 1). Salivary concentrations of CRP in the obese children were sixfold higher than in normal-weight children, with the obese children demonstrating a median CRP concentration of 435 pg/mL and normal-weight children demonstrating a median CRP concentration of 76 pg/mL.47 It was concluded that increased levels of CRP are associated with type 2 diabetes, with salivary and serum CRP concentrations displaying a correlation (r=0.70).47 Given the consistencies among the studies described above, it is positive to suggest that salivary CRP can be used as a biomarker of type 2 diabetes risk.47,87
Tumor Necrosis Factor Alpha (TNF-α)
TNF-α is a pro-inflammatory, cell signaling protein that plays critical roles in inflammatory and autoimmune responses, cellular events such as apoptosis and cell differentiation, and oxidative stress.88–90 Elevated concentrations of TNF-α are associated with insulin resistance, making it a contributory biomarker of type 2 diabetes.88–91 TNF-α works to reduce the expression of glucose transporter type 4 (GLUT-4) and serine phosphorylation of insulin receptor substrate 1 (IRS-1), both of which are critical for the synthesis of insulin.92–94 TNF-α activates the endothelial production of adhesion molecules such as intracellular adhesion molecule-1.92–94 Intracellular adhesion molecule-1 promotes the development of insulin resistance.92–94 If an increase in TNF-α concentration occurs, additional GLUT-4 and serine phosphorylation of IRS-1 are suppressed, thereby activating additional intracellular adhesion molecule-1, leading to an increased risk of developing type 2 diabetes.88–90 Furthermore, studies report type 2 diabetics demonstrating a 17–39% increase in TNF-α concentrations versus healthy controls.90,95 Multiple studies have tested different races, ages, and genders and have continued to show elevated TNF-α concentrations in patients with type 2 diabetes, suggesting TNF-α as a risk factor of type 2 diabetes (Figure 1).88,89,91
Despite the established method of collecting TNF-α through serum samples, recent interest in measuring salivary samples has emerged.29,47,86,91,96 Mentioned prior, Tvarijonaviciute et al29 examined various salivary cytokines in type 2 diabetics with the objective of comparing their data to healthy controls (Table 1). Salivary TNF-α was 1.9-fold greater in type 2 diabetics versus nondiabetics (P<0.049).29 However, these promising findings are not consistent amongst additional studies. Srinivasan et al96 conducted a study comparing salivary concentrations of pro-inflammatory adipokines and anti-inflammatory adipokines in self-reported type 2 diabetic participants versus healthy controls (Table 1). Forty participants were enrolled, with 20 healthy participants and 20 participants with type 2 diabetes.96 Minimal differences in TNF-α concentration (50 pg/mL increase in diabetic participants) were observed between the diabetic participants and healthy controls. The difference in outcomes from both studies could be possibly attributed to the fact that participants in the Srinivasan et al96 were self-reported type 2 diabetics whereas participants in the Tvarijonaviciute et al29 were diagnosed type 2 diabetics based off the American Diabetes Association criteria. Given these inconsistencies, more research needs to be conducted on TNF-α as a salivary biomarker of type 2 diabetes in order to determine its clinical utility.96
Additional Consideration: Obesity, Oxidative Stress, Inflammation, and Type 2 Diabetes
Oxidative stress, defined by an elevation in reactive oxygen species (ROS) and a decreased antioxidant capacity,97,98 plays an important role in the pathogenesis of insulin resistance and type 2 diabetes (Figure 1). Increased adipose tissue, a characteristic of obesity, disrupts metabolic homeostasis via overproduction of pro-inflammatory adipokines including leptin, IL-6, and TNF-α, followed by an accelerated stimulation of ROS production which induces a prolonged state of oxidative stress.97,98 Based on this potential mechanism linking obesity and type 2 diabetes, it would be germane to investigate any salivary markers for their association with oxidative stress that could further support the consistency and reliability of saliva-based inflammatory markers discussed here.
Conclusion
With rapid advances in nanotechnology and molecular diagnostics, the use of saliva as a diagnostic is evolving and poses increasing clinical relevance. Saliva contains biomarkers that are ideal for early identification for oral and systemic diseases, disease diagnostics, and clinical monitoring.99 Serum sampling has been the traditional form of measuring biomarkers, primarily due to the high concentration of molecular components found in blood. Blood analysis looks at protein-bound, serum-circulating compounds, while salivary analysis looks at biologically active molecular compounds at the cellular level, suggesting salivary analysis has a greater clinical relevance.26 If saliva sampling can be used as a diagnostic, it would pose many advantages, as it would be less-intrusive, non-invasive, cost-effective, rapid, portable, and more accessible.21,25
Nonetheless, there are a number of challenges regarding the clinical success of using saliva as a diagnostic. First, concentrations of molecular components in saliva are found in exceptionally low concentrations.23,25 Second, research on established, disease-specific salivary biomarkers is limited.25 However, contributions from genomic technologies for saliva sampling are evolving,26,100 with increasing research conducted on disease-specific biomarkers.23,25
This review focused on biomarker-specific research, with varying results on the clinical utility of saliva for each biomarker reviewed. Research on salivary 1,5-AG and CRP as a clinical biomarker of type 2 diabetes produced desirable, consistent results, while the remaining salivary biomarkers reviewed, adiponectin, leptin, IL-6, and TNF-α produced inconsistent results with some studies suggesting a clinical relevance and use as a diagnostic, while other studies suggesting further research to be conducted. These findings suggest a potential for salivary analysis to be used as a diagnostic for early identification and risk prediction for inflammatory diseases such as type 2 diabetes. Standardized methods for salivary analysis, processing, and collection must be created to reduce inconsistencies and errors amongst published data. Additional research on saliva’s diagnostic utility, using longitudinal data and standardized methods, should be further explored in order for salivary analysis to be incorporated into diagnostic settings.
Acknowledgments
This work was supported by the Department of Exercise Science at Syracuse University.
Disclosure
The authors report no conflicts of interest in this work.
References
1. American Diabetes Association. 2. Classification and diagnosis of diabetes: standards of medical care in diabetes-2018. Diabetes Care. 2018;41(Suppl1):S13–S27. doi:10.2337/dc18-S002.
2. Mitrakou A, Kelley D, Mokan M, et al. Role of reduced suppression of glucose production and diminished early insulin release in impaired glucose tolerance. N Engl J Med. 1992;326(1):22–29. doi:10.1056/NEJM199201023260104
3. Defronzo RA. Banting lecture. From the triumvirate to the ominous octet: a new paradigm for the treatment of type 2 diabetes mellitus. Diabetes. 2009;58(4):773–795. doi:10.2337/db09-9028
4. Hannon TS, Arslanian SA. The changing face of diabetes in youth: lessons learned from studies of type 2 diabetes. Ann N Y Acad Sci. 2015;1353:113–137. doi:10.1111/nyas.12939
5. Hu FB, Manson JE, Stampfer MJ, et al. Diet, lifestyle, and the risk of type 2 diabetes mellitus in women. N Engl J Med. 2001;345(11):790–797. doi:10.1056/NEJMoa010492
6. Weber MB, Narayan KMV. Health insurance for diabetes prevention confers health benefits and breaks even on cost within 2 years. Diabetes Care. 2019;42(9):1612–1614. doi:10.2337/dci19-0022
7. Abrahamian H, Endler G, Exner M, et al. Association of low-grade inflammation with nephropathy in type 2 diabetic patients: role of elevated CRP-levels and 2 different gene-polymorphisms of proinflammatory cytokines. Exp Clin Endocrinol Diabetes. 2007;115(1):38–41. doi:10.1055/s-2007-948213
8. Randeria SN, Thomson GJA, Nell TA, Roberts T, Pretorius E. Inflammatory cytokines in type 2 diabetes mellitus as facilitators of hypercoagulation and abnormal clot formation. Cardiovasc Diabetol. 2019;18(1):72. doi:10.1186/s12933-019-0870-9
9. Spranger J, Kroke A, Mohlig M, et al. Inflammatory cytokines and the risk to develop type 2 diabetes: results of the prospective population-based European Prospective Investigation into Cancer and Nutrition (EPIC)-potsdam study. Diabetes. 2003;52(3):812–817. doi:10.2337/diabetes.52.3.812
10. Saeedi P, Petersohn I, Salpea P, et al. Global and regional diabetes prevalence estimates for 2019 and projections for 2030 and 2045: results from the International Diabetes Federation Diabetes Atlas, 9(th) edition. Diabetes Res Clin Pract. 2019;157:107843. doi:10.1016/j.diabres.2019.107843
11. Wild S, Roglic G, Green A, Sicree R, King H. Global prevalence of diabetes: estimates for the year 2000 and projections for 2030. Diabetes Care. 2004;27(5):1047–1053. doi:10.2337/diacare.27.5.1047
12. Rowley WR, Bezold C, Arikan Y, Byrne E, Krohe S. Diabetes 2030: insights from yesterday, today, and future trends. Popul Health Manag. 2017;20(1):6–12. doi:10.1089/pop.2015.0181
13. Tabish SA. Is diabetes becoming the biggest epidemic of the twenty-first century? Int J Health Sci (Qassim). 2007;1(2):V–VIII.
14. Wu Y, Ding Y, Tanaka Y, Zhang W. Risk factors contributing to type 2 diabetes and recent advances in the treatment and prevention. Int J Med Sci. 2014;11(11):1185–1200. doi:10.7150/ijms.10001
15. Nadeau KJ, Anderson BJ, Berg EG, et al. Youth-onset type 2 diabetes consensus report: current status, challenges, and priorities. Diabetes Care. 2016;39(9):1635–1642. doi:10.2337/dc16-1066
16. Dall TM, Yang W, Gillespie K, et al. The economic burden of elevated blood glucose levels in 2017: diagnosed and undiagnosed diabetes, gestational diabetes mellitus, and prediabetes. Diabetes Care. 2019;42(9):1661–1668. doi:10.2337/dc18-1226
17. Huang T, Glass K, Zeleznik OA, et al. A network analysis of biomarkers for type 2 diabetes. Diabetes. 2019;68(2):281–290. doi:10.2337/db18-0892
18. Abbasi A, Stolk RP, Bakker SJ. Identification of relevant biomarkers for type 2 diabetes. Lancet Diabetes Endocrinol. 2014;2(2):106–107. doi:10.1016/S2213-8587(14)70005-1
19. Ahluwalia TS, Kilpelainen TO, Singh S, Rossing P. Editorial: novel biomarkers for type 2 diabetes. Front Endocrinol (Lausanne). 2019;10:649. doi:10.3389/fendo.2019.00649
20. Dorcely B, Katz K, Jagannathan R, et al. Novel biomarkers for prediabetes, diabetes, and associated complications. Diabetes Metab Syndr Obes. 2017;10:345–361. doi:10.2147/DMSO.S100074
21. Yoshizawa JM, Schafer CA, Schafer JJ, Farrell JJ, Paster BJ, Wong DT. Salivary biomarkers: toward future clinical and diagnostic utilities. Clin Microbiol Rev. 2013;26(4):781–791. doi:10.1128/CMR.00021-13
22. Carpenter GH. The secretion, components, and properties of saliva. Annu Rev Food Sci Technol. 2013;4:267–276. doi:10.1146/annurev-food-030212-182700
23. Nunes LA, Mussavira S, Bindhu OS. Clinical and diagnostic utility of saliva as a non-invasive diagnostic fluid: a systematic review. Biochem Med (Zagreb). 2015;25(2):177–192. doi:10.11613/BM.2015.018
24. Dawes C. Considerations in the development of diagnostic tests on saliva. Ann N Y Acad Sci. 1993;694:265–269. doi:10.1111/j.1749-6632.1993.tb18359.x
25. Yeh CK, Christodoulides NJ, Floriano PN, et al. Current development of saliva/oral fluid-based diagnostics. Tex Dent J. 2010;127(7):651–661.
26. Tiwari M. Science behind human saliva. J Nat Sci Biol Med. 2011;2(1):53–58. doi:10.4103/0976-9668.82322
27. Thanakun S, Watanabe H, Thaweboon S, Izumi Y. Comparison of salivary and plasma adiponectin and leptin in patients with metabolic syndrome. Diabetol Metab Syndr. 2014;6(1):19. doi:10.1186/1758-5996-6-19
28. Mamali I, Roupas ND, Armeni AK, Theodoropoulou A, Markou KB, Georgopoulos NA. Measurement of salivary resistin, visfatin and adiponectin levels. Peptides. 2012;33(1):120–124. doi:10.1016/j.peptides.2011.11.007
29. Tvarijonaviciute A, Castillo C, Ceron JJ, Martinez-Subiela S, Tecles F, Lopez-Jornet P. Leptin and NGF in saliva of patients with diabetes mellitus type 2: a pilot study. J Oral Pathol Med. 2017;46(9):853–855. doi:10.1111/jop.12587
30. Costa PP, Trevisan GL, Macedo GO, et al. Salivary interleukin-6, matrix metalloproteinase-8, and osteoprotegerin in patients with periodontitis and diabetes. J Periodontol. 2010;81(3):384–391. doi:10.1902/jop.2009.090510
31. Monea A, Gruber R, Elod N, Beresescu G, Moldovan C, Monea M. Saliva and serum levels of tnf-[alpha] and il-6 in a sample of romanian adult subjects with type 2 diabetes mellitus and periodontal disease. Eur Sci J. 2014;10:9.
32. Gao X, Jiang S, Koh D, Hsu CY. Salivary biomarkers for dental caries. Periodontol 2000. 2016;70(1):128–141. doi:10.1111/prd.12100
33. Phillips SA, Ciaraldi TP, Kong AP, et al. Modulation of circulating and adipose tissue adiponectin levels by antidiabetic therapy. Diabetes. 2003;52(3):667–674. doi:10.2337/diabetes.52.3.667
34. Siitonen N, Pulkkinen L, Lindstrom J, et al. Association of ADIPOQ gene variants with body weight, type 2 diabetes and serum adiponectin concentrations: the Finnish Diabetes Prevention Study. BMC Med Genet. 2011;12:5. doi:10.1186/1471-2350-12-5
35. Ryo M, Nakamura T, Kihara S, et al. Adiponectin as a biomarker of the metabolic syndrome. Circ J. 2004;68(11):975–981. doi:10.1253/circj.68.975
36. Yamauchi T, Kamon J, Waki H, et al. The fat-derived hormone adiponectin reverses insulin resistance associated with both lipoatrophy and obesity. Nat Med. 2001;7(8):941–946. doi:10.1038/90984
37. Arita Y, Kihara S, Ouchi N, et al. Paradoxical decrease of an adipose-specific protein, adiponectin, in obesity. Biochem Biophys Res Commun. 1999;257(1):79–83. doi:10.1006/bbrc.1999.0255
38. Hotta K, Funahashi T, Arita Y, et al. Plasma concentrations of a novel, adipose-specific protein, adiponectin, in type 2 diabetic patients. Arterioscler Thromb Vasc Biol. 2000;20(6):1595–1599. doi:10.1161/01.atv.20.6.1595
39. Yoon MJ, Lee GY, Chung JJ, Ahn YH, Hong SH, Kim JB. Adiponectin increases fatty acid oxidation in skeletal muscle cells by sequential activation of AMP-activated protein kinase, p38 mitogen-activated protein kinase, and peroxisome proliferator-activated receptor alpha. Diabetes. 2006;55(9):2562–2570. doi:10.2337/db05-1322
40. Cheng KK, Lam KS, Wang Y, et al. Adiponectin-induced endothelial nitric oxide synthase activation and nitric oxide production are mediated by APPL1 in endothelial cells. Diabetes. 2007;56(5):1387–1394. doi:10.2337/db06-1580
41. Gariballa S, Alkaabi J, Yasin J, Al Essa A. Total adiponectin in overweight and obese subjects and its response to visceral fat loss. BMC Endocr Disord. 2019;19(1):55. doi:10.1186/s12902-019-0386-z
42. Altinova AE, Toruner F, Bukan N, et al. Decreased plasma adiponectin is associated with insulin resistance and HDL cholesterol in overweight subjects. Endocr J. 2007;54(2):221–226. doi:10.1507/endocrj.k06-021
43. Santaniemi M, Kesaniemi YA, Ukkola O. Low plasma adiponectin concentration is an indicator of the metabolic syndrome. Eur J Endocrinol. 2006;155(5):745–750. doi:10.1530/eje.1.02287
44. Gannage-Yared MH, Khalife S, Semaan M, Fares F, Jambart S, Halaby G. Serum adiponectin and leptin levels in relation to the metabolic syndrome, androgenic profile and somatotropic axis in healthy non-diabetic elderly men. Eur J Endocrinol. 2006;155(1):167–176. doi:10.1530/eje.1.02175
45. Iwata M, Hara K, Kamura Y, et al. Ratio of low molecular weight serum adiponectin to the total adiponectin value is associated with type 2 diabetes through its relation to increasing insulin resistance. PLoS One. 2018;13(3):e0192609. doi:10.1371/journal.pone.0192609
46. Wang LH, Liu YC, Hou JS, Wu DA, Hsu BG. Hypoadiponectemia is associated with metabolic syndrome in patients with type 2 diabetes. Int J Clin Exp Pathol. 2017;10(10):10515–10521.
47. Goodson JM, Kantarci A, Hartman ML, et al. Metabolic disease risk in children by salivary biomarker analysis. PLoS One. 2014;9(6):e98799. doi:10.1371/journal.pone.0192609
48. Harris RB. Leptin–much more than a satiety signal. Annu Rev Nutr. 2000;20:45–75. doi:10.1146/annurev.nutr.20.1.45
49. Yadav A, Kataria MA, Saini V, Yadav A. Role of leptin and adiponectin in insulin resistance. Clin Chim Acta. 2013;417:80–84. doi:10.1016/j.cca.2012.12.007
50. Yang R, Barouch LA. Leptin signaling and obesity: cardiovascular consequences. Circ Res. 2007;101(6):545–559. doi:10.1161/CIRCRESAHA.107.156596
51. Serradeil-le Gal C, Raufaste D, Brossard G, et al. Characterization and localization of leptin receptors in the rat kidney. FEBS Lett. 1997;404(2–3):185–191. doi:10.1016/s0014-5793(97)00125-7
52. Liu W, Zhou X, Li Y, et al. Serum leptin, resistin, and adiponectin levels in obese and non-obese patients with newly diagnosed type 2 diabetes mellitus: a population-based study. Medicine (Baltimore). 2020;99(6):e19052. doi:10.1097/MD.0000000000019052
53. Schmidt MI, Duncan BB, Vigo A, et al. Leptin and incident type 2 diabetes: risk or protection? Diabetologia. 2006;49(9):2086–2096. doi:10.1007/s00125-006-0351-z
54. Esteghamati A, Khalilzadeh O, Anvari M, Rashidi A, Mokhtari M, Nakhjavani M. Association of serum leptin levels with homeostasis model assessment-estimated insulin resistance and metabolic syndrome: the key role of central obesity. Metab Syndr Relat Disord. 2009;7(5):447–452. doi:10.1089/met.2008.0100
55. Lee SW, Jo HH, Kim MR, You YO, Kim JH. Association between metabolic syndrome and serum leptin levels in postmenopausal women. J Obstet Gynaecol. 2012;32(1):73–77. doi:10.3109/01443615.2011.618893
56. Zulfania KA, Ghaffar T, Kainat A, Arabdin M, Rehman Orakzai SU. Correlation between serum leptin level and body mass index (BMI) in patients with type 2 diabetes mellitus. J Pak Med Assoc. 2020;70(1):3–6. doi:10.5455/JPMA.301135
57. Considine RV, Sinha MK, Heiman ML, et al. Serum immunoreactive-leptin concentrations in normal-weight and obese humans. N Engl J Med. 1996;334(5):292–295. doi:10.1056/NEJM199602013340503
58. Kim WJ, Park CY. 1,5-Anhydroglucitol in diabetes mellitus. Endocrine. 2013;43(1):33–40. doi:10.1007/s12020-012-9760-6
59. Loomis SJ, Kottgen A, Li M, et al. Rare variants in SLC5A10 are associated with serum 1,5-anhydroglucitol (1,5-AG) in the Atherosclerosis Risk in Communities (ARIC) Study. Sci Rep. 2019;9(1):5941. doi:10.1038/s41598-019-42202-0
60. Kim WJ, Park CY, Lee KB, et al. Serum 1,5-anhydroglucitol concentrations are a reliable index of glycemic control in type 2 diabetes with mild or moderate renal dysfunction. Diabetes Care. 2012;35(2):281–286. doi:10.2337/dc11-1462
61. Pal A, Farmer AJ, Dudley C, et al. Evaluation of serum 1,5 anhydroglucitol levels as a clinical test to differentiate subtypes of diabetes. Diabetes Care. 2010;33(2):252–257. doi:10.2337/dc09-1246
62. Januszewski AS, Karschimkus C, Davis KE, O’Neal D, Ward G, Jenkins AJ. Plasma 1,5 anhydroglucitol levels, a measure of short-term glycaemia: assay assessment and lower levels in diabetic vs. non-diabetic subjects. 08B92. 2012;95(1):e17–19. doi:10.1016/j.diabres.2011.09.032
63. Whitehead TP, Jungner I, Robinson D, Kolar W, Pearl A, Hale A. Serum urate, serum glucose and diabetes. Ann Clin Biochem. 1992;29(2):159–161. doi:10.1177/000456329202900206
64. Mook-Kanamori DO, Selim MM, Takiddin AH, et al. 1,5-Anhydroglucitol in saliva is a noninvasive marker of short-term glycemic control. J Clin Endocrinol Metab. 2014;99(3):E479–483. doi:10.1210/jc.2013-3596
65. Selvin E, Rawlings AM, Grams M, Klein R, Steffes M, Coresh J. Association of 1,5-anhydroglucitol with diabetes and microvascular conditions. Clin Chem. 2014;60(11):1409–1418. doi:10.1373/clinchem.2014.229427
66. Dungan KM, Buse JB, Largay J, et al. 1,5-anhydroglucitol and postprandial hyperglycemia as measured by continuous glucose monitoring system in moderately controlled patients with diabetes. Diabetes Care. 2006;29(6):1214–1219. doi:10.2337/dc06-1910
67. Bai Y, Yang R, Song Y, Wang Y. Serum 1,5-Anhydroglucitol concentrations remain valid as a glycemic control marker in diabetes with earlier chronic kidney disease stages. Exp Clin Endocrinol Diabetes. 2019;127(4):220–225. doi:10.1055/s-0043-122142
68. Barnes VM, Kennedy AD, Panagakos F, et al. Global metabolomic analysis of human saliva and plasma from healthy and diabetic subjects, with and without periodontal disease. PLoS One. 2014;9(8):e105181. doi:10.1371/journal.pone.0105181
69. Asha ML, Rajarathnam BN, Vinutha N, Kumar HM, Premkumar A, Azmi R. Evaluation of 1, 5-anhydroglucitolas a salivary biomarker in Type 2 diabetes mellitus patients. J Adv Clin Res Insights. 2019;6(3):67–71. doi:10.15713/ins.jcri.263
70. Ruge T, Lockton JA, Renstrom F, et al. Acute hyperinsulinemia raises plasma interleukin-6 in both nondiabetic and type 2 diabetes mellitus subjects, and this effect is inversely associated with body mass index. Metabolism. 2009;58(6):860–866. doi:10.1016/j.metabol.2009.02.010
71. Rodrigues KF, Pietrani NT, Bosco AA, Campos FMF, Sandrim VC, Gomes KB. IL-6, TNF-alpha, and IL-10 levels/polymorphisms and their association with type 2 diabetes mellitus and obesity in Brazilian individuals. Arch Endocrinol Metab. 2017;61(5):438–446. doi:10.1590/2359-3997000000254
72. Castaneda S, Remuzgo-Martinez S, Lopez-Mejias R, et al. Rapid beneficial effect of the IL-6 receptor blockade on insulin resistance and insulin sensitivity in non-diabetic patients with rheumatoid arthritis. Clin Exp Rheumatol. 2019;37(3):465–473.
73. Harder-Lauridsen NM, Krogh-Madsen R, Holst JJ, et al. Effect of IL-6 on the insulin sensitivity in patients with type 2 diabetes. Am J Physiol Endocrinol Metab. 2014;306(7):E769–778. doi:10.1152/ajpendo.00571.2013
74. Lei CT, Su H, Ye C, et al. The classic signalling and trans-signalling of interleukin-6 are both injurious in podocyte under high glucose exposure. J Cell Mol Med. 2018;22(1):251–260. doi:10.1111/jcmm.13314
75. Russo GT, Giorda CB, Cercone S, et al. Factors associated with beta-cell dysfunction in type 2 diabetes: the BETADECLINE study. PLoS One. 2014;9(10):e109702. doi:10.1371/journal.pone.0109702
76. Reeh H, Rudolph N, Billing U, et al. Response to IL-6 trans- and IL-6 classic signalling is determined by the ratio of the IL-6 receptor alpha to gp130 expression: fusing experimental insights and dynamic modelling. Cell Commun Signal. 2019;17(1):46. doi:10.1186/s12964-019-0356-0
77. Vinagre I, Sanchez-Quesada JL, Sanchez-Hernandez J, et al. Inflammatory biomarkers in type 2 diabetic patients: effect of glycemic control and impact of LDL subfraction phenotype. Cardiovasc Diabetol. 2014;13:34. doi:10.1186/1475-2840-13-34
78. Pan A, Wang Y, Yuan JM, Koh WP. High-sensitive C-reactive protein and risk of incident type 2 diabetes: a case-control study nested within the Singapore Chinese Health Study. BMC Endocr Disord. 2017;17(1):8. doi:10.1186/s12902-017-0159-5
79. Effoe VS, Correa A, Chen H, Lacy ME, Bertoni AG. High-sensitivity C-reactive protein is associated with incident type 2 diabetes among African Americans: the Jackson Heart Study. Diabetes Care. 2015;38(9):1694–1700. doi:10.2337/dc15-0221
80. Aryan Z, Ghajar A, Faghihi-Kashani S, Afarideh M, Nakhjavani M, Esteghamati A. Baseline high-sensitivity C-reactive protein predicts macrovascular and microvascular complications of type 2 diabetes: a population-based study. Ann Nutr Metab. 2018;72(4):287–295. doi:10.1159/000488537
81. Asemi Z, Zare Z, Shakeri H, Sabihi SS, Esmaillzadeh A. Effect of multispecies probiotic supplements on metabolic profiles, hs-CRP, and oxidative stress in patients with type 2 diabetes. Ann Nutr Metab. 2013;63(1–2):1–9. doi:10.1159/000349922
82. Osborn O, Olefsky JM. The cellular and signaling networks linking the immune system and metabolism in disease. Nat Med. 2012;18(3):363–374. doi:10.1038/nm.2627
83. Hanyu O, Yoshida J, Abe E, et al. High-sensitivity CRP reflects insulin resistance in smokers. J Atheroscler Thromb. 2009;16(5):560–567. doi:10.5551/jat.869
84. Hu FB, Meigs JB, Li TY, Rifai N, Manson JE. Inflammatory markers and risk of developing type 2 diabetes in women. Diabetes. 2004;53(3):693–700. doi:10.2337/diabetes.53.3.693
85. Redman RS, Kerr GS, Payne JB, et al. Salivary and serum procalcitonin and C-reactive protein as biomarkers of periodontitis in United States veterans with osteoarthritis or rheumatoid arthritis. Biotech Histochem. 2016;91(2):77–85. doi:10.3109/10520295.2015.1082625
86. Desai GS, Mathews ST. Saliva as a non-invasive diagnostic tool for inflammation and insulin-resistance. World J Diabetes. 2014;5(6):730–738. doi:10.4239/wjd.v5.i6.730
87. Naidoo T, Konkol K, Biccard B, Dudose K, McKune AJ. Elevated salivary C-reactive protein predicted by low cardio-respiratory fitness and being overweight in African children. Cardiovasc J Afr. 2012;23(9):501–506. doi:10.5830/CVJA-2012-058
88. Virkamaki A, Ueki K, Kahn CR. Protein-protein interaction in insulin signaling and the molecular mechanisms of insulin resistance. J Clin Invest. 1999;103(7):931–943. doi:10.1172/JCI6609
89. Navarro JF, Mora C, Muros M, Garcia J. Urinary tumour necrosis factor-alpha excretion independently correlates with clinical markers of glomerular and tubulointerstitial injury in type 2 diabetic patients. Nephrol Dial Transplant. 2006;21(12):3428–3434. doi:10.1093/ndt/gfl469
90. Lainampetch J, Panprathip P, Phosat C, et al. Association of tumor necrosis factor alpha, interleukin 6, and C-reactive protein with the risk of developing type 2 diabetes: a retrospective cohort study of rural Thais. J Diabetes Res. 2019;2019:9051929. doi:10.1155/2019/9051929
91. Woo YC, Tso AW, Xu A, et al. Combined use of serum adiponectin and tumor necrosis factor-alpha receptor 2 levels was comparable to 2-hour post-load glucose in diabetes prediction. PLoS One. 2012;7(5):e36868. doi:10.1371/journal.pone.0036868
92. Iwamoto Y, Nishimura F, Nakagawa M, et al. The effect of antimicrobial periodontal treatment on circulating tumor necrosis factor-alpha and glycated hemoglobin level in patients with type 2 diabetes. J Periodontol. 2001;72(6):774–778. doi:10.1902/jop.2001.72.6.774
93. Stephens JM, Pekala PH. Transcriptional repression of the GLUT4 and C/EBP genes in 3T3-L1 adipocytes by tumor necrosis factor-alpha. J Biol Chem. 1991;266(32):21839–21845.
94. Abel ED, Peroni O, Kim JK, et al. Adipose-selective targeting of the GLUT4 gene impairs insulin action in muscle and liver. Nature. 2001;409(6821):729–733. doi:10.1038/35055575
95. Li JY, Wang YD, Qi XY, et al. Serum CCN3 levels are increased in type 2 diabetes mellitus and associated with obesity, insulin resistance and inflammation. Clin Chim Acta. 2019;494:52–57. doi:10.1016/j.cca.2019.03.006
96. Srinivasan M, Meadows ML, Maxwell L. Assessment of salivary adipokines resistin, visfatin, and ghrelin as type 2 diabetes mellitus biomarkers. Biochem Res Int. 2018;2018:7463796. doi:10.1155/2018/7463796
97. Gaman MA, Epingeac ME, Diaconu CC, Gaman AM. Evaluation of oxidative stress levels in obesity and diabetes by the free oxygen radical test and free oxygen radical defence assays and correlations with anthropometric and laboratory parameters. World J Diabetes. 2020;11(5):193–201. doi:10.4239/wjd.v11.i5.193
98. Epingeac ME, Gaman MA, Diaconu CC, Gad M, Gaman AM. The evaluation of oxidative stress levels in obesity. Rev Chim (Bucharest). 2019;70:2241–2244. doi:10.37358/RC.19.6.7314
99. Malamud D. Saliva as a diagnostic fluid. Dent Clin North Am. 2011;55(1):159–178. doi:10.1016/j.cden.2010.08.004
100. Roi A, Rusu LC, Roi CI, Luca RE, Boia S, Munteanu RI. A new approach for the diagnosis of systemic and oral diseases based on salivary biomolecules. Dis Markers. 2019;2019:8761860. doi:10.1155/2019/8761860
 © 2020 The Author(s). This work is published and licensed by Dove Medical Press Limited. The full terms of this license are available at https://www.dovepress.com/terms.php and incorporate the Creative Commons Attribution - Non Commercial (unported, v3.0) License.
By accessing the work you hereby accept the Terms. Non-commercial uses of the work are permitted without any further permission from Dove Medical Press Limited, provided the work is properly attributed. For permission for commercial use of this work, please see paragraphs 4.2 and 5 of our Terms.
© 2020 The Author(s). This work is published and licensed by Dove Medical Press Limited. The full terms of this license are available at https://www.dovepress.com/terms.php and incorporate the Creative Commons Attribution - Non Commercial (unported, v3.0) License.
By accessing the work you hereby accept the Terms. Non-commercial uses of the work are permitted without any further permission from Dove Medical Press Limited, provided the work is properly attributed. For permission for commercial use of this work, please see paragraphs 4.2 and 5 of our Terms.