")
Back to Journals » Diabetes, Metabolic Syndrome and Obesity » Volume 12
The Circulating Micro-RNAs (−122, −34a and −99a) as Predictive Biomarkers for Non-Alcoholic Fatty Liver Diseases
Authors Hendy OM, Rabie H, El Fouly A, Abdel-Samiee M , Abdelmotelb N , Elshormilisy AA , Allam M, Ali ST, Bahaa EL-Deen NM, Abdelsattar S , Mohamed SM
Received 17 September 2019
Accepted for publication 20 November 2019
Published 19 December 2019 Volume 2019:12 Pages 2715—2723
DOI https://doi.org/10.2147/DMSO.S231321
Checked for plagiarism Yes
Review by Single anonymous peer review
Peer reviewer comments 2
Editor who approved publication: Professor Ming-Hui Zou
Olfat M Hendy,1 Hatem Rabie,1 Amr El Fouly,2 Mohamed Abdel-Samiee,3 Nashwa Abdelmotelb,1 Amr Aly Elshormilisy,4 Mahmoud Allam,3 Samia Taher Ali,5 Nessren Mohamed Bahaa EL-Deen,6 Shimaa Abdelsattar,7 Somia Mokabel Mohamed8
1Clinical Pathology Department, National Liver Institute, Menoufia University, Shebin El-Kom, Egypt; 2Endemic Medicine Department, Helwan University, Cairo, Egypt; 3Hepatology and Gastroenterology Department, National Liver Institute, Menoufia University, Shebin El-Kom, Egypt; 4Internal Medicine Department, Helwan University, Cairo, Egypt; 5Internal Medicine Department, Faculty of Medicine for Girls, Al-Azhar University, Cairo, Egypt; 6Tropical Medicine Department, Faculty of Medicine for Girls, Al-Azhar University, Cairo, Egypt; 7Department of Clinical Biochemistry, National Liver Institute, Menoufia University, Shebin El-Kom, Egypt; 8Department of Physiology, Faculty of Medicine for Girls, Al-Azhar University, Cairo, Egypt
Correspondence: Mohamed Abdel-Samiee
National Liver Institute, Yassin Abdel-Ghafar Street, Shebin El-Kom, Menoufia 32511, Egypt
Tel +2048 2222740
Fax +2048 2234685
Email [email protected]
Background: It remains essential for patient safety to develop non-invasive diagnostic tools to diagnose non-alcoholic fatty liver rather than invasive techniques.
Aim: Our case-control study was to address the value of circulating miRNAs as a potential non-invasive biomarker for the diagnosis of non-alcoholic fatty acid diseases (NAFLD) and monitoring of disease progression.
Methods: Routine clinical assessment, laboratory tests, anthropometric study, and liver biopsy results reported for 210 patients with NAFLD (124 patients of simple steatosis (SS) and 86 of non-alcoholic steatohepatitis (NASH)). Apparently matched for age and gender, healthy participants (n= 90) were enrolled as a control group. Serum samples were tested for micro-RNAs (−122, −34a and −99a) by quantitative-PCR.
Results: By histopathology, 124 of the NAFLD group were of SS and 86 patients were of NASH. Compared with the control subjects, both mi-RNA-122 and −34a levels were increased in NAFLD (p< 001) and at a cut-off = 1.261, mi-RNA-122 had 92% sensitivity, 85% specificity to differentiate NAFLD from healthy controls, while mi-RNA-99a were significantly decreased in NAFLD patients with an observed decrease in disease severity, and at a cut-off = 0.46, miRNA-99a had 94% sensitivity and 96% specificity to discriminate SS from NASH.
Conclusion: The integration of a circulating mi-RNA panel to diagnose NAFLD cases and to discriminate between SS and NASH. Large-scale study is still needed to verify the other mi-RNA profiles and their role in NAFLD pathogenesis and targeting therapy.
Keywords: NASH, NAFLD, micro-RNA, simple steatosis
Introduction
Non-alcoholic fatty liver disease (NAFLD) is the most common chronic liver disease in developed countries. Obesity, diabetes mellitus, elevated glucose, hyperlipidemia, and insulin resistance (IR) have been established as risk factors for NAFLD.1 NAFLD ranges from simple steatosis (SS), the intrahepatic fat accumulation, to the more aggressive non-alcoholic steatohepatitis (NASH), which may progress to cirrhosis and, in some cases to hepatocellular carcinoma (HCC).1,2 The ultrasound is the most widely used imaging test for NAFLD diagnosis, but it is not sensitive if 30% or less of the area is affected by liver steatosis. Computerized tomography (CT scan) is accurate for diagnosing moderate to severe liver steatosis; however, it is not accurate for detecting mild steatosis.3,4 The using of magnetic resonance imaging (MRI) is of good sensitivity and specificity in detecting liver steatosis, but still is not widely available and is costly. The Fibroscan provides high accuracy to identify low steatosis, but this method is limited by body mass index (BMI) and requires further validation.5,6
Micro-RNAs (mi-RNAs) are a group of naturally non-coding RNA molecules. They are approximately 19–25 nucleotides involved in the regulation of gene expression through RNA silencing via base pairing with the 3ʹ-untranslated region (3ʹUTR) of specific mRNAs,7,8 and fine-tuning in concert with the activity of thousands of genes and, thus, their protein synthesis.9 Mi-RNAs are detectable in almost all body fluids like serum, plasma, and urine. They are resistant to extreme conditions such as low or high pH, extreme temperature, and RNAs activity.10,11 The increase of circulating mi-RNAs use in clinical practice is due to their ability to accurately reflect the physiological/pathological state of the tissue they are derived from. So, circulating mi-RNAs may be regarded as blood-based fingerprints of the affected tissue; therefore, they are powerful tools for the understanding of the disease biology12 and have been proposed as attractive diagnostic tools for non-invasive assessment of a pathological state of their origin organ/tissue from peripheral blood.13
Mi-RNAs regulate diverse aspects of development and physiology,14 and pathological conditions such as metabolic diseases,8 cardiovascular disease,15,16 immune dysfunction,17,18 and cancer.19,20 Mi-RNAs play an important role in the physiology of liver disease of metabolic pathways, immunity, viral hepatitis, cancer, and liver fibrosis.21 Mi-RNA-122 is the most expressed mi-RNA in adult human liver; it resembles about 70% of total mi-RNA, plays an important role in regulating total serum cholesterol and hepatic lipid metabolism,22 appears to maintain the hepatic cell phenotype, and its inhibition decreases total serum cholesterol and fatty acid (FA) synthesis.22,23 Moreover, mi-RNA-122 is implicated in NASH development, such as fatty acid synthase (FAS), 3-hydroxy-3-methylglutaryl-CoA reductase (HMGCR), sterol regulatory element-binding protein-1c (SREBP-1c), and sterol regulatory element-binding protein 2 (SREBP-2).24
The mi-RNA-34a is known to be increased in fatty livers of diet-induced obese mice,25 and it is implicated in the dysregulation of cholesterol metabolism by targeting the hepatic NAD-dependent deacetylase Sirtuin 1 (SIRT1), which is an important enzyme in the modulation of liver cell apoptosis, metabolic disease, and cancer.25,26 Moreover, there is a link between the progression of rat and human NAFLD and NASH and mi-RNA-34a/SIRT1/p53 signaling, which is modulated by the exacerbation of inflammation, in turn triggering hepatocyte apoptosis.27 For this reason the expression of mi-RNA-34a in the human liver showed a significant increase with NAFLD severity.24 Mi-RNA-99a/b is a family of tumor suppressor mi-RNAs, it is one of the abundant distributed mi-RNAs in normal human liver. It plays an important role in the inhibition of tumor growth by inducing cell cycle arrest.28 On the contrary, mi-RNA-99a/b is downregulated in adipose tissue of obese and NAFLD patients and serum free fatty acids (FFAs) and IL-6 levels are negatively correlated with the adipose tissue level of mi-RNA-99a.29
Liver biopsy is the gold standard for the diagnosis of NAFLD and is an effective tool for the fine details of pathological features;30 however, this technique is invasive and occasionally associated with severe complications. Thus, the identification of diagnostic and prognostic non-invasive markers for NAFLD diagnosis is needed. The importance of dysregulation of (mi-RNA) expression in non-alcoholic liver disease has been increasingly recognized. Pirola et al.12 made an attractive approach to improve the non-invasive assessment of NAFLD by using mi-RNAs as potential diagnostic non-alcoholic steatohepatitis (NASH) markers. The range of mi-RNA applications is getting broader as they are used in different clinical settings for early disease detection and monitoring of disease progression.12 The association between altered expression of mi-RNAs and pathophysiology of NAFLD and whether there is a relation between susceptibility to NASH and altered expression of mi-RNAs are largely unknown. Therefore, the current study is designed to show the expression of three mi-RNAs, namely: mi-RNA-122, mi-RNA-34a, and mi-RNA-99a in NAFLD patients and to find its relation to disease pathogenesis and progression, and to find its role in NASH prediction.
Patients and Methods
This case-control study was conducted on 210 patients with proven NAFLD, 86 males and 124 females, age range 38–56 years. Patients were recruited from the outpatient clinic of the National Liver Institute, during the period of time between December 2016 and October 2018. NAFLD diagnosis was proven by abdominal ultrasonography, laboratory investigations, and liver biopsy. According to histopathological findings, NAFLD patients were further classified into two subgroups: patients with SS (n= 124) and patients with NASH (n= 86).
Exclusion criteria were: presence of hepatitis viral markers (for B and C), autoimmune hepatitis, alcohol consumption, hepatocellular carcinoma, liver cirrhosis or portal hypertension, diabetes mellitus, or ischemic heart disease.
In addition, apparently healthy blood volunteers (n= 90) (41 males and 49 females), with matching age and sex were included as a control group. They had negative viral hepatitis markers, and normal biochemical profiles and abdominal ultrasound.
A written informed consent was taken from all participants included and the study was approved by ethical committee of National Liver Institute–Menoufia University. All procedures performed in this work had been carried out in accordance with the 1964 Helsinki declaration and its later amendment.
All patients and controls were subjected to complete medical and anthropometric examination and the body mass index (BMI) was calculated as weight (in kilograms) divided by height squared (meters squared). The histological features of liver biopsies in NAFLD patients were evaluated in respect to the Metavir Scoring System and the Knodell Histology Index.
Laboratory investigations: 5 mL of venous blood was withdrawn in the morning after an overnight fast. Samples of blood were collected in plain vacutainer tubes, then centrifuged and the resulting serum was divided, aliquoted and kept at –70°C until assayed.
Liver function tests (ALT, AST, GGT, ALP, albumin), as well as glucose level and lipid profiles (triglycerides, and HDL and LDL cholesterol) were measured using Integra 800 Auto analyzer (Roche-Germany).
The fasting insulin level was done using a commercial kit provided from Diagnostic System Laboratories incorporation kits (DSL-10-1600 ACTIVE insulin, enzyme-linked immunosorbent assay (ELISA) kit, Texas, USA). It is an enzymatically amplified one-step sandwich-type immunoassay. The minimum detection limit is 0.26 uIU/mL, the intra- and inter-assay coefficient variations were 2.6% and 6.2%, respectively. Standards, controls, and samples were incubated with HRP-labeled anti-insulin antibody in microtitration wells which were coated with another anti-insulin antibody. The assay was performed according to the manufacturer’s instructions.
A HOMA index >3 denotes insulin resistance (IR, the insulin resistance, was calculated from the homeostasis model assessment (HOMA) using the HOMA index for insulin resistance as the equation of:

Steps for micro-RNA detection: RNA extraction, complementary DNA (cDNA) synthesis and quantitative reverse transcription real-time PCR (qRT-PCR). RNA extraction: total RNA was extracted from serum samples according to the manufacturer’s protocol using diazole (Qiagen, GmbH– Germany). Briefly, 200 μL of serum was mixed with 2 mL equal volume of 2x denaturing solution, then acid–phenol and chloroform were added as an organic extraction. At room temperature, the mixture was mixed with 1.25 volumes of 100% ethanol followed by washing three times. The last step was adding 100 μL 95°C elution solution for final RNA elution. The concentration and quality of the RNA was measured by spectrophotometer then the final RNA samples were stored at −80°C.
Reverse transcription was done using the TaqMan mi-RNA reverse transcription kit (Life Technologies). Expression of mature mi-RNA was detected using the TaqMan mi-RNA assay (Applied Biosystems).
The reverse transcription real-time PCR (RT-PCR) method was used for mi-RNA expression. In brief, total RNA (200 ng) was used for three mi-RNAs: mi-RNA-122, mi-RNA-34a, and mi-RNA-99a using TaqManmi-RNA assays (Applied Biosystems, Foster City, CA, USA), according to the manufacturer’s instructions. RT-PCR was performed on the Rotor-Gene Real Time PCR system (Qiagen, GmbH, Germany) using fluorescent labeled probes. In the first step, cDNA was denatured by heating to 95°C for 10 min, following which micro-RNAs were amplified by 50–60 cycles at 95°C for 15 sec and 60°C for 60 sec. To compare the expression level of mi-RNAs, the U6 snRNA was used as the internal reference. The relative expression levels of serum mi-RNA-122, mi-RNA-34a, and mi-RNA-99a were calculated using the comparative cycle threshold (Ct) values. The cycle threshold (Ct) is defined as the number of cycles required for the fluorescent signal to cross the threshold in RT-PCR. Ct values were calculated by Rotor-Gene series software (Qiagen, GmbH). The relative expression level of mi-RNAs was defined as mi-RNAs reported as ΔCt value. ΔCt was calculated by subtracting the Ct values of mi-RNA U6 snRNA from the Ct values of the target mi-RNAs. The resultant normalized ΔCt values were used in calculating relative expression values by using 2−Δ(Ct), and these values are directly related to the mi-RNA expression levels. The 2−Δ(Ct) method was used to determine relative quantitative levels of individual mi-RNAs.
Statistical Methods
All statistical analyses were performed with SPSS 21.0 (SPSS, Inc., Chicago, IL). Data were expressed as mean ± SD and differences between groups were analyzed by student (t) test, Mann–Whitney or ANOVA tests. Chi square or Fisher’s exact test were used to compare categorical variables. Pearson’s correlation coefficient was used to test the relationship between various variables. Sensitivity, specificity, receiver operator characteristic (ROC) curve analysis, and area under curve (AUC) were calculated to give diagnostic accuracy. Differences considered to be significant when P < 0.05.
Results
The baseline comparative analysis for demographic data and the anthropometric measures were illustrated in Table 1. The study includes 210 patients with NAFLD (86 males and 124 females) with a mean age ± SD of 42.3 ± 9.31 years. Healthy controls were 90 subjects (41 males and 49 females) with a mean age ± SD of 39.7 ± 11.2 years. Both age and gender were matched among both control group and NAFLD patients.
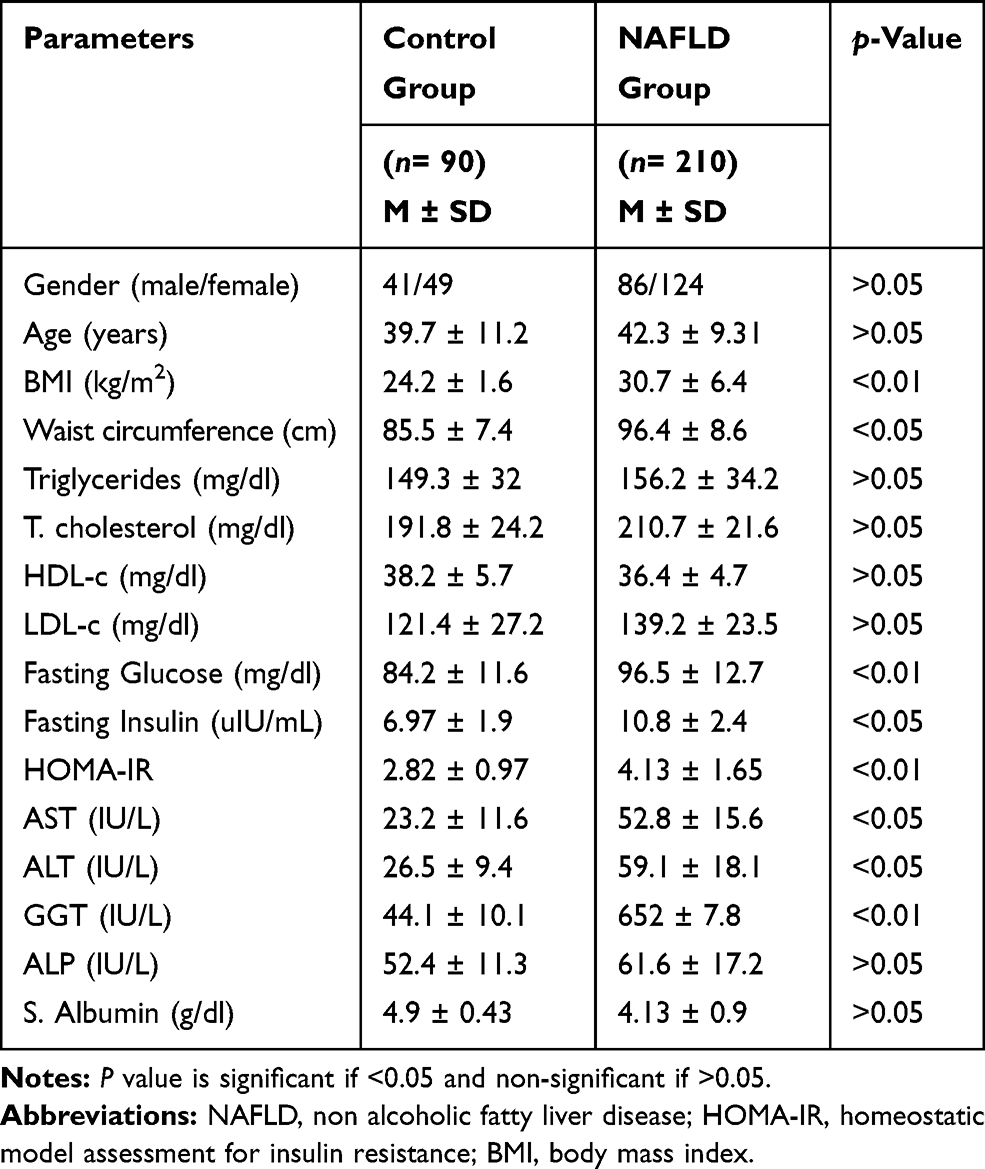 |
Table 1 Demographic and Biochemical Comparison Between NAFLD Patients and Controls |
There was a statistically significant increase in the BMI, waist circumference, fasting glucose, fasting insulin, HOMA-IR, AST, ALT, and GGT among NAFLD patients compared to the control group, while lipid profile, ALP, and serum albumin levels showed non-significant differences between both groups (Table 1). Table 2 shows no statistically significant differences for all baseline parameters in patients with simple steatosis (SS) compared to NASH patients.
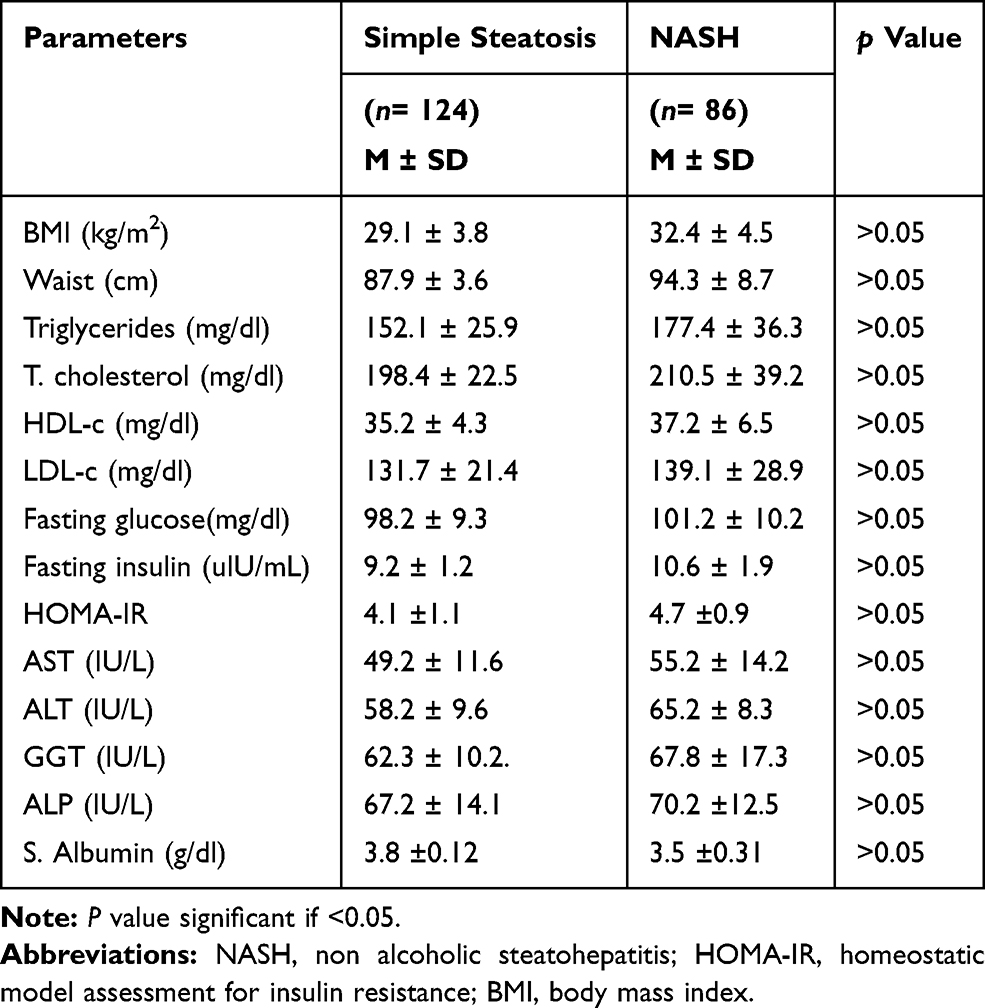 |
Table 2 Comparison of Anthropometric Measurements and Biochemical Tests in Simple Steatosis and NASH Patients |
The mean levels of miRNA-122 and miRNA-34a were significantly higher in NAFLD patients compared to the control group, while miRNA 99a was significantly lower in NAFLD patients (Figure 1). Moreover, NAFLD patients have significantly higher levels of miRNA-122 and miRNA-34a than in the simple steatosis group, while the level of miRNA-99a was significantly downregulated in the NASH group (Table 3).
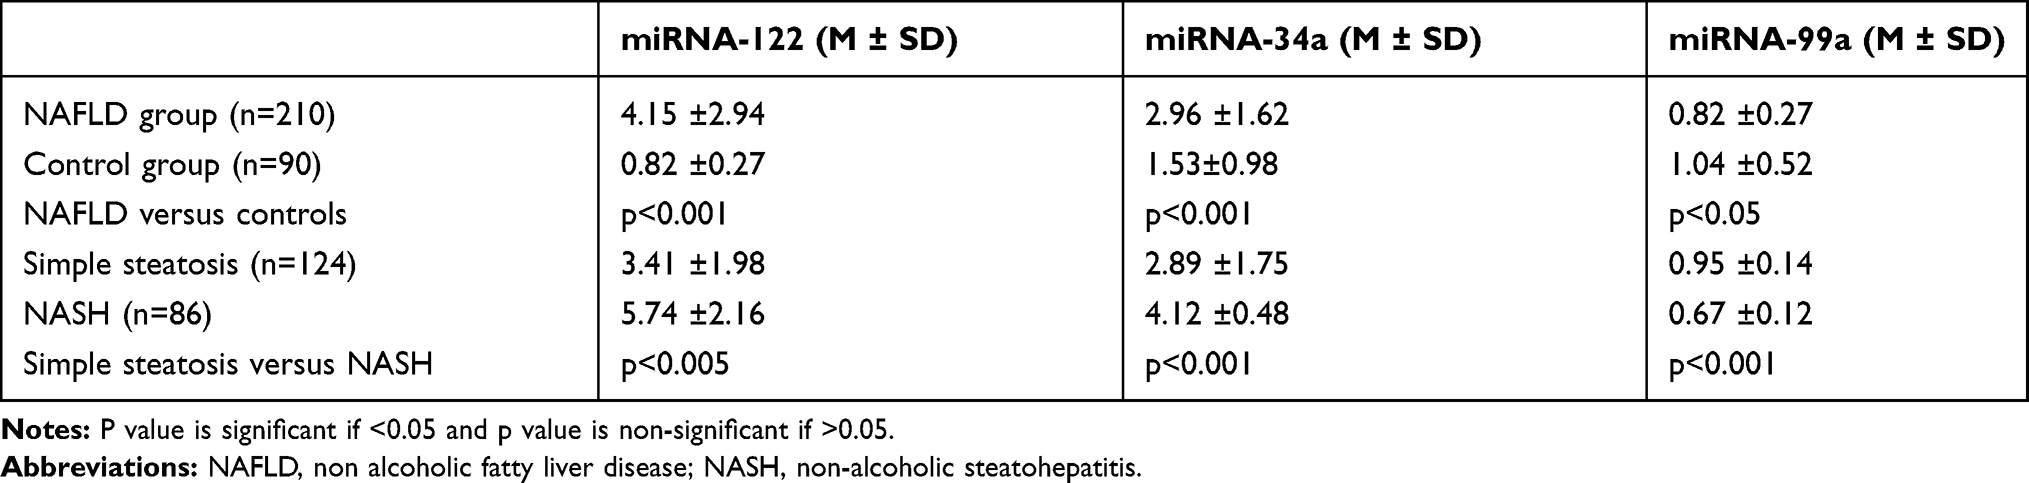 |
Table 3 Comparison of miRNAs Levels in NAFLD Patients with Control and Comparison Between NAFLD Subgroups |
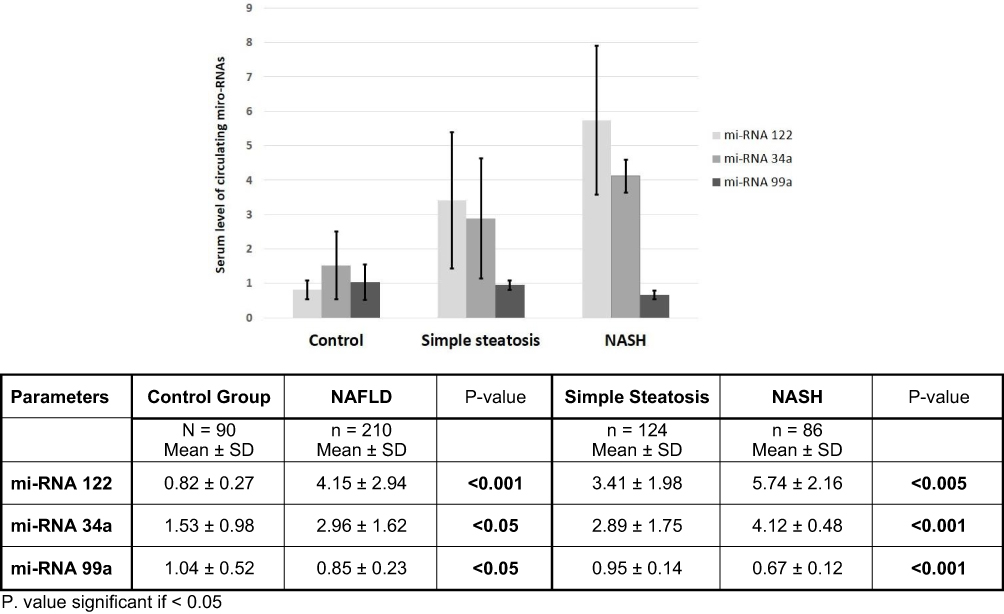 |
Figure 1 Comparing the different mean levels of circulating mi-RNAs (−122, −99a and −34a) among the main studied groups (healthy controls versus NAFLD and the simple steatosis versus NASH patients). |
Table 4 shows that the levels of both miRNA-122 and miRNA-34a were similar, having a significant positive correlation with all the laboratory parameters and all histological findings. In contrast, the levels of miRNA-99a is negatively correlated with triglycerides, LDL-c, ALT levels, and all histological findings except steatosis. Gender has no relationship with the expression of the three miRNAs studied. There was no significant correlation between gender and any of the three studied miRNAs.
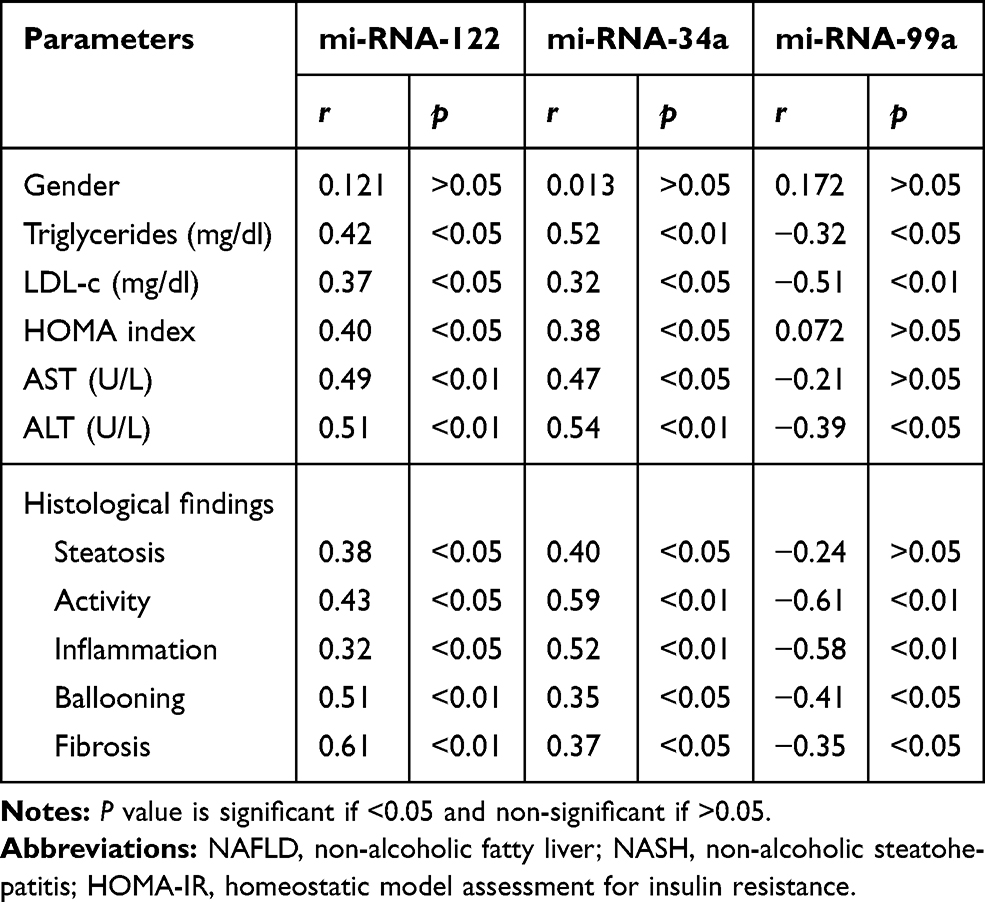 |
Table 4 Circulating mi-RNAs Expression Studied in Correlation to Clinical, Biochemical and Histopathological Parameters Among NAFLD Patients (n=210) |
ROC curve analysis indicated the cut-off value with best sensitivity and specificity and AUC was calculated. ROC curve demonstrated that mi-RNA-122, ALT, and mi-RNA-34a can differentiate between NAFLD patients and healthy controls at a cut-off 1.261, 57.6 IU, and 0.655, respectively. The AUCs were 0.92, 0.81, and 0.77 for mi-RNA-122, ALT, and mi-RNA-34a, respectively. This is followed by mi-RNA-99a (cut-off 0.821 and AUC 0.73), suggesting that the mi-RNA-122 is a good predictor for NAFLD followed by ALT level (Table 5 and Figure 2A).
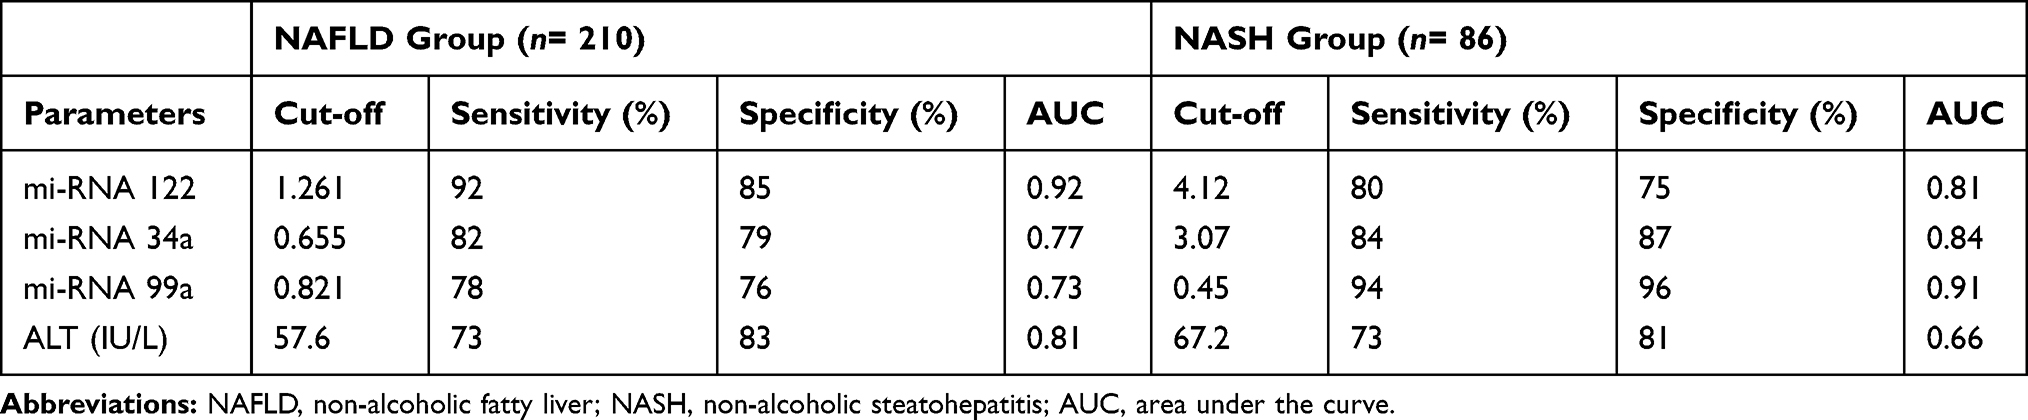 |
Table 5 Circulating mi-RNAs Levels, Sensitivity and Specificity Among NAFLD and NASH Patients |
 |
Figure 2 (A) The ROC curve of mi-RNA-122 and ALT levels among patients with NAFLD disease. (B) The ROC curve of mi-RNA-99a and ALT levels among patients with NASH. |
The mi-RNA-99a downregulation is a good predictor for NASH development. It can discriminate NASH from SS with AUR 0.91 followed by mi-RNA-34a upregulation with AUR 0.84, then mi-RNA-122 with AUR 0.81. The last predictor for NASH is ALT elevation with AUR 0.66, suggesting the mi-RNA-99a is a good predictor for NASH development with a high sensitivity (94%) compared to ALT level, which gives a low sensitivity (73%) (Table 5 and Figure 2B).
Discussion
Liver biopsy is the golden test and the most accurate method for diagnosing and staging NAFLD. However, it is typically performed when disease has progressed to clinically significant stages, and it has risk complications as an invasive technique, thereby limiting early diagnosis of patients who are at high risk of complicated NAFLD. Mi-RNAs, short, non-coding RNAs that regulate gene expression, have been associated with histological features of NAFLD and are readily detected in the circulation.31–35
The current study showed a significant increase in the level of mi-RNA-122 in NAFLD patients compared to controls, and its level is associated with disease severity from simple steatosis to steatohepatitis. This finding is in agreement with Jampoka et al.,36 who found that serum mi-RNA-122 levels in NAFLD patients were significantly higher than those found in the control group. Interestingly, the levels of serum mi-RNA-122 were significantly different between patients without steatohepatitis (NAS < 4) and steatohepatitis (NAS ≥ 4), indicating that the levels of mi-RNA-122 were related to the severity of NAFLD.
In analysis with two large-scale studies Cermelli et al. and Tryndyak et al. reported similar findings.37,38 Additionally, Tryndyak and his colleagues found increasing expression of mi-RNA-122 in mouse models of diet-induced NAFLD.38 Pirola et al.12 reported that, among 84 circulating mi-RNAs analyzed, mi-RNA-122, mi-RNA-192, mi-RNA-19a, and mi-RNA-19b, mi-RNA-125b, and mi-RNA-375 were upregulated more than twofold (p< 0.05) either in SS or NASH. The most dramatic and significant fold changes were observed in the serum levels of mi-RNA-122 (7.2-fold change in NASH versus controls).12
Moreover, the levels of mi-RNA-122 were positively correlated with the serum levels of lipid profile, HOMA-IR, AST, ALT, and histological features of liver steatohepatitis and fibrosis, and correlation appears to be independent of patient gender. These findings were in accordance with those of Cermelli et al.37 and Tryndyak et al.,38 who reported the association between mi-RNA-122 serum expression and disease severity in NAFLD patients and in addition, the mi-RNA-122 serum levels were correlated with serum lipids, fibrosis stage, and inflammation activity.37,38 In another study by Yamada et al.39 in a cohort of NAFLD patients, they found a positive correlation between mi-RNA-122 serum levels and the severity of steatosis, concluding that mi-RNA-122 may be a useful biomarker for NAFLD progression.39 Therefore, the mi-RNA-122 has been suggested as a possible therapeutic target in the treatment of hypercholesterolemia in humans.40
On the contrary, Cheung et al.41 found that mi-RNA-122 expression was significantly decreased in NASH patients. They correlated its downregulation to the alteration of hepatic lipid metabolism genes.41
Additionally the mi-RNA-34a in this study was significantly increased in patients with NAFLD compared to controls and further increase was reported in patients with NASH, the Cheung et al.41 study was in accordance with our findings. Furthermore, the mi-RNA-34a level was positively correlated with histopathological features of the liver. Similarly, Tryndyak et al.38 and Yamada et al.39 recorded that plasma levels of mi-RNA-34a, together with mi-RNA-122, were shown to be significantly associated with the severity of NAFLD-specific liver pathomorphological features in mice, and mi-RNA-34a had the strongest correlation.38,39 Accordingly, they can all be used for non-invasive monitoring of the susceptibility and extent of NAFLD.
Previous studies had shown that serum levels of mi-RNA-122 and mi-RNA-34a were significantly higher in NAFLD patients.37,42 They also found that mi-RNA-122 and mi-RNA-34a levels were correlated with liver enzyme levels, fibrosis stage and inflammation activity in NAFLD. Cermelli et al.37 found a positive correlation between serum levels of mi-RNA-34a and disease severity in both CHC and NAFLD patients, as well as in NASH patients in which mi-RNA-34a was overexpressed.37 Differences in the expression of hepatic mi-RNA-34a and other mi-RNAs were shown to be associated with susceptibility and severity of dietary NASH in mice, arguing that these mi-RNAs could be valuable steatohepatitis biomarkers.43 Thus, mi-RNA-34a may represent a useful, non-invasive biomarker of diagnosis and histological disease severity in patients, which correlates with the levels of liver enzymes, fibrosis stage, and inflammation activity.24
The third mi-RNA measured was mi-RNA-99a, it was significantly decreased in NAFLD patient and showed the lowest levels with development of steatohepatitis and its level showed an inverse correlation with triglycerides, LDL-c, ALT levels, and all histological finding except steatosis. This was explained by the mi-RNA-99a/b being downregulation in the adipose tissue of obese and NAFLD patients, which has been widely demonstrated;43 mi-RNA-99a showed its negative correlation with serum levels of FFAs and IL-6.29,44 In addition, the expression of mi-RNA-99b together with mi-RNA-197 has been observed to be significantly associated with pericellular fibrosis in NASH patients. Thus, mi-RNAs expression from visceral adipose tissue may represent a possible new means for distinguishing between simple steatosis and NASH.43 Another study conducted by Kloting et al.29 showed that human adipose tissue level of mi-RNA-99a negatively correlated with FFA levels.29
The accuracy of predictors of NASH and advanced fibrosis was investigated by determining the area under the ROC curve and AUC. By using the three mi-RNAs in NAFLD diagnosis and NASH prediction, we found that mi-RNA-122, ALT and mi-RNA-34a are good predictors of NAFLD and can differentiate NAFLD patients from healthy controls at a cut-off 1.261, 57.6 IU and 0.655, respectively, and AUC are 0.92, 0.81, and 0.77 for mi-RNA-122, ALT, and mi-RNA-34a, respectively, followed by mi-RNA-99a (at a cut off 0.821 and AUC 0.73), suggesting the mi-RNA-122 is a good predictor for NAFLD diagnosis and can differentiate cases of SS from healthy controls. Our results are accordance with Jampoka et al.,36 who reported a highly significant increase in the serum levels of mi-RNA-122 in NAFLD patients compared to the control group.36 For mi-RNA-122, the AUC was 0.831 (p< 0.0001) with 75.0% sensitivity and 82.35% specificity. López-Riera et al.45 reported an AUC of 0.812 for mi-RNA-122 followed by 0.76 for mi-RNA-34a for NAFLD diagnosis.45
The mi-RNA-99a downregulation is a good predictor for NASH development, it can discriminate NASH from SS with AUR 0.91 followed by mi-RNA-34a upregulation with AUR 0.84, then mi-RNA-122 with AUR 0.81. The last predictor for NASH is ALT elevation with AUR 0.66, suggesting the mi-RNA-99a is an excellent predictor for NASH development with a high sensitivity (94%) compared to ALT level, which gives a low sensitivity (73%). In a study by Di-Stefano and Gerhard, they concluded that the AUC for the mi-RNA panel of mi-RNA-99a and mi-RNA-122 was 0.891, suggesting potential clinical utility.35 In a recent study by Liu et al.,46 they reported that mi-RNA-122 distinguished NAFLD from healthy controls with an AUC of 0.82, and mi-RNA-34a distinguished NASH from NAFLD with an AUC of 0.78.47
Conclusion
From the previous results we conclude that the upregulation of serum mi-RNA-122 may potentially serve as a non-invasive marker for NAFLD prediction and it is a good marker reflecting liver fibrosis. The downregulation of mi-RNA may be of value for discrimination of NASH from simple steatosis. The integration of circulating mi-RNAs panel could improve their predictive performance. A large-scale future study will be needed for assessing the role of many mi-RNA profiles in the pathogenesis of NAFLD and the possibility to be target in the disease amelioration and therapy.
Acknowledgments
Forms of support received by each author for this study included a good selection of cases, instructive supervision, continuous guidance, valuable suggestions and good instructions.
Disclosure
The authors report no conflicts of interest in this work.
References
1. Starley BQ, Calcagno CJ, Harrison SA. Nonalcoholic fatty liver disease and hepatocellular carcinoma: a weighty connection. Hepatology. 2010;51(5):1820–1832. doi:10.1002/hep.23594
2. Marra F, Gastaldelli A, Svegliati BG, Tell G, Tiribelli C. Molecular basis and mechanisms of progression of non-alcoholic steatohepatitis. Trends Mol Med. 2008;14(2):72–81. doi:10.1016/j.molmed.2007.12.003
3. Ferreira DM, Simao AL, Rodrigues CM, Castro RE. Revisiting the metabolic syndrome and paving the way for microRNAs in non-alcoholic fatty liver disease. FEBS J. 2014;281(11):2503–2524. doi:10.1111/febs.12806
4. Spengler EK, Loomba R. Recommendations for diagnosis, referral for liver biopsy, and treatment of nonalcoholic fatty liver disease and nonalcoholic steatohepatitis. Mayo Clin Proc. 2015;90(9):1233–1246. doi:10.1016/j.mayocp.2015.06.013
5. Myers RP, Pollett A, Kirsch R, et al. Controlled Attenuation Parameter (CAP): a noninvasive method for the detection of hepatic steatosis based on transient elastography. Liver Int. 2012;32(6):902–910. doi:10.1111/liv.2012.32.issue-6
6. Shen F, Zheng RD, Mi YQ, et al. Controlled attenuation parameter for non-invasive assessment of hepatic steatosis in Chinese patients. World J Gastroenterol. 2014;20(16):4702–4711. doi:10.3748/wjg.v20.i16.4702
7. Ma H, Wu Y, Yang H, et al. MicroRNAs in oral lichen planus and potential mi-RNA-mRNA pathogenesis with essential cytokines: a review. Oral Surg Oral Med Oral Pathol Oral Radiol. 2016;122(2):164–173. doi:10.1016/j.oooo.2016.03.018
8. Mehta R, Otgonsuren M, Younoszai Z, Allawi H, Raybuck B, Younossi Z. Circulating mi-RNA in patients with non-alcoholic fatty liver disease and coronary artery disease. BMJ Open Gastroenterol. 2016;3(1):e000096. doi:10.1136/bmjgast-2016-000096
9. Selbach M, Schwanhausser B, Thierfelder N, Fang Z, Khanin R, Rajewsky N. Widespread changes in protein synthesis induced by microRNAs. Nature. 2008;455(7209):58–63. doi:10.1038/nature07228
10. Ambros V. The functions of animal microRNAs. Nature. 2004;431(7006):350–355. doi:10.1038/nature02871
11. Lee RC, Ambros V. An extensive class of small RNAs in Caenorhabditiselegans. Science. 2001;294(5543):862–864. doi:10.1126/science.1065329
12. Pirola CJ, Fernandez GT, Castano GO, et al. Circulating microRNA signature in non-alcoholic fatty liver disease: from serum non-coding RNAs to liver histology and disease pathogenesis. Gut. 2015;64(5):800–812. doi:10.1136/gutjnl-2014-306996
13. Weiland M, Gao XH, Zhou L, Mi QS. Small RNAs have a large impact: circulating microRNAs as biomarkers for human diseases. RNA Biol. 2012;9(6):850–859. doi:10.4161/rna.20378
14. Kloosterman WP, Plasterk RH. The diverse functions of microRNAs in animal development and disease. Dev Cell. 2006;11(4):441–450. doi:10.1016/j.devcel.2006.09.009
15. Daimiel-Ruiz L, Klett-Mingo M, Konstantinidou V, et al. Dietary lipids modulate the expression of mi-RNA-107, a mi-RNA that regulates the circadian system. Mol Nutr Food Res. 2015;59(9):1865–1878.
16. Srinivasan H, Das S. Mitochondrial mi-RNA (Mitomi-R): a new player in cardiovascular health. Can J Physiol Pharmacol. 2015;93(10):855–861. doi:10.1139/cjpp-2014-0500
17. Shaked A, Chang BL, Barnes MR, et al. An ectopically expressed serum mi-RNA signature is prognostic, diagnostic, and biologically related to liver allograft rejection. Hepatology. 2017;65(1):269–280. doi:10.1002/hep.28786
18. Zhou X, Jeker LT, Fife BT, et al. Selective mi-RNA disruption in T reg cells leads to uncontrolled autoimmunity. J Exp Med. 2008;205(9):1983–1991. doi:10.1084/jem.20080707
19. Cramer DW, Elias KM. A prognostically relevant mi-RNA signature for epithelial ovarian cancer. Lancet Oncol. 2016;17(8):1032–1033. doi:10.1016/S1470-2045(16)30149-8
20. Mollainezhad H, Eskandari N, Pourazar A, Salehi M, Andalib A. Expression of microRNA-370 in human breast cancer compare with normal samples. Adv Biomed Res. 2016;5:129. doi:10.4103/2277-9175.186987
21. Salvoza NC, Klinzing DC, Gopez-Cervantes J, Baclig MO. Association of circulating serum mi-RNA-34a and mi-RNA-122 with dyslipidemia among patients with non-alcoholic fatty liver disease. PLoS One. 2016;11(4):e0153497. doi:10.1371/journal.pone.0153497
22. Moore KJ, Rayner KJ, Suarez Y, Fernandez-Hernando C. The role of microRNAs in cholesterol efflux and hepatic lipid metabolism. Annu Rev Nutr. 2011;31:49–63. doi:10.1146/annurev-nutr-081810-160756
23. Sacco J, Adeli K. MicroRNAs: emerging roles in lipid and lipoprotein metabolism. Curr Opin Lipidol. 2012;23(3):220–225. doi:10.1097/MOL.0b013e3283534c9f
24. Gori M, Arciello M, Balsano C. MicroRNAs in nonalcoholic fatty liver disease: novel biomarkers and prognostic tools during the transition from steatosis to hepatocarcinoma. Biomed Res Int. 2014;2014:741465. doi:10.1155/2014/741465
25. Lee J, Padhye A, Sharma A, et al. A pathway involving farnesoid X receptor and small heterodimer partner positively regulates hepatic sirtuin 1 levels via microRNA-34a inhibition. J Biol Chem. 2010;285(17):12604–12611. doi:10.1074/jbc.M109.094524
26. Min HK, Kapoor A, Fuchs M, et al. Increased hepatic synthesis and dysregulation of cholesterol metabolism is associated with the severity of nonalcoholic fatty liver disease. Cell Metab. 2012;15(5):665–674. doi:10.1016/j.cmet.2012.04.004
27. Castro RE, Ferreira DM, Afonso MB, et al. MiR-34a/SIRT1/p53 is suppressed by ursodeoxycholic acid in the rat liver and activated by disease severity in human non-alcoholic fatty liver disease. J Hepatol. 2013;58(1):119–125. doi:10.1016/j.jhep.2012.08.008
28. Li D, Liu X, Lin L, et al. MicroRNA-99a inhibits hepatocellular carcinoma growth and correlates with prognosis of patients with hepatocellular carcinoma. J Biol Chem. 2011;286(42):36677–36685. doi:10.1074/jbc.M111.270561
29. Kloting N, Berthold S, Kovacs P, et al. MicroRNA expression in human omental and subcutaneous adipose tissue. PLoS One. 2009;4(3):e4699. doi:10.1371/journal.pone.0004699
30. Hyysalo J, Mannisto VT, Zhou Y, et al. A population-based study on the prevalence of NASH using scores validated against liver histology. J Hepatol. 2014;60(4):839–846. doi:10.1016/j.jhep.2013.12.009
31. Di-Stefano JK, Gerhard GS. Circulating microRNAs in nonalcoholic fatty liver disease. Expert Rev Gastroenterol Hepatol. 2016;10(2):161–163. doi:10.1586/17474124.2016.1125290
32. Elbaz T, Abdo M, Omar H, et al. Efficacy and safety of sofosbuvir and daclatasvir with or without ribavirin in elderly patients with chronic hepatitis C virus infection. J Med Virol. 2019;91(2):272–277. doi:10.1002/jmv.25287.
33. Omar N, Gamil K, Abdel-Samiee M, Naguib M. IP-10 as a predictor of treatment response in chronic hepatitis C patients. Int J Adv Res. 2017;5:752–766. doi:10.21474/IJAR01/3568
34. El Samiee MA, Tharwa ES, Obada MA, Gabal AKA, Salama M. Gamma-glutamyltranspeptidase and α-fetoprotein: are they predictors of treatment response in patients with chronic hepatitis C? Egypt Liver J. 2011;1(1):18–24. doi:10.1097/01.ELX.0000397031.25671.75
35. El-Shafie M, Allam H, El-Shall L, et al. Nuclear factor-kappa B expression and acyl-ghrelin in egyptian patients with non-alcoholic fatty liver. World J Res Rev. 2017;4(3):1–7.
36. Jampoka K, Muangpaisarn P, Khongnomnan K, Treeprasertsuk S, Tangkijvanich P, Payungporn S. Serum mi-RNA-29a and mi-RNA-122 as potential biomarkers for Non-Alcoholic Fatty Liver Disease (NAFLD). Microrna. 2018;7(3):215–222. doi:10.2174/2211536607666180531093302
37. Cermelli S, Ruggieri A, Marrero JA, Ioannou GN, Beretta L. Circulating microRNAs in patients with chronic hepatitis C and non-alcoholic fatty liver disease. PLoS One. 2011;6(8):e23937. doi:10.1371/journal.pone.0023937
38. Tryndyak VP, Latendresse JR, Montgomery B, et al. Plasma microRNAs are sensitive indicators of inter-strain differences in the severity of liver injury induced in mice by a choline- and folate-deficient diet. Toxicol Appl Pharmacol. 2012;262(1):52–59. doi:10.1016/j.taap.2012.04.018
39. Yamada H, Suzuki K, Ichino N, et al. Associations between circulating microRNAs (mi-RNA-21, mi-RNA-34a, mi-RNA-122 and mi-RNA-451) and non-alcoholic fatty liver. Clin Chim Acta. 2013;424:99–103. doi:10.1016/j.cca.2013.05.021
40. Elmen J, Lindow M, Schutz S, et al. LNA-mediated microRNA silencing in non-human primates. Nature. 2008;452(7189):896–899. doi:10.1038/nature06783
41. Cheung O, Puri P, Eicken C, et al. Nonalcoholic steatohepatitis is associated with altered hepatic MicroRNA expression. Hepatology. 2008;48(6):1810–1820. doi:10.1002/hep.22569
42. Celikbilek M, Baskol M, Taheri S, et al. Circulating microRNAs in patients with non-alcoholic fatty liver disease. World J Hepatol. 2014;6(8):613–620. doi:10.4254/wjh.v6.i8.613
43. Pogribny IP, Starlard-Davenport A, Tryndyak VP, et al. Difference in expression of hepatic microRNAs mi-RNA-29c, mi-RNA-34a, mi-RNA-155, and mi-RNA-200b is associated with strain-specific susceptibility to dietary nonalcoholic steatohepatitis in mice. Lab Invest. 2010;90(10):1437–1446. doi:10.1038/labinvest.2010.113
44. Estep M, Armistead D, Hossain N, et al. Differential expression of mi-RNAs in the visceral adipose tissue of patients with non-alcoholic fatty liver disease. Aliment Pharmacol Ther. 2010;32(3):487–497. doi:10.1111/apt.2010.32.issue-3
45. Lopez-Riera M, Conde I, Quintas G, et al. Non-invasive prediction of NAFLD severity: a comprehensive, independent validation of previously postulated serum microRNA biomarkers. Sci Rep. 2018;8(1):10606. doi:10.1038/s41598-018-28854-4
46. Liu CH, Ampuero J, Gil-Gomez A, et al. mi-RNAs in patients with non-alcoholic fatty liver disease: a systematic review and meta-analysis. J Hepatol. 2018;69(6):1335–1348. doi:10.1016/j.jhep.2018.08.008
47. Akuta N, Kawamura Y, Suzuki F, et al. Impact of circulating miR-122 for histological features and hepatocellular carcinoma of nonalcoholic fatty liver disease in Japan. Hepatol Int. 2016;10(4):647–656. doi:10.1007/s12072-016-9729-2
 © 2019 The Author(s). This work is published and licensed by Dove Medical Press Limited. The full terms of this license are available at https://www.dovepress.com/terms.php and incorporate the Creative Commons Attribution - Non Commercial (unported, v3.0) License.
By accessing the work you hereby accept the Terms. Non-commercial uses of the work are permitted without any further permission from Dove Medical Press Limited, provided the work is properly attributed. For permission for commercial use of this work, please see paragraphs 4.2 and 5 of our Terms.
© 2019 The Author(s). This work is published and licensed by Dove Medical Press Limited. The full terms of this license are available at https://www.dovepress.com/terms.php and incorporate the Creative Commons Attribution - Non Commercial (unported, v3.0) License.
By accessing the work you hereby accept the Terms. Non-commercial uses of the work are permitted without any further permission from Dove Medical Press Limited, provided the work is properly attributed. For permission for commercial use of this work, please see paragraphs 4.2 and 5 of our Terms.