")
Back to Journals » Cancer Management and Research » Volume 13
The Circadian Gene NPAS2 Act as a Putative Tumor Stimulative Factor for Uterine Corpus Endometrial Carcinoma
Authors Zheng X , Lv X, Zhu L, Xu K, Shi C , Cui L, Ding H
Received 9 October 2021
Accepted for publication 8 December 2021
Published 22 December 2021 Volume 2021:13 Pages 9329—9343
DOI https://doi.org/10.2147/CMAR.S343097
Checked for plagiarism Yes
Review by Single anonymous peer review
Peer reviewer comments 2
Editor who approved publication: Professor Seema Singh
Xiaojiao Zheng,1,2 Xiuyi Lv,1 Linyan Zhu,1 Kejun Xu,1 Cong Shi,1 Lining Cui,1 Huiqing Ding1
1Department of Obstetrics and Gynecology, Ningbo First Hospital, Ningbo, Zhejiang, 315035, People’s Republic of China; 2Department of Biochemistry & Genetics, The National Education Base for Basic Medical Sciences, Institute of Cell Biology, Zhejiang University School of Medicine, Hangzhou, 310058, Zhejiang Province, People’s Republic of China
Correspondence: Lining Cui; Huiqing Ding Email [email protected]; [email protected]
Background: Mounting evidence indicates altered circadian rhythm represents a critical factor affecting carcinogenesis and tumor progression. The circadian gene neuronal PAS domain protein 2 (NPAS2) constitutes a newly discovered prognostic biomarker. NPAS2 dysregulation is found in multiple malignancies, although its functions in uterine corpus endometrial carcinoma (UCEC) remain largely unknown.
Objective: To evaluate NPAS2’s roles in UCEC and to explore the underlying mechanisms.
Methods: NPAS2 transcription levels, patient prognosis, different clinical stages and target microRNAs in UCEC cases were comparatively assessed based on public databases, including UALCAN, GEPIA, TIMER, Kaplan–Meier plotter, starBase database, LinkedOmics and String. Then, qRT-PCR and immunohistochemical analysis were applied to analyze the expression of NPAS2 in UCEC tissue samples. CCK-8, clonogenic assay and flow cytometry were carried out for detecting cell viability, colony formation ability and cell apoptosis, respectively.
Results: NPAS2 was upregulated in tissue samples from UCEC cases compared with the corresponding control specimens. NPAS2 overexpression was associated with decreased overall (OS), disease free (DFS) and relapse free (RFS) survival in UCEC. In addition, NPAS2 overexpression was associated with clinical stage, tumor grade, estrogen receptor status, myometrial invasion in UCEC. Furthermore, NPAS2 knockdown or overexpression altered cell proliferation and apoptosis in UCEC. Moreover, NPAS2 showed significant negative correlations with miR-17-5p and miR-93-5p, and positive correlations with miR-106a-5p and miR-381-3p in UCEC.
Conclusion: NPAS2 overexpression is associated with poor prognosis and clinicopathological characteristics in UCEC and promotes proliferation and colony formation while inhibiting apoptosis. Finally, NPAS2 is associated with several miRNAs in UCEC.
Keywords: NPAS2, circadian rhythm, cell cycle, apoptosis, uterine corpus endometrial carcinoma
Introduction
Uterine Corpus Endometrial Carcinoma (UCEC), along with cervical and ovarian cancers, are the three most prevalent gynecological cancers.1 Despite improved diagnostic skills as well as breakthroughs in effective treatment strategies for endometrial cancer, the latter remains the second most lethal gynecological malignancy among women worldwide; new endometrial cancer cases amount to about eighty thousand, and its incidence has substantially increased in Europe each year.2,3 Early detection strategies are lacking, and multiple molecular pathways responsible for tumor growth, apoptosis and metastatic behaviors in UCEC cells have not been clarified. New hypotheses on the development of endometrial cancer have emerged with the discovery of circadian clock genes and their roles in posttranscriptional gene expression regulation.
The circadian clock is based on a core transcriptional-translational feedback, which generates rhythmic changes with 24-hour light–dark cycle in many important behaviors and physiological processes, including cardiovascular disease, infertility, diabetes, tumor development and sleep disorders.4,5 There are 14 clock genes that regulate biological activities, including Per1, Per2, Per3, Cry1, Cry2, Clock, Bmall1, TIM, CK1, NPAS2, Ref-ERbs, Dec2, and RORs.4 NPAS2, a mammalian transcription factor, is the largest Clock gene found in humans, with a length of 176.68 kb. It is homologous to Clock (Circadian Locomotor Output Cycles Kaput) genes and belongs to the transcription factor BHLH-PAS (Basic helix-loop-helix-PAS) family. Basic helix-loop-helix/PAS domain subfamily proteins, control the circadian rhythm through the regulation of a negative feedback loop.6 The PAS domains of NPAS2 play crucial roles in circadian rhythm generation, interacting with heme as a prosthetic group and allowing a heme-based mode of signal transduction.7 NPAS2 might independently fold modules of ~130 amino acids that sense light, voltage, redox, or oxygen and other environmental and developmental signals.6 NPAS2 is involved in cell cycle and DNA damage response8.
However, the mechanisms by which NPAS2 plays potential biological roles in UCEC are largely unclear. Given the established association between circadian clock gene dysregulation and cancer, we hypothesized that NPAS2 might play a role in UCEC by affecting tumor activity. To test this hypothesis, NPAS2 expression in UCEC samples was examined, as well as its functional roles in UCEC cells in vitro. More importantly, we systematically explored the underlying molecular mechanisms in UCEC cells using a bioinformatic approach, with data already available in public databases.
Materials and Methods
GEPIA
GEPIA (http://gepia.cancer-pku.cn/index.html) encompasses RNA-sequencing data for 9736 tumor and 8587 noncancerous tissue specimens, proposed by Peking University.9 A differential mRNA expression analysis of cancer and noncancerous tissue specimens, pathological stage assessment and correlative prognostic analysis of NPAS2 were carried out using the “Single Gene Analysis” module of GEPIA. Data were compared by Student’s t-test, and P < 0.05 was deemed to indicate statistical significance.
UALCAN
UALCAN (http://ualcan.path.uab.edu/analysis.html) comprehensively analyzes datasets in The Cancer Genome Atlas (TCGA) and MET500 cohort data.10 NPAS2 expression data were obtained with the “Expression Analysis” module of UALCAN based on the “UCEC” dataset. P < 0.05 in Student’s t-test was considered statistically significant.
Kaplan–Meier Plotter Analysis
Kaplan–Meier plotter (http://kmplot.com/analysis/) allows the assessment of genes’ roles in survival for >20 cancer types, including UCEC. It was utilized for survival analysis based on NPAS2 expression in UCEC according to our previous study.11 Log rank p<0.05 indicated statistical significance.
cBioPortal
cBioPortal (www.cbioportal.org) comprehensively visualizes and analyzes multidimensional cancer genomics data.12 Based upon TCGA, the genetic changes, co-expressed genes and network modules of NPAS2 were detected. Totally, 529 UCEC cases were examined. Gene (RNA Seq V2 RSEM) and protein (RPPA) expression z scores were determined, with ±2.0 fold change as threshold.
TIMER
TIMER (https://cistrome.shinyapps.io/timer/) systematically analyzes immune cell infiltration and associated impacts on the patient.13 The “Gene” and “Survival” modules were utilized to assess associations of NPAS2 expression and patient outcome with immune cell infiltration.
LinkedOmics
LinkedOmics (http://www.linkedomics.org/) comprehensively analyses the multi-omics data of 32 distinct TCGA cancers.14 The “Linkfinder” module was utilized to examine the miRNA enrichments of NPAS2. The Spearman correlation test was performed for data analysis, and P < 0.05 indicated statistical significance.
starBase
starBase (http://starbase.sysu.edu.cn/), which allows the exploration of miRNA studies,15 was utilized to carry out correlation analysis between miRNAs and NPAS2 expression in UCEC.
Human Uterine Corpus Endometrial Carcinoma Tissues
Totally 52 paired samples of UCEC and adjacent noncancerous tissues were obtained from individuals surgically treated in Ningbo First Hospital. All samples were obtained after written informed consent. The subjects were diagnosed with UCEC at different stages (stages I–IV) without chemotherapy or radiotherapy before surgery. All specimens underwent immediate freezing in liquid nitrogen and storage at −80°C until processing. The protocol had approval from the Research Ethics Committee of Ningbo First Hospital (Petition Number: 2018-R061).
Tissue Chips and Immunohistochemistry
Tissue chips were provided by Ningbo First Hospital. Each dot represented a 1.6 mm-diameter tissue specimen from an individual sample that was pathologically confirmed. Tissue microarray sections were stored at 4°C and assessed by immunohistochemistry using primary antibodies raised against NPAS2 (1:500, GeneTex, Irvine, CA).
Cell Culture
Human endometrial carcinoma cells, including ECC-1, HEC-1-B (Procell, China), AN3CA and Ishikawa (Shanghai Fuxiang Biotechnology, China) underwent culture in a humid environment at 37°C with 5% carbon dioxide in RPMI 1640 (Ishikawa and ECC-1) or MEM (AN3CA and HEC-1-B) containing 10% fetal bovine serum (FBS).
Plasmid Construction and Cell Transfection
For NPAS2 overexpression and NPAS2-knockdown, AN3CA and Ishikawa cells were incubated overnight to 70%~80% confluence. Then, Ishikawa were transfected with 2.5 μg of NPAS2 overexpressing NPAS2 or Ctrl plasmid, while AN3CA were transfected with short hairpin RNA (shRNA) targeting NPAS2 or Ctrl plasmid (Genekai, Shanghai, China). Transfection was performed with Lipofectamine 2000 (Invitrogen, USA) for 48 h as directed by the manufacturer. To evaluate transfection efficiency, Western blot and quantitative real-time PCR (qRT-PCR) were performed, and green fluorescence protein (GFP) expressing cells were analyzed by fluorescence microscopy.
qRT-PCR
Total RNA extraction from cell and fresh tissue specimens utilized TRIzol reagent (Invitrogen). RNA specimens with A260/A280 ratio ranging between 1.8 and 2.0 were assessed. The cDNA was synthesized using a reverse transcription kit from TaKaRa (China), and amplification used the SYBR qRT-PCR Kit (TaKaRa), as directed by the manufacturer. An Applied Step-one real-time PCR system (ABI, USA) was utilized for qRT-PCR. The 2−∆∆Ct method was applied for analysis.
Western Blot
RIPA buffer (Solarbio, USA) was utilized for cell lysis. The specimens were then centrifuged (12,000 rpm for 10 min) at 4°C. Proteins in the resulting supernatant were resolved by 10% SDS-PAGE, followed by transfer onto PVDF membranes (Millipore, USA). Blocking with 5% BSA (Beyotime, China) was followed by overnight incubation with primary antibodies, including rabbit anti-human NPAS2 polyclonal (1:1000; Thermo Fisher, USA) and mouse anti-human GAPDH monoclonal (1:50000; Proteintech, USA) antibodies at 4°C. Next, HRP-linked goat anti-rabbit or HRP-linked goat anti-mouse secondary antibodies (1:5000; Proteintech) were added as appropriate for 1 h at ambient. The BeyoECL Plus detection solution (Beyotime) was utilized for visualization.
Cell Viability Analysis
CCK-8 was utilized for cell viability assessment. Following transfection, cells underwent seeding into 96-well plates at 2×10³ cells per well. At various times, 10 μL of CCK-8 solution (Dojindo, Japan) was supplemented per well for another 1 to 2-hour incubation at 37°C. Absorbance was read at 450 nm.
Colony Forming Assay
AN3CA cells (control- and NPAS2-shRNA transfected, respectively) and Ishikawa cells (control- and NPAS2 overexpression-plasmid transfected, respectively) were transfected for 48 h. Subsequently, 500 cells underwent seeding into 6-well plates and incubation in a CO2 incubator for 10–14 days. Microscopy was utilized to examine cells fixed (4% PFA for 30 min) and crystal violet (0.1%) stained for 20 min. Colonies with >50 cells were counted, and the colony formation rate was determined as (number of colonies/number of cells seeded) ×100%.16
Cell Cycle Analysis
For cell-cycle analysis, cells underwent transfection for 48 hours (37°C, 5% CO2) and treatment with Cell cycle Detection Kit (MultiSciences, China) as directed by the manufacturer. In brief, after two phosphate-buffered saline (PBS) washes, the cells were treated with 10 μL permeabilization solution and stained with 1 mL DNA-staining solution at ambient, shielded from light, for 30 min. Finally, flow cytometry (BD Biosciences, USA) was carried out, and the Verity Software House software (VHS, USA) was used for analysis.
Cell Cytotoxicity and Apoptosis Assays
Cytotoxicity of CCCP was assessed by the CCK-8 assay. In the CCK-8 assay, EC cancer cells underwent treatment with 0, 5, 15, 20, 25, 30 and 50 µM CCCP in 96-well plates in triplicate. After 6 h, the CCK-8 assay was carried out for cell viability quantitation [18]. For cell apoptosis analysis, cells were transfected for 48 hours (37°C, 5% CO2), with or without CCCP, and the Annexin V-PE/7-AAD Apoptosis Detection Kit (Beijing Transgen, China) was used for assessment, as directed by the manufacturer.
Statistical Analysis
SPSS 22.0 (SPSS Inc., USA) and GraphPad Prism v7.0 (GraphPad, USA) were utilized for data analysis. Group pairs and multiple groups were compared by Student’s t-test and one-way analysis of variance (ANOVA), respectively. The chi-square test was performed for clinical data. P<0.05 was deemed to indicate statistical significance.
Results
NPAS2 is Overexpressed in UCEC and Associated with Reduced Survival
To elucidate the possible roles of NPAS2 in carcinogenesis, NPAS2 mRNA amounts in various clinical tumor specimens were examined. As shown in Figure 1A, NPAS2 mRNA amounts were elevated in most clinical cancer specimens. We also comparatively assessed NPAS2 mRNA amounts between malignant and noncancerous tissues in pan-cancer types; using TIMER data, NPAS2 amounts were markedly higher in cancer tissues, including CHOL, COAD, ESCA, KIRP, LIHC, LUAD, LUSC, PRAD, READ, STAD and UCEC, and remarkably reduced in other cancers such as HNSC, KICH, KIRC and SKCM (*P<0.05; **P<0.01; ***P<0.001) (Figure 2B). Based on TCGA dataset via UALCAN, we also found NPAS2 protein amounts in primary UCEC were higher compared with normal tissue specimens (***P<0.001) (Figure 1C). Survival analysis demonstrated individuals with elevated NPAS2 amounts had remarkably reduced overall survival (OS) and disease-free survival (DFS) using GEPIA (Figure 1D and E). In addition, individuals with elevated NPAS2 expression had remarkably lower OS, relapse free survival (RFS) using Kaplan–Meier plotter (Figure 1F and G). Therefore, NPAS2 might act as an oncogene in UCEC, and was associated with poor prognosis.
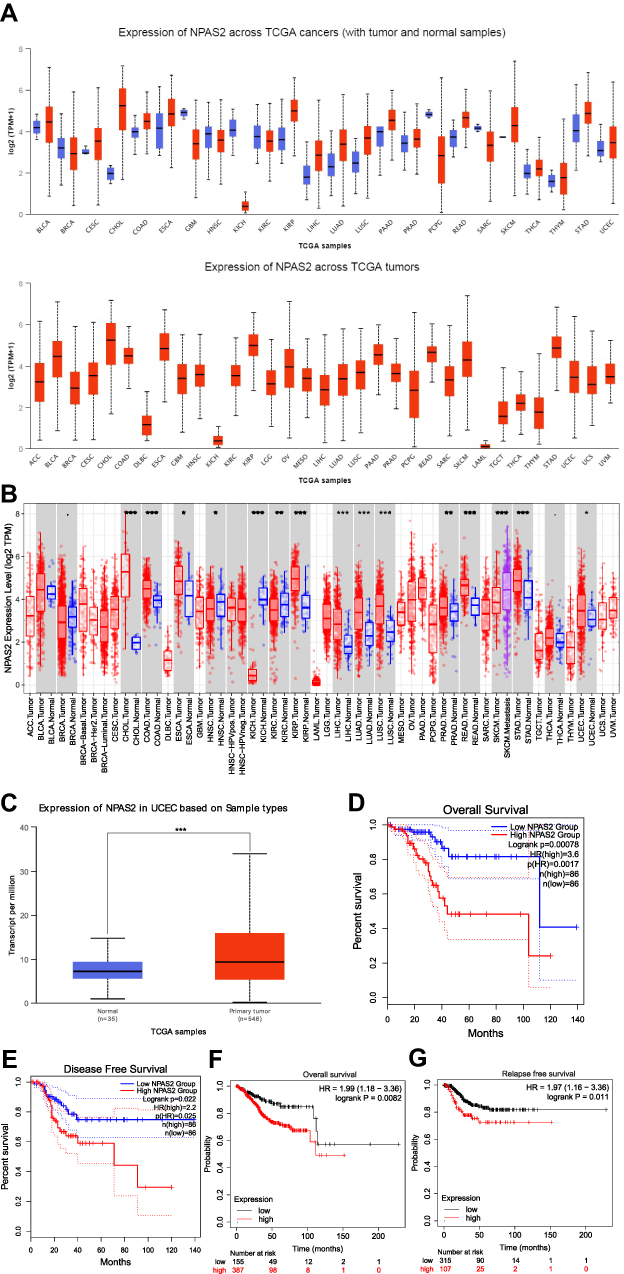 |
Figure 1 (A) NPAS2 expression in pan-cancer, analyzed by UALCAN. (B) The expression status of the NPAS2 gene in pan-cancer through TIMER. *P < 0.05; **P < 0.01; ***P < 0.001. (C) Based on the TCGA dataset, we also analyzed the expression level of NPAS2 protein between normal tissue and primary tissue of UCEC by UALCAN. (D and E) Prognostic value of NPAS2 mRNA level in UCEC, analyzed by GEPIA. (F and G) Prognostic value of NPAS2 mRNA level in UCEC, analyzed by Kaplan–Meier plotter. |
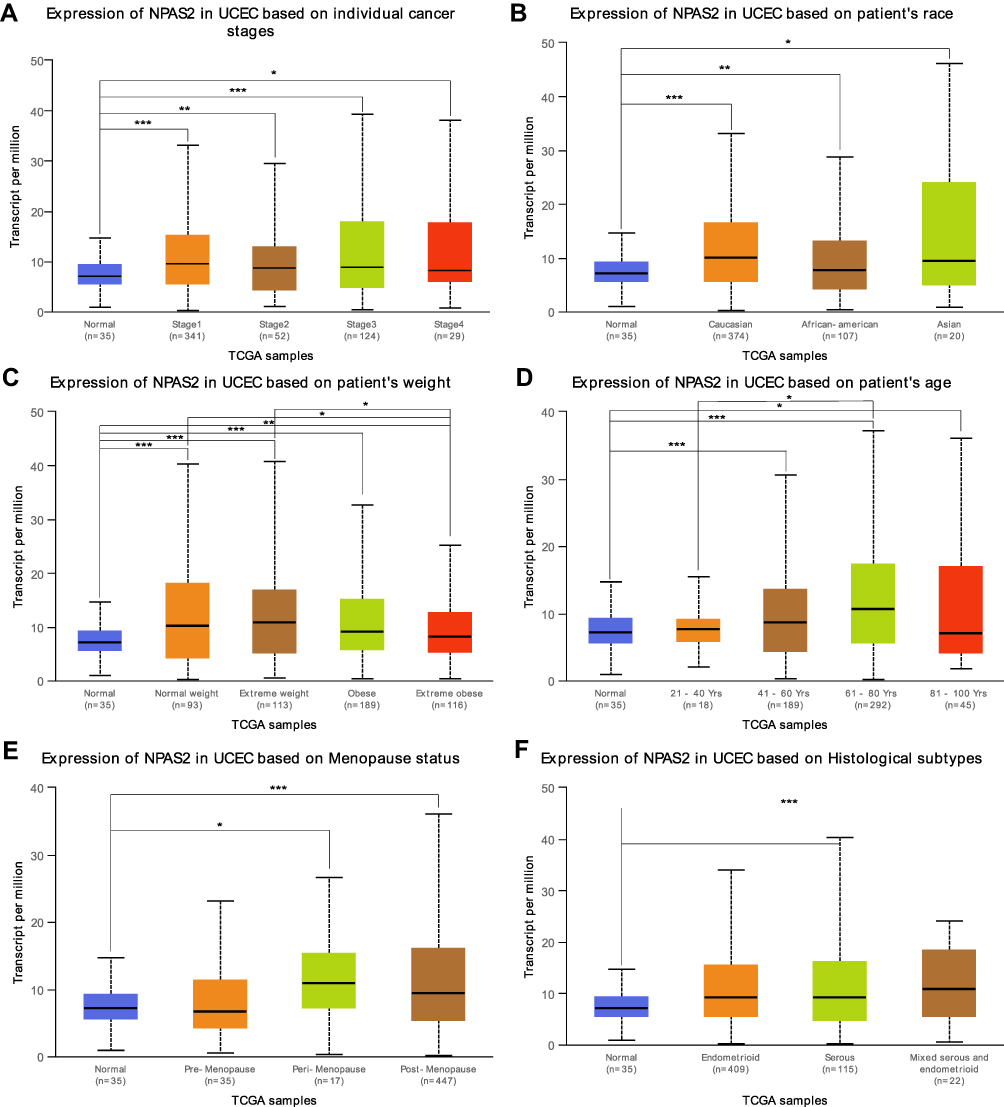 |
Figure 2 Box plots of NPAS2 expression in different clinical stages (A) patient’s race (B) patient’s weight (C) patient’s age (D) Menopause status (E) and Histological subtypes (F) of UCEC.analyzed by UALCAN. Note: *P < 0.05; **P < 0.01; ***P < 0.001. |
Relationships Between NPAS2 and Clinicopathological Features in UCEC
Combined with clinical information in TCGA UCEC dataset by UALCAN, it was found that NPAS2 showed significant differences at individual cancer stages (normal vs stage 1, ***P<0.001; normal vs stage 2, **P<0.01; normal vs stage 3, ***P<0.001; normal vs stage 5, *P<0.05) (Figure 2A), patient’s race (normal vs Caucasian, ***P<0.001; normal vs African-American, **P<0.01; normal vs Asian, *P<0.05) (Figure 2B), patient’s weight (normal vs normal weight, extreme weight and obese, ***P<0.001; normal vs extreme obesity, ***P<0.01; normal weight vs extreme obesity, *P<0.05; extreme weight vs extreme obesity, *P<0.05) (Figure 2C), patient’s age (normal vs 41–60 Yrs and 61–80 Yrs, ***P<0.001; 21–40 Yrs vs 61–80 Yrs, *P<0.05; normal vs 81–100 Yrs, *P<0.05) (Figure 2D), menopause status (normal vs peri-menopause, *P<0.05; normal vs post-menopause, ***P<0.001) (Figure 2E) and histological subtypes (normal vs serous, ***P<0.001) (Figure 2F). The LinkFinder module of LinkedOmics was utilized for analyzing NPAS2 for its associations with clinical features (histological, MIS-phenotype, overall-survival, residual-tumor, radiation-therapy and tumor-purity) in TCGA-UCEC cohort (Figure 3). The results revealed that high NPAS2 expression was associated with poor survival of UCEC patients in the LinkedOmics database (P=0.000579) (Figure 3C), as well as residual-tumor (P= 0.00542) (Figure 3D).
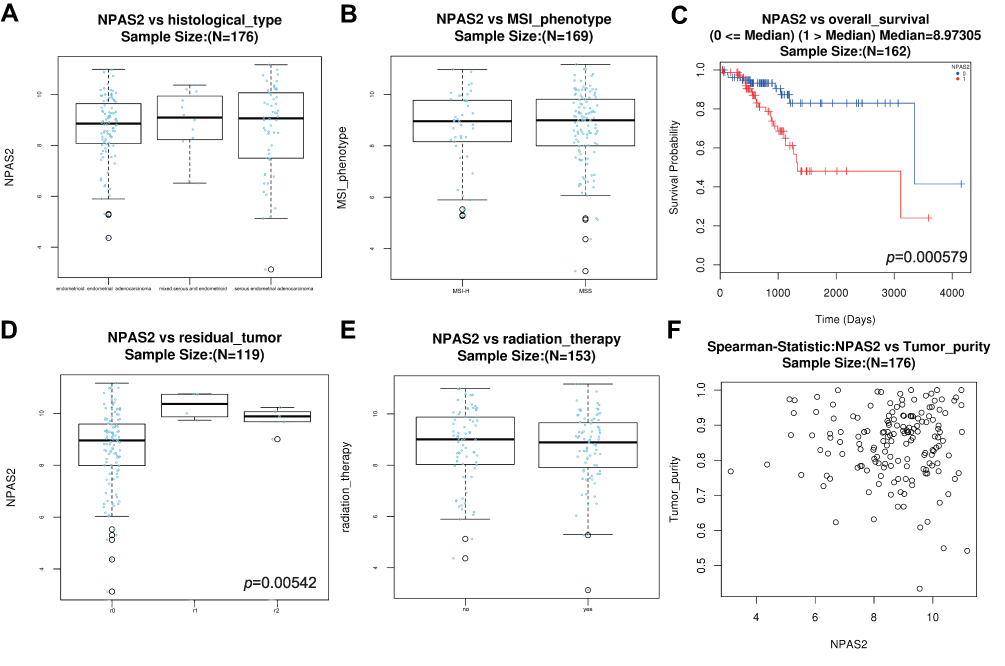 |
Figure 3 Histological-type (A) MSI-phenotype (B) overall-survival (C) residual-tumor (D) radiation-therapy (E) Tumor-purity (F) vs NPAS2 mRNA level in UCEC, analyzed by LinkedOmics. |
NPAS2 is Upregulated in Endometrial Cancer and Associated with Clinicopathological Characteristics
NPAS2 expression was evaluated in 53 pairs of UCEC and adjacent normal tissue specimens by qRT-PCR. As shown in Figure 4A, NPAS2 was downregulated in tumor samples in comparison with adjacent noncancerous tissue specimens. A tissue microarray containing 53 uterine corpus endometrial carcinoma (UCEC) tissue samples and 20 normal endometrial tissue samples was examined immunohistochemically. Based on IHC findings, cases were assigned to the high- and low-expression groups (Figure 4B). To the best of our knowledge, clinical data were firstly collected to explore their relationships with NPAS2. As presented in Table 1, positive correlations between clinical stage (P=0.015), grade (P=0.004), myometrial invasion (P=0.024) and estrogen receptor status (P=0.026), and NPAS2 expression were found.
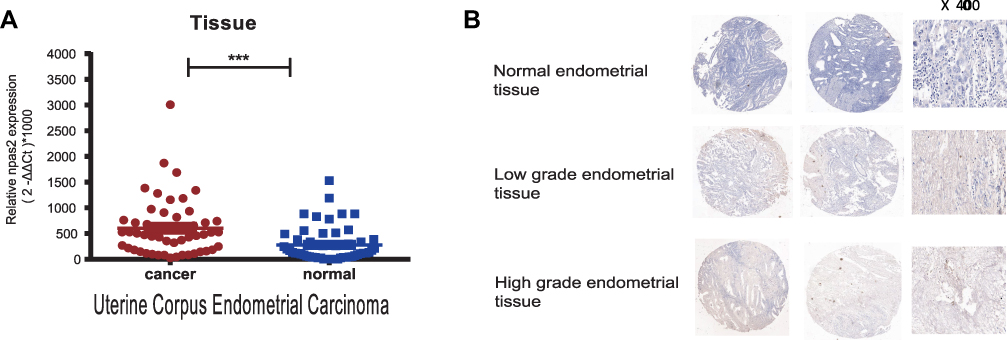 |
Figure 4 (A) Expression levels of NPAS2 in EC (A) RT-qPCR detection of NPAS2 in EC and in adjacent normal tissue. Data are expressed as the mean±SD. ***P<0.0001 (B) Immunohistochemical analysis of NPAS2 in normal and endometrial cancer tissues. Representative images of NPAS2 staining in benign and epithelial ovarian cancer tissues are shown. The positive staining of NPAS2 is shown in brown color, and the cell nuclei were counterstained with hematoxylin. Original magnification, 400× (right panels), Scale bars, 50 μm. |
Constructed Cell Lines Overexpressing or Silenced for NPAS2
Relative NPAS2 amounts in UCEC cells were assessed by qRT-PCR and WB. As shown in Figure 5A, relative NPAS2 amounts were higher in AN3CA cells compared with Ishikawa cells (***P<0.001). Next, the vector for NPAS2 overexpression and the corresponding control were transfected into Ishikawa cells, while shRNA NPAS2 and control vectors were transfected into AN3CA cells, respectively. NPAS2 mRNA amounts were markedly elevated in NPAS2 transfected Ishikawa cells in comparison with the NC group (***P<0.001) (Figure 5B). Conversely, NPAS2 mRNA amounts were remarkably reduced in shNPAS2-1- (**P<0.05) and shNPAS2-2- (***P<0.001) transfected AN3CA cells in comparison with control-transfected cells (Figure 5C). Therefore, shNPAS2-2 was selected as the interfering RNA for subsequent experiments. Protein expression was then confirmed by Western blotting in Figure 5D–F.
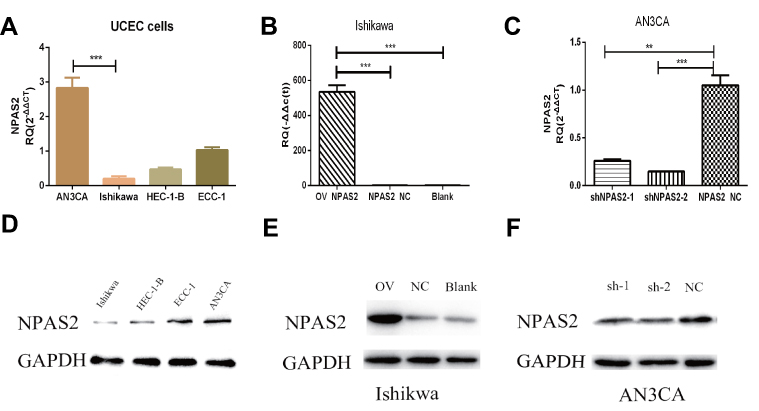 |
Figure 5 Expression levels of NPAS2 in cell lines and the efficiency of transfected cells after 24 h. (A) Relative expression of NPAS2 in UCEC cell lines, analyzed by RT-qPCR. ***P < 0.001. (B) qRT-PCR analyses for mRNA expression levels of NPAS2 in Ishikawa cells transfected with overexpression vector or control as indicated (***P < 0.001). (C) qRT-PCR analyses for mRNA expression levels of NPAS2 in AN3CA cells transfected with shRNA or control as indicated (**P < 0.01,***P < 0.001). (D) Relative expression of NPAS2 in UCEC cell lines, analyzed by WB. (E) WB analyses for protein expression levels of NPAS2 in Ishikawa cells transfected with overexpression vector or control as indicated. (F) WB analyses for protein expression levels of NPAS2 in AN3CA cells transfected with shRNA or control as indicated. |
NPAS2 Overexpression and Knockdown Affect Proliferation in UCEC Cells
To assess NPAS2’s function in cancer cell proliferation, colony formation assay was carried out (Figure 6Aand B). Overexpression of NPAS2 significantly induced clonogenicity in Ishikawa cells (**P<0.01); conversely, NPAS2 silencing markedly decreased colony formation in AN3CA cells (**P<0.01). Figure 6C shows cell viability assessed by the CCK-8 assay: AN3CA cells transfected with sh-NPAS2 had inhibited cell growth at 72, 96 and 120 h, while Ishikawa cells transfected with OV-NPAS2 had enhanced proliferation at 48, 72, 96 and 120 h, in comparison with the respective control groups (*P<0.05, ***P<0.001). In addition, NPAS2 expression affected the G1 and S phases of the cell cycle. As depicted in Figure 7A and D, Ishikawa cells transfected with OV-NPAS2 had markedly increased S phase cell number, and reduced amounts of G1 cells (*P<0.05). AN3CA cells transfected with sh-NPAS2 for 48 h showed starkly increased G1 phase cell amounts and reduced amounts of S cells (*P < 0.05).
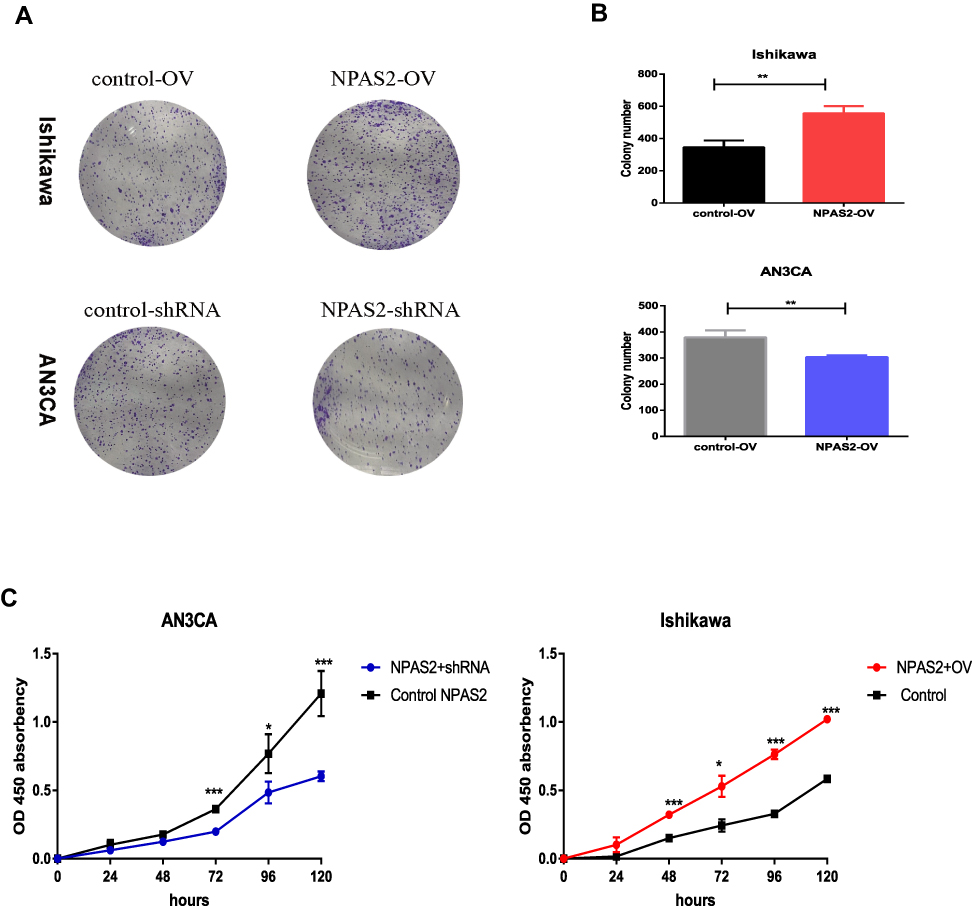 |
Figure 6 The ability of proliferation was detected by CCK-8 assay and colony formation assay after 24 h transfection. (A and B) Cell viability was detected by colony formation assay. Data are expressed as the mean ± SD. **P < 0.01 (C) CCK-8 assay of Cell viability, relative cell proliferation at 0, 24, 48 and 96 h post-transfection. *P < 0.05, ***P < 0.001. |
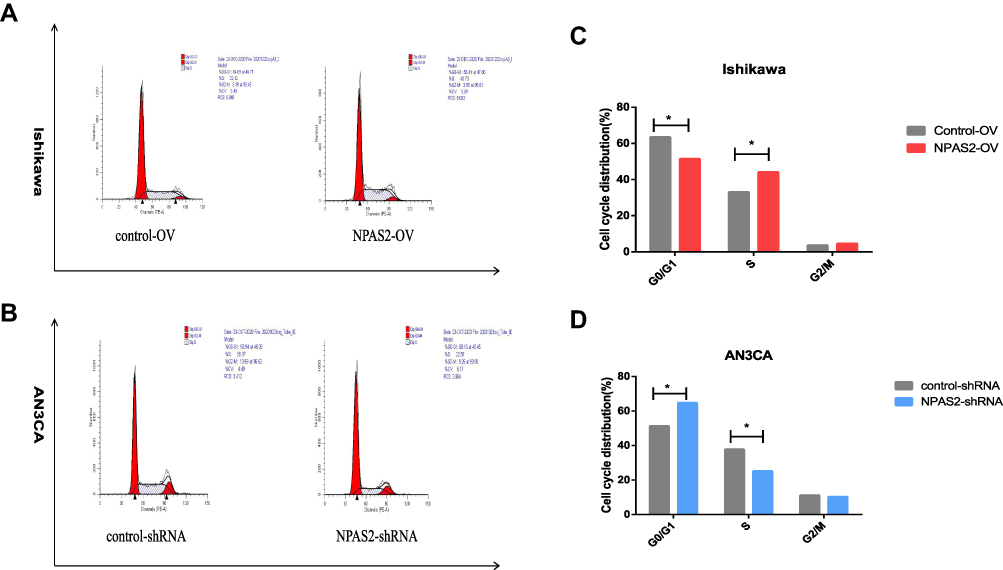 |
Figure 7 NPAS2 changes G1 to S phase transition of cell cycle of UCEC cells. (A–D) Cell cycle changes detected by flow cytometry. Data are expressed as the mean ± SD. *P < 0.05. |
NPAS2 Overexpression and Knockdown Affect Apoptosis in UCEC Cells
S. Figure 1 indicates IC50 values in both UCEC cell lines: AN3CA, IC50 = 860.4 nM; Ishikawa, IC50 = 1356 nM. Next, NPAS2’s role in UCEC cell apoptosis was examined. In this study, the percentages of total (early and late) apoptotic cells had no significant difference between Ishikawa cells with OV-NPAS2 compared with controls after treatment with CCCP (IC50 = 1356 nM) for 6 h; Ishikawa cells with OV-NPAS2 had markedly lower apoptosis rate versus controls (Figure 8A and B). In addition, total (early and late) apoptotic cells were not significantly more abundant in AN3CA cells with sh-NPAS2 compared with controls after treatment with CCCP (IC50=860.4 nM) for 6 h; however, significantly higher apoptosis rate was found in AN3CA cells with sh-NPAS2 compared with the control group (Figure 8C and D).
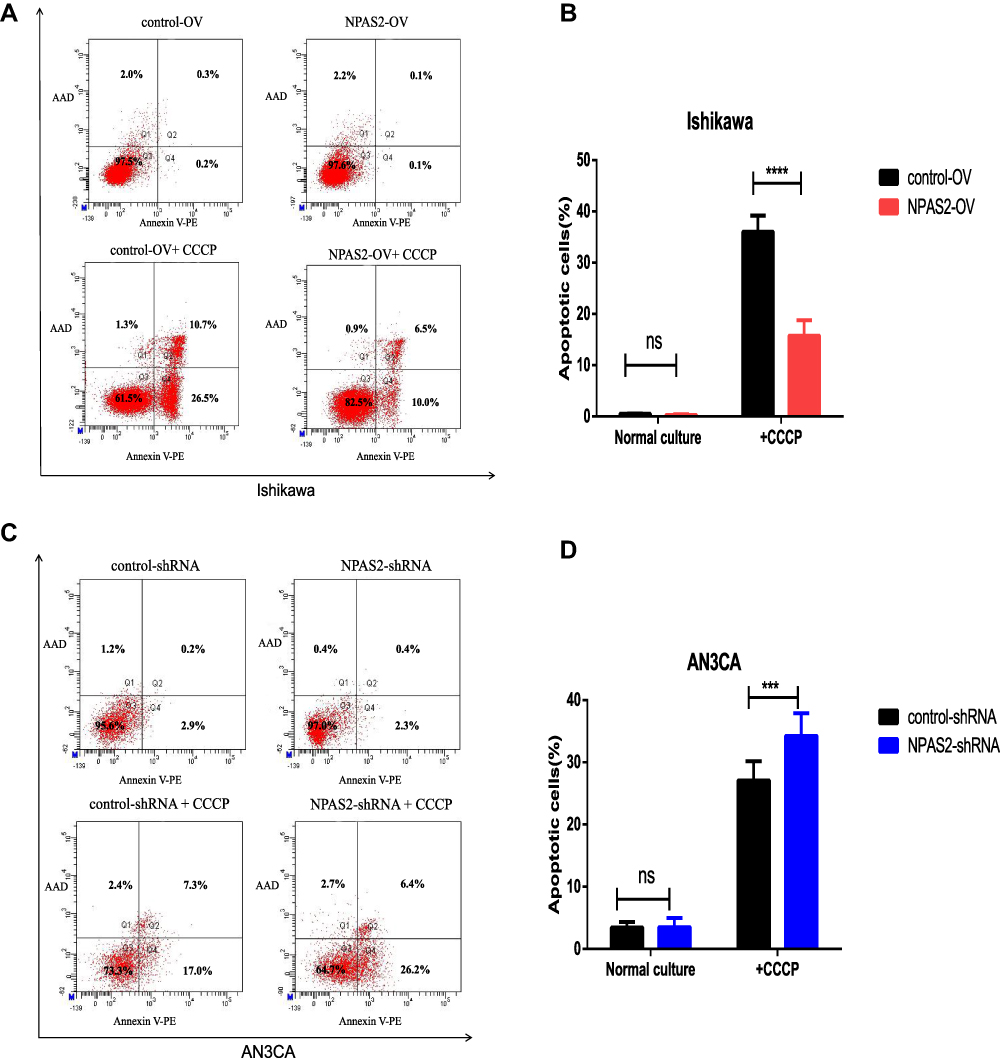 |
Figure 8 Flow cytometry analysis of apoptosis by Annexin V and PI staining in both UCEC cells 24 h after transfection with shRNA/NC or ovexpression/NC vector as indicated. Cells were also treated with CCCP for 6 h before apoptosis analysis. (A and B) Apoptosis rates of Ishikawa cells transfection with ovexpression/NC vector. (C and D) Apoptosis rates of AN3CA cells transfection with shRNA/NC. ***P < 0.001,****P < 0.0001. |
Associations of NPAS2 Expression with Immune Cell Biomarkers in UCEC
To further examine NPAS2’s role in tumor immunity, the associations of NPAS2 expression with immune cell biomarkers in UCEC were examined in the GEPIA2.0 database. As shown in Table 2, NPAS2 had significant positive correlations with a naïve T cells’ biomarker (LEF1, P=0.0069), an effector T-cells’biomarker (FCGR3A, P = 0.039), effector memory cells’ biomarker (GZMA, P=0.018), a central memory cells’ biomarker (IL7R, P = 0.049), resident memory cells’ biomarkers (CD69, P=0.0019; MYADM, P=9.00E-12), exhausted T cells’ biomarkers (TIGIT, P=0.0067; LAYN, P=0.00026), resting Tregs’ biomarkers (FOXP3, P=3E−04; IL2RA, P=0.024), effector Tregs’ biomarkers (FOXP3, P=3E−04; CTLA4, P=0.006; TNFRSF9, P=0.0016) and Th1-like cells’ biomarkers (CXCR3, P=0.0044; BHLHE40, P=0.00048; CD4, P=0.0015) in UCEC. The above data partly demonstrated NPAS2 was positively associated with immune cell infiltration.
NPAS2 is Positively Correlated with Immune Cell Infiltration in UCEC
As depicted in Figure 9A, NPAS2 expression had significant positive associations with all examined immune cells, ie, macrophages (P=1.81e−03) and dendritic cells (P=2.14e−02) in UCEC. Additionally, cumulative survival had significant positive associations with all examined immune cells, eg, B cells (P=0.019), and CD8+ T cells (P = 0.022) in UCEC (Figure 9B). Figure 9C shows CD8+ T cells and dendritic cells had marked changes in immune cell infiltration level based on NPAS2 copy number in UCEC.
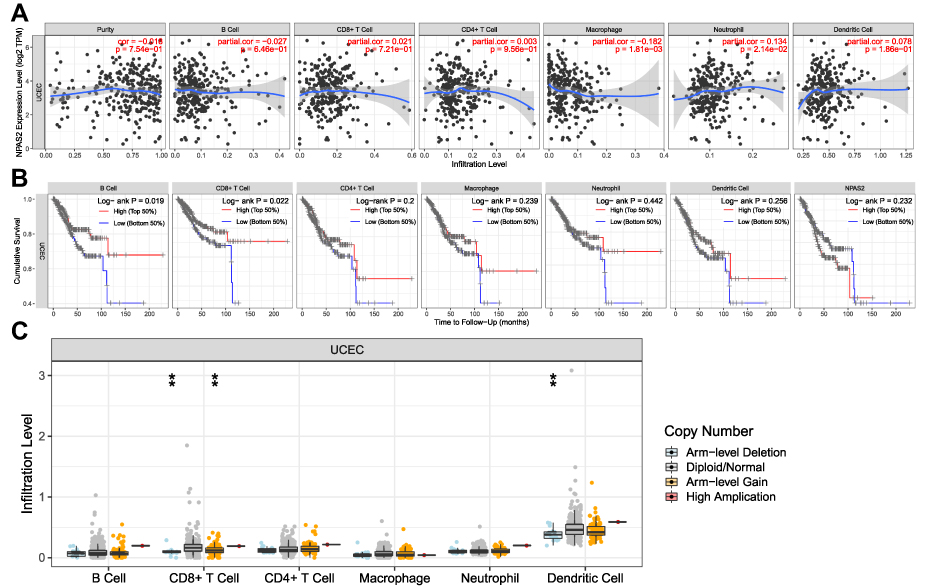 |
Figure 9 (A) The correlation of differentially expressed NPAS2 and immune cell infiltration (TIMER). (B) The correlation of differentially expressed NPAS2, immune cells and cumulative survival (TIMER). (C) The infiltration of immune cells caused by gene copy number alteration of differentially expressed NPAS2 (TIMER).**P < 0.01. |
Prediction and Assessment of Upstream miRNAs of NPAS2
It is broadly admitted miRNAs regulate many genes. To assess whether NPAS2 is regulated by miRNAs, potential upstream miRNAs that could interact with NPAS2 were searched. Totally 20 miRNAs were identified. For better visualization, a miRNA-NPAS2 regulatory network was built with Cytoscape (Figure 10A). According to the mechanism by which miRNAs regulate target genes, the miRNAs of interest and NPAS2 should be negatively correlated. As depicted in Figure 10B, NPAS2 had significant negative correlations with miR-17-5p and miR-93-5p, and positive correlations with miR-106a-5p and miR-381-3p in UCEC. No significant associations of NPAS2 expression with the remaining 16 predicted miRNAs were found. We also analyzed upstream miRNAs of NPAS2 by LinkedOmics (S. Figure 2).
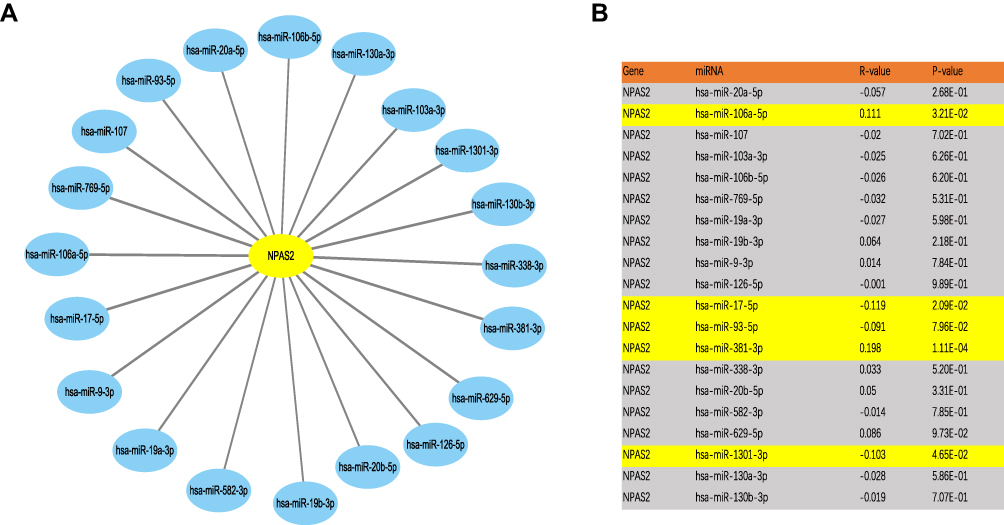 |
Figure 10 Identification of potential up or downstream miRNA of NPAS2 in UCEC. (A) The miRNA-NPAS2 regulatory network established by Cytoscape software. (B) The expression correlation between predicted miRNAs and NPAS2 in UCEC analyzed by starBase database. |
Discussion
Uterine Corpus Endometrial Carcinoma generally has no cure or specific symptoms. Because UCEC has high mortality, developing suitable prognostic biomarkers that can predict tumor progression is critical. Circadian rhythm disturbances are associated with the development and progression of many malignancies. Circadian rhythm genes are considered major regulators controlling abnormal cell proliferation in cancer.17 Disrupted cell cycle modulation and uncontrolled induction of several pathways contribute to cell growth stimulation.18,19 Given that the circadian rhythm gene NPAS2 plays a crucial role in cancer progression and prognosis,20 whether NPAS2 has unknown functions in cancer deserves further attention. Here, NPAS2 expression in UCEC cases obtained from TCGA using UALCAN and Timer.NPAS2 was significantly upregulated in cancer tissues, including CHOL, COAD, ESCA, KIRP, LIHC, LUAD, LUSC, STAD, READ, PRAD and UCEC. NPAS2 was overtly downregulated in cancer tissues, including HNSC, KICH, KIRC and SKCM. The expression status and role of NPAS2 in human cancers remain controversial. NPAS2 can act as an oncogene or a tumor suppressor in tumorigenesis; multiple studies have been performed for elucidating the roles of NPAS2 in the occurrence and development of various cancers. NPAS2 was previously attributed a tumor suppressor role in breast21,22 and colorectal23 carcinomas. However, NPAS2 was shown to act as a tumor promoting gene in hepatocellular carcinoma,24 acute myeloid leukemia,25 non-Hodgkin’s lymphoma26 and nasopharyngeal cancer.27 Yi and collaborators reported elevated NPAS2 mRNA amounts are associated with higher DFS and OS in breast cancer.22
In this study, we provided some important findings concerning NPAS2’s role in UCEC function. Firstly, qRT-PCR analysis indicated NPAS2 as a tumor promoting gene that is highly expressed and associated with endometrial cancer, corroborating database prediction (http://UCLCL.cancer-pku.cn/detail.php; S. Figure 1). Our results revealed individuals with elevated NPAS2 expression had remarkably lower OS in the GEPIA, KM and LinkedOmics databases. NPAS2 was upregulated in UCEC and associated with RFS in KM. NPAS2 overexpression had a significant association with reduced DFS in UCEC based on GEPIA. Combined with the clinical information of patients using TCGA UCEC dataset by UALCAN, it was found that NPAS2 expression had significant differences based on cancer stage, race, weight, age, menopause status and histological subtype. Therefore, NPAS2 might act as an oncogene in UCEC, with an association with poor prognosis. This may explain the observed correlation between elevated NPAS2 amounts and increased survival. In clinical samples, positive associations of clinical stage, grade, myometrial invasion and estrogen receptor status with NPAS2 expression were found. Thus, NPAS2 potentially functions as a prognostic marker in endometrial carcinogenesis.
Overexpression of NPAS2 significantly stimulated proliferation and colony formation, and induced apoptosis in UCEC Ishikawa cells in vitro. Suppression of NPAS2 in another UCEC cell line (AN3CA) attenuated cell proliferation and colony formation, while inhibiting apoptosis in vitro. NPAS2 represents a tumor promoter through transactivation of CDC25A that regulates biological functions, including tumor growth, migration and invasion, in HCC.28 Zhu et al26 found that NPAS2 can improve pathogenicity in non-Hodgkin lymphoma, and may become a new tumor marker of NHL. The expression status and role of NPAS2 in human cancers remain controversial. In contrast, NPAS2 may act as a tumor suppressor by controlling the cell cycle, growth and apoptosis in colorectal cancer.23 In breast cancer, reduced expression of NPAS2 influences cell cycle checkpoints by decreasing the amounts of S phase cells and elevating G1 or G2 cells.8 Thus, abnormal expression of NPAS2 is related to cell cycle response and DNA damage.
It is widely admitted tumor immune cell infiltration affects tumor development and progression.29,30 Disruption of the circadian rhythm of NK cells in malignant melanoma reduces the phagocytic activity and leads to an imbalance of interleukin-6 and TNF-α.31 This study indicated NPAS2 has marked positive correlations with multiple immune cells such as B cells, CD8+ T cells, macrophages and dendritic cells in UCEC.
In the last decade ncRNAs, such as miRNAs, have been documented to participate in transcriptional gene regulation and identified as biomarkers in UCEC.16,32 In addition, previous studies found that upregulation of NPAS2 expression is mainly due to the downregulation of miR-199b-5p in HCC.24 Seven prediction programs, ie, PITA, RNA22, miRmap, microT, miRanda, PicTar, and TargetScan, were utilized for predicting potential miRNAs that could interact with NPAS2. NPAS2 had significant negative correlations with miR-17-5p and miR-93-5p, and positive correlations with miR-106a-5p and miR-381-3p in UCEC. It is known microRNA-17-5p plays a suppressive roles in controlling apoptosis in endometrial cancer,33 while miR-93-5p impedes the viability, migration and invasion of endometrial carcinoma cells.34
Conclusions
In summary, NPAS2 is overexpressed in various human cancers, eg, UCEC, demonstrating a positive correlation with unfavorable prognosis based on database and clinical samples. NPAS2 influences cell proliferation and apoptosis, indicating its potential as a diagnostic and therapeutic marker in UCEC. Furthermore, our current findings also indicated that NPAS2 is modulated by some miRNAs and exerts oncogenic effects by enhancing tumor immune cell infiltration. Therefore, NPAS2 might constitute a prognostic marker of UCEC. However, the mechanisms underpinning NPAS2’s effects in UCEC deserve further attention.
Acknowledgments
Project funded by the Natural Science Foundation of Zhejiang Province (Grant number: LQ21H160011), the Medical and Health Plan of Zhejiang (Grant number: 2021KY990, 2022KY310, 2022KY1115), and the Natural Science Foundation of Ning Bo (Grant number: 2019A610306, 2019A610260). We are also grateful to the Central Laboratory of Ningbo First Hospital.
Disclosure
Xiaojiao Zheng and Xiuyi Lv are co-first authors. The authors have no conflicts of interest.
References
1. Siegel RL, Miller KD, Jemal A. Cancer statistics, 2017. CA Cancer J Clin. 2017;67(1):7–30. doi:10.3322/caac.21387
2. Bokhman JV. Two pathogenetic types of endometrial carcinoma. Gynecol Oncol. 1983;15(1):10–17. doi:10.1016/0090-8258(83)90111-7
3. Bansal N, Yendluri V, Wenham RM. The molecular biology of endometrial cancers and the implications for pathogenesis, classification, and targeted therapies. Cancer Control. 2009;16(1):8–13. doi:10.1177/107327480901600102
4. Greene MW. Circadian rhythms and tumor growth. Cancer Lett. 2012;318(2):115–123. doi:10.1016/j.canlet.2012.01.001
5. Baker FC, Driver HS. Circadian rhythms, sleep, and the menstrual cycle. Sleep Med. 2007;8(6):613–622. doi:10.1016/j.sleep.2006.09.011
6. Reick M, Garcia JA, Dudley C, McKnight SL. NPAS2: an analog of clock operative in the mammalian forebrain. Science. 2001;293(5529):506–509. doi:10.1126/science.1060699
7. Dioum EM, Rutter J, Tuckerman JR, Gonzalez G, Gilles-Gonzalez MA, McKnight SL. NPAS2: a gas-responsive transcription factor. Science. 2002;298(5602):2385–2387. doi:10.1126/science.1078456
8. Hoffman AE, Zheng T, Ba Y, Zhu Y. The circadian gene NPAS2, a putative tumor suppressor, is involved in DNA damage response. Mol Cancer Res. 2008;6(9):1461–1468. doi:10.1158/1541-7786.MCR-07-2094
9. Tang Z, Li C, Kang B, Gao G, Li C, Zhang Z. GEPIA: a web server for cancer and normal gene expression profiling and interactive analyses. Nucleic Acids Res. 2017;45(W1):W98–w102.
10. Chandrashekar DS, Bashel B, Balasubramanya SAH, et al. UALCAN: a portal for facilitating tumor subgroup gene expression and survival analyses. Neoplasia. 2017;19(8):649–658. doi:10.1016/j.neo.2017.05.002
11. Lánczky A, Győrffy B. Web-based survival analysis tool tailored for medical research (KMplot): development and implementation. J Med Internet Res. 2021;23(7):e27633. doi:10.2196/27633
12. Gao J, Aksoy BA, Dogrusoz U, et al. Integrative analysis of complex cancer genomics and clinical profiles using the cBioPortal. Sci Signal. 2013;6(269):pl1. doi:10.1126/scisignal.2004088
13. Li T, Fan J, Wang B, et al. TIMER: a web server for comprehensive analysis of tumor-infiltrating immune cells. Cancer Res. 2017;77(21):e108–e110. doi:10.1158/0008-5472.CAN-17-0307
14. Vasaikar SV, Straub P, Wang J, Zhang B. LinkedOmics: analyzing multi-omics data within and across 32 cancer types. Nucleic Acids Res. 2018;46(D1):D956–d963. doi:10.1093/nar/gkx1090
15. Li JH, Liu S, Zhou H, Qu LH, Yang JH. starBase v2.0: decoding miRNA-ceRNA, miRNA-ncRNA and protein-RNA interaction networks from large-scale CLIP-Seq data. Nucleic Acids Res. 2014;42(D1):D92–97. doi:10.1093/nar/gkt1248
16. Zheng X, Xu K, Zhu L, Mao M, Zhang F, Cui L. MiR-486-5p act as a biomarker in endometrial carcinoma: promotes cell proliferation, migration, invasion by targeting MARK1. Onco Targets Ther. 2020;13:4843–4853. doi:10.2147/OTT.S246841
17. De A, Beligala DH, Sharma VP, Burgos CA, Lee AM, Geusz ME. Cancer stem cell generation during epithelial-mesenchymal transition is temporally gated by intrinsic circadian clocks. Clin Exp Metastasis. 2020;37(5):617–635. doi:10.1007/s10585-020-10051-1
18. Markowska A, Pawałowska M, Lubin J, Markowska J. Signalling pathways in endometrial cancer. Contemp Oncol. 2014;18(3):143–148. doi:10.5114/wo.2014.43154
19. Lin AB, McNeely SC, Beckmann RP. Achieving precision death with cell-cycle Inhibitors that target DNA replication and repair. Clin Cancer Res. 2017;23(13):3232–3240. doi:10.1158/1078-0432.CCR-16-0083
20. Kelleher FC, Rao A, Maguire A. Circadian molecular clocks and cancer. Cancer Lett. 2014;342(1):9–18. doi:10.1016/j.canlet.2013.09.040
21. Reszka E, Przybek M, Muurlink O, Pepłonska B. Circadian gene variants and breast cancer. Cancer Lett. 2017;390:137–145. doi:10.1016/j.canlet.2017.01.012
22. Yi C, Mu L, de la Longrais IA, et al. The circadian gene NPAS2 is a novel prognostic biomarker for breast cancer. Breast Cancer Res Treat. 2010;120(3):663–669. doi:10.1007/s10549-009-0484-0
23. Xue X, Liu F, Han Y, et al. Silencing NPAS2 promotes cell growth and invasion in DLD-1 cells and correlated with poor prognosis of colorectal cancer. Biochem Biophys Res Commun. 2014;450(2):1058–1062. doi:10.1016/j.bbrc.2014.06.104
24. Yuan P, Yang T, Mu J, et al. Circadian clock gene NPAS2 promotes reprogramming of glucose metabolism in hepatocellular carcinoma cells. Cancer Lett. 2020;469:498–509. doi:10.1016/j.canlet.2019.11.024
25. Song B, Chen Y, Liu Y, Wan C, Zhang L, Zhang W. NPAS2 regulates proliferation of acute myeloid leukemia cells via CDC25A-mediated cell cycle progression and apoptosis. J Cell Biochem. 2018. doi:10.1002/jcb.28160
26. Zhu Y, Leaderer D, Guss C, et al. Ala394Thr polymorphism in the clock gene NPAS2: a circadian modifier for the risk of non-Hodgkin’s lymphoma. Int J Cancer. 2007;120(2):432–435. doi:10.1002/ijc.22321
27. Zhao F, Pu Y, Qian L, Zang C, Tao Z, Gao J. MiR-20a-5p promotes radio-resistance by targeting NPAS2 in nasopharyngeal cancer cells. Oncotarget. 2017;8(62):105873–105881. doi:10.18632/oncotarget.22411
28. Yuan P, Li J, Zhou F, et al. NPAS2 promotes cell survival of hepatocellular carcinoma by transactivating CDC25A. Cell Death Dis. 2017;8(3):e2704. doi:10.1038/cddis.2017.131
29. Esquifino AI, Selgas L, Arce A, Maggiore VD, Cardinali DP. Twenty-four-hour rhythms in immune responses in rat submaxillary lymph nodes and spleen: effect of cyclosporine. Brain Behav Immun. 1996;10(2):92–102. doi:10.1006/brbi.1996.0010
30. Arjona A, Sarkar DK. Circadian oscillations of clock genes, cytolytic factors, and cytokines in rat NK cells. J Immunol. 2005;174(12):7618–7624. doi:10.4049/jimmunol.174.12.7618
31. Gamaleia NF, Skivka LM, Fedorchuk AG, Shishko ED. Circadian rhythms of cytotoxic activity in peripheral blood mononuclear cells of patients with malignant melanoma. Exp Oncol. 2006;28(1):54–60.
32. Zhao W, Geng P, Li Y, Wei X, Cheng J. MicroRNA-21 promotes endometrial carcinoma proliferation and invasion by targeting PTEN. Int J Clin Exp Pathol. 2017;10(12):11489–11495.
33. Shen Y, Lu L, Xu J, et al. Bortezomib induces apoptosis of endometrial cancer cells through microRNA-17-5p by targeting p21. Cell Biol Int. 2013;37(10):1114–1121. doi:10.1002/cbin.10139
34. Zhang K, Cai Y, Zhou Q, Sun H, Wei J. Long non-coding RNA SNHG14 impedes viability, migration and invasion of endometrial carcinoma cells through modulating miR-93-5p/ZBTB7A axis. Cancer Manag Res. 2020;12:9515–9525. doi:10.2147/CMAR.S257419
 © 2021 The Author(s). This work is published and licensed by Dove Medical Press Limited. The full terms of this license are available at https://www.dovepress.com/terms.php and incorporate the Creative Commons Attribution - Non Commercial (unported, v3.0) License.
By accessing the work you hereby accept the Terms. Non-commercial uses of the work are permitted without any further permission from Dove Medical Press Limited, provided the work is properly attributed. For permission for commercial use of this work, please see paragraphs 4.2 and 5 of our Terms.
© 2021 The Author(s). This work is published and licensed by Dove Medical Press Limited. The full terms of this license are available at https://www.dovepress.com/terms.php and incorporate the Creative Commons Attribution - Non Commercial (unported, v3.0) License.
By accessing the work you hereby accept the Terms. Non-commercial uses of the work are permitted without any further permission from Dove Medical Press Limited, provided the work is properly attributed. For permission for commercial use of this work, please see paragraphs 4.2 and 5 of our Terms.