")
Back to Journals » Psychology Research and Behavior Management » Volume 16
The Chinese Version of the Perceived Stress Questionnaire-13: Psychometric Properties and Measurement Invariance for Medical Students
Authors Jiang C , Mastrotheodoros S, Zhu Y , Yang Y , Hallit S , Zhao B, Fan Y, Huang M, Chen C, Ma H, Meng R
Received 9 August 2022
Accepted for publication 15 December 2022
Published 7 January 2023 Volume 2023:16 Pages 71—83
DOI https://doi.org/10.2147/PRBM.S385510
Checked for plagiarism Yes
Review by Single anonymous peer review
Peer reviewer comments 2
Editor who approved publication: Dr Igor Elman
Chen Jiang,1,* Stefanos Mastrotheodoros,2,3 Yihong Zhu,4,* You Yang,5 Souheil Hallit,6– 8 Bing Zhao,4 Yuping Fan,1 Mengyi Huang,1 Cen Chen,1 Haiyan Ma,1,9 Runtang Meng1,9,*
1School of Public Health, Hangzhou Normal University, Hangzhou, People’s Republic of China; 2Department of Psychology, University of Crete, Rethymno, Greece; 3Department of Youth and Family, Utrecht University, Utrecht, the Netherlands; 4The Affiliated Hospital of Hangzhou Normal University, Hangzhou Normal University, Hangzhou, People’s Republic of China; 5School of Nursing, Hangzhou Normal University, Hangzhou, People’s Republic of China; 6School of Medicine and Medical Sciences, Holy Spirit University of Kaslik, Jounieh, Lebanon; 7Applied Science Research Center, Applied Science Private University, Amman, Jordan; 8Research Department, Psychiatric Hospital of the Cross, Jal Eddib, Lebanon; 9Engineering Research Center of Mobile Health Management System, Ministry of Education, Hangzhou, People’s Republic of China
*These authors contributed equally to this work
Correspondence: Runtang Meng; Haiyan Ma, School of Public Health, Hangzhou Normal University, No. 2318, Yuhangtang Road, Yuhang District, Hangzhou, Zhejiang, 311121, People’s Republic of China, Email [email protected]; [email protected]
Purpose: Stress may relate to an increased risk of psychological and physical disorders. Thus, a brief and efficient measurement instrument for researchers to measure stress is essentially needed.
Participants and Methods: To assess measurement properties of the validated Chinese version of the Perceived Stress Questionnaire-13 (PSQ-C-13), we conducted a two-wave longitudinal study from September to December, 2021 with a convenient sample of medical students.
Results: A two-factor (constraint and imbalance) structure showed good fit indices (Comparative Fit Index [CFI] = 0.972, Tucker-Lewis Index [TLI] = 0.966, Root Mean Square Error of Approximation [RMSEA] = 0.062). Spearman correlations with the Chinese Perceived Stress Scale-10 illustrated that convergent validity of the PSQ-C-13 was relatively satisfactory (r = 0.678 [baseline], 0.753 [follow-up]). Measurement invariance was supported across subgroups (gender, age, home location, single-child status, monthly households’ income, and part-time status) and time points. Internal consistency was sound (Cronbach’s α = 0.908 [baseline], 0.922 [follow-up]; McDonald’s ω = 0.909 [baseline], 0.923 [follow-up]). Stability between time points was good (Intraclass Correlation Coefficient = 0.834).
Conclusion: The two factors of the PSQ-C-13 including constraint and imbalance may adequately measure the level of stress on participants. The PSQ-C-13 is a convenient and efficient instrument that contains valid and reliable psychometric properties.
Keywords: Perceived Stress Questionnaire, longitudinal survey, medical students, psychometrics
Introduction
Ever since Hans Selye, known as the founder of the stress theory, brought the concept of “stress” into the psychometric field,1–4 researchers have tried to develop methods to measure this “nonspecific response” of the body to any demand. One of the most prevailing methods5 to evaluate stress is the psychological approach based on the transactional model. The transactional model focuses on measuring a person’s subjective evaluation of his or her abilities to cope with specific events or changes and the assessment of subjects’ emotional response to the experiences.6 Rather than a plain outcome of an individual lacking balance between objective demands and coping capability, through the psychological approach, stress was conceptualized as a complicated combination.7,8 Then, “the feelings or thoughts that an individual has about how much stress they are under at a given point in time or over a given period”8 was concluded as the conception of so-called “perceived stress”.7,9 As yet, the direct relationships between stress and study-life conflicts, alertness promotion, symptoms of depression or anxiety, and even sleep disorders are well documented.10–16 Furthermore, the indirect mediating role and moderating effect of stress between various health outcomes are gradually understood.17–21 It has also been reported that stress may relate to a greater risk of infectious disease, tumors, immune disease, cardiovascular disease, and chronic disorders such as gastroenteritis, diabetes, and asthma.22–25 Thus, how to measure this perception is increasingly getting researchers’ attention.
The Perceived Stress Questionnaire (PSQ)24 is used internationally to measure perceived stress and has shown dependable reliability and validity. It aims at measuring the level of instinctively perceived and withstood current stress at the cognitive layer during the last four weeks (one-month recent form, PSQ-R) or for the last two years (two-year general form, PSQ-G). The PSQ is a self-report instrument that consists of 30 items on a four-point scale, and it measures seven factors (harassment, overload, irritability, lack of joy, fatigue, worries, and tension). The PSQ-30 has shown good reliability with Cronbach’s alpha values 0.900–0.920 and good validity as it significantly correlates with other reliable scales or symptoms (ie, the Perceived Stress Scale [PSS], the State-Trait Anxiety Inventory [STAI], the Center for Epidemiologic Studies Depression Scale [CES-D]; r = 0.400–0.750). Short forms of the PSQ-30 have been proposed consisting of 8, 13, 16, 20, 21, 24 items and tested in American, Chinese, German, Swedish, and Spanish samples.11,12,23,26–28
As is well known, the two most prevalent approaches applied in shortening scales are classical test theory (CTT) and item response theory (IRT).29,30 Nevertheless, CTT has a commonly unrealistic assumption: the obtained score is seen as absolutely true with no measurement error.31 What is more, the measurement properties obtained under CTT are dependent on sample types, which indicates that these obtained properties need to be multiply tested in other cultures or populations.31 Conversely, IRT is independent of samples and centers mainly on a relationship between an individual’s trait level and how they respond to items. Thus, IRT has shown its strength by selecting items with more information about the targeted trait.32 Among those short PSQ versions, only the 13-item PSQ was accordingly translated into Chinese, tested in the Chinese population, shortened under IRT, and validated multiple measurement properties.28,33
The 13-item PSQ might provide a more efficient and reliable way to screen individuals with high-level stress, further assess other mental conditions, and discover the possible association between stress and health disorders. Considering that the validated Chinese version of the Perceived Stress Questionnaire-13 (PSQ-C-13) was shortened under IRT with a single-measure survey, the measurement properties of the PSQ-C-13 need to be assessed with repeated measures. We hypothesized that the measurement invariance across multiple groups and time points can be supported. Therefore, the current study is to further evaluate the psychometric properties and measurement invariance of the PSQ-C-13 based on the previous study.28
Materials and Methods
Procedures
Medical students of various grades in a university in Hangzhou, China, were recruited for this study from September until December 2021 using a convenient sampling method. All procedures followed relevant ethical principles for medical research involving human subjects in the Declaration of Helsinki.34 The research protocol was approved by the Institutional Review Board of School of Public Health, Hangzhou Normal University (Reference No. 20210014). All research participants provided informed consent. After conducting the paper-and-pencil survey twice, student ID was used to match the same participant between tests. The total number of valid questionnaires included is 309, which has reached the minimum recommendations: 1) the sample size should be included from 3 to 20 times the number of items in the scale;35–37 2) based on the ratio of items-to-factors in our study is approximate to 6, the sample size should be higher than 200.38
Measures
Socio-Demographic
Demographic data were collected on gender, age, home location (urban, rural, suburban), single-child status (yes, no), monthly households’ income (unit: CNY [1 CNY ≈ 0.160 US dollars]; < 5000, 5000–9999, 10,000–14,999, 15,000–19,999, 20,000–24,999, 25,000–29,999, 30,000–34,999, 35,000–39,999, ≥ 40,000), and part-time status (yes, no), for further analysis.
Perceived Stress Questionnaire (Chinese Version)
The validated Chinese version of the Perceived Stress Questionnaire-13 was tested with medical students.28 A previous study showed that the PSQ-C-13 with two factors (constraint and imbalance) had satisfactory fit based on Confirmatory Factor Analysis (CFA; Comparative Fit Index [CFI] = 0.968, Tucker Lewis Index [TLI] = 0.961, Root Mean Square Error of Approximation [RMSEA] = 0.070).28 The PSQ-C-13 has also shown good internal consistency (Cronbach’s α = 0.878, Guttman’s λ-2 = 0.880, and McDonald’s ω = 0.880) and test–retest stability (Intraclass correlation coefficient = 0.805, 2-day interval).28 Moreover, the PSQ-C-13 correlates moderately to strongly with the PSS-C-10 (r = 0.777), the Short Form-8 Health Survey (r = −0.595), and the Goldberg Anxiety and Depression Scale (r = 0.584).28
Perceived Stress Scale (Chinese Version)
The Chinese version of the Perceived Stress Scale-10 (PSS-C-10) is a five-point Likert scale with two components (positive and negative).39–41 It is designed to measure the degree to which individuals have encountered “unpredictable, uncontrollable, and overloaded situations in the previous month”. The PSS-C-10 has shown sound validity and reliability with a CFI36,41 of 0.980, an RMSEA41,42 of 0.048, and a Cronbach’s alpha41 of 0.860. Consequently, the PSS-C-10 was used in this study to test convergent validity.
Data Analysis
The database was built using EpiData (version 3.1) software. R (version 4.1.2) software was adopted to perform all statistical analyses. Descriptive statistics were used to describe the characteristics of included participants. Absolute numbers and relative numbers were calculated under each demographic variable for both tests. The multivariate normality test of scores was performed using “MVN” package.43 Measurement properties were assessed guided by the COnsensus-based Standards for the selection of health Measurement INstruments (COSMIN) methodology user manual and taxonomy of measurement properties.44–46
Structural Validity
Structural validity was assessed by applying CFA with a Weighted Least Squares Mean and Variance adjusted (WLSMV) method to accommodate ordinal indicators.47,48 Using R package “lavaan”,49 the goodness-of-fit of the PSQ-C-13 factor structures under IRT was assessed by means of CFI,36 TLI,36 and RMSEA.42 All the goodness-of-fit indices were reported scaled, considering they are more exact than unscaled indices.50 For these indices, models with CFI close to or greater than 0.900, TLI close to or greater than 0.900, and RMSEA close to or smaller than 0.080 indicate good model fit.51
Convergent Validity
To assess convergent validity, we hypothesized that the PSQ-C-13 has a:
Hypothesis 1: Strong positive correlation (≥ 0.500) with the PSS-C-10, given the fact that both instruments are supposed to measure related constructs (perceived stress).52 Hypothesis 2: Moderate positive correlation (≥ 0.300) between subscales and the PSS-C-10 subscales, given the fact that both instruments are supposed to measure related constructs but the PSS gives more consideration to the cognitive appraisal of stress and the respondent’s perceived control and coping capability.23,24,39
Convergent validity was considered sufficient if at least 75% of the correlations were as expected.46
Measurement Invariance
Using the “semTools” package in R, configural, thresholds, metric, scalar, and strict measurement invariance was examined across multiple groups and across time.48,53,54 First, in the configural invariance model, all the parameters were free, to test whether the proposed factor structure fits equally across groups. Second, the thresholds were constrained to test equality in each group in the thresholds invariance model. Third, in the metric invariance model, the thresholds and the factor loadings were constrained to be equal in each group. In the fourth scalar invariance model, the thresholds, the factor loadings, and observed variable intercepts were constrained to test whether they were equal in the groups. Last, in the strict invariance model, the thresholds, the factor loadings, intercepts, and the residuals were constrained to be equal across groups. The following scaled indices of goodness-of-fit were used as outcomes of the multi-group and longitudinal measurement invariance: CFI,36 TLI,36 and RMSEA.42 And we evaluated changes of fit-indices (Δ) within CFI, TLI, and RMSEA: models with ΔCFI lesser than 0.010, ΔTLI lesser than 0.010, and ΔRMSEA lesser than 0.015 were favored.55–57 We also compared Chi-square (χ2) and Chi-square change (Δχ2) between models. However, because of the dependency of Chi-square on sample size,55 we mainly focused on evaluating fit with ΔCFI, ΔTLI, and ΔRMSEA.
Internal Consistency
The internal consistency of the PSQ-C-13 was determined with the “ufs” package after conducting a CFA.58–60 Ordinal forms of Cronbach’s alpha and McDonald’s Omega were used to access the internal consistency, where values equal to or higher than 0.700 were considered good.56,57
Test–Retest Reliability
Intraclass correlation coefficient (ICC) was computed to assess the test–retest reliability using the “irr” package.61,62 Divided by the total variation, ICC centers on the interindividual variation in the population expressed as a ratio between 0 and 1.63 An ICC value close to or higher than 0.700 was considered sufficient.62,63
Standard error of measurement (SEM),62 which helps appraise the variability of measurement errors and determine measurement precision, was also computed as “standard deviation × sqrt (1-ICC)”. SEM will be assessed as a supplement indicator in test–retest reliability appraisal.
Results
Participants
The participants comprised medical students between ages from 17 to 23, and the average age is 19.611 ± 1.367 (mean ± standard deviation) years (Table 1). Average time interval of two measurements between baseline and follow-up was 7 days + 10.850 hours. Most item scores of the PSQ-C-13 did not obey in multivariate normal distribution, as assessed by checking skewness, kurtosis, and P values (P < 0.001) (Supplementary Material Table S1).
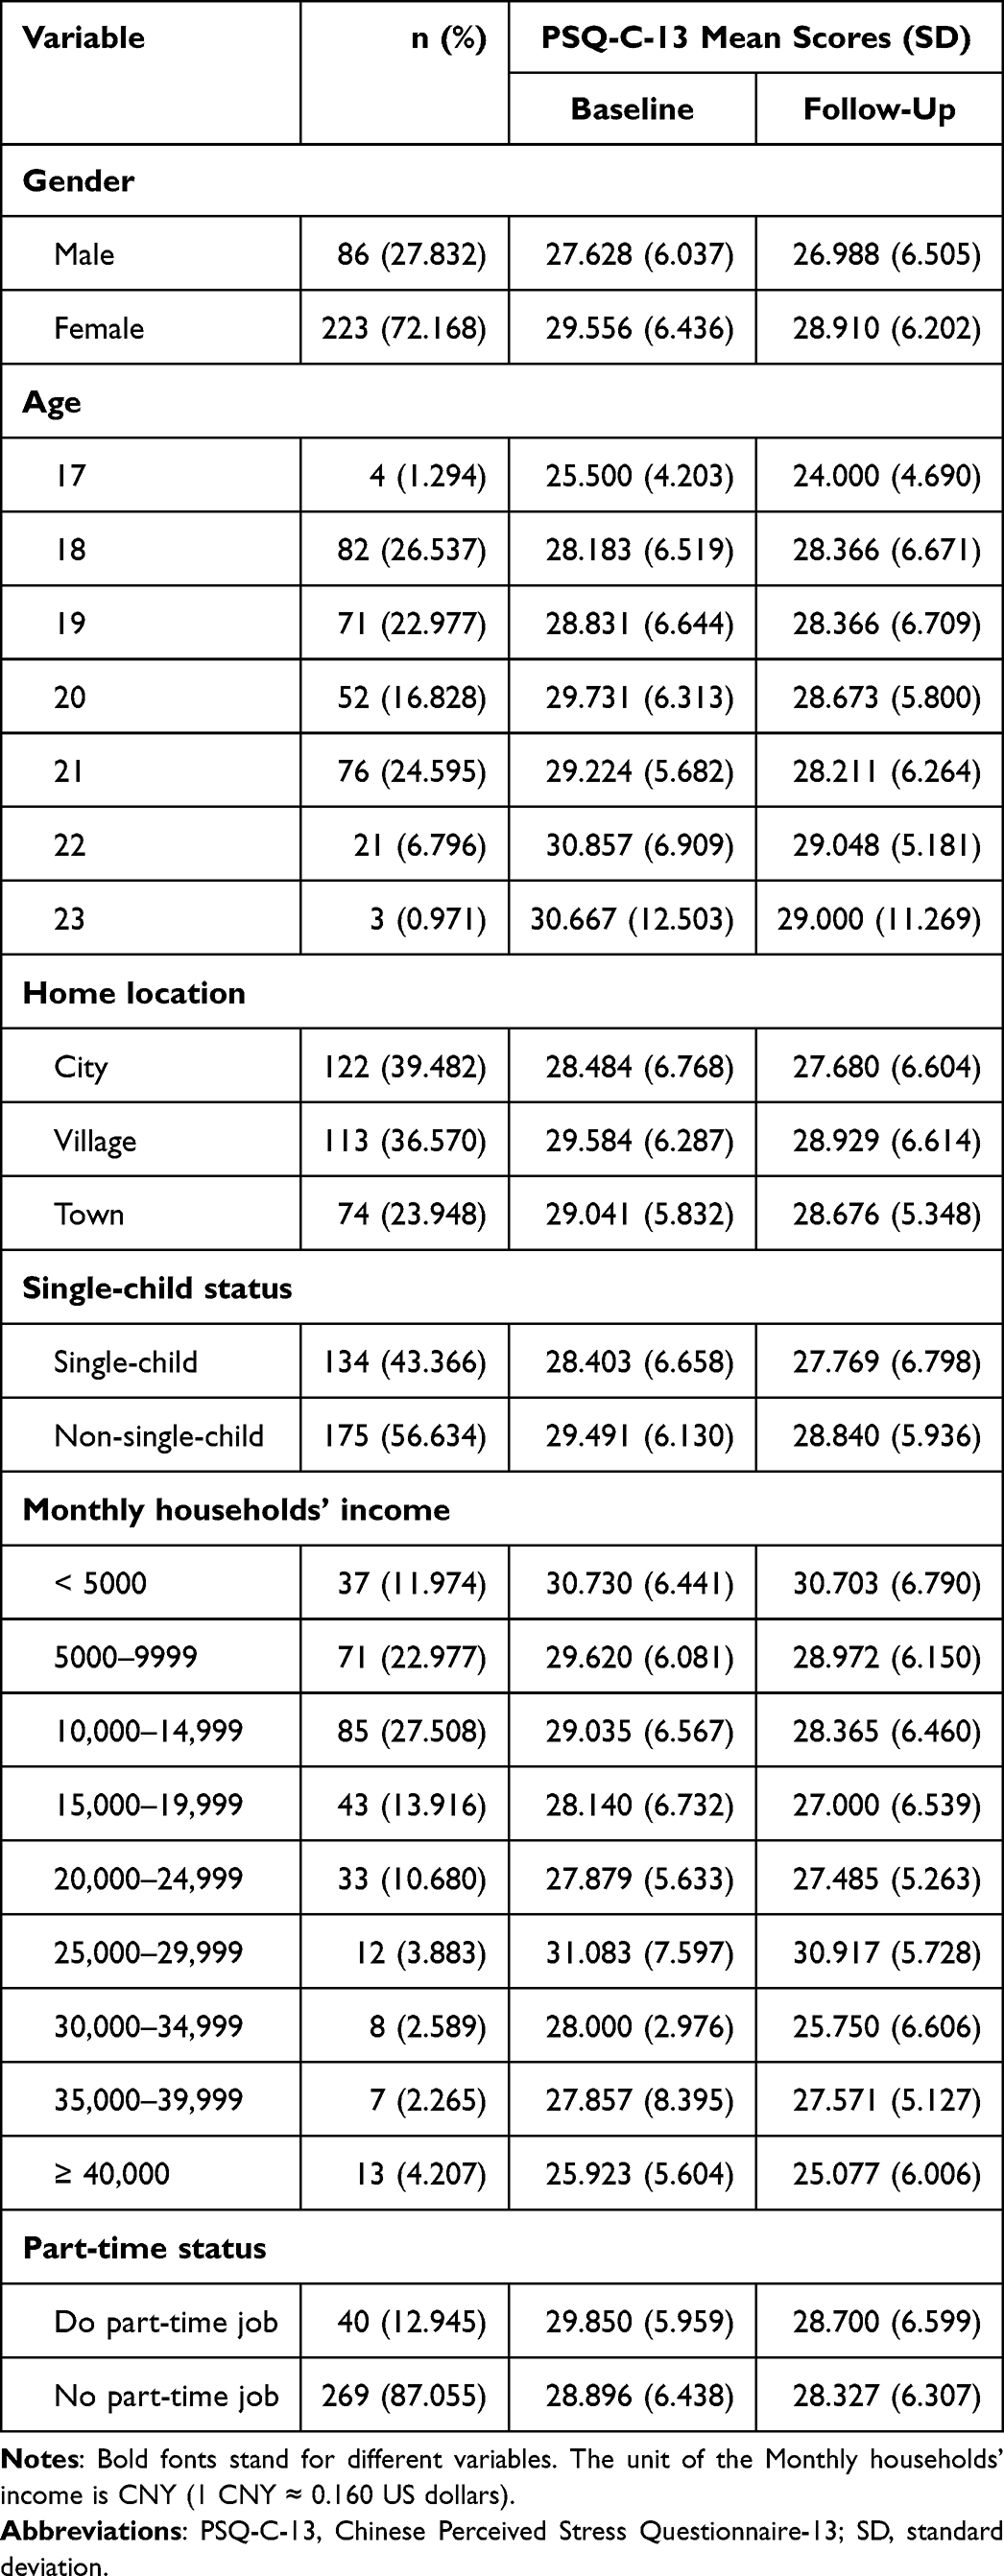 |
Table 1 Characteristics of Participants (N = 309) |
Measurement Properties
Structural Validity
Concerning the previous evidence of IRT analysis, CFAs were conducted to examine one-factor, two-factor, and second-order models (Table 2). Based on the fit indices of the models, the two-factor models showed relatively better fit. Therefore, a two-factor model with constraint and imbalance was confirmed for further analysis.
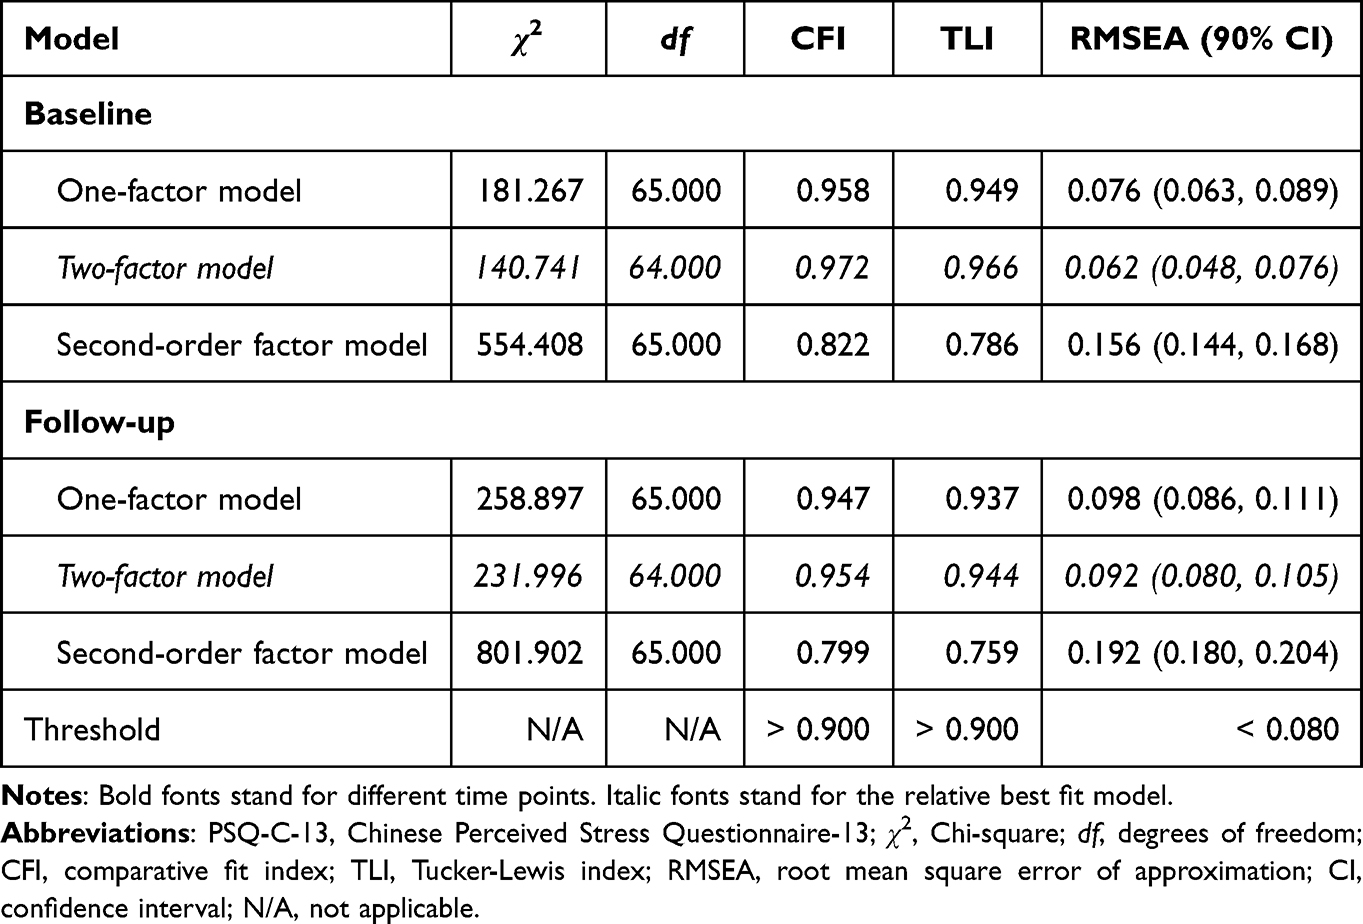 |
Table 2 Confirmatory Factor Analysis of Alternative Factorial Solutions of the PSQ-C-13 (N = 309) |
Convergent Validity
The correlation matrix of the PSQ-C-13 and the PSS-C-10 is depicted in Figure 1. The left part of the figure shows the inter-factor correlations, whereas the right part shows convergent validity correlations. The inter-factor correlations ranged from 0.602 to 0.952, indicating moderate to high correlations. Subscales and total scale of the PSQ-C-13 moderately correlated with the PSS-C-10 and its subscales, especially negative feelings correlated higher than positive feelings. Overall, convergent validity of the PSQ-C-13 and its subscales was relatively satisfactory.
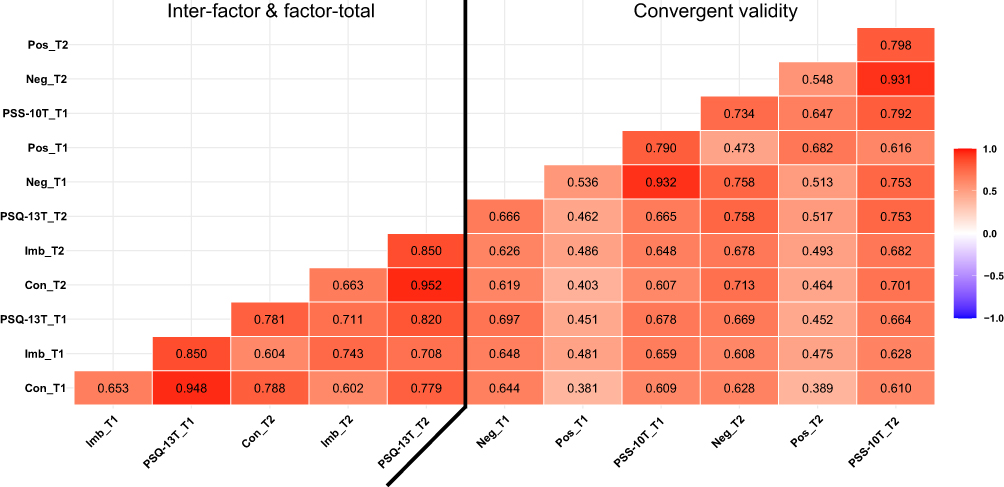 |
Figure 1 Inter-factor, factor-total, and convergent validity correlations between the PSQ-C-13 and the PSS-C-10. Abbreviations: Con, constraint; Imb: imbalance; PSQ-13, Perceived Stress Questionnaire-13; Neg, negative; Pos, positive; PSS-10, Perceived Stress Scale-10; “T” after each scale, T-scores; T1, time 1; T2, time 2. Notes: Spearman correlations. Color gradient represents correlation strength. Red represents positive correlation. T-scores were standardizedly calculated as “T index = (total raw score - scale items)/scale items × (item points - 1); T scores = T index × total raw score”. |
Measurement Invariance
The two-factor model was chosen to conduct measurement invariance tests across subgroups and time points. The fit indices of most comparisons across subgroups were decent. Changes of the CFI, TLI, and RMSEA did not fall outside cutoff values and all remained in an acceptable range. As for the Δχ2, comparisons across groups based on gender, home location, single-child, income, and part-time were found to be not significant. Despite the chi-square difference test was significant in the case of the scalar invariance, the other fit indices supported the invariance across age groups (Table 3).
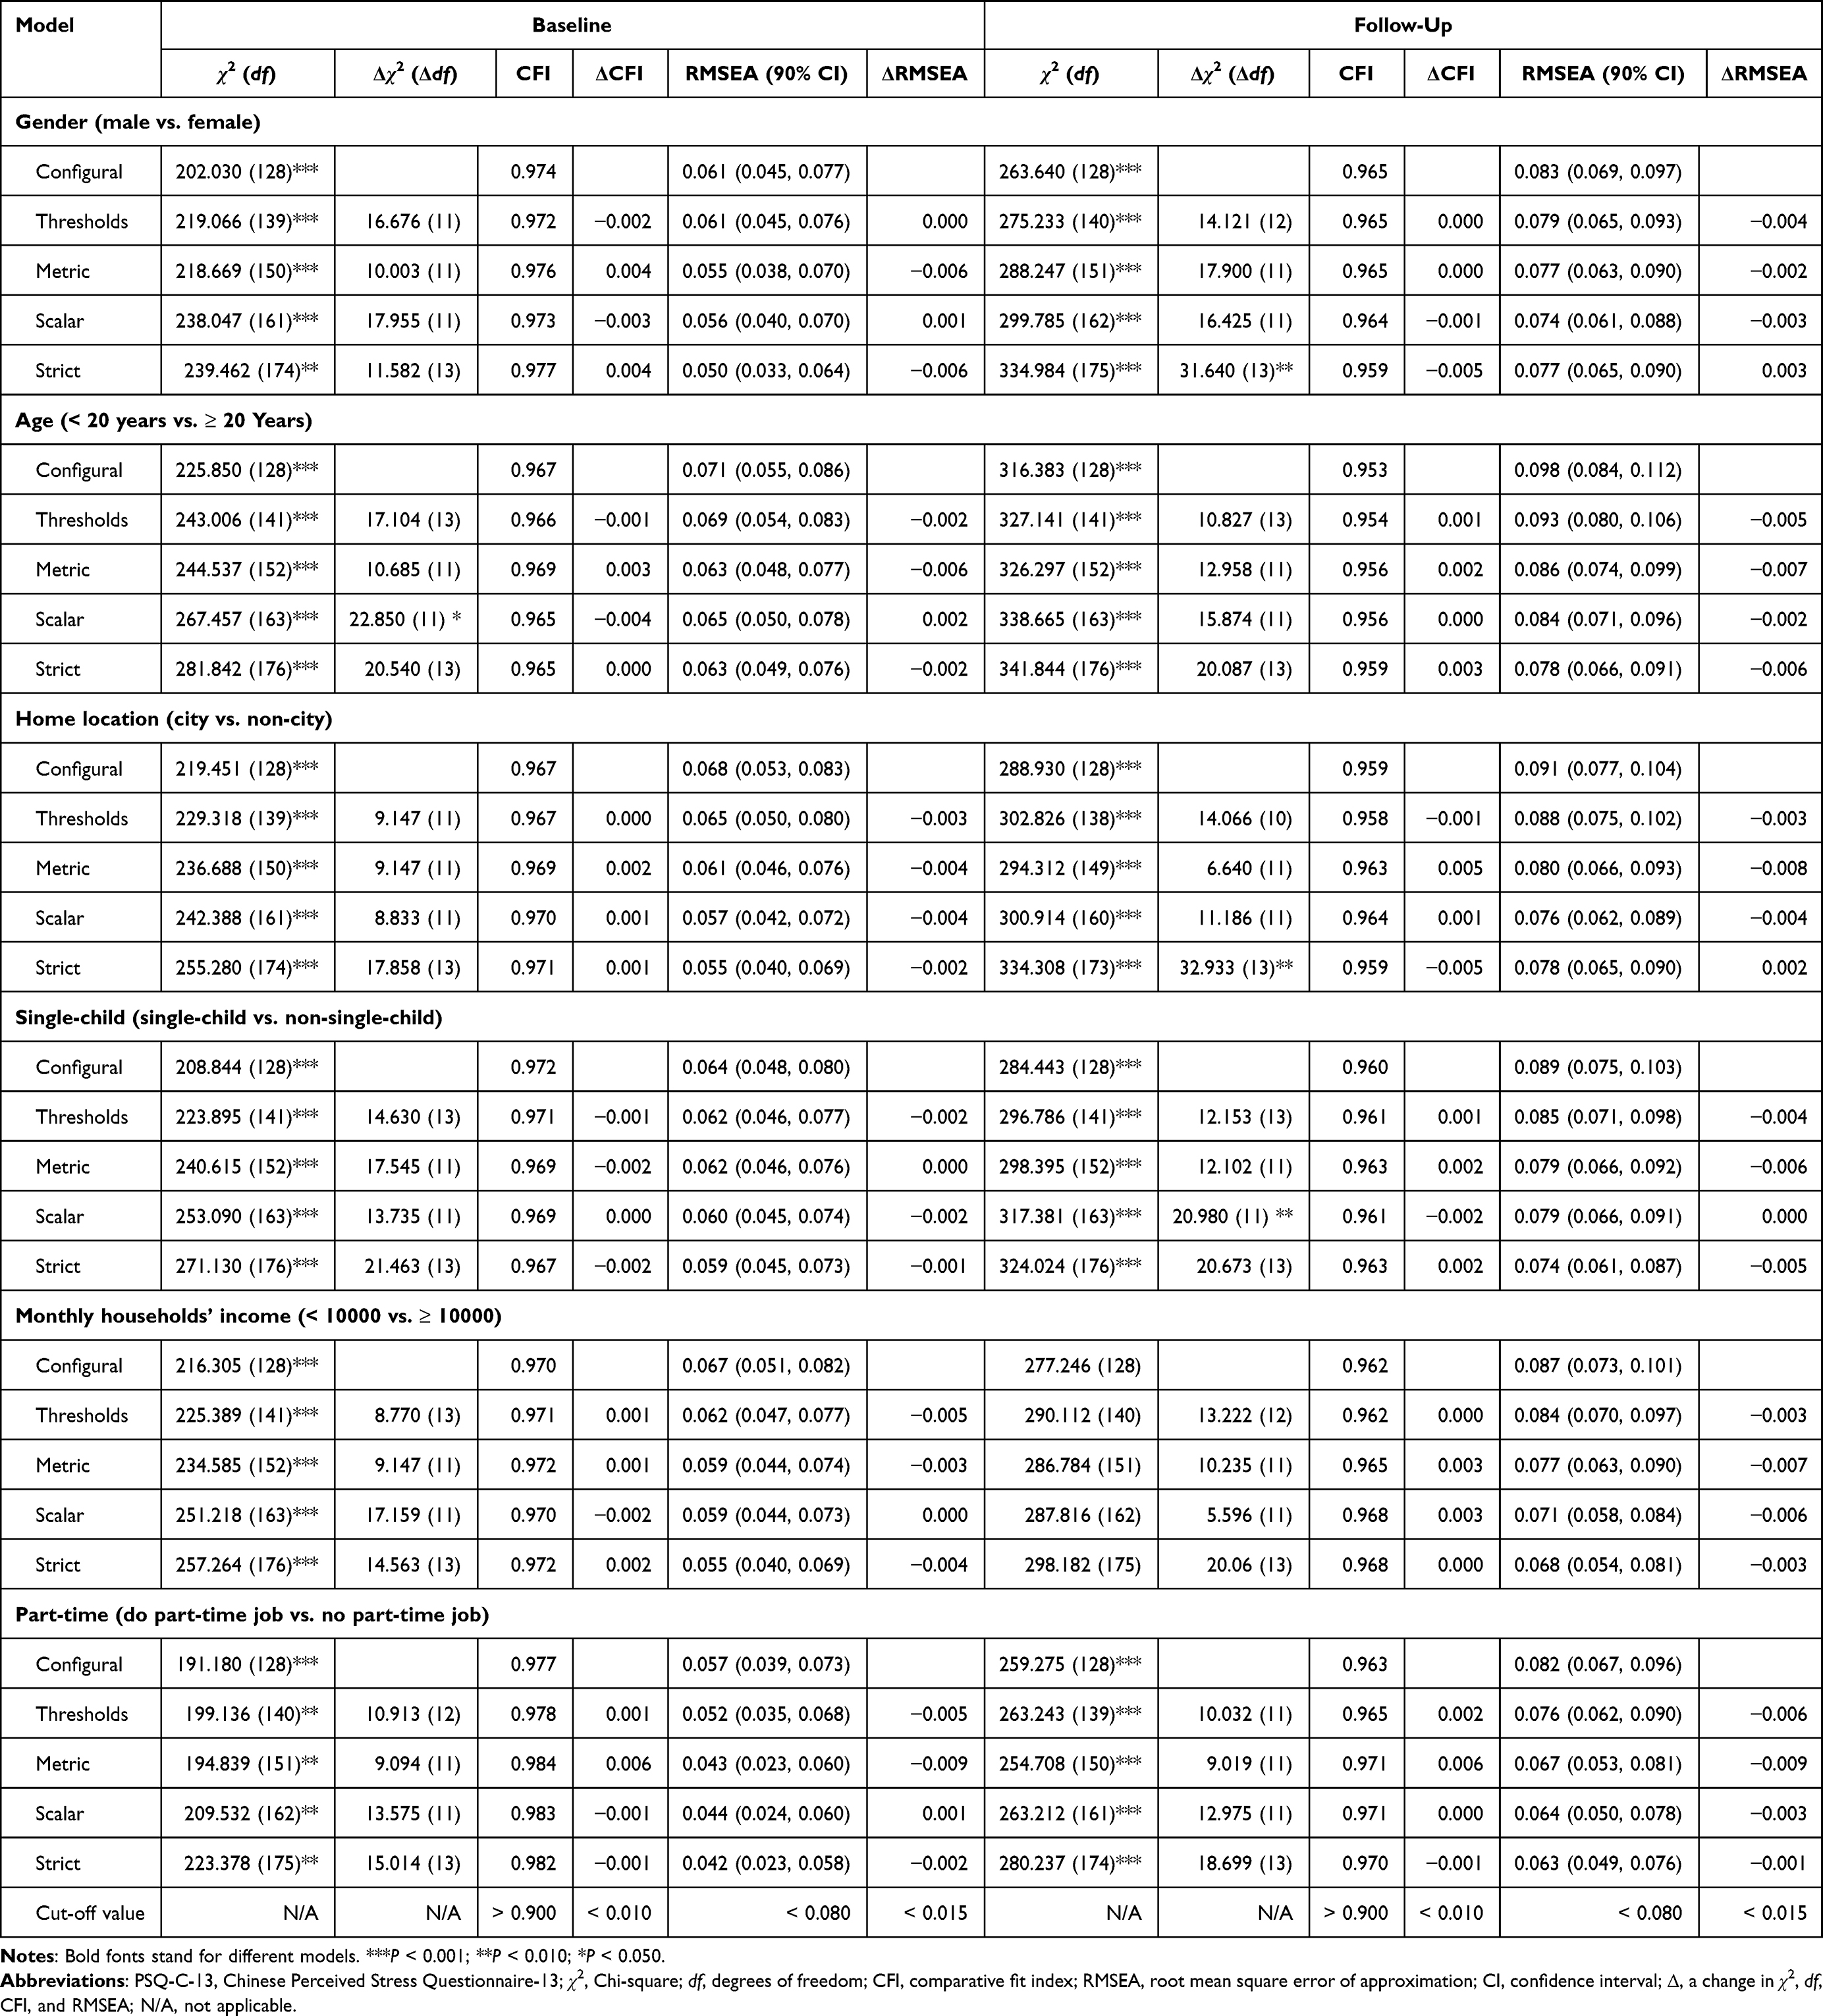 |
Table 3 Tests of Measurement Invariances of the PSQ-C-13 Across Subgroups (N = 309) |
As indicated by all fit indices, longitudinal measurement invariance was supported (CFI = 0.964–0.968, TLI = 0.958–0.968, REMSA = 0.049–0.056). The model comparison of the change in fit indices indicates that all models were supported, since ΔCFI, ΔTLI, and ΔRMSEA did not fall outside the proposed cut-off points. Δχ2 showed a significant difference in the metric invariance (Table 4).
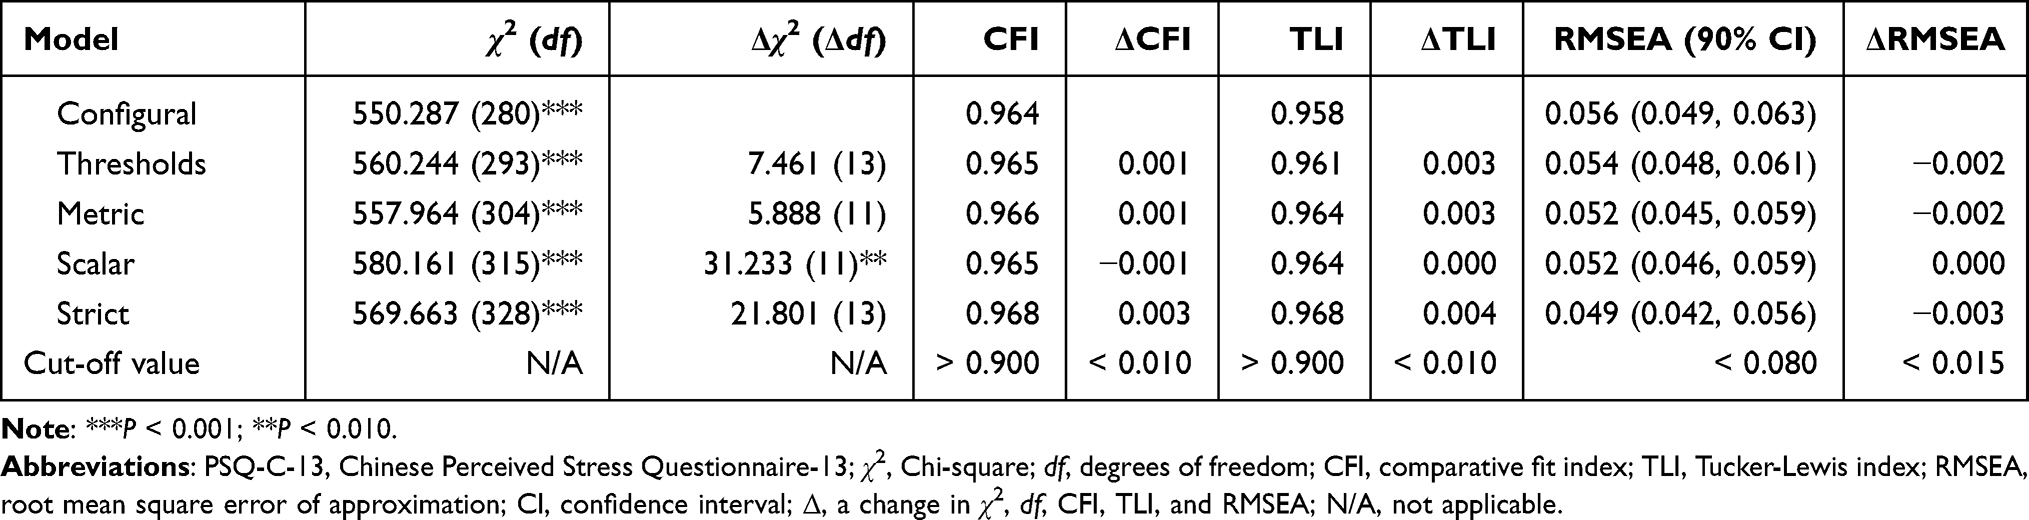 |
Table 4 Test of Measurement Invariance of the PSQ-C-13 Across Time (N = 309) |
Internal Consistency
Table 5 illustrates results of internal consistency of the scales across the two time points. Internal consistency of the measurements was sufficient, according to Cronbach’s alpha (PSQ-C-13 = 0.830–0.922, PSS-C-10 = 0.744–0.906), and McDonald’s omegas (PSQ-C-13 = 0.828–0.923, and PSS-C-10 = 0.754–0.906).
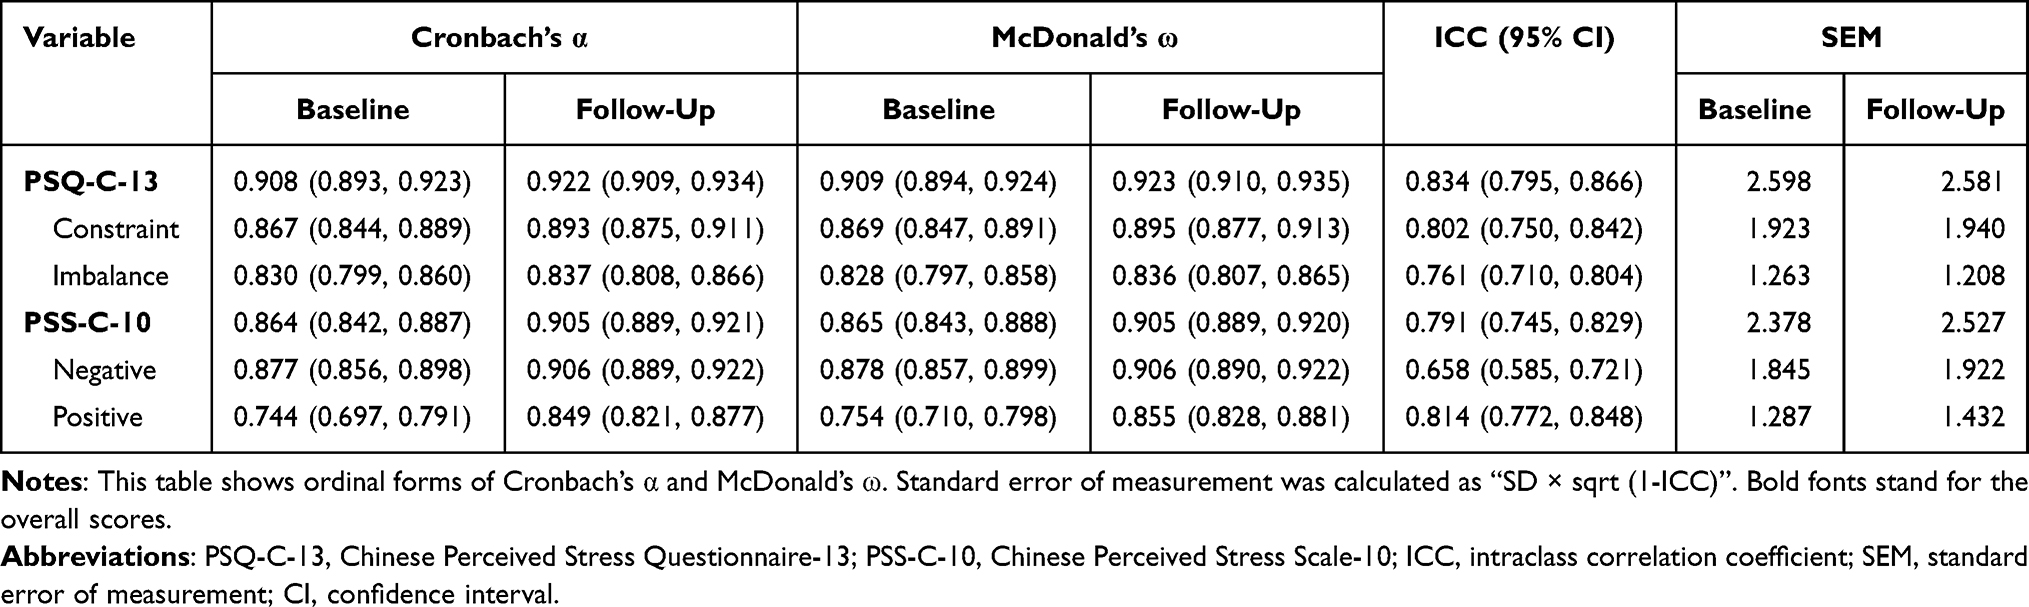 |
Table 5 Internal Consistency and Test–Retest Reliability of the PSQ-C-13 (N = 309) |
Test–Retest Reliability
The ICCs of the PSQ-C-13 for two time points met the threshold (ICCs equal to 0.802, 0.761, and 0.834, for constraint, imbalance, and total score, respectively). The SEMs were 2.598 (baseline) and 2.581 (follow-up) vs. 2.378 (baseline) and 2.527 (follow-up) in the PSQ-C-13 and the PSS-C-10, respectively. Overall, the reproducibility over time of the PSQ-C-13 was comparably good (Table 5).
Discussion
The present study supported the good psychometric evidence on the 13-item Chinese version of the Perceived Stress Questionnaire. This 13-item Chinese version was shown to be valid, reliable, and efficient, offering an alternative to the full form in a sample of medical students.
Structural Validity
The PSQ was previously developed and shortened as a seven-factor model,24 six-factor model,10 and four-factor model.23 The CFA fit results supported a two-factor construct (constraint and imbalance) of the PSQ using 13 items, which are complementary evidence for the previous study.28 The similarities of confirmation on two-factor for the PSQ-C-13 illustrated a better fit than one general factor. Overall, compared to the seven-, six-, and four-factor model, the structure of the PSQ-C-13 may availably measure constructs (constraint and imbalance) of perceived stress.
Convergent Validity
Regarding convergent validity, our two hypotheses were supported. Spearman correlation between the PSQ-C-13 and the PSS-C-10 revealed that the two scales and their subscales covary significantly and share considerable amounts of variance.30
The good convergent validity of this short form renders the PSQ-13 a suitable instrument for use in clinical settings, where time and respondent burden are important considerations. In addition, the good validity of both the general index (total score) and the two subdimensions showed implies that separate aspects of the stress experience can be captured relatively easily and concisely.
Measurement Invariance
The multi-group CFA fit-values showed that almost all were good, and only the Δχ2 difference test was not supported in the case of age. As older age might face the problem of clinical internship, graduate, and post-graduate examination, this could be the reason that age group did not support scalar invariance during the first Δχ2 test. However, considering Δχ2 difference was mostly influenced by the sample size, we may still conclude that analysis of differences is feasible between groups and time points, according to changes in goodness-of-fit values.55 Consequently, future studies are still needed to be applied in larger samples to affirm that these groups and time points are comparable or non-comparable.
Internal Consistency
Even using a shortened form of the Chinese PSQ, two forms of internal consistency reliability still displayed exceptional reliability. The sufficient results of internal consistency could be attributed to the IRT method used in the previous study; compared to the CTT method that assumes all scores were true with no bias, IRT approach may produce a relatively more reliable result in item-reduction.29,32 Cronbach’s alpha and McDonald’s omega values were all higher than 0.900 for the PSQ-C-13. Even though the subscales of the PSQ-C-13 were lower than 0.900, all the values were still higher than 0.800. Collectively, we may conclude that the PSQ-C-13 has reliable internal consistency.
Test–Retest Reliability
Although test–retest reliability is commonly measured with Pearson’s or Spearman correlation, we applied the bias-sensitive intraclass correlation, which was above 0.750 in our study, indicating appropriate level of both stability and responsiveness to change over time.64 Briefly, the relatively dependable internal consistency (alphas, omegas) and responsiveness (ICCs, SEMs) values showed decent reliability.
Strengths and Limitations
The first strength of the study is that we used the shortened PSQ-C under IRT, given that those other shortened forms based on CTT might ignore the systematic errors to biased results. The second strength is the follow-up test we performed, which was less done by previous researchers who intended to improve the performance of the PSQ.10–12,23,33 The last strength is the comprehensive measurement invariance (ie, multi groups and time points) offered a relatively new perspective compared to the previous studies that have not examined this.
However, this research contains some limitations. The first limitation of this study is that even if the sample size has met the minimum recommendations, it might still be relatively small. Further study on a larger sample of participants is warranted. Second, non-probability sampling method has the known drawback of making it difficult for us to determine if the population is adequately represented. Another limitation, also considered a major limitation, is that the population was not diverse: only in medical students of a university; this made the distribution of gender unbalanced and age group only falls between 17 and 23 years. Thus, selection bias may be produced for recruiting participants from one university; yet recruiting participants from one discipline may introduce information bias concerning medical students may report more negative mental symptoms.65,66 This flaw also could be the reason that measurement invariance of subgroups was not fully upheld. Fourth, discriminant validity assessment has not yet been done due to time and resource constraints. Last, the information bias could exist since students might over- or under-report their symptoms and perceptions.
Future Directions
Taking all the conditions into consideration, future studies using the PSQ-C-13: 1) need to evaluate various populations with a larger sample size; 2) could be expanded to clinical trials, community nursing, and even psychometric screening; 3) could be applied as an efficient stress indicator in the multi-wave survey.
Conclusion
To conclude, the PSQ-C-13 contained valid and reliable measurement properties that allow research practitioners to assess perceived stress. Two dimensions including constraint and imbalance may availably reflect the degree of stress on participants. In consideration of its low respondent burden and sound properties, the PSQ-C-13 is an instrument with the potential for economically and efficiently assessing stress levels.
Data Sharing Statement
Anyone interested in using the formatted PSQ-C-13 and its scoring rubric should be directed to the last author at [email protected].
Acknowledgments
The authors would like to thank all respondents in our study and Dr. Terrence D. Jorgensen for assistance in R code.
Author Contributions
All the authors have made a significant contribution to the work reported, whether that is in the conception, study design, execution, acquisition of data, analysis, and interpretation, or in all these areas. All the authors have contributed significantly in the drafting or writing, or substantially revising or critically reviewing the article. All the authors have agreed on the journal to which the article was submitted. All the authors have reviewed and agreed on all versions of the article before submission, during revision, the final version accepted for publication, and any significant changes introduced at the proofing stage. All authors gave final approval of the version to be published. All the authors agree to take responsibility and be accountable for the contents of the article.
Funding
This study was supported by the Medical Research Fund of Zhejiang Province, grant number: 2023RC073 and the Research Initiation Fund of Hangzhou Normal University, grant number: RWSK20201003.
Disclosure
The authors report no conflicts of interest in this work.
References
1. Szabo S, Tache Y, Somogyi A. The legacy of Hans Selye and the origins of stress research: a retrospective 75 years after his landmark brief “letter” to the editor# of nature. Stress. 2012;15(5):472–478. doi:10.3109/10253890.2012.710919
2. Selye H. Stress in Health and Disease. Butterworth’s, Inc.; 1976:1256.
3. Selye H. The Stress of Life. McGraw-Hill Book Co.; 1956:324.
4. Selye H. A syndrome produced by diverse nocuous agents. J Neuropsych Clin N. 1936;10(2):230a–231. doi:10.1176/jnp.10.2.230a
5. Kopp MS, Thege BK, Balog P, et al. Measures of stress in epidemiological research. J Psychosom Res. 2010;69(2):211–225. doi:10.1016/j.jpsychores.2009.09.006
6. Folkman S. Stress: appraisal and coping. In: Gellman MD, Turner JR, editors. Encyclopedia of Behavioral Medicine. Springer New York; 2013:1913–1915.
7. Cohen S, Kessler RC, Gordon LU. Measuring Stress: A Guide for Health and Social Scientists. Measuring Stress: A Guide for Health and Social Scientists. Oxford University Press; 1995:236.
8. Phillips AC. Perceived stress. In: Gellman MD, Turner JR, editors. Encyclopedia of Behavioral Medicine. Springer New York; 2013:1453–1454.
9. Cohen S, Tyrrell DA, Smith AP. Negative life events, perceived stress, negative affect, and susceptibility to the common cold. J Pers Soc Psychol. 1993;64(1):131–140. doi:10.1037//0022-3514.64.1.131
10. Sanz-Carrillo C, García-Campayo J, Rubio A, Santed MA, Montoro M. Validation of the Spanish version of the perceived stress questionnaire. J Psychosom Res. 2002;52(3):167–172. doi:10.1016/s0022-3999(01)00275-6
11. Montero-Marin J, Piva Demarzo MM, Pereira JP, Olea M, García-Campayo J. Reassessment of the psychometric characteristics and factor structure of the ‘Perceived Stress Questionnaire’ (PSQ): analysis in a sample of dental students. PLoS One. 2014;9(1):e87071. doi:10.1371/journal.pone.0087071
12. Umucu E, Iwanaga K, Wu J-R, et al. Preliminary validation of a short form of the perceived stress questionnaire for use in clinical rehabilitation counseling research and practice. Rehabi Res Policy Educ. 2018;(4):232–243. doi:10.1891/0889-7018.32.4.232
13. Beiter R, Nash R, McCrady M, et al. The prevalence and correlates of depression, anxiety, and stress in a sample of college students. J Affect Disord. 2015;173:90–96. doi:10.1016/j.jad.2014.10.054
14. Shamsuddin K, Fadzil F, Ismail WSW, et al. Correlates of depression, anxiety and stress among Malaysian university students. Asian J Psychiatr. 2013;6(4):318–323. doi:10.1016/j.ajp.2013.01.014
15. Zainal Badri SK, Wan Mohd Yunus WMA, Ramos HM, Mahmud N. Remote learning and its implications toward study-life conflicts and the mental health of university students: does studying at home or campus matter? High Educ Res Dev. 2021;1–15. doi:10.1080/07294360.2021.2014407
16. Qi M, Gao H. Acute psychological stress promotes general alertness and attentional control processes: an ERP study. Psychophysiology. 2020;57(4):e13521. doi:10.1111/psyp.13521
17. Meng R, Luo X, Du S, et al. The mediating role of perceived stress in associations between self-compassion and anxiety and depression: further evidence from Chinese medical workers. Risk Manag Healthc Policy. 2020;13:2729–2741. doi:10.2147/rmhp.S261489
18. Luo Y, Meng R, Li J, Liu B, Cao X, Ge W. Self-compassion may reduce anxiety and depression in nursing students: a pathway through perceived stress. Public Health. 2019;174:1–10. doi:10.1016/j.puhe.2019.05.015
19. Luo Y, Fei S, Gong B, Sun T, Meng R. Understanding the mediating role of anxiety and depression on the relationship between perceived stress and sleep quality among health care workers in the COVID-19 response. Nat Sci Sleep. 2021;13:1747–1758. doi:10.2147/nss.S313258
20. Zhao Y, Sang B, Ding C, Li T, Wu J, Xia Y. Moderating effect of work stress on the relationship between workload and professional identity among in-service teachers. Curr Psychol. 2022. doi:10.1007/s12144-022-03639-1
21. Mezo PG, Baker RM. The moderating effects of stress and rumination on depressive symptoms in women and men. Stress Health. 2012;28(4):333–339. doi:10.1002/smi.2417
22. Cohen S, Janicki-Deverts D, Miller GE. Psychological stress and disease. JAMA. 2007;298(14):1685–1687. doi:10.1001/jama.298.14.1685
23. Fliege H, Rose M, Arck P, et al. The Perceived Stress Questionnaire (PSQ) reconsidered: validation and reference values from different clinical and healthy adult samples. Psychosom Med. 2005;67(1):78–88. doi:10.1097/01.psy.0000151491.80178.78
24. Levenstein S, Prantera C, Varvo V, et al. Development of the perceived stress questionnaire: a new tool for psychosomatic research. J Psychosom Res. 1993;37(1):19–32. doi:10.1016/0022-3999(93)90120-5
25. Rhode PC, Froehlich-Grobe K, Hockemeyer JR, Carlson JA, Lee J. Assessing stress in disability: developing and piloting the disability related stress scale. Disabil Health J. 2012;5(3):168–176. doi:10.1016/j.dhjo.2012.03.002
26. Rönnlund M, Vestergren P, Stenling A, Nilsson LG, Bergdahl M, Bergdahl J. Dimensionality of stress experiences: factorial structure of the Perceived Stress Questionnaire (PSQ) in a population-based Swedish sample. Scand J Psychol. 2015;56(5):592–598. doi:10.1111/sjop.12214
27. Xiong B, Skitmore M, Xia B. Exploring and validating the internal dimensions of occupational stress: evidence from construction cost estimators in China. Construct Manag Econ. 2015;33(5–6):495–507. doi:10.1080/01446193.2015.1050967
28. Meng R, Li J, Wang Z, et al. The Chinese version of the perceived stress questionnaire: development and validation amongst medical students and workers. Health Qual Life Out. 2020;18(1):70. doi:10.1186/s12955-020-01307-1
29. Edelen MO, Reeve BB. Applying item response theory (IRT) modeling to questionnaire development, evaluation, and refinement. Qual Life Res. 2007;16(Suppl 1):5–18. doi:10.1007/s11136-007-9198-0
30. Keszei AP, Novak M, Streiner DL. Introduction to health measurement scales. J Psychosom Res. 2010;68(4):319–323. doi:10.1016/j.jpsychores.2010.01.006
31. Roy C, Bakan G, Li Z, Nguyen TH. Coping measurement: creating short form of coping and adaptation processing scale using item response theory and patients dealing with chronic and acute health conditions. Appl Nurs Res. 2016;32:73–79. doi:10.1016/j.apnr.2016.06.002
32. Cappelleri JC, Jason Lundy J, Hays RD. Overview of classical test theory and item response theory for the quantitative assessment of items in developing patient-reported outcomes measures. Clin Ther. 2014;36(5):648–662. doi:10.1016/j.clinthera.2014.04.006
33. Luo Y, Gong B, Meng R, et al. Validation and application of the Chinese version of the Perceived Stress Questionnaire (C-PSQ) in nursing students. PeerJ. 2018;6:e4503. doi:10.7717/peerj.4503
34. World Medical Association. World Medical Association Declaration of Helsinki: ethical principles for medical research involving human subjects. JAMA. 2013;310(20):2191–2194. doi:10.1001/jama.2013.281053
35. Everitt BS. Multivariate analysis: the need for data, and other problems. Br J Psychiatry. 1975;126(3):237–240. doi:10.1192/bjp.126.3.237
36. Hair J, Black WC, Babin B, Anderson RE, Tatham R. Multivariate Data Analysis.
37. Cattell RB. The scientific use of factor analysis in behavioral and life sciences. 2012;497–502.
38. Mundfrom DJ, Shaw DG, Ke TL. Minimum sample size recommendations for conducting factor analyses. Int J Test. 2005;5(2):159–168. doi:10.1207/s15327574ijt0502_4
39. Cohen S, Kamarck T, Mermelstein R. A global measure of perceived stress. J Health Soc Behav. 1983;24(4):385–396. doi:10.2307/2136404
40. Cohen S. Perceived stress in a probability sample of the United States. The social psychology of health. Sage Publications, Inc.
41. Wang Z, Chen J, Boyd JE, et al. Psychometric properties of the Chinese version of the perceived stress scale in policewomen. PLoS One. 2011;6(12):e28610–e28610. doi:10.1371/journal.pone.0028610
42. McDonald RP, Ho MH. Principles and practice in reporting structural equation analyses. Psychol Methods. 2002;7(1):64–82. doi:10.1037/1082-989x.7.1.64
43. Korkmaz S, Goksuluk D, Zararsiz G. MVN: an R package for assessing multivariate normality. R Journal. 2014;6:151–162. doi:10.32614/RJ-2014-031
44. Mokkink LB, Terwee CB, Patrick DL, et al. The COSMIN study reached international consensus on taxonomy, terminology, and definitions of measurement properties for health-related patient-reported outcomes. J Clin Epidemiol. 2010;63(7):737–745. doi:10.1016/j.jclinepi.2010.02.006
45. Mokkink LB, Prinsen CAC, Patrick DL, et al. COSMIN taxonomy of measurement properties. Available from: https://www.cosmin.nl/.
46. Prinsen CAC, Mokkink LB, Bouter LM, et al. COSMIN guideline for systematic reviews of patient-reported outcome measures. Qual Life Res. 2018;27(5):1147–1157. doi:10.1007/s11136-018-1798-3
47. DiStefano C, Morgan GB. A comparison of diagonal weighted least squares robust estimation techniques for ordinal data. Struct Equat Model. 2014;21(3):425–438. doi:10.1080/10705511.2014.915373
48. Wu H, Estabrook R. Identification of confirmatory factor analysis models of different levels of invariance for ordered categorical outcomes. Psychometrika. 2016;81(4):1014–1045. doi:10.1007/s11336-016-9506-0
49. Rosseel Y. lavaan: an R package for structural equation modeling. J Stat Softw. 2012;48:1–36. doi:10.18637/jss.v048.i02
50. Satorra A, Bentler PM. A scaled difference chi-square test statistic for moment structure analysis. Psychometrika. 2001;66(4):507–514. doi:10.1007/BF02296192
51. Hu L, Bentler PM. Cutoff criteria for fit indexes in covariance structure analysis: conventional criteria versus new alternatives. Struct Equ Modeling. 1999;6(1):1–55. doi:10.1080/10705519909540118
52. DeVon HA, Block ME, Moyle-Wright P, et al. A psychometric toolbox for testing validity and reliability. J Nurs Scholarsh. 2007;39(2):155–164. doi:10.1111/j.1547-5069.2007.00161.x
53. Svetina D, Rutkowski L, Rutkowski D. Multiple-group invariance with categorical outcomes using updated guidelines: an illustration using mplus and the lavaan/semTools packages. Struct Equ Modeling. 2020;27(1):111–130. doi:10.1080/10705511.2019.1602776
54. Winter SD, Depaoli S. An illustration of Bayesian approximate measurement invariance with longitudinal data and a small sample size. Int J Behav Dev. 2020;44(4):371–382. doi:10.1177/0165025419880610
55. Cheung G, Rensvold R. Evaluating goodness-of-fit indexes for testing measurement invariance. Struct Equ Modeling. 2002;9:233–255. doi:10.1207/S15328007SEM0902_5
56. Chen FF. Sensitivity of goodness of fit indexes to lack of measurement invariance. Struct Equ Modeling. 2007;14(3):464–504. doi:10.1080/10705510701301834
57. Meade AW, Johnson EC, Braddy PW. Power and sensitivity of alternative fit indices in tests of measurement invariance. J Appl Psychol. 2008;93(3):568–592. doi:10.1037/0021-9010.93.3.568
58. Peters G-J. The alpha and the omega of scale reliability and validity: why and how to abandon Cronbach's alpha and the route towards more comprehensive assessment of scale quality. Euro Health Psychologist. 2014;16:56–69.
59. Zumbo B, Gadermann A, Zeisser C. Ordinal versions of coefficients alpha and theta for likert rating scales. J Mod Appl Stat Meth. 2007;6:21–29. doi:10.22237/jmasm/1177992180
60. Crutzen R, Peters G-JY. Scale quality: alpha is an inadequate estimate and factor-analytic evidence is needed first of all. Health Psychol Rev. 2017;11(3):242–247. doi:10.1080/17437199.2015.1124240
61. Gamer M, Lemon J, Singh I. irr: various coefficients of interrater reliability and agreement. Available from: https://rdrr.io/cran/irr/.
62. Weir JP. Quantifying test-retest reliability using the intraclass correlation coefficient and the SEM. J Strength Cond Res. 2005;19(1):231–240. doi:10.1519/15184.1
63. Terwee CB, Bot SD, de Boer MR, et al. Quality criteria were proposed for measurement properties of health status questionnaires. J Clin Epidemiol. 2007;60(1):34–42. doi:10.1016/j.jclinepi.2006.03.012
64. Koo TK, Li MY. A guideline of selecting and reporting intraclass correlation coefficients for reliability research. J Chiropr Med. 2016;15(2):155–163. doi:10.1016/j.jcm.2016.02.012
65. Mao Y, Zhang N, Liu J, Zhu B, He R, Wang X. A systematic review of depression and anxiety in medical students in China. BMC Med Educ. 2019;19(1):327. doi:10.1186/s12909-019-1744-2
66. Schwartz S, Campbell UB, Gatto NM, Gordon K. Toward a clarification of the taxonomy of “bias” in epidemiology textbooks. Epidemiology. 2015;26(2):216–222. doi:10.1097/EDE.0000000000000224
 © 2023 The Author(s). This work is published and licensed by Dove Medical Press Limited. The full terms of this license are available at https://www.dovepress.com/terms.php and incorporate the Creative Commons Attribution - Non Commercial (unported, v3.0) License.
By accessing the work you hereby accept the Terms. Non-commercial uses of the work are permitted without any further permission from Dove Medical Press Limited, provided the work is properly attributed. For permission for commercial use of this work, please see paragraphs 4.2 and 5 of our Terms.
© 2023 The Author(s). This work is published and licensed by Dove Medical Press Limited. The full terms of this license are available at https://www.dovepress.com/terms.php and incorporate the Creative Commons Attribution - Non Commercial (unported, v3.0) License.
By accessing the work you hereby accept the Terms. Non-commercial uses of the work are permitted without any further permission from Dove Medical Press Limited, provided the work is properly attributed. For permission for commercial use of this work, please see paragraphs 4.2 and 5 of our Terms.