")
Back to Journals » Diabetes, Metabolic Syndrome and Obesity » Volume 12
The Characteristics Of Abdominal Fat Distribution In Japanese Adolescents With Type 2 Diabetes Mellitus
Authors Abe Y, Urakami T , Hara M, Yoshida K, Mine Y, Aoki M, Suzuki J, Saito E, Yoshino Y, Iwata F, Okada T, Morioka I
Received 13 July 2019
Accepted for publication 24 October 2019
Published 1 November 2019 Volume 2019:12 Pages 2281—2288
DOI https://doi.org/10.2147/DMSO.S223049
Checked for plagiarism Yes
Review by Single anonymous peer review
Peer reviewer comments 3
Editor who approved publication: Prof. Dr. Juei-Tang Cheng
Yuriko Abe,1 Tatsuhiko Urakami,1 Mitsuhiko Hara,1–3 Kei Yoshida,1 Yusuke Mine,1 Masako Aoki,1 Junichi Suzuki,1 Emiko Saito,2,3 Yayoi Yoshino,1 Fujihiko Iwata,4 Tomoo Okada,5 Ichiro Morioka1
1Department of Pediatrics and Child Health, Nihon University School of Medicine, Tokyo, Japan; 2Department of Pediatrics, Tokyo Metropolitan Hiroo Hospital, Tokyo, Japan; 3Department of Human Nutrition, Tokyo Kasei Gakuin University, Tokyo, Japan; 4Department of Pediatrics, Wakakusa Kodomo Clinic, Saitama, Japan; 5Department of Nutrition and Life Science, Kanagawa Institute of Technology, Kanagawa, Japan
Correspondence: Ichiro Morioka
Department of Pediatrics and Child Health, Nihon University School of Medicine, 30-1, Oyaguchi, Kami-Cho, Itabashi-Ku, Tokyo 173-8610, Japan
Tel +81 3 3972 8111
Fax +81 3 3958 5744
Email [email protected]
Purpose: The aim was to investigate the characteristics of abdominal fat distribution in Japanese adolescents with type 2 diabetes mellitus.
Patients and methods: Eighty-six Japanese adolescents with simple obesity or type 2 diabetes mellitus treated between 2002 and 2018 were included. The subjects were classified into the simple obesity group (SO group, n=38) and type 2 diabetes mellitus group (DM group, n=23) by matching average age and gender ratio. The metabolic parameters VFA, SFA, and V/S ratio were compared between the 2 groups. Multivariate logistic regression analysis was performed to identify clinical factors associated with type 2 diabetes mellitus. Linear regression analysis was performed between hemoglobin A1c (HbA1c) and visceral fat area (VFA), subcutaneous fat area (SFA), or VFA-to-SFA ratio (V/S ratio) among all enrolled subjects. Finally, correlation analyses were performed to determine the relationships between VFA, SFA, and V/S ratio and metabolic parameters of the DM group. For the metabolic parameters, serum lipids, alanine aminotransferase (ALT), and HbA1c were measured without fasting. The VFA and SFA at umbilical level were investigated using computed tomography.
Results: VFA and V/S ratio in DM group were higher than those in SO group (p=0.04 and p<0.01, respectively). SFA in DM group was lower than that in SO group (p<0.01). VFA and SFA, and non-high density lipoprotein (HDL) cholesterol were identified as being independently associated with type 2 diabetes mellitus (odds ratio, 1.05, 0.98, and 1.04, respectively, p<0.05). HbA1c was correlated with VFA and V/S ratio (p<0.01). In DM group, VFA and SFA were positively correlated with systolic blood pressure (p<0.01), ALT (p<0.05), total cholesterol (p<0.05), and non-HDL cholesterol (p<0.01); however, V/S ratio was not correlated.
Conclusion: Abdominal fat distribution in Japanese adolescents with type 2 diabetes mellitus was different from those with simple obesity and might associate with glucose and lipid metabolism.
Keywords: computed tomography, hemoglobin A1c, simple obesity, subcutaneous fat, visceral fat
Introduction
Childhood obesity has become a global problem in recent years. Abdominal obesity is highly associated with metabolic risk factors, even in childhood.1 Furthermore, the incidence rate of youth-onset type 2 diabetes mellitus is increasing worldwide,2,3 and the Asian population is reportedly more susceptible to metabolic derangement induced by mild obesity than is the Caucasian population.3 Even though the average body mass index (BMI) of Asians is lower than that of Caucasians, the prevalence of type 2 diabetes mellitus is higher in Asians, possibly owing to the greater accumulation of visceral adiposity other than subcutaneous fat.4 Therefore, a better understanding of the distribution of abdominal fat is important for preventing type 2 diabetes mellitus, especially in Asian populations.
Abdominal obesity is one of the most important causes of insulin resistance, cardiovascular disease, and many metabolic diseases.5 Both the visceral fat area (VFA) and subcutaneous fat area (SFA), which are assessable using abdominal computed tomography (CT), are associated with metabolic risk factors, such as insulin resistance (VFA is more strongly).6,7 As such, visceral fat accumulation can be a major contributor to type 2 diabetes mellitus even in non-obese individuals.8 On the other hand, the correlation between SFA and metabolic risk is unclear; subcutaneous fat might even have a protective effect against metabolic abnormalities.9 While fat distribution (which is represented by the SFA and VFA) is an important determinant of insulin resistance as well as insulin secretion10 the VFA-to-SFA ratio (V/S ratio) has also been reported to be strongly associated with metabolic syndrome to an extent even greater than has VFA.11,12 The V/S ratio is also independently linked to small and large cerebrovascular lesions, even in healthy subjects.13 However, research regarding fat distribution in adolescent subjects with type 2 diabetes mellitus has been limited to date. The aim of this study was to investigate the characteristics of abdominal fat distribution in Japanese adolescents with type 2 diabetes mellitus.
Materials And Methods
Study Design And Subjects
The flow of subjects through the study is shown in Figure 1. Of Japanese adolescents aged 10–15 years who visited the outpatient clinics of Tokyo Metropolitan Hiroo Hospital, Nihon University Hospital, and Nihon University Itabashi Hospital between 2002 and 2018, 124 or 39 were diagnosed with simple obesity or type 2 diabetes mellitus, respectively, and were included in this retrospective multicenter observational cohort study. Subjects with type 2 diabetes mellitus had not yet received any treatments. A total of 77 patients were excluded because abdominal CT examination was not performed. Abdominal CT examination was performed at the discretion of the attending physician depending on the patient’s condition. After matched average age and gender ratio, 38 with simple obesity (SO group) and 23 with type 2 diabetes mellitus (DM group) were analyzed in this study.
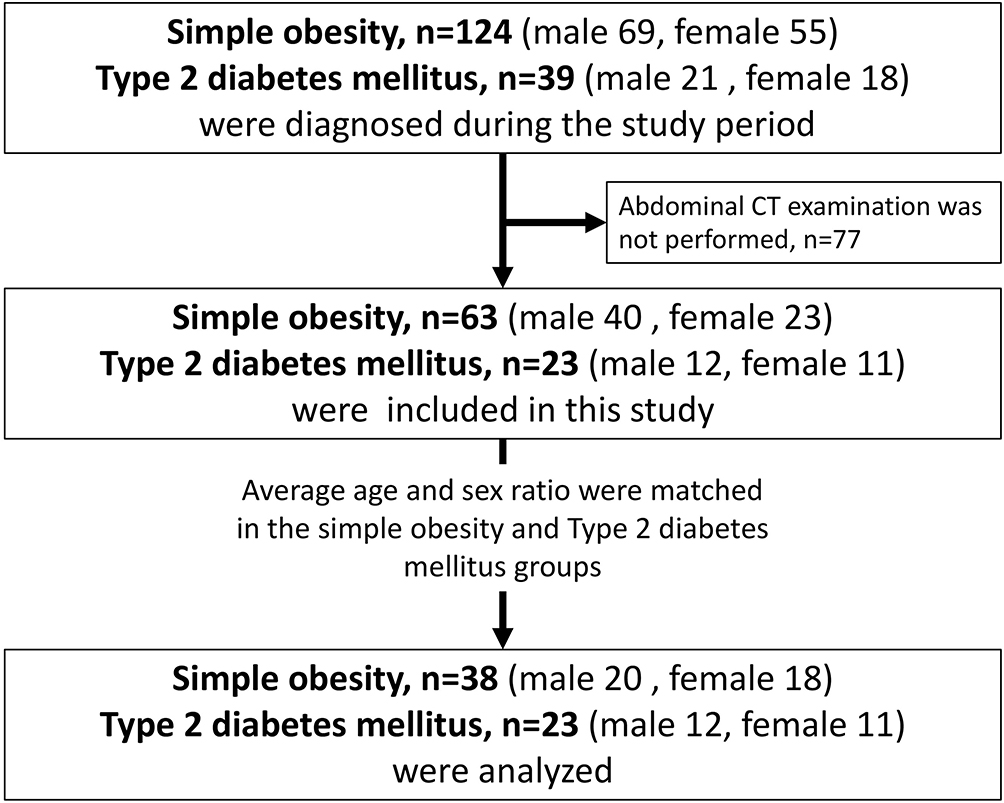 |
Figure 1 Flow of subjects through the study. Abbreviation: CT, computed tomography. |
The study protocol was approved by the institutional review board of Nihon University Itabashi Hospital (RK-181211-02). The formal written informed consent was not required owing to the data from our regular practices and the retrospective nature of the study. We, therefore, opened this study project to the public using our homepage. The procedures were in accordance with the ethical standards of the responsible committee on human studies and with the Helsinki Declaration of 1975 as revised in 2008.
Measurements
Standing height and body weight were measured by experienced nurses in the pediatric outpatient units. The BMI was calculated using the following formula: body weight (kg)/height (m)/height (m). The BMI percentile was calculated based on the standard weights of gender-, age-, and height-matched subjects using data from the Ministry of Education, Science, Sports, and Culture of Japan.14 Blood pressure (BP) was measured by experienced nurses using a sphygmomanometer placed on the right or left arm while in the sitting position.
Definitions Of Simple Obesity And Type 2 Diabetes Mellitus
Simple obesity was noted by parents, schoolteachers, or obesity screening systems used in schools; the obesity was diagnosed with a BMI above the 95th percentile according to the American Academy of Pediatrics.15 All subjects with simple obesity did not have type 2 diabetes mellitus. Among the subjects with type 2 diabetes mellitus, 15 were discovered during screening and diagnosed at the hospital. Japan has a screening system used to detect diabetes in primary and junior high school children using a urine glucose test. Children with urine tests indicating elevated glucose (50–100 mg/dL) were advised to visit the hospital. For patients suspected of having diabetes, an oral glucose tolerance test (OGTT; 1.75 g/kg body weight of glucose up to 75 g) was performed to confirm the diagnosis of diabetes at the hospital.16,17 Four subjects were diagnosed during following-up for obesity, 2 were diagnosed after presenting with diabetic ketoacidosis, and 2 were diagnosed after presenting with polydipsia. The criteria for the diagnosis of type 2 diabetes mellitus according to the American Diabetes Association are any of the following: (1) fasting plasma glucose ≥126 mg/dL (7.0 mmol/L), with fasting defined as no caloric intake for at least 8 hrs; (2) a 2- hr plasma glucose level ≥200 mg/dL (11.1 mmol/L) during the OGTT; (3) HbA1c ≥6.5% (48 mmol/mol); or (4) presentation with classic symptoms of hyperglycemia or hyperglycemic crisis (a random plasma glucose level ≥200 mg/dL [11.1 mmol/L]).18 No patients showed ketoacidosis at the time of diagnosis and had any autoantibodies to pancreatic β-cells. Patients who had difficulty distinguishing between maturity-onset diabetes of the young (MODY) and type 2 diabetes were genetically tested, and some patients identified as MODY were excluded from the study.
Laboratory Tests
Venous blood samples were collected for measurement of total cholesterol, high-density lipoprotein cholesterol (HDL-cholesterol), alanine aminotransferase (ALT), and HbA1c without fasting, which is not necessary for the accurate measurement of these parameters. Total and HDL cholesterol levels were determined using standard enzymatic assays as the manufacture recommended (Determiner L TC IITM and Metabolid HDL-CTM, Hitachi Chemical Diagnostics Systems Co., Ltd., Tokyo, Japan). Serum non-HDL cholesterol levels were calculated by subtracting the HDL cholesterol levels from the total cholesterol levels. HbA1c was measured using high-precision liquid chromatography, and the value of HbA1c (4.6–6.2%) was converted to a National Standardization Program (NSP) for Glycosylated Hemoglobin-equivalent value. In Japan, Japan Diabetes Society (JDS) was used as the value of HbA1c until March 2012. For this reason, a conversion was performed using NSP value (%)=1.02×JDS value (%) +0.25 (%) for data before March 2012. This formula is recognized internationally. We expressed all the data as NSP values.
CT Measurement Of Abdominal Fat Area
VFA and SFA were determined using CT at the umbilical level, as this modality was recently recognized as the gold standard for measuring intra-abdominal volumes including the VFA, SFA, and V/S ratio.19,20 Abdominal CT scans were performed at the end of the expiratory phase. All subjects underwent CT scanning in a supine position using an Aquilion CT scanner (Canon Medical Systems Corporation, Tochigi, Japan). The scanning condition was at 120 kV and 130 to 600 mA. Depending on the patients’ physique and condition, and the policy in each institution, 4 images were taken around the umbilical level with the slice thickness of 8 mm in Nihon University Hospital. In Tokyo Metropolitan Hiroo Hospital and Nihon University Itabashi Hospital, 36 to 473 images were taken from the upper level of liver to the upper pelvis with the slice thickness of 1, 5, or 7mm.
The VFA and SFA were calculated using SYNAPSE VINCENT, a software program designed by FUJIFILM (Tokyo, Japan)21 to measure the amount of visceral and subcutaneous fat. The SYNAPSE VINCENT algorithm first segmented body and bone regions. Then, it found external and internal regions of abdominal wall. The external regions were calculated as fat signal areas facing to the body surfaces, where fat was considered to have Hounsfield unit (HU) value approximately from −200 HU to −50 HU. On the other hand, the internal regions were calculated as inside of rib cages or vertebrae bones those were given in the segmented bone regions. The VAT and SAT volumes were calculated by thresholding fat signal of the two regions. The V/S was calculated as the VFA divided by the SFA.
Statistical Analyses
The average age and gender ratio were completely matched in the SO and DM groups. Age, sex, BMI, BMI percentile, BP, serum lipid levels (total, HDL, and non-HDL cholesterol), ALT, VFA, SFA, and V/S ratio were compared between the 2 groups using Wilcoxon rank-sum test. Multivariate logistic regression analysis was performed using the BMI percentile, metabolic parameters, VFA, and SFA to identify clinical factors associated with type 2 diabetes mellitus. Linear regression analysis was performed between HbA1c and VFA, SFA, or V/S ratio among all enrolled subjects. Finally, correlation analyses were performed to determine the relationships between the VFA, SFA, and V/S ratio and metabolic parameters in the DM group. Pearson’s correlation coefficient was calculated because most of the metabolic parameters made a normal distribution in the DM group. A p-value <0.05 was considered significant. All statistical analyses were conducted using JMP (version 14, SAS Institute Japan, Tokyo, Japan).
Results
All subjects in the SO group were obese (BMI ≥95 percentile). In contrast, five subjects in the DM group were overweight (85th–95th percentile BMI) and 18 were obese (BMI ≥95 percentile).
The characteristics of subjects in both groups are shown in Table 1. The age and male ratios were not significantly different between the 2 groups, as expected (p=0.6794 and 0.9724, respectively). The diastolic BP, ALT, non-HDL cholesterol, and HbA1c levels were significantly higher in the DM group than those in the SO group (p=0.0451, 0.0426, 0.0344, and <0.0001, respectively). Moreover, the HDL cholesterol levels in the DM group were lower than those in the SO group (p=0.0267). The VFA in the DM group was significantly higher than that in the SO group (p=0.0400), as was the V/S ratio (p<0.0001). Two subjects in the DM group had a particularly high V/S ratio (Figure 2). The subject with a V/S ratio of 0.76 was a low birth weight-infant (birth weight: 2226g), while the subject with a V/S ratio of 0.70 was a high birth weight-infant (birth weight: 4582g). The SFA in the DM group was significantly lower than that in the SO group (p=0.0076, Table 1). Multiple logistic regression analysis revealed that high VFA, low SFA, and high non-HDL cholesterol were identified as being independently associated with type 2 diabetes mellitus (odds ratio 1.05, 0.98, and 1.04; p=0.0070, 0.0201, and 0.0443, respectively, Table 2).
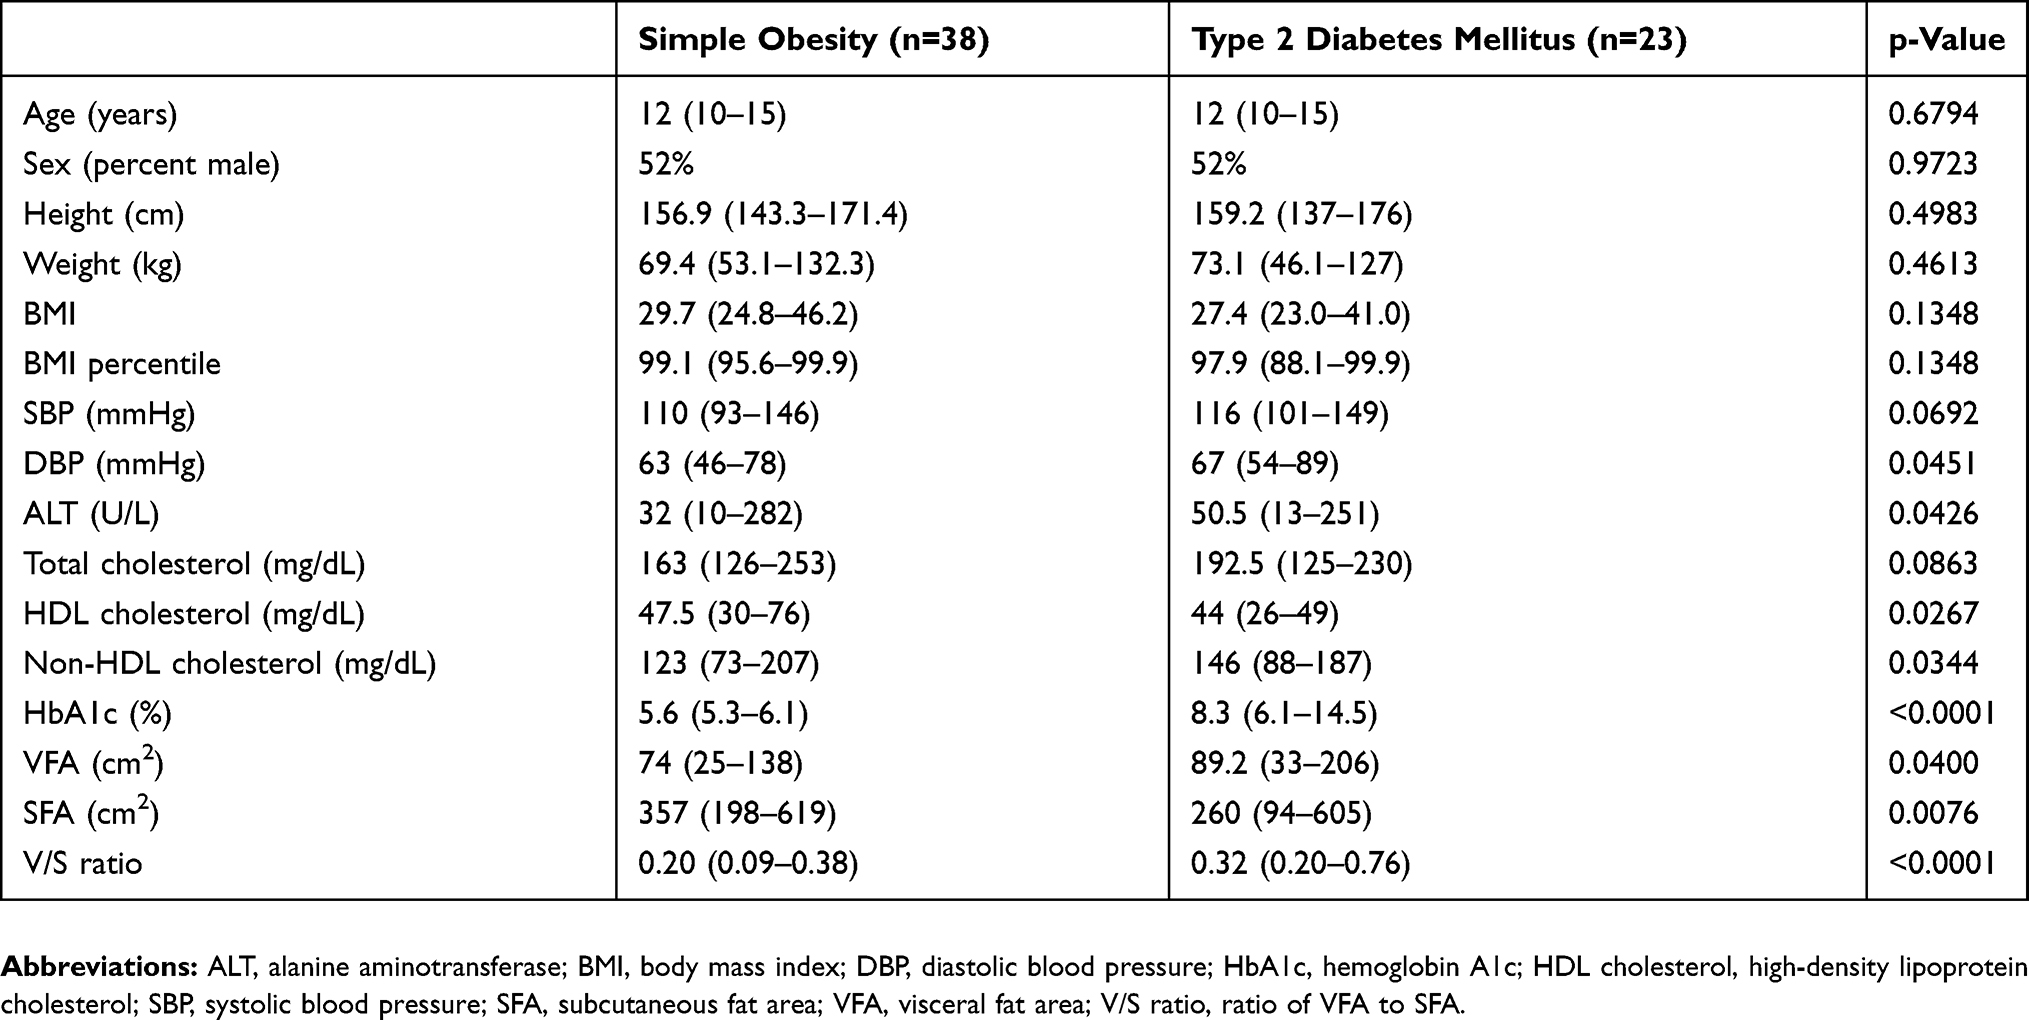 |
Table 1 Characteristics Of The Adolescents In The Simple Obesity And Type 2 Diabetes Mellitus Groups |
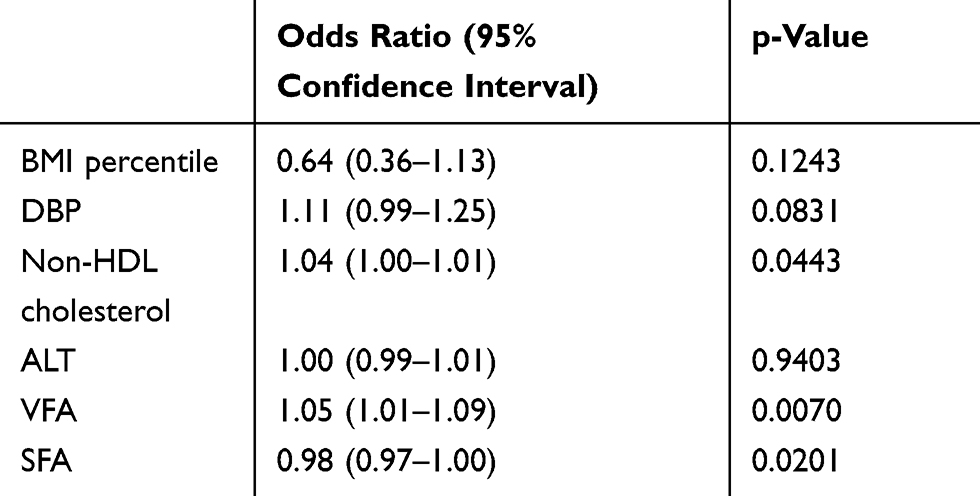 |
Table 2 Multivariate Logistic Regression Analysis To Identify Clinical Factors Associated With Type 2 Diabetes Mellitus |
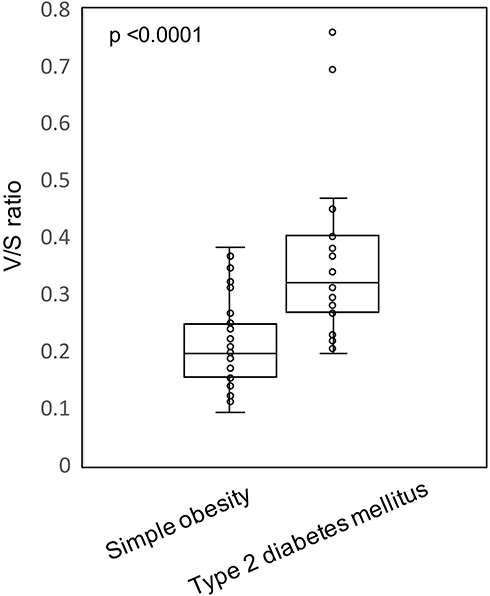 |
Figure 2 Comparison of the ratio of the visceral-to-subcutaneous fat areas (V/S ratio) in subjects with simple obesity and type 2 diabetes mellitus. Abbreviation: V/S ratio, visceral-to-subcutaneous fat areas. |
HbA1c was significantly correlated with the VFA and V/S ratio (r=0.35 and r=0.40, respectively) among all subjects (Figure 3).
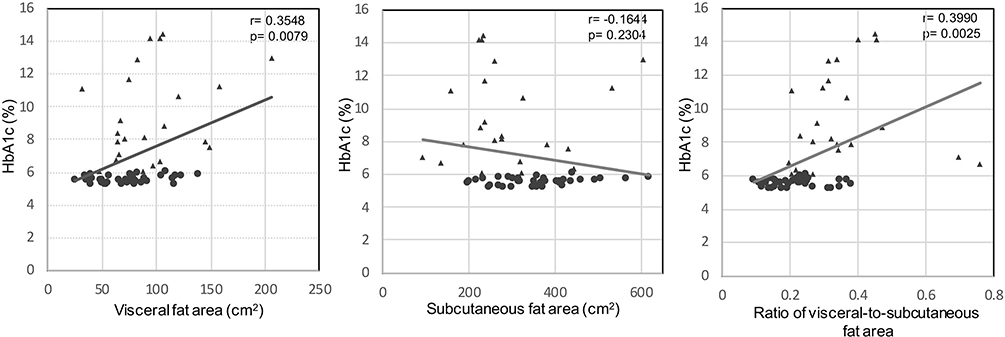 |
Figure 3 Correlations between hemoglobin A1c and visceral fat area, subcutaneous fat area, and the ratio of the visceral-to-subcutaneous fat areas among all enrolled subjects. Circles show the subjects with simple obesity. Triangles show the subjects with type 2 diabetes mellitus. Abbreviation: HbA1c, hemoglobin A1c. |
In the DM group, the VFA and SFA were significantly correlated with the systolic BP (r=0.6434, p=0.0009 and r=0.5265, p=0.0099), ALT (r=0.4250, p=0.0486 and r=0.5138, p=0.0144), total cholesterol (r=0.5000, p=0.0178 and r=0.5996, p=0.0032), and non-HDL cholesterol (r=0.5616, p=0.0065 and r=0.6520, p=0.0010). Only VFA was significantly correlated with diastolic BP (r=0.4350, p=0.0380). However, the V/S ratio was not correlated with any metabolic parameters (Table 3).
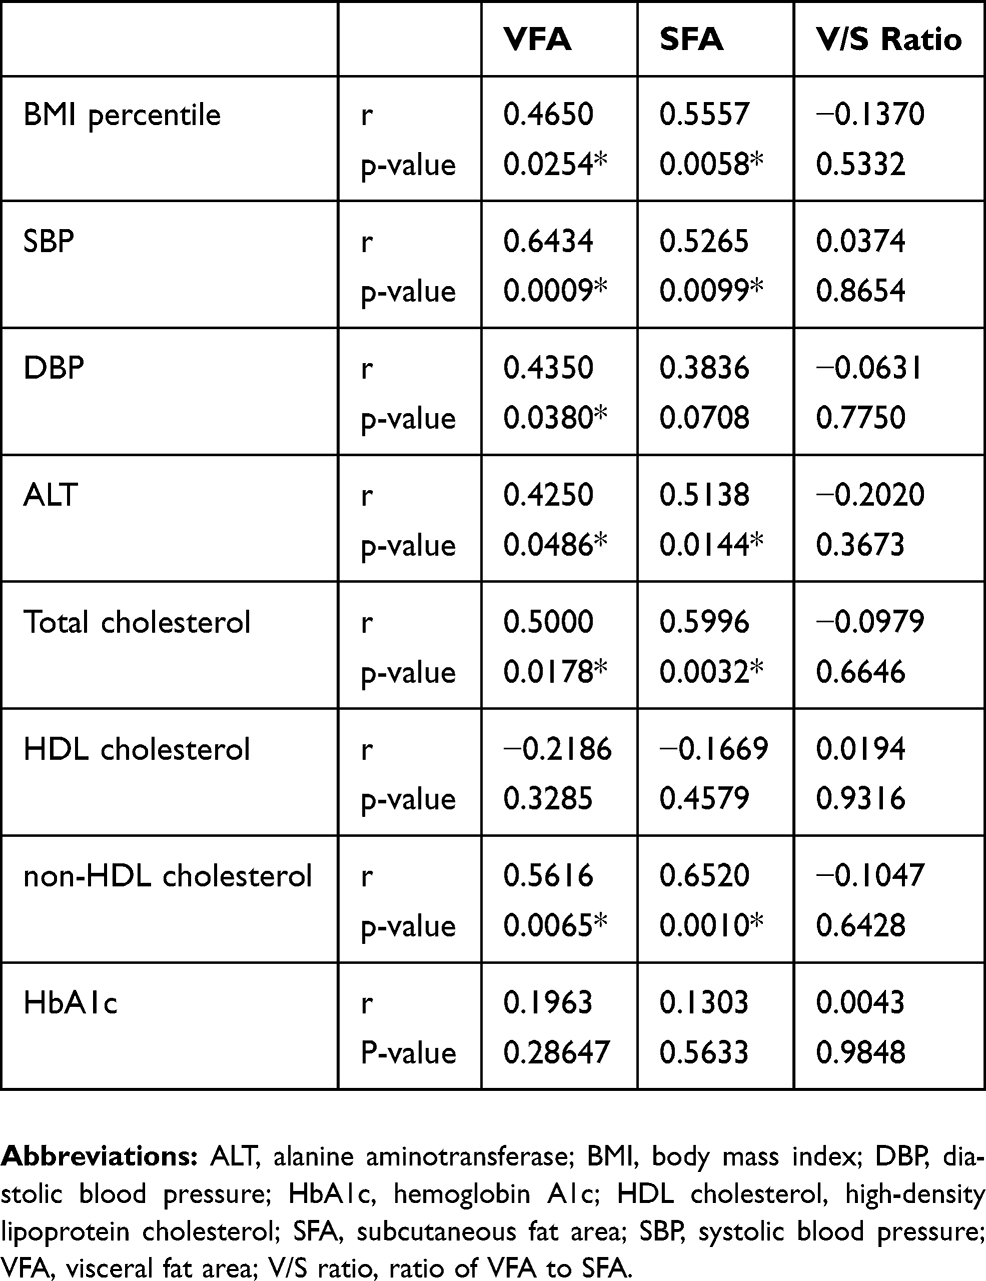 |
Table 3 Correlations Between Each Of The Visceral Fat Area, Subcutaneous Fat Area, And The Ratio Of The Visceral-To-Subcutaneous Fat Areas With Metabolic Parameters In Japanese Adolescents With Type 2 Diabetes Mellitus |
Discussion
The genetic background and recent lifestyle changes have likely contributed to a childhood incidence rate of obesity and type 2 diabetes mellitus.22 Obesity increases the risk of cardiovascular disease and death23 and it is well known that the VFA and V/S ratio are useful for predicting atherosclerosis and cardiovascular disease.6,13 However, the roles of the VFA, SFA, and V/S ratio in children with diabetes mellitus have remained unclear.
In the present study, even with no significant difference in BMI percentile between the 2 groups, the VFA and V/S ratio in subjects of the DM group were higher than those in subjects of the SO group. The V/S ratio and VFA were found to be correlated with HbA1c levels in our cohort of adolescents. Accumulation of visceral fat is associated with the development of diabetes as a result of decreased adiponectin secretion from adipocytes.24–26 VFA has reported to have a stronger correlation with insulin resistance than SFA in adults.7 The V/S ratio and VFA have also been shown to be associated with HbA1c in adult patients with type 2 diabetes mellitus.11 Type 2 diabetes mellitus in youths closely resembles its pathophysiology in adults, ie, insulin resistance and nonautoimmune β-cell failure.27 More recently, it has been reported that type 2 diabetes mellitus in youth declines the β-cell function rapidly and is more resistant to treatment than that in adults.28 On the other hand, the SFA in the former was lower than that in the latter. Some non-obese Japanese children with type 2 diabetes mellitus have a large amount of visceral fat, even though their body weights and SFAs appear normal for their age and sex, while their V/S ratios are high.3
The mechanisms governing body fat distribution and adipose tissue function are not completely clear. Goossens29 reported that body fat distribution and an impaired adipose tissue function, rather than total fat mass, are better predictors of insulin resistance. Metabolically healthy obese persons have better adipose tissue function and are more insulin-sensitive than those who are obese and metabolically unhealthy. On the other hand, metabolically unhealthy obese individuals have lower subcutaneous fat mass and increased inflammation in visceral adipose tissue, which contribute to the development of insulin resistance. Our current findings indicate that adolescents who are metabolically unhealthy and obese (including those with type 2 diabetes mellitus) have impaired adipose tissue expandability and therefore a lower SFA and higher VFA. Furthermore, birth weight is also related to insulin resistance, as subjects with both low and high birth weights are at a higher risk of developing type 2 diabetes mellitus than normal-birth weight children (showing a U-shaped curve).30 In our study, subjects with particularly high V/S ratios had either low or high birth weights; this may be attributable to the V/S ratio being high in these patients.
Another finding in our study was that the VFA and SFA were correlated with SBP, ALT, total cholesterol, HDL cholesterol, and non-HDL cholesterol in subjects with type 2 diabetes mellitus. Notably, type 2 diabetes mellitus is associated with non-alcoholic fatty liver disease31 and all 12 of the 23 subjects in our study’s DM group who underwent abdominal echocardiography were found to have fatty livers (which may also be indicated by high ALT levels). A previous study showed that overweight adults with high VFAs had higher total and LDL cholesterol levels, as well as lower HDL cholesterol levels, than those with low visceral fat.32 In the present study, adolescents with type 2 diabetes mellitus who had high VFA and SFA exhibited elevated systolic BP, ALT, total cholesterol, and non-HDL cholesterol. However, the V/S ratio was not correlated with any metabolic parameters. Increase in VFA and SFA might associate with metabolic parameters in Japanese adolescents with type 2 diabetes.
There were some limitations in this study. First, the number of enrolled subjects was relatively small. Second, because the subjects were not fasting state at the time of venous blood sampling, we evaluated the non-HDL cholesterol levels in serum, not serum LDL cholesterol and triglyceride levels. Finally, the factors of puberty, such as Tanner stage, were not evaluated; however, our findings still ought to be valuable given the paucity of investigations of abdominal fat distribution as assessed by abdominal CT scans in adolescents.
Conclusion
Adolescents with type 2 diabetes mellitus might have different distributions of abdominal fat than those with simple obesity, even though there was no difference in BMI percentile. Both the VFA and SFA, but not the V/S ratio, were positively correlated with metabolic parameters in adolescents with type 2 diabetes mellitus.
Acknowledgment
This study was supported by grants-in-aid from Kao corporation and Kawano Masanori Memorial Public Interest Incorporated Foundation for Promotion of Pediatrics.
Disclosure
The authors report no conflicts of interest in this work.
References
1. Asayama K, Ozeki T, Sugihara S, et al. Criteria for medical intervention in obese children: a new definition of ‘obesity disease’ in Japanese children. Pediatr Int. 2003;45:642–646. doi:10.1046/j.1442-200X.2003.01795.x
2. Zeitler P, Arslanian S, Fu J, et al. ISPAD clinical practice consensus guidelines 2018: type 2 diabetes mellitus in youth. Pediatr Diabetes. 2018;19(Suppl 27):28–46. doi:10.1111/pedi.2018.19.issue-S27
3. Urakami T. Clinical characteristics in Japanese children with nonobese type 2 diabetes. Ann Pediatr Endocrinol Metab. 2018;23:113–118. doi:10.6065/apem.2018.23.3.113
4. Yoon KH, Lee JH, Kim JW, et al. Epidemic obesity and type 2 diabetes in Asia. Lancet. 2006;368:1681–1688. doi:10.1016/S0140-6736(06)69703-1
5. Groop L. Genetics of the metabolic syndrome. Br J Nutr. 2000;83(Suppl 1):S39–S48. doi:10.1017/S0007114500000945
6. Fox CS, Massaro JM, Hoffmann U, et al. Abdominal visceral and subcutaneous adipose tissue compartments: association with metabolic risk factors in the Framingham Heart Study. Circulation. 2007;116:39–48. doi:10.1161/CIRCULATIONAHA.106.675355
7. Preis SR, Massaro JM, Robins SJ, et al. Abdominal subcutaneous and visceral adipose tissue and insulin resistance in the Framingham heart study. Obesity (Silver Spring). 2010;18:2191–2198. doi:10.1038/oby.2010.59
8. Sahakyan KR, Somers VK, Rodriguez-Escudero JP, et al. Normal-weight central obesity: implications for total and cardiovascular mortality. Ann Intern Med. 2015;163:827–835. doi:10.7326/M14-2525
9. Porter SA, Massaro JM, Hoffmann U, et al. Abdominal subcutaneous adipose tissue: a protective fat depot? Diabetes Care. 2009;32:1068–1075. doi:10.2337/dc08-2280
10. Wagenknecht LE, Langefeld CD, Scherzinger AL, et al. Insulin sensitivity, insulin secretion, and abdominal fat: the Insulin Resistance Atherosclerosis Study (IRAS) Family Study. Diabetes. 2003;52:2490–2496. doi:10.2337/diabetes.52.10.2490
11. Fukuda T, Bouchi R, Takeuchi T, et al. Ratio of visceral-to-subcutaneous fat area predicts cardiovascular events in patients with type 2 diabetes. J Diabetes Investig. 2018;9:396–402. doi:10.1111/jdi.2018.9.issue-2
12. Katsuyama H, Kawaguchi A, Yanai H. Not visceral fat area but the ratio of visceral to subcutaneous fat area is significantly correlated with the marker for atherosclerosis in obese subjects. Int J Cardiol. 2015;179:112–113. doi:10.1016/j.ijcard.2014.10.112
13. Higuchi S, Kabeya Y, Kato K. Visceral-to-subcutaneous fat ratio is independently related to small and large cerebrovascular lesions even in healthy subjects. Atherosclerosis. 2017;259:41–45. doi:10.1016/j.atherosclerosis.2017.03.001
14. Kato N, Takimoto H, Sudo N. The cubic functions for spline smoothed L, S and M values for BMI reference data of Japanese children. Clin Pediatr Endocrinol. 2011;20:47–49. doi:10.1297/cpe.20.47
15. Barlow SE, Expert Committee. Expert committee recommendations regarding the prevention, assessment, and treatment of child and adolescent overweight and obesity: summary report. Pediatrics. 2007;120(Suppl 4):S164–S192. doi:10.1542/peds.2007-2329C
16. Urakami T. Pediatric type 2 diabetes in Japan: similarities and differences from type 2 diabetes in other pediatric populations. Curr Diab Rep. 2018;18:29. doi:10.1007/s11892-018-0999-z
17. Urakami T, Kubota S, Nitadori Y, et al. Annual incidence and clinical characteristics of type 2 diabetes in children as detected by urine glucose screening in the Tokyo metropolitan area. Diabetes Care. 2005;28:1876–1881. doi:10.2337/diacare.28.8.1876
18. American Diabetes Association. 2. Classification and diagnosis of diabetes: standards of medical care in diabetes-2018. Diabetes Care. 2018;41(Suppl 1):S13–S27. doi:10.2337/dc18-S002
19. Wajchenberg BL. Subcutaneous and visceral adipose tissue: their relation to the metabolic syndrome. Endocr Rev. 2000;21:697–738. doi:10.1210/edrv.21.6.0415
20. Maurovich-Horvat P, Massaro J, Fox CS, et al. Comparison of anthropometric, area- and volume-based assessment of abdominal subcutaneous and visceral adipose tissue volumes using multi-detector computed tomography. Int J Obes (Lond). 2007;31:500–506. doi:10.1038/sj.ijo.0803454
21. Tsukiyama H, Nagai Y, Matsubara F, et al. Proposed cut-off values of the waist circumference for metabolic syndrome based on visceral fat volume in a Japanese population. J Diabetes Investig. 2016;7:587–593. doi:10.1111/jdi.2016.7.issue-4
22. Urakami T, Miyata M, Yoshida K, et al. Changes in annual incidence of school children with type 2 diabetes in the Tokyo metropolitan area during 1975-2015. Pediatr Diabetes. 2018;19:1385–1392. doi:10.1111/pedi.2018.19.issue-8
23. Van Gaal LF, Mertens IL, De Block CE. Mechanisms linking obesity with cardiovascular disease. Nature. 2006;444:875–880. doi:10.1038/nature05487
24. Matsuzawa Y, Funahashi T, Kihara S, et al. Adiponectin and metabolic syndrome. Arterioscler Thromb Vasc Biol. 2004;24:29–33. doi:10.1161/01.ATV.0000099786.99623.EF
25. Han SJ, Boyko EJ, Fujimoto WY, et al. Low plasma adiponectin concentrations predict increases in visceral adiposity and insulin resistance. J Clin Endocrinol Metab. 2017;102:4626–4633. doi:10.1210/jc.2017-01703
26. Lindsay RS, Funahashi T, Hanson RL, et al. Adiponectin and development of type 2 diabetes in the Pima Indian population. Lancet. 2002;360:57–58. doi:10.1016/S0140-6736(02)09335-2
27. Nadeau KJ, Anderson BJ, Berg EG, et al. Youth-onset type 2 diabetes consensus report: current status, challenges, and priorities. Diabetes Care. 2016;39:1635–1642. doi:10.2337/dc16-1066
28. RISE Consortium. Effects of treatment of impaired glucose tolerance or recently diagnosed type 2 diabetes with metformin alone or in combination with insulin glargine on β-cell function: comparison of responses in youth and adults. Diabetes. 2019;68:1670–1680. doi:10.2337/db19-0299
29. Goossens GH. The metabolic phenotype in obesity: fat mass, body fat distribution, and adipose tissue function. Obes Facts. 2017;10:207–215. doi:10.1159/000471488
30. Harder T, Rodekamp E, Schellong K, et al. Birth weight and subsequent risk of type 2 diabetes: a meta-analysis. Am J Epidemiol. 2007;165:849–857. doi:10.1093/aje/kwk071
31. Firneisz G. Non-alcoholic fatty liver disease and type 2 diabetes mellitus: the liver disease of our age? World J Gastroenterol. 2014;20:9072–9089. doi:10.3748/wjg.v20.i27.9072
32. Baek SH, Kim M, Kim M, et al. Metabolites distinguishing visceral fat obesity and atherogenic traits in individuals with overweight. Obesity (Silver Spring). 2017;25:323–331. doi:10.1002/oby.21724
 © 2019 The Author(s). This work is published and licensed by Dove Medical Press Limited. The full terms of this license are available at https://www.dovepress.com/terms.php and incorporate the Creative Commons Attribution - Non Commercial (unported, v3.0) License.
By accessing the work you hereby accept the Terms. Non-commercial uses of the work are permitted without any further permission from Dove Medical Press Limited, provided the work is properly attributed. For permission for commercial use of this work, please see paragraphs 4.2 and 5 of our Terms.
© 2019 The Author(s). This work is published and licensed by Dove Medical Press Limited. The full terms of this license are available at https://www.dovepress.com/terms.php and incorporate the Creative Commons Attribution - Non Commercial (unported, v3.0) License.
By accessing the work you hereby accept the Terms. Non-commercial uses of the work are permitted without any further permission from Dove Medical Press Limited, provided the work is properly attributed. For permission for commercial use of this work, please see paragraphs 4.2 and 5 of our Terms.