")
Back to Archived Journals » Reports in Medical Imaging » Volume 10
The challenges in differentiating tuberculous from pyogenic spondylitis using magnetic resonance imaging
Authors Yueniwati Y , Christina E
Received 6 December 2016
Accepted for publication 1 June 2017
Published 30 June 2017 Volume 2017:10 Pages 37—43
DOI https://doi.org/10.2147/RMI.S129533
Checked for plagiarism Yes
Review by Single anonymous peer review
Peer reviewer comments 3
Editor who approved publication: Professor Tarik Massoud
Yuyun Yueniwati, Evelyn Christina
Radiology Department, Faculty of Medicine, Brawijaya University, Malang, Indonesia
Purpose: To analyze the diagnostic value of MRI for distinguishing tuberculous from pyogenic spondylitis confirmed by histology results and to determine the cut-off point score of MRI.
Subjects and methods: Observational analytic design with a cross-sectional approach. Data were collected from radiology and pathology anatomy medical records, therefore no informed consent was obtained. We utilized diagnostic tests using 2×2 tables and receiver operating characteristic curve to obtain the value of the sensitivity, specificity, accuracy, and area under curve (AUC) of MRI. Twenty-eight samples were selected, consisting of 20 samples of tuberculous spondylitis and 8 samples of pyogenic spondylitis.
Results: The radiological diagnosis using MRI had a sensitivity of 85%, specificity of 87.5%, positive predictive value of 94.4%, negative predictive value of 70%, and accuracy of 85.7%. AUC value was 91.6%, p = 0.001. MRI with a score ≥4 had sensitivity of 90%, specificity of 87.5%, positive predictive value of 94.7%, negative predictive value of 77.8%, and accuracy of 89.2%.
Conclusion: MRI had a high diagnostic value with AUC value of 91.6% for distinguishing tuberculous from pyogenic spondylitis, confirmed by histology results. MRI, with a score of ≥4, had a higher diagnostic value compared with the reading of MRI without using scores.
Keywords: histology, MRI, pyogenic spondylitis, tuberculous spondylitis
Introduction
MRI of the spine is the best imaging technology to assess anatomical abnormalities of the spine and surrounding structures, determine the level of spinal damage, and follow-up a disease. MRI can give us a better chance to see a change in medullary bones. MRI is also expected to show early disc abnormalities and changes in bone marrow (a component of fat and water) in the case of infection.1,2
Infections of the spine (spondylitis) is defined as an infection by a specific organism which involves one or more components of the spine, including vertebrae, intervertebral discs, paraspinal soft tissue, and epidural cavity. According to Colmenero et al and Moore and Rafii, the most frequent spinal infection is tuberculous and pyogenic spondylitis.3,4 The only early symptom of spondylitis is non-specific back pain, which makes it difficult to diagnose early. Radiological examination has an important role in the early diagnosis, especially using plain radiography and MRI.5 A previous study states that a 1.5 Tesla MRI had a sensitivity of 96% and a specificity of 94% in the diagnosis of spondylitis.6
Tuberculous spondylitis is common in developing countries. It is noted that tuberculous spondylitis occurs in 1% of all tuberculous infection patients, and 25%–60% of bone and joint infections are caused by tuberculosis.6–9 Research conducted by Lee stated that pyogenic spondylitis is a rare disease with a prevalence of ~0.15%–3% in osteomyelitis cases.9 Tuberculous spondylitis requires completely different therapy from with non-tuberculous spondylitis, so it is important to distinguish between the two types of spondylitis. The right management of spondylitis can reduce disability and damage to organ function, but it is often difficult to differentiate these abnormalities, both clinically and radiologically. Gold standard examination for differentiating tuberculous and pyogenic spondylitis is histology, which is invasive.
Based on this background, we conducted a study on the diagnostic value of MRI to differentiate tuberculous and pyogenic spondylitis with gold standard histology results. This study is a diagnostic test, a test to analyze the sensitivity, specificity, accuracy, and area under curve (AUC) of MRI to distinguish the two types of spondylitis compared with histology. It is expected that through this research a spondylitis diagnosis can be established accurately, therapy can be given quickly and accurately so as to reduce morbidity, mortality, and sequelae which may occur in the future.
Materials and methods
This research is an analytic observational study with cross-sectional approach. The study was conducted at the Radiology and Pathology Anatomy Department of Dr. Saiful Anwar General Hospital Malang from April to October 2015. The data in this study were obtained retrospectively for 6 years during the period 2008–2013. Patient consent to review their medical records was waived because this is a retrospective study using de-identified data and records. The ethical clearance number 400/44/K.3/302/2016 was issued by the research ethics committee of Dr. Saiful Anwar General Hospital on April 2016.
We used MRI Magnum 1,0 Tesla and images were viewed on an 18-inch computer monitor. Histology results were interpreted by a pathologist using an Olympus CX-21-type microscope.
The inclusion criteria were: spinal MRI using Magnum with T1 weighted image (WI) (TR: 400; TE: 12), T2WI (TR: 3200; TE: 110), T1WI post-contrast (TR: 400; TE: 12) sequence diagnosing tuberculous and pyogenic spondylitis in 2008–2013 confirmed by histology. Exclusion criterion was patients with previous spinal abnormalities (congenital abnormalities, tumors, severe scoliosis) because this condition can obscure the MRI results.
Data analysis was conducted by the researcher who was assisted by three radiologists (experience in the field of radiology of at least 5 years) as the readers of MRI result without knowing the patient’s histological results, and three pathologists (experience in the field of pathology of least 5 years) who read the patient’s histological results without knowing the results of the MRI. One point was given if we found any abnormal signal in the vertebral body and paravertebral soft tissue with clear margins, paravertebral abscess with regular and thin walls, involvement of ≥3 vertebral bodies, spreading abscess through the anterior and posterior sub-ligament, if the location of the lesion was on thoracic and lumbar spine, normal intervertebral disc, and absence of contrast enhancement on the soft tissues around the facet joint. Zero points were given if we found abnormal signal in the vertebral body and paravertebral soft tissue with unclear margins, paravertebral abscess with irregular and thick walls, involvement of ≤2 vertebral bodies, if the location of the lesion was on lumbar and cervical spine, abnormal enhancement on intervertebral disc and soft tissues around the facet joint. The final diagnosis would be made by the researcher based on at least two of the three results of MRI and pathology.
Diagnostic tests were conducted using 2×2 tables and receiver operating characteristic (ROC) curve to obtain the value of the sensitivity, specificity, accuracy, and AUC of MRI examination to differentiate tuberculous and pyogenic spondylitis with gold standard histology results.
Results
Data collection was conducted retrospectively and it comprised 28 samples which met inclusion and exclusion criteria. The samples consisted of 13 men and 15 women with a minimum age of 3 years, maximum age of 65 years. Twenty-seven patients were Javanese and one patient was Madurese.
The signal abnormality of enhanced MRI in the vertebral body and surrounding soft tissue was different between tuberculous and pyogenic spondylitis. This study found 14 patients with tuberculous spondylitis who had an enhanced signal with clear margin and six patients with unclear margin. Meanwhile, pyogenic spondylitis provided an enhanced signal with clear margin in one patient and unclear margin in seven patients (Figure 1).
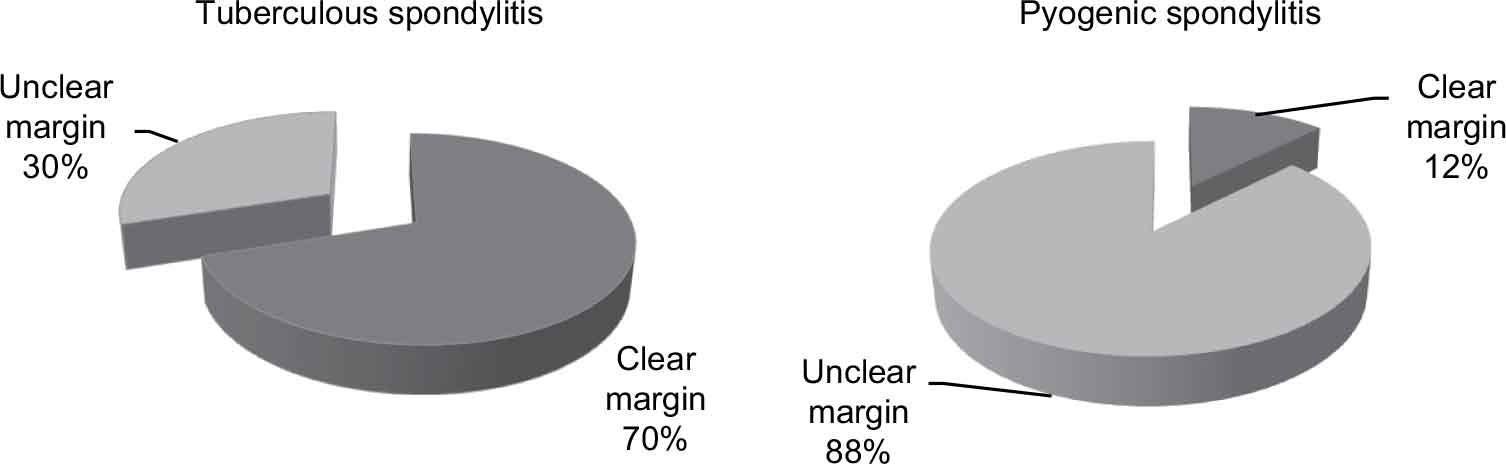 | Figure 1 Sample distribution based on signal abnormality of enhanced MRI. |
Paravertebral abscess enhancement was divided into two types, the first was regular and thin walls and the second was irregular and thick walls. Most of the patients (16) with tuberculous spondylitis showed regular and thin wall paravertebral abscesses, while pyogenic spondylitis showed irregular and thick wall paravertebral abscesses in seven patients (Figure 2).
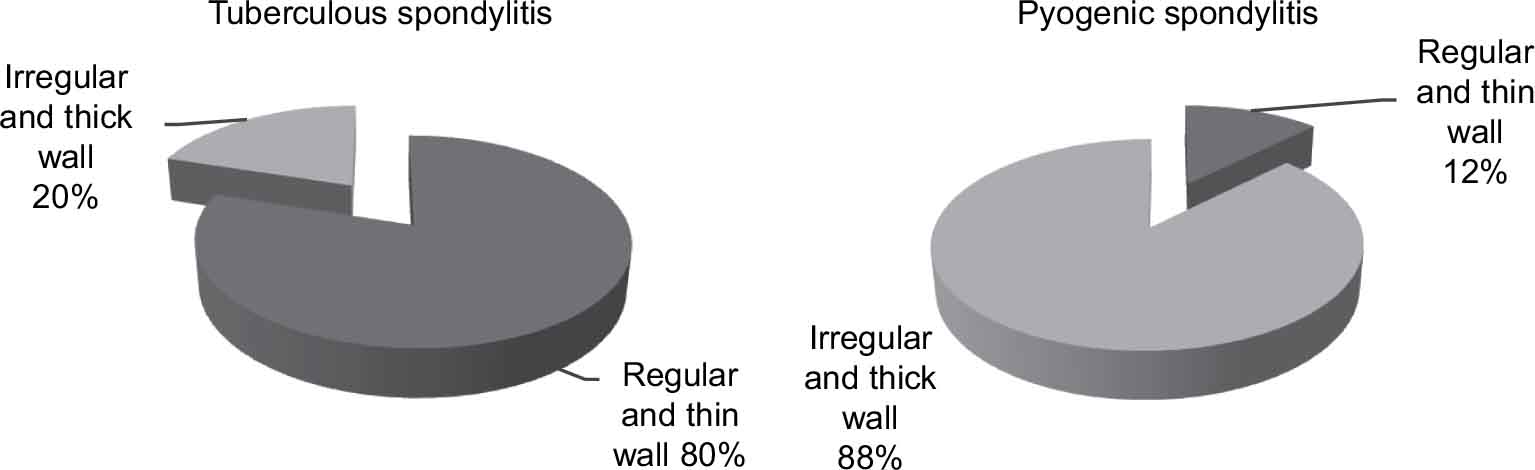 | Figure 2 Sample distribution based on contrast enhancement in paravertebral abscess. |
A total of 16 patients with tuberculous spondylitis indicated the involvement of ≥3 vertebral bodies, whereas five patients with pyogenic spondylitis showed involvement of ≤2 vertebral bodies (Figure 3).
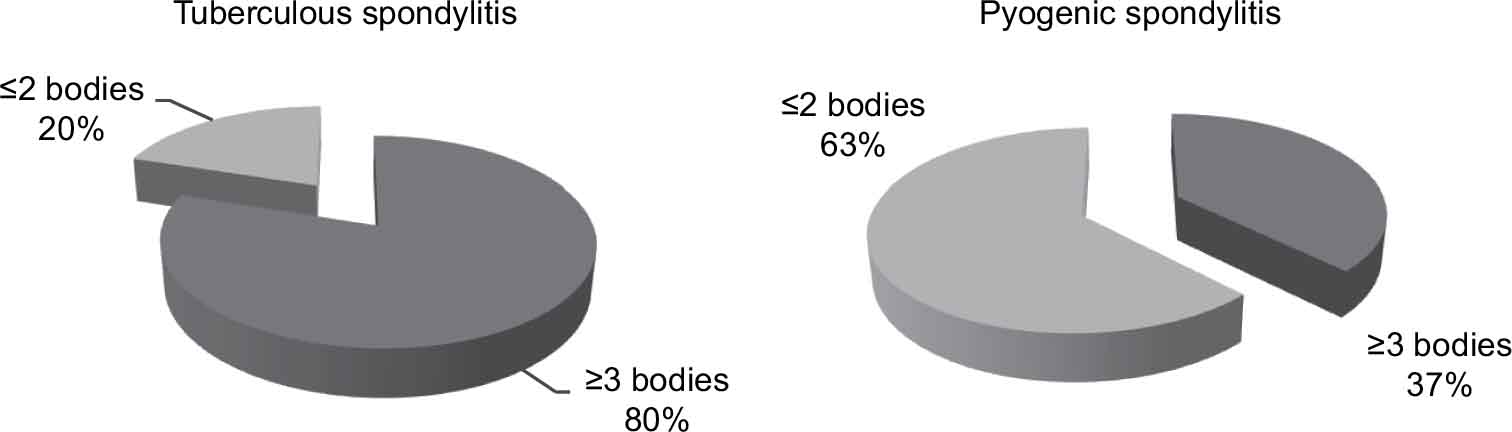 | Figure 3 Sample distribution based on involvement of the vertebral body. |
The spreading of the abscess through the anterior and posterior sub-ligament occurred in all cases, patients with tuberculous spondylitis and eight patients with pyogenic spondylitis. The most common location of tuberculous spondylitis is thoracolumbar spine (eight patients) followed by thoracic spine (seven patients), lumbar spine (three patients), and cervical spine (two patients), while pyogenic spondylitis mostly occurred in thoracic (six patients) and cervical vertebrae (two patients) (Figure 4).
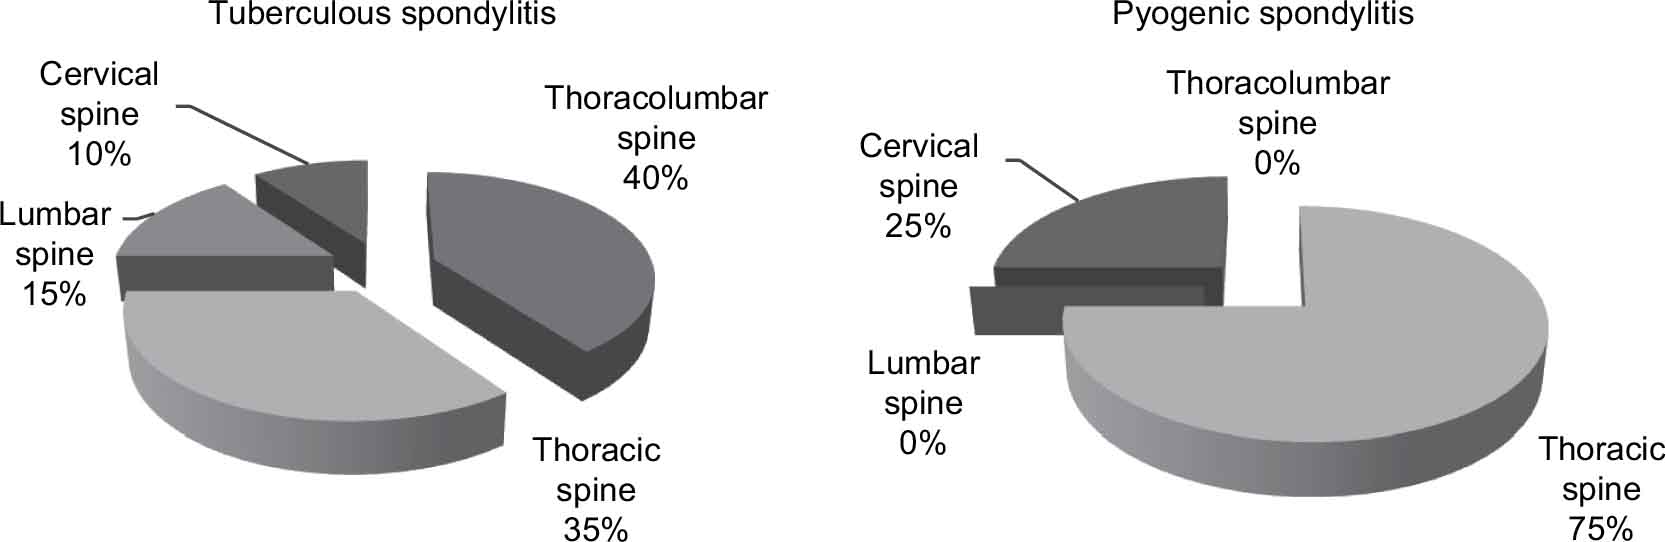 | Figure 4 Sample distribution based on location in the spine. |
Overall patients with pyogenic spondylitis showed an abnormal contrast enhancement on the intervertebral discs, as many as eight patients. In contrast, 15 patients with tuberculous spondylitis did not show an abnormal contrast enhancement on it (Figure 5).
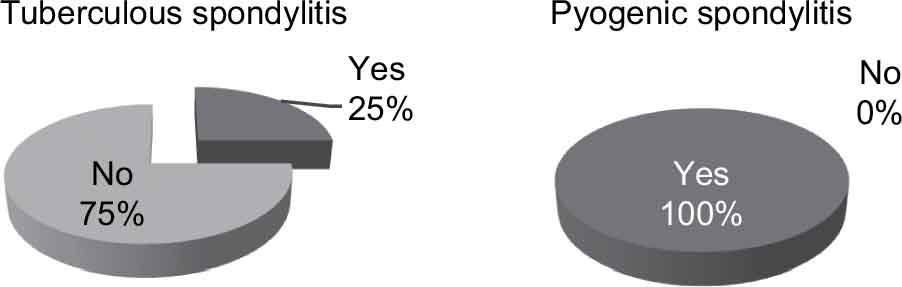 | Figure 5 Sample distribution based on abnormal enhancement of the intervertebral discs. |
Abnormal soft tissue contrast enhancement around the facet joints are more common in pyogenic spondylitis (five patients) compared with tuberculous spondylitis (three patients) (Figure 6).
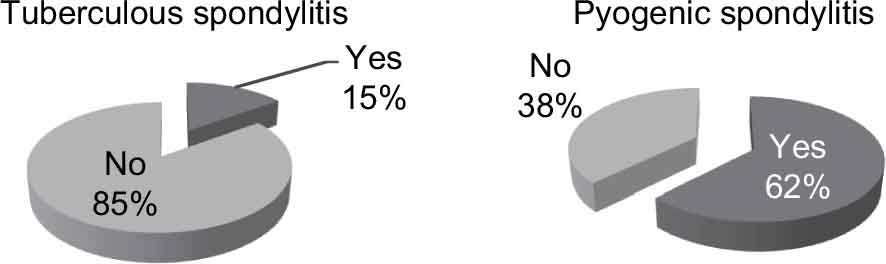 | Figure 6 Sample distribution based on contrast enhancement of the soft tissues around the facet joint. |
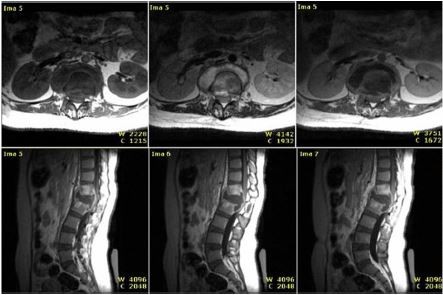
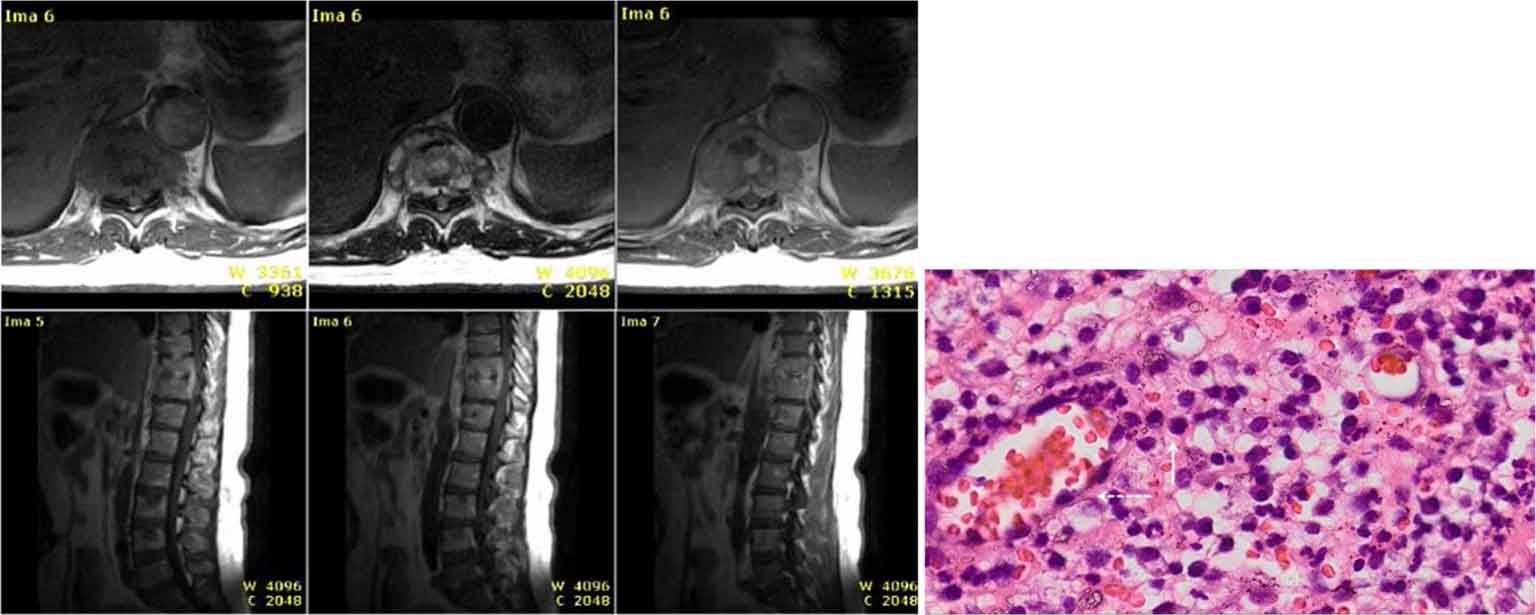
There were some samples with MRI and histopathology result of tuberculous spondylitis (Figure 7) and samples with MRI and histopathology result of pyogenic spondylitis (Figure 8). Based on MRI, tuberculous spondylitis was characterized as abnormal signal in the vertebral body and paravertebral soft tissue with clear margin, paravertebral abscess with regular and thin walls, involvement of ≥3 vertebral bodies, spreading abscess through the anterior and posterior sub-ligament, location of the lesion on thoracic and lumbar spine, normal intervertebral disc, and the absence of contrast enhancement on the soft tissues around the facet joint. Other than tuberculous spondylitis, pyogenic spondylitis was characterized as abnormal signal in the vertebral body and paravertebral soft tissue with unclear margin, paravertebral abscess with irregular and thick walls, involvement of ≤2 vertebral bodies, location of the lesion on lumbar and cervical spine, abnormal enhancement on intervertebral disc and soft tissues around the facet joint.
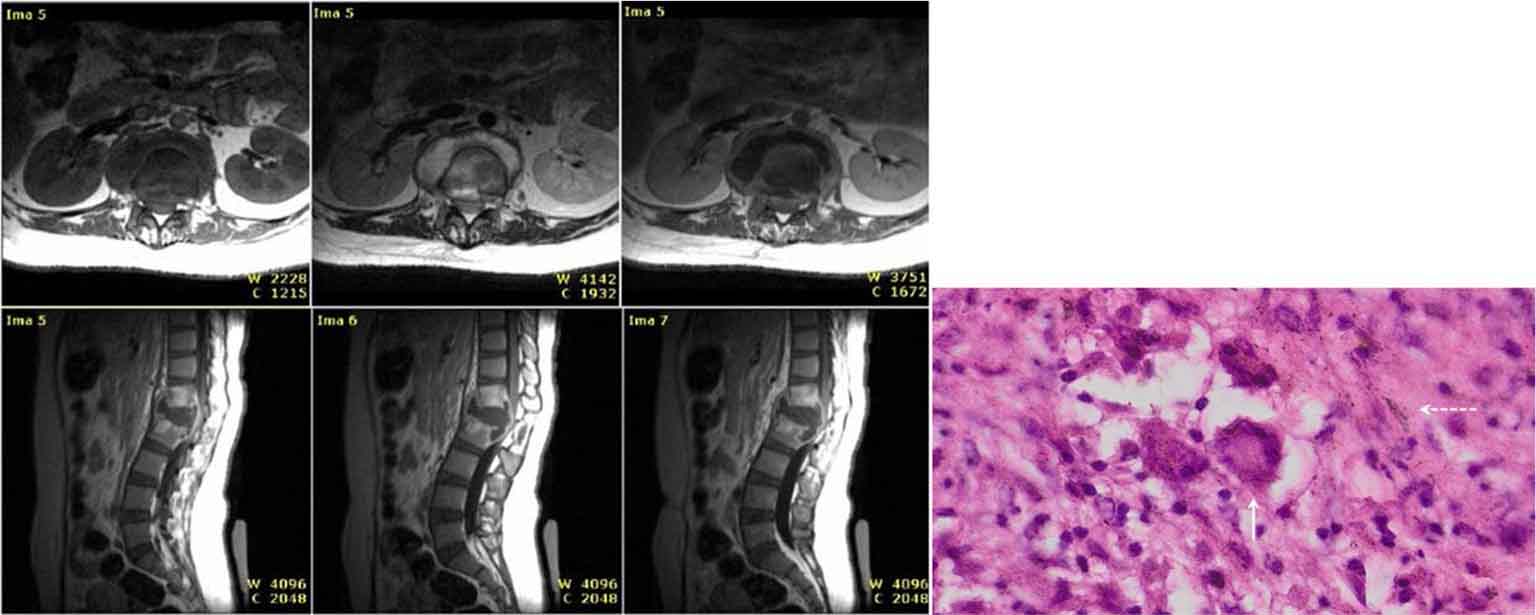 | Figure 7 Tuberculous spondylitis, MRI and histology results. Notes: H and E staining (400×). Langhans giant cells (solid white arrow) and epithelioid cells (white dash arrow). |
 | Figure 8 Pyogenic spondylitis, MRI and histology results. Notes: H and E staining (400×). PMN and MN cells (solid white arrow), capillary cell (white dash arrow). |
Analysis
MRI has a high diagnostic value with a sensitivity of 85%, specificity of 87.5%, positive predictive value of 94.4%, negative predictive value of 70%, and an accuracy of 85.7%, with AUC value of 91.6% (p = 0.001) (Figure 9) for differentiating tuberculous and pyogenic spondylitis with gold standard histology results.
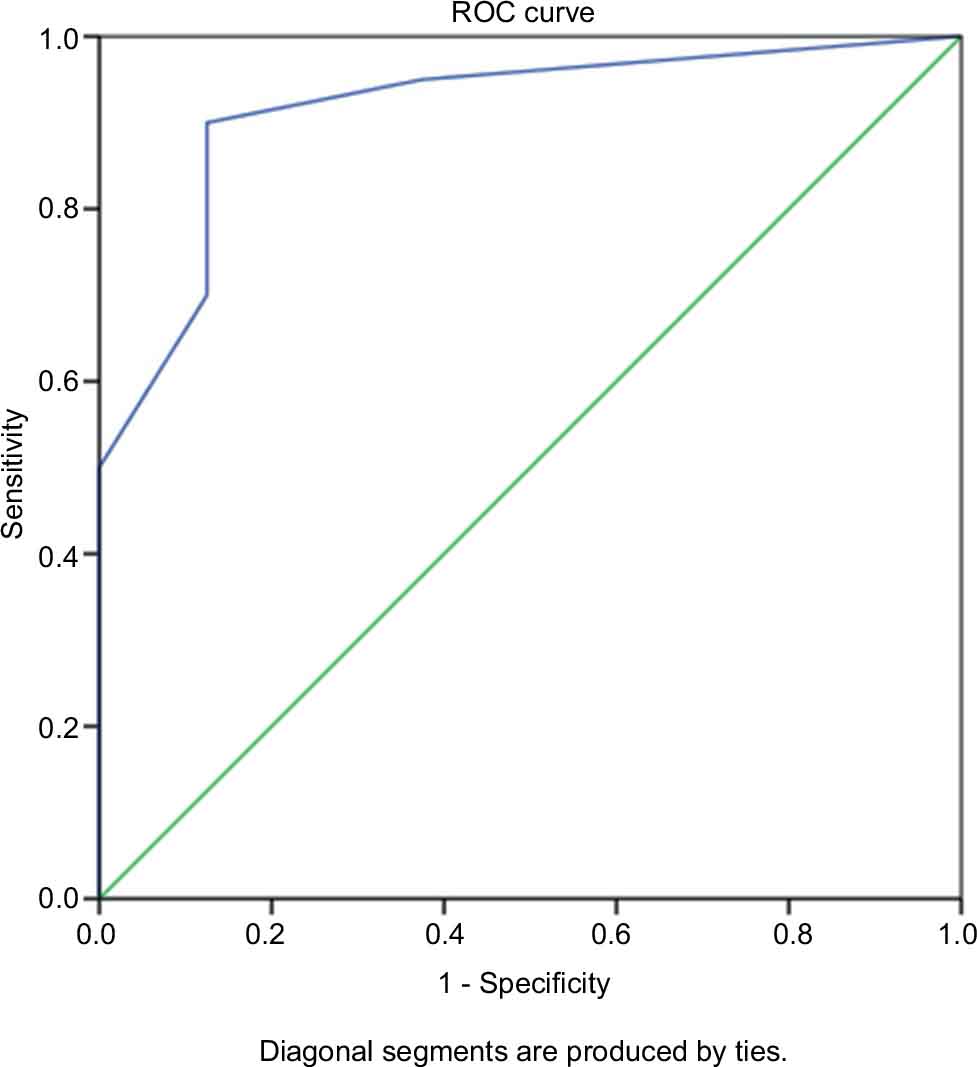 | Figure 9 ROC curve. Abbreviation: ROC, receiver operating characteristic. |
Cut-off point of sensitivity and specificity curve of ROC was shown in Figure 10. MRI with a score ≥4 has a sensitivity value of 90%, specificity of 87.5%, positive predictive value of 94.7%, negative predictive value of 77.8%, and an accuracy of 89.2%. Values above are higher than the reading of the MRI without using scores, so the use of a scoring system can make the reading of MRI easier and increase the value of the sensitivity, specificity, and accuracy in differentiating tuberculous and pyogenic spondylitis.
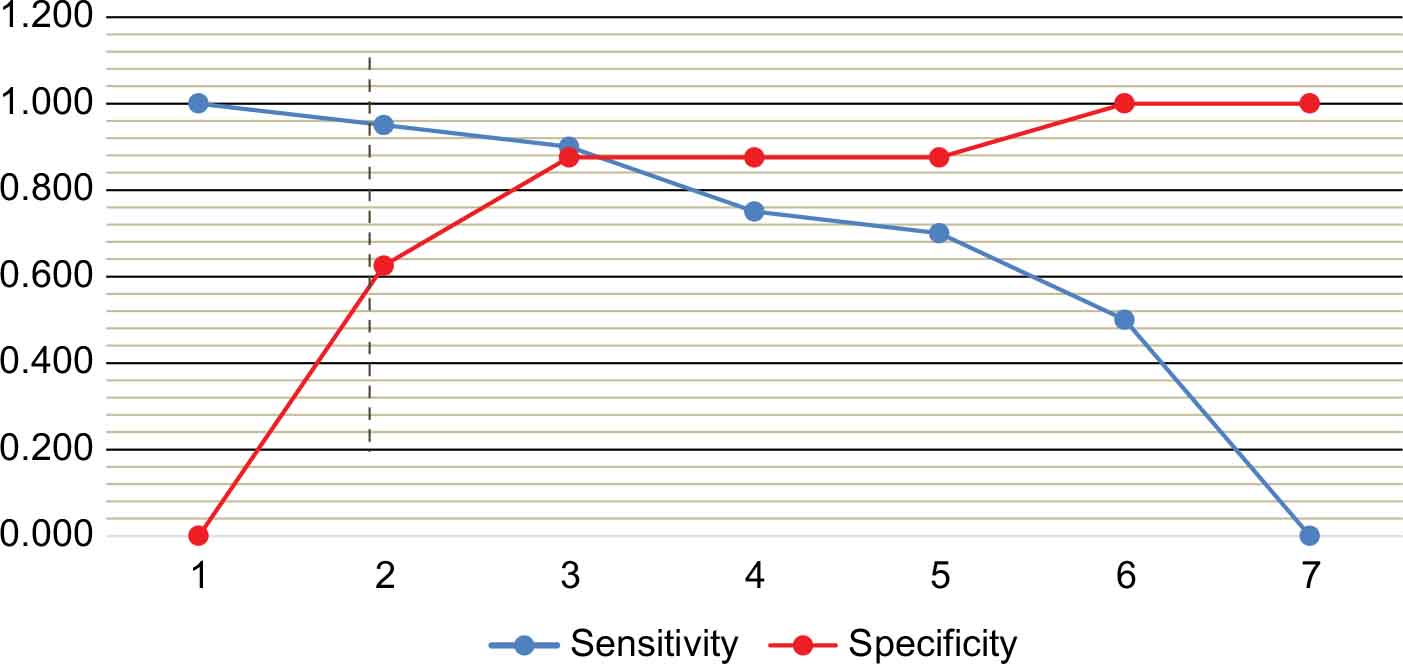 | Figure 10 Cut-off point of sensitivity and specificity curve of ROC. Abbreviation: ROC, receiver operating characteristic. |
Discussion
Based on the location, tuberculous spondylitis occurs more often in the thoracolumbar vertebrae (40%), thoracic vertebrae (35%), lumbar vertebrae (15%), and the cervical vertebrae (10%). According to Garg and Somvanshi, tuberculous and pyogenic spondylitis can occur at all levels of vertebrae.8 The data of previous studies by Hidalgo and Lee state that the most common location of tuberculous spondylitis is thoracic vertebrae, followed by lumbar vertebrae and thoracolumbalis.9,10 Previous research by Yee et al and Cheung and Luk state that the most common location of pyogenic spondylitis is lumbar vertebrae, followed by thoracic vertebrae and cervical vertebrae.11–13 The data from research showed that the most common locations of pyogenic spondylitis are thoracic (75%) and cervical (25%). Until now, the exact pathogenesis explaining the involvement of the vertebral level has not been established.
The abnormalities of MRI signal post-contrast in the vertebral corpus and surrounding soft tissue differ between tuberculous and pyogenic spondylitis. In this study, 14 patients (70%) with tuberculous spondylitis showed post-contrast signal abnormalities with firm boundaries and six patients (30%) showed indistinct boundaries. Meanwhile, pyogenic spondylitis showed post-contrast signal abnormalities with firm boundaries in one patient (12.5%) and seven patients (87.5%) showed indistinct boundaries. Hyaluronidase, a proteolytic enzyme which is predominantly found in bacterial infections, causes lysis and destruction of parts of the vertebrae worse than infection by Mycobacterium tuberculosis.4
Contrast enhancement of a paravertebral abscess is divided into enhancement in the regular thin walls and irregular thick walls. Tuberculous spondylitis gives an overview in the form of enhancement in abscess with thin walls, regularly in as many as 16 patients (80%), and abscess with thick walls, irregularly for four patients (20%). Pyogenic spondylitis gives an overview in the form of enhancement in abscess with thin walls, regularly for one patient (12.5%) and the thick walls, irregularly for seven patients (87.5%). This is consistent with a previous study conducted by Harada et al, who states that tuberculous spondylitis can be distinguished from pyogenic spondylitis, by the thickness and irregularities of wall of paravertebral abscesses, as tuberculous spondylitis shows paravertebral abscesses with regular thin walls while pyogenic spondylitis shows paravertebral abscesses with thick, irregular walls.6
A total of 16 patients (80%) with tuberculous spondylitis showed involvement of ≥3 corpus vertebrae and only four patients (20%) showed the involvement of ≤2 corpus vertebrae, on the contrary, as many as five patients (62.5%) with pyogenic spondylitis showed involvement of ≤2 corpus. Infection will spread dominantly through two branched segmental arteries supplying the two nearest corpus vertebrae. The presence of proteolytic enzymes in bacterial infection will cause damage to vertebral discs and other parts of the vertebrae. Such damage causes more severe clinical manifestation than tuberculous spondylitis. Thus, pyogenic spondylitis is often detected earlier, with a fewer number of involved corpus vertebrae than tuberculous spondylitis.6–8,14
Overall patients with pyogenic spondylitis showed a contrast enhancement in intervertebral discs, in eight patients (100%). In contrast, 75% of patients with tuberculous spondylitis did not show enhancement of the intervertebral discs. Lack of proteolytic enzymes in Mycobacterium infection compared with other bacterial infections is the reason for the exclusion of the discs. The narrowing of the intervertebral discs occurs in 70% of tuberculous spondylitis cases and 92.3% of pyogenic spondylitis cases, but it is important to note the narrowing of the discs due to degenerative processes.1,15
This research showed that the value of radiological diagnosis compared with histology as a gold standard had a sensitivity value of 85%, specificity of 87.5%, and accuracy of 85.7%. ROC curve also showed that the MRI score had good diagnostic value because the curve is well above the 50% line and close to 100%. AUC value obtained from the ROC curve was 91.6%, p = 0.001. Hypothesis test conducted by SPSS with p = 0.001 (p<0.05) means that the value of AUC score of MRI differs significantly from the AUC value of 50%. MRI with a cut-off score ≥4 has a sensitivity of 90%, specificity of 87.5%, and accuracy of 89.2%. The comparison of both diagnostic test results show that MRI score cut-off ≥4 has a higher sensitivity and accuracy value compared with the radiological diagnosis without using a scoring system. This illustrates that the MRI score with cut-off ≥4 can ease the radiologists and improves the sensitivity and accuracy value.
Histology result based on biopsy is strongly influenced by the sampling technique. One case (3.57%) was diagnosed by a radiologist as a tuberculous spondylitis but was expressed as pyogenic spondylitis histologically. In the review by pathologists, it is clear that PMN and MN cells were dominant, but there is little distribution of epithelioid cells which may still be granulomatous inflammation with secondary infection. About three cases (10.71%) were expressed as pyogenic spondylitis in radiology but histologically expressed as tuberculous spondylitis, this may occur in the cases of infection with Mycobacterium tuberculosis accompanied by secondary infection. In patients with chronic infection, the decrease in immunity can easily cause secondary infections.
Unfortunately, this research also has some limitation, due to the retrospective study design, the researcher found it difficult to obtain the history of the patient and did not have the T1WI fat-saturated and diffusion weighted image sequence. The diagnostic value of MRI with and without the use of a scoring system may be a little different if T1WI fat-saturated sequence with gadolinium contrast is conducted, since paraspinal soft tissue contains a lot of fat components (epidural fat, the fat around the facet joints, and subcutaneous fat) which look high density on T1WI, T2WI, and T1WI with contrast, and can obscure contrast enhancement, especially in sequence T1WI post-contrast.
Conclusion
MRI has a high diagnostic value with AUC value of 91.6% (p = 0.001) for differentiating tuberculous and pyogenic spondylitis with gold standard histology results.
MRI with a score of ≥4 has a sensitivity of 0.90%, specificity of 87.5%, positive predictive value of 94.7%, negative predictive value of 77.8%, and accuracy of 89.2%. The values above are higher than the reading of the MRI without using a score, so the use of a scoring system can make the reading of MRI easier and increase the value of the sensitivity, specificity, and accuracy in differentiating tuberculous and pyogenic spondylitis.
Acknowledgment
This work was supported by grants from Dr Saiful Anwar Hospital, Malang, Indonesia.
Disclosure
The authors report no conflicts of interest in this work.
References
Hackney DB, Daffner RH, Kransdorf MJ, Mukundan S Jr. ACR–ASNR–SCBT-MR Practice Parameter For The Performance of Magnetic Resonance Imaging (MRI) of The Adult Spine. 2012. Available from: https://workspace.imperial.ac.uk/ref/Public/UoA%2004%20-%20Psychology,%20Psychiatry%20and%20Neuroscience/MRI_Adult_Spine.pdf. Accessed December 6, 2016. | ||
Yueniwati Y, Widhiasi DE. Role of magnetic resonance imaging in differentiating spondylitis from vertebral metastasis. Asian Spine J. 2015;9(5):776–782. | ||
Colmenero JD, Jiménez-Mejías ME, Reguera JM, et al. Tuberculous vertebral osteomyelitis in the new millennium: still a diagnostic and therapeutic challenge. Eur J Clin Microbiol Infect Dis. 2004;23(6):477–483. | ||
Moore SL, Rafii M. Imaging of musculoskeletal and spinal tuberculosis. Radiol Clin North Am. 2001;39(2):329–342. | ||
Haaga JR. CT and MRI of the Whole Body. Philadelphia, PA: Mosby/Elsevier; 2009. | ||
Harada Y, Tokuda O, Matsunaga N. Magnetic resonance imaging characteristics of tuberculous spondylitis vs. pyogenic spondylitis. Clin Imaging. 2008;32(4):303–309. | ||
Khalid M, Siddiqui MA, Qaseem SM, Mittal S, Iraqi AA, Rizvi SA. Role of magnetic resonance imaging in evaluation of tubercular spondylitis: pattern of disease in 100 patients with review of literature. JNMA J Nepal Med Assoc. 2011;51(183):116–121. | ||
Garg RK, Somvanshi DS. Spinal tuberculosis: a review. J Spinal Cord Med. 2011;34(5):440–454. | ||
Lee KY. Comparison of pyogenic spondylitis and tuberculous spondylitis. Asian Spine J. 2014;8(2):216–223. | ||
Hidalgo JA. Pott Disease: Background, Pathophysiology, Epidemiology. Medscape; 2016. Available from: http://emedicine.medscape.com/article/226141-overview. Accessed June 6, 2017. | ||
Clamp JA, Grevitt MP. Spinal infection. Surgery Oxford. 2012;30(7):356–361. | ||
Yee DK, Samartzis D, Wong YW, Luk KD, Cheung KM. Infective spondylitis in Southern Chinese: a descriptive and comparative study of ninety-one cases. Spine (Phila Pa 1976). 2010;35(6):635–641. | ||
Cheung WY, Luk KD. Pyogenic spondylitis. Int Orthop. 2012;36(2):397–404. | ||
Jung NY, Jee WH, Ha KY, Park CK, Byun JY. Discrimination of tuberculous spondylitis from pyogenic spondylitis on MRI. AJR Am J Roentgenol. 2004;182(6):1405–1410. | ||
Pierre-Jerome C, Arslan A, Bekkelund SI. MRI of the spine and spinal cord: imaging techniques, normal anatomy, artifacts, and pitfalls. J Manipulative Physiol Ther. 2000;23(7):470–475. |
 © 2017 The Author(s). This work is published and licensed by Dove Medical Press Limited. The full terms of this license are available at https://www.dovepress.com/terms.php and incorporate the Creative Commons Attribution - Non Commercial (unported, v3.0) License.
By accessing the work you hereby accept the Terms. Non-commercial uses of the work are permitted without any further permission from Dove Medical Press Limited, provided the work is properly attributed. For permission for commercial use of this work, please see paragraphs 4.2 and 5 of our Terms.
© 2017 The Author(s). This work is published and licensed by Dove Medical Press Limited. The full terms of this license are available at https://www.dovepress.com/terms.php and incorporate the Creative Commons Attribution - Non Commercial (unported, v3.0) License.
By accessing the work you hereby accept the Terms. Non-commercial uses of the work are permitted without any further permission from Dove Medical Press Limited, provided the work is properly attributed. For permission for commercial use of this work, please see paragraphs 4.2 and 5 of our Terms.