")
Back to Journals » International Journal of General Medicine » Volume 14
The Causal Relationship Between Body Mass Index and the Risk of Osteoarthritis
Authors He Y, Zheng C, He MH, Huang JR
Received 3 April 2021
Accepted for publication 24 May 2021
Published 2 June 2021 Volume 2021:14 Pages 2227—2237
DOI https://doi.org/10.2147/IJGM.S314180
Checked for plagiarism Yes
Review by Single anonymous peer review
Peer reviewer comments 3
Editor who approved publication: Dr Scott Fraser
Yi He, Cong Zheng, Min-Hui He, Jian-Rong Huang
Emergency Trauma Center, Fifth Affiliated Hospital of Guangzhou Medical University, Guangzhou, 510700, People’s Republic of China
Correspondence: Jian-Rong Huang
Emergency Trauma Center, Fifth Affiliated Hospital of Guangzhou Medical University, 621 Gangwan Road, Huangpu District, Guangzhou, 510700, People’s Republic of China
Email [email protected]
Objective: The study aimed to explore the causal effect of body mass index (BMI) on osteoarthritis.
Methods: The genome-wide association data of BMI and osteoarthritis were obtained via the Mendelian randomization (MR)-base platform. Single nucleotide polymorphisms (SNPs) significantly associated with BMI were identified and used as instrumental variables, and the causal relationship between BMI and osteoarthritis was examined using the two-sample MR research method. Three statistical methods including inverse-variance weighted (IVW) method, weighted median estimator, and MR-Egger regression were employed.
Results: A total of 79 SNPs significantly associated with BMI were identified in the study (P< 5× 10− 8; linkage disequilibrium r2 < 0.1). Consistent association between BMI and osteoarthritis was observed when evaluated by different methods (IVW: odds ratio (OR) 1.028, 95% confidence interval (CI) 1.021– 1.036; weighted median estimator: OR 1.028, 95% CI 1.019– 1.037; MR-Egger regression: OR 1.028, 95% CI 1.009– 1.046), which suggests that BMI is positively associated with increased risk of osteoarthritis. There was no evidence that the observed causal effect between BMI and the risk of osteoarthritis was affected by genetic pleiotropy (MR-Egger intercept 1.3× 10− 5, P=0.959).
Conclusion: The MR analysis provided the strong evidence to indicate that BMI might be causally associated with the risk of osteoarthritis.
Keywords: osteoarthritis, body mass index, Mendelian randomization
Introduction
Osteoarthritis, a common disease of the musculoskeletal system, is an important cause of pain and disability in the elderly.1 Although joint replacement is effective for treating end-stage osteoarthritis, problems such as poor joint function recovery and limited lifetime of artificial joint hinder further improvement in prognosis. Therefore, the management of the disease is shifting to the prevention and early treatment of osteoarthritis.1,2 Overweight and obesity have been identified as risk factors of the occurrence and progression of osteoarthritis,3–5 and relief of symptoms was observed in patients with osteoarthritis who had undergone diet and exercise therapy.5,6 However, a causal effect of overweight or obesity on osteoarthritis cannot be convincingly established with evidence from observational studies, in which there is a lack of randomization of exposure factors and therefore confounding and reverse causality cannot be ruled out in the observed association. Traditional randomized clinical controlled trials are suitable from the viewpoint of methodology, but are not practicable due to ethical concern.
Mendelian randomization (MR) is a method that used genetic variations as instrumental variables of exposure factors to infer the causal relationship between exposure factors and outcomes. Because genetic variations follow the law of Mendelian and are randomly distributed in the population, the influence of confounding factors are largely controlled.7 With the popularity of genome-wide association study (GWAS) studies and GWAS meta-analysis, MR becomes an efficient and practicable method to investigate causal effect.8 The two-sample MR is a method to estimate the causal effect of an exposure on an outcome using only summary statistics from GWAS, in which genetic variation-exposure factor association data and genetic variation-disease outcome association data from two independent samples with similar distribution characteristics were used. In the study, we used the two-sample MR method based on GWAS data to analyze whether there is a causal effect of body mass index (BMI) on the risk of osteoarthritis.
Materials and Methods
Genetic Variants Associated with BMI
Publicly accessible data for genetic variants associated with BMI were obtained from the Genetic Investigation of ANthropometric Traits (GIANT) Consortium.9 The detail of studies and datasets was presented in Table 1. The consortium included 3,339,224 participants and the number of included single nucleotide polymorphism (SNP) was 2,555,511. To minimize the impact caused by linkage disequilibrium (LD), we set the threshold of statistical significance as “P <5×10⁻⁸; LD r2 <0.1” to identify the SNPs associated with BMI. In total, there were 79 SNPs included in this study (rs1000940, rs10132280, rs1016287, rs10182181, rs10733682, rs10840100, rs11030104, rs11057405, rs11165643, rs11672660, rs1167827, rs11727676, rs12286929, rs12429545, rs12448257, rs12940622, rs12986742, rs13021737, rs13078960, rs13107325, rs13130484, rs13191362, rs13201877, rs13329567, rs1421085, rs1441264, rs1460676, rs14810, rs1516725, rs1528435, rs16851483, rs17001654, rs17066856, rs17094222, rs17203016, rs17381664, rs17724992, rs1928295, rs2033529, rs2060604, rs2112347, rs2176598, rs2183825, rs2365389, rs2820292, rs2836754, rs2890652, rs3736485, rs3800229, rs3817334, rs3849570, rs3888190, rs4740619, rs4889606, rs543874, rs6091540, rs6457796, rs6477694, rs6567160, rs657452, rs6713510, rs6804842, rs7138803, rs7144011, rs7531118, rs7550711, rs7599312, rs7715256, rs7899106, rs7903146, rs879620, rs891389, rs9304665, rs9374842, rs943005, rs9540493, rs9579083, rs977747, and rs9926784). The variation in the included SNPs was 2.7%. The F value was 5,529, which was larger than 10 and suggested the strength of the instrumental variable was not weak.10 As a result, all these SNPs were included into the study.
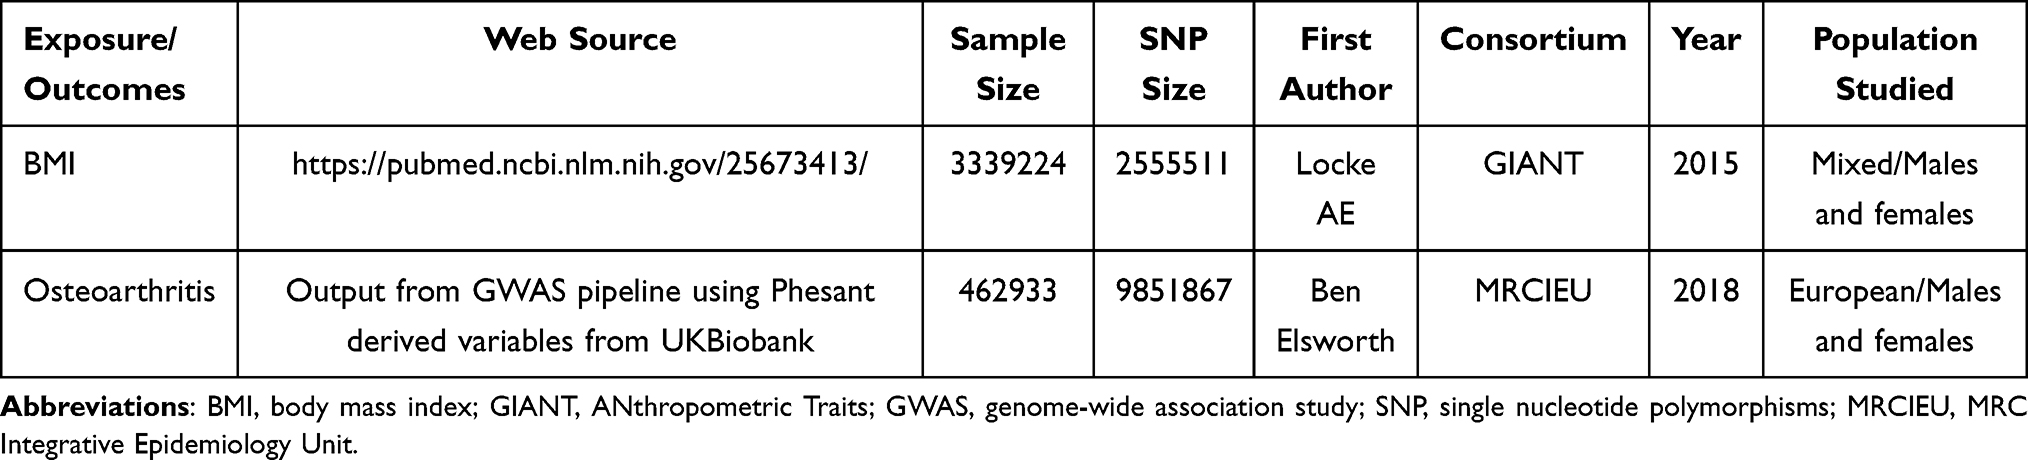 |
Table 1 Details of Studies and Datasets Used in the Study |
Genetic Variants Associated with Osteoarthritis
The GWAS summary data for osteoarthritis were obtained from MRC Integrative Epidemiology Unit (MRC-IEU) consortium, which was published in 2018 and available through the UK Biobank.11 The sample size was 462,933, with 38,472 cases and 424,461 participants in the control group. The number of SNP included in the study was 9,851,867. All the above SNPs associated with BMI were found in MRC-IEU consortium.
Estimation of the Causal Relationship Between BMI and Osteoarthritis
After data from the GWAS study or GWAS meta-analysis associated with BMI or osteoarthritis were obtained via MR-Base platform,12 MR analysis was further carried out using the package “TwoSampleMR” of the R program (version 3.4.2). Three statistical methods including inverse-variance weighted (IVW) method, weighted median estimator, and MR-Egger regression were used to investigate the causal relationship between BMI and osteoarthritis.12–15 The IVW method is the method to assess the causal relationship by the meta-analysis of every Wald ratio for the included SNPs.12,13 Significantly, there is a premise for the IVW method that all the included SNPs must be valid variables. Unlike the IVW method, the MR-Egger regression can still function when all the SNPs are invalid.15 The slope of MR-Egger indicates the effect of BMI on osteoarthritis when the intercept term is zero or without statistical significance.12,15 The weighted median estimator was intermediate and the valid variables must be no less than 50%.14 The result of the weighted median estimator was the median when the effect estimations of each single SNP are sorted in the order of weight values. The estimation of the causal relationship between BMI and osteoarthritis was expressed as odds ratio (OR) and its 95% confidence interval (CI). A P value less than 0.05 indicates that the difference is statistically significant.
Sensitivity Analysis
The method of leave-one-out method was utilized to investigate the sensitivity of the results. Similar to the meta-analysis, we removed the single SNP one by one and calculated the effect of the remaining SNPs by the IVW method.16 In this way, we examined the effect of individual SNP on the causal inference.
Results
Detail Information of the Included SNPs
The details of each SNP were presented in Table 2, including the chromosome location, genes, effect allele (EA), and effect allele frequency (EAF). Estimations of the associations of each SNP with BMI and osteoarthritis including beta value, standard error (SE) and P value were also presented in Table 2. Among them, 17 SNPs, namely rs13107325 (β −0.0096; SE 0.0011; P<0.001), rs6457796 (β −0.0025; SE 0.0006; P<0.001), rs3736485 (β 0.0017; SE 0.0006; P<0.001), rs2836754 (β 0.0016; SE 0.0006; P 0.01), rs2820292 (β −0.0014; SE 0.0006; P 0.02), rs6477694 (β 0.0012; SE 0.0006; P 0.04), rs11030104 (β 0.0029; SE 0.0007; P <0.001), rs3849570 (β 0.0012; SE 0.0006; P 0.04), rs16851483 (β −0.0029; SE 0.0012; P 0.01), rs891389 (β −0.0012; SE 0.0006; P 0.05), rs1516725 (β −0.0023; SE 0.0008; P 0.01), rs10182181 (β −0.0013; SE 0.0006; P 0.02), rs13021737 (β −0.0026; SE 0.0008; P <0.001), rs7138803 (β −0.0013; SE 0.0006; P 0.03), rs7531118 (β −0.0012; SE 0.0006; P 0.04), rs6567160 (β 0.0017; SE 0.0007; P 0.01), and rs1421085 (β 0.0013; SE 0.0006; P 0.03), were significantly associated with both BMI and osteoarthritis.
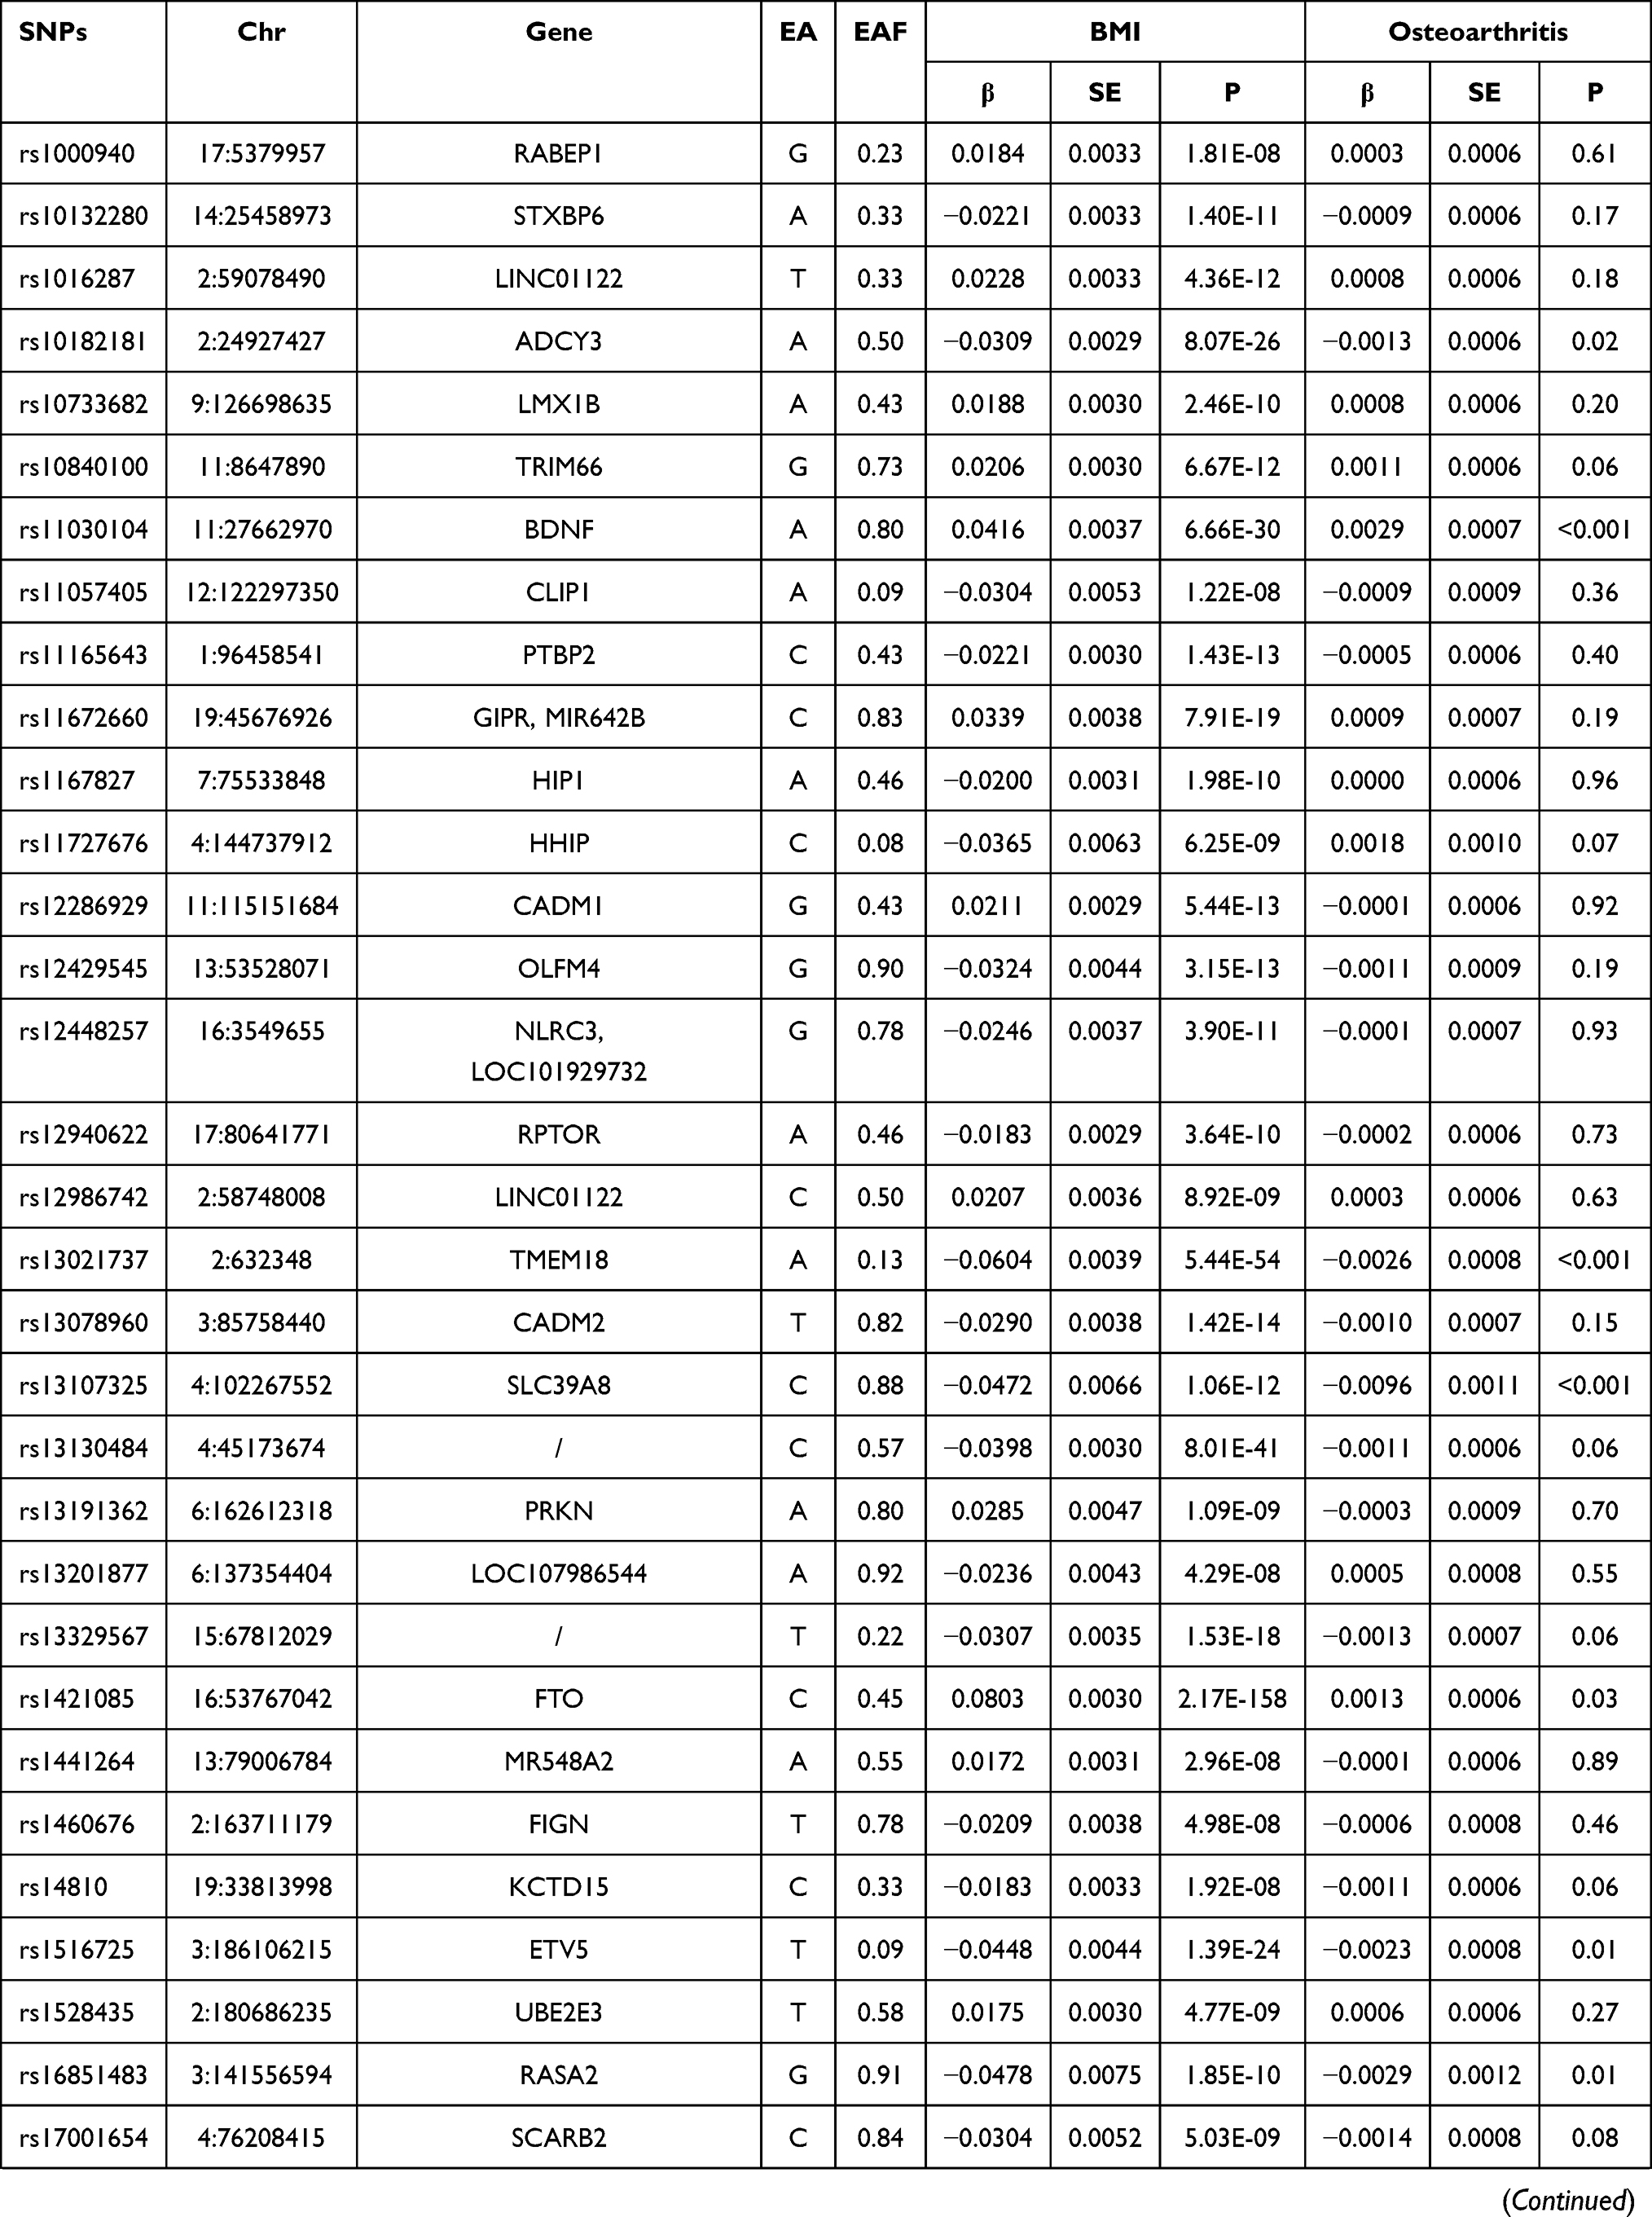 | 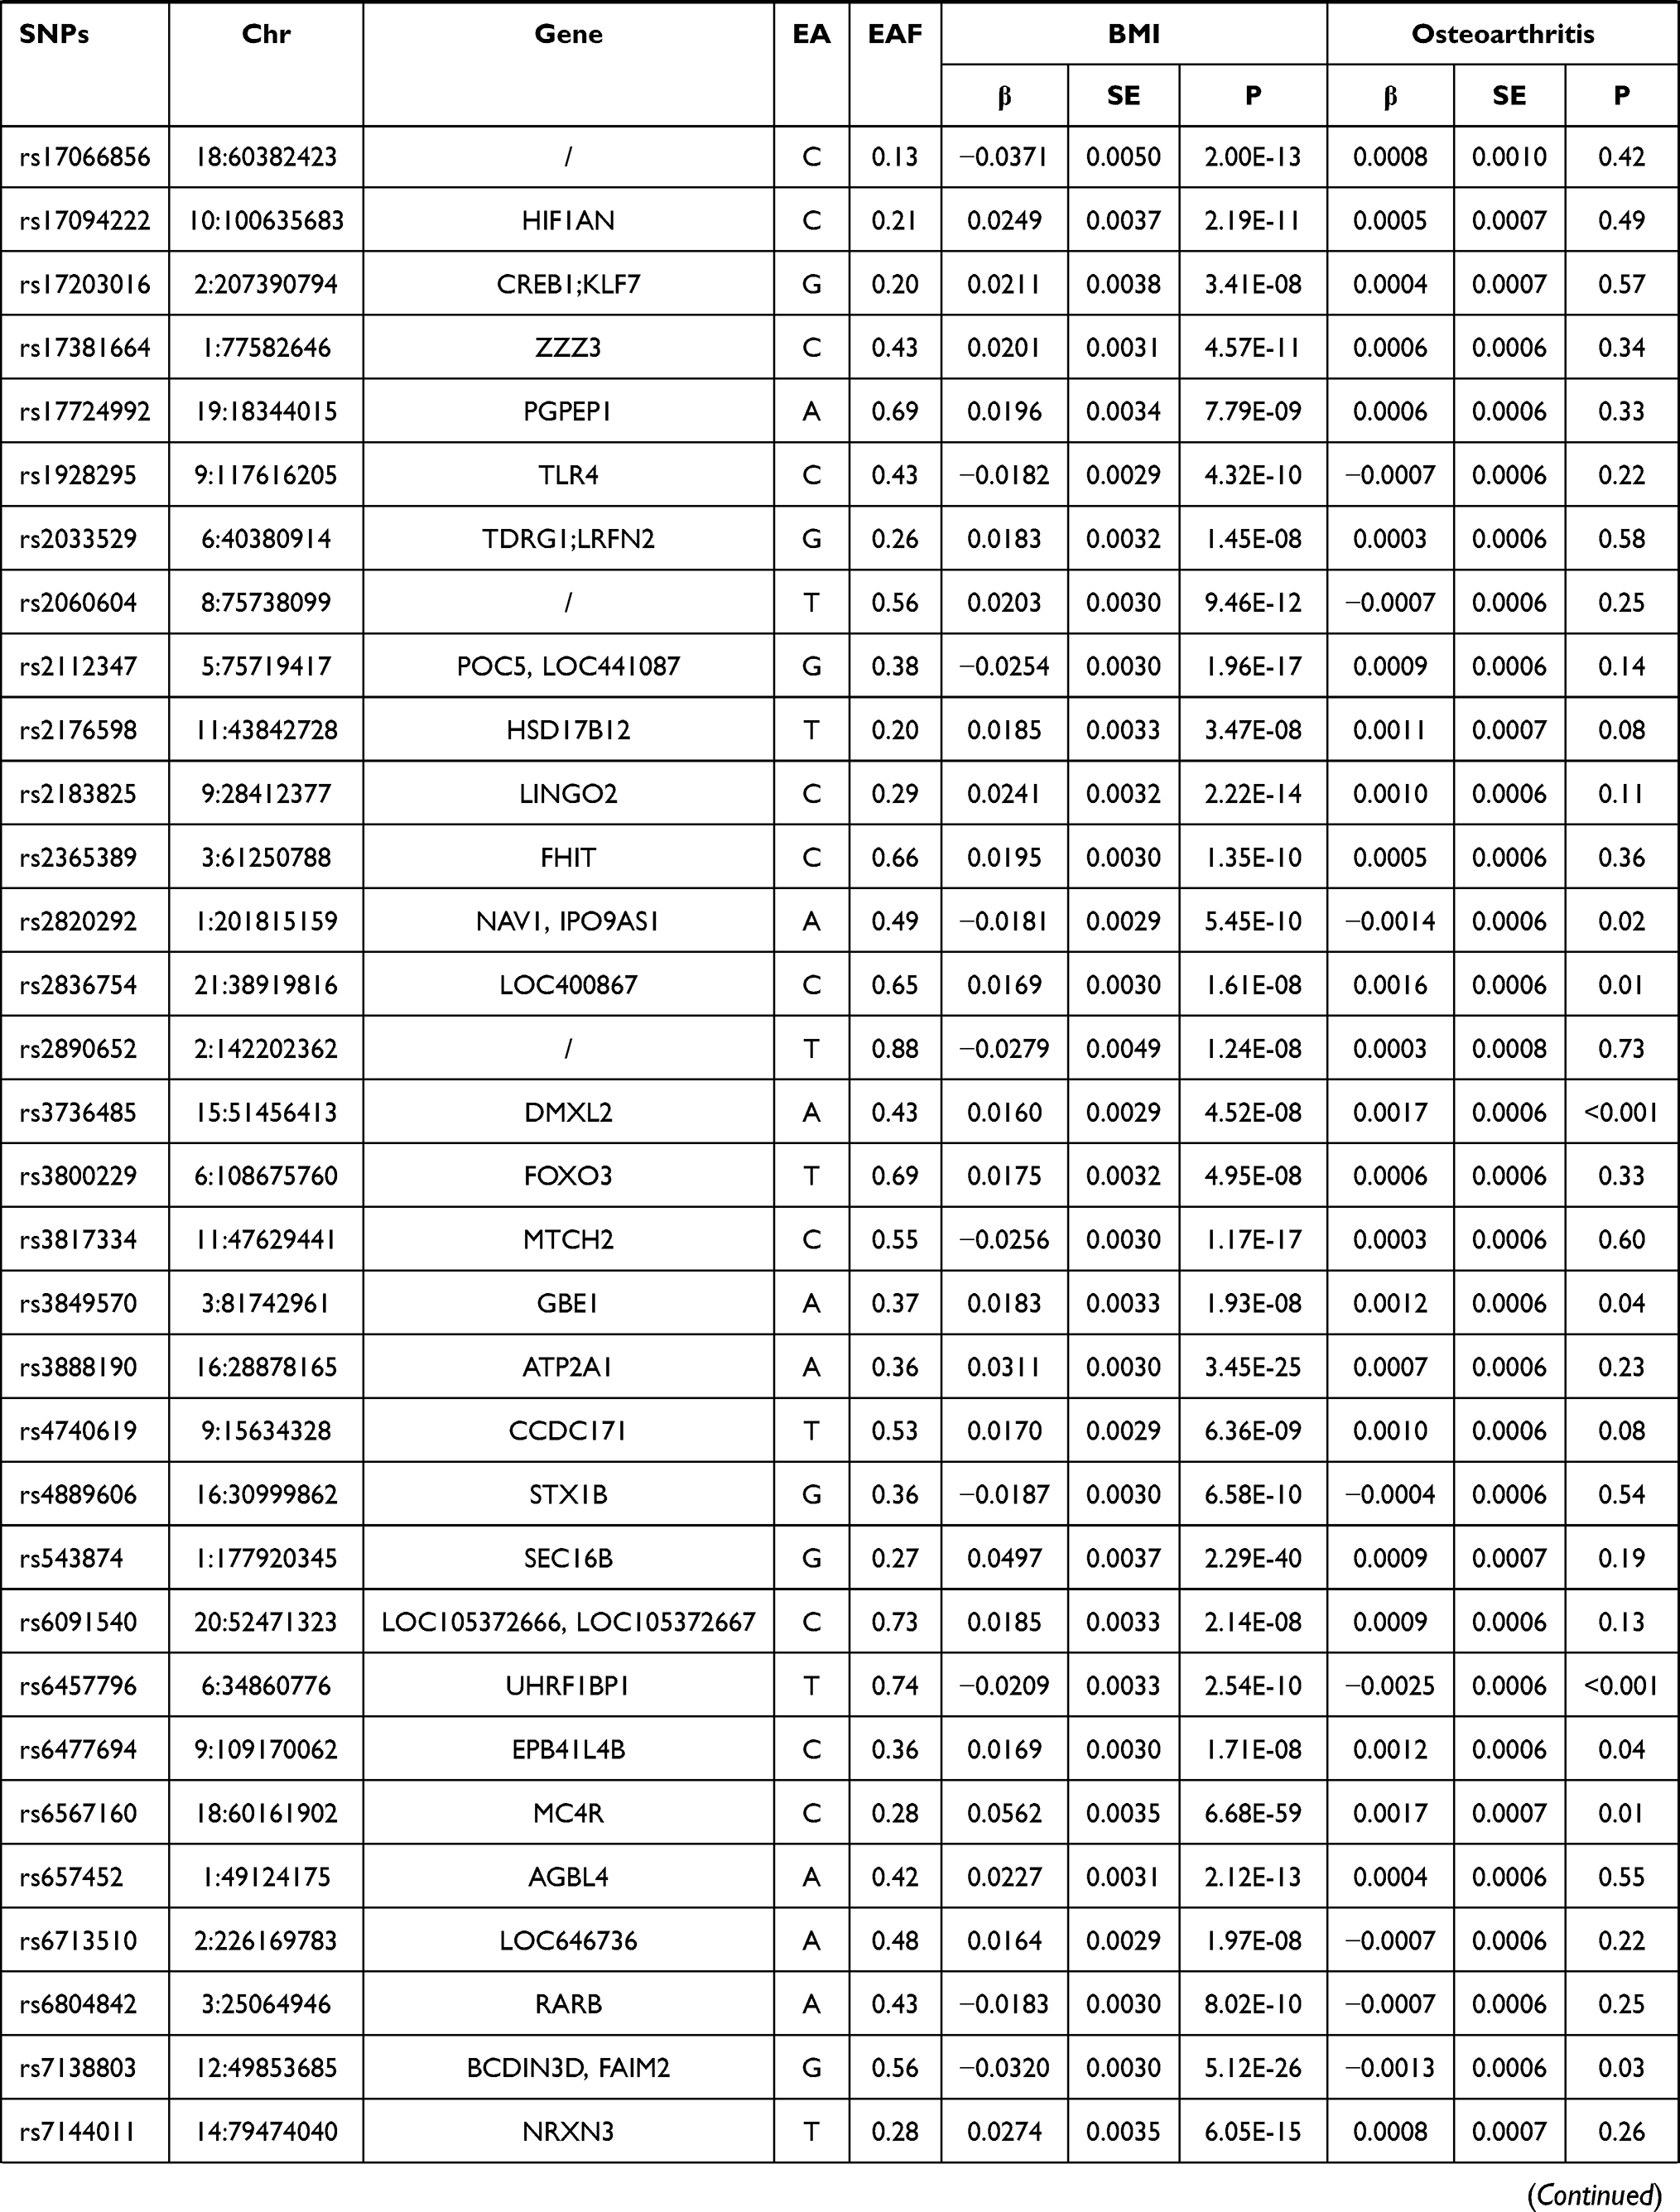 | 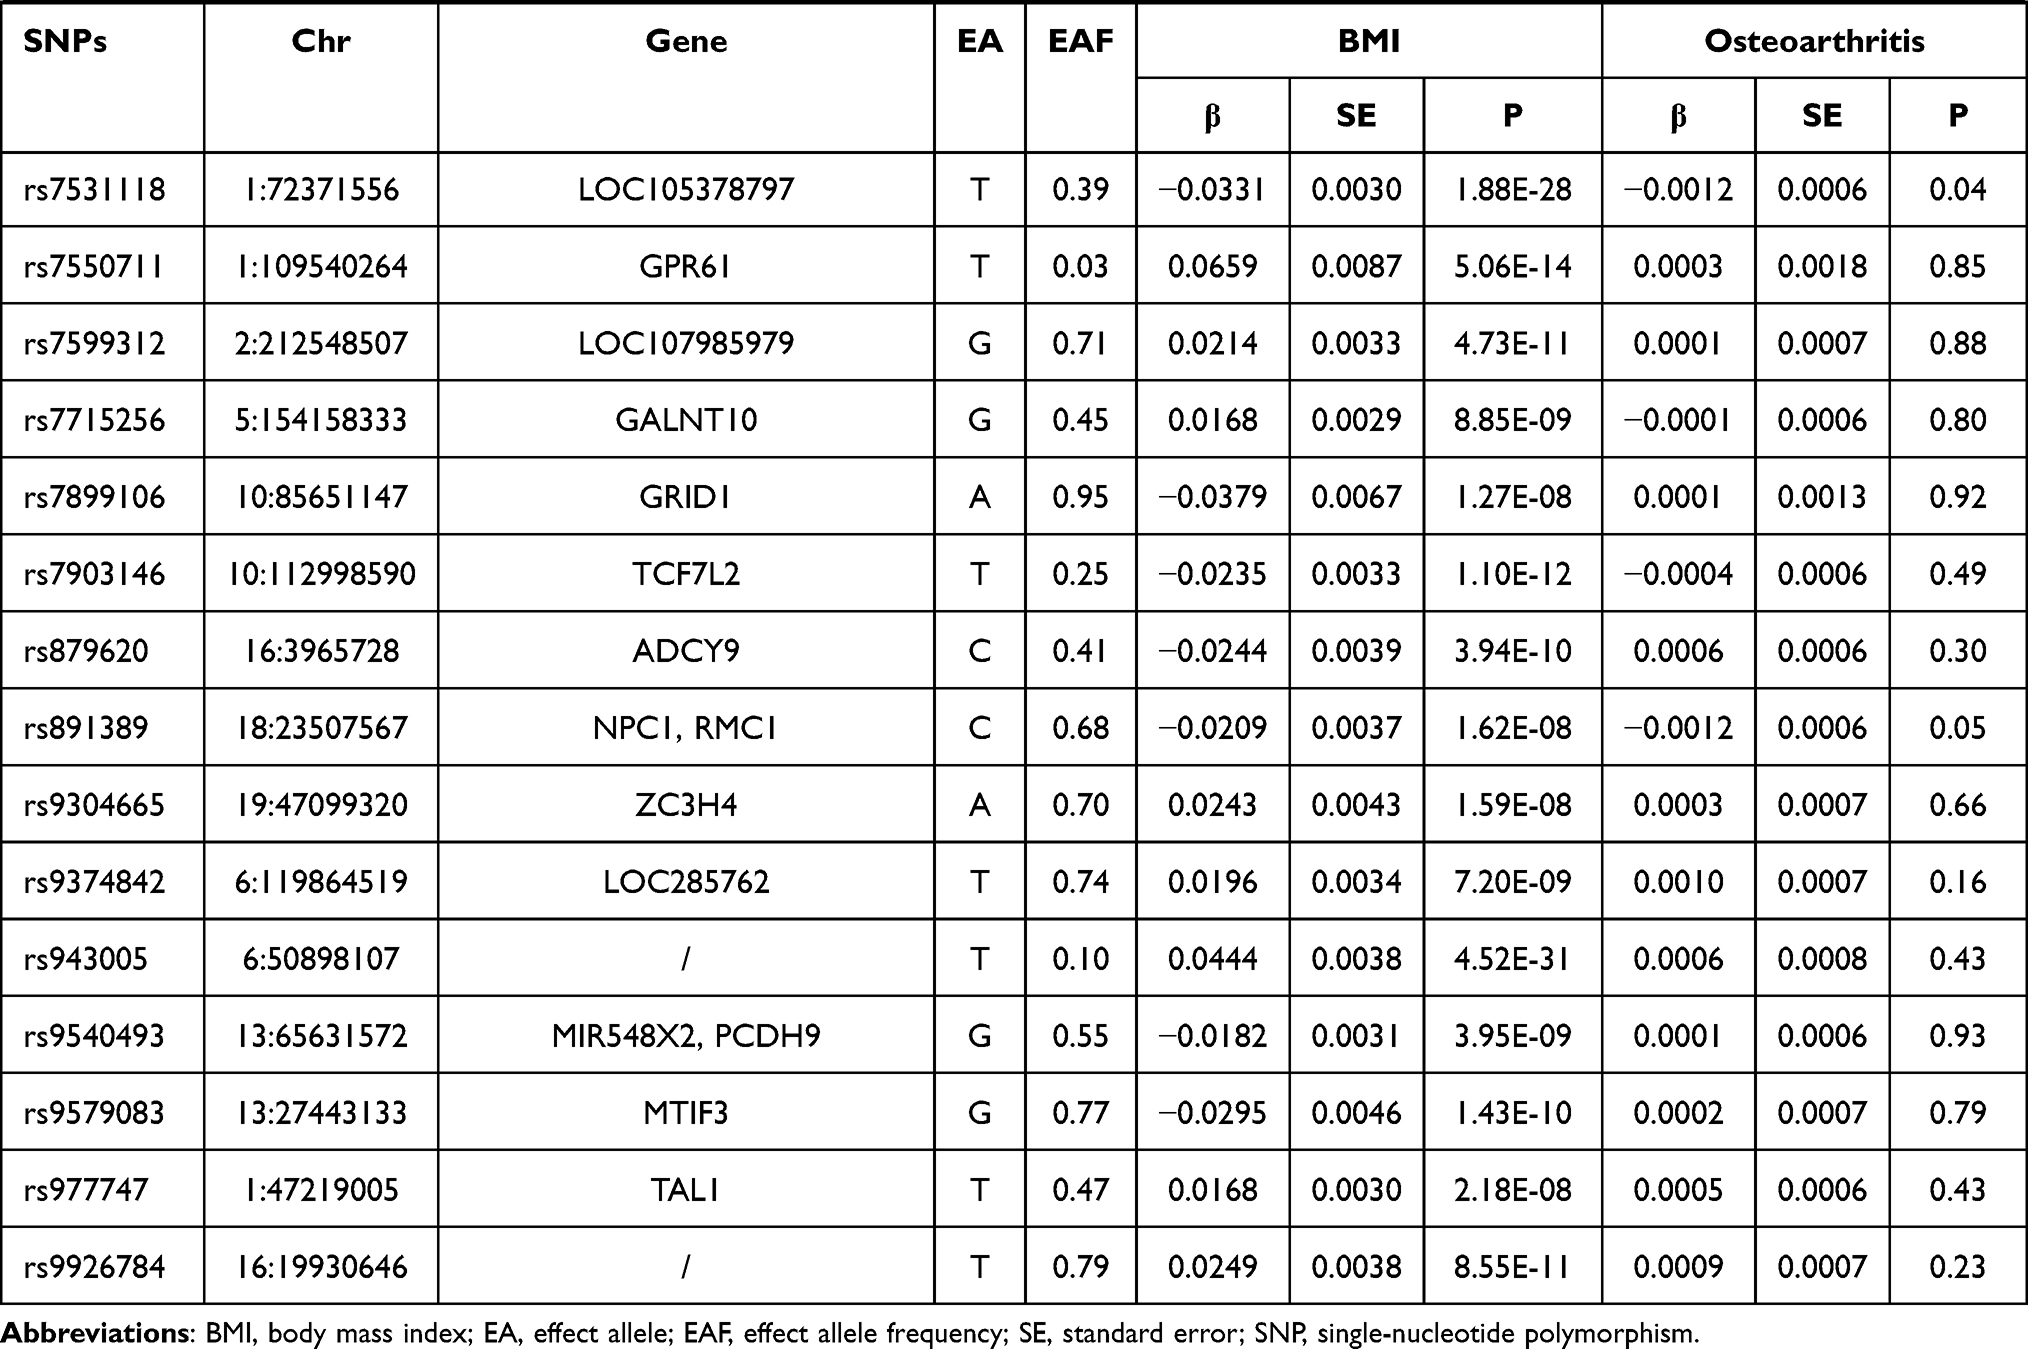 |
Table 2 Characteristics of the SNPs Associated with BMI and Their Associations with Osteoarthritis |
Causal Effect of BMI on Osteoarthritis
As presented in Table 3, result of the IVW method suggested that there was a positive association between BMI with higher genetic predictability for the risk of osteoarthritis (OR 1.028, 95% CI 1.021–1.036). The weighted median estimator and MR-Egger method showed consistent results (the weighted median estimator: OR 1.028, 95% CI 1.019–1.037; MR-Egger Method: OR 1.028, 95% CI 1.009–1.046). These results could also be observed in the forest plot (Figure 1) and the scatter diagram (Figure 2).
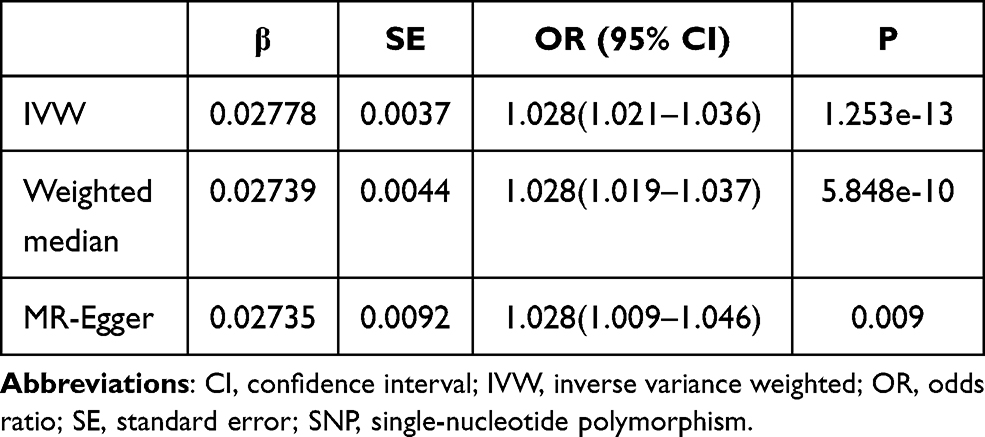 |
Table 3 Causal Associations Between Genetically Determined BMI and Osteoarthritis |
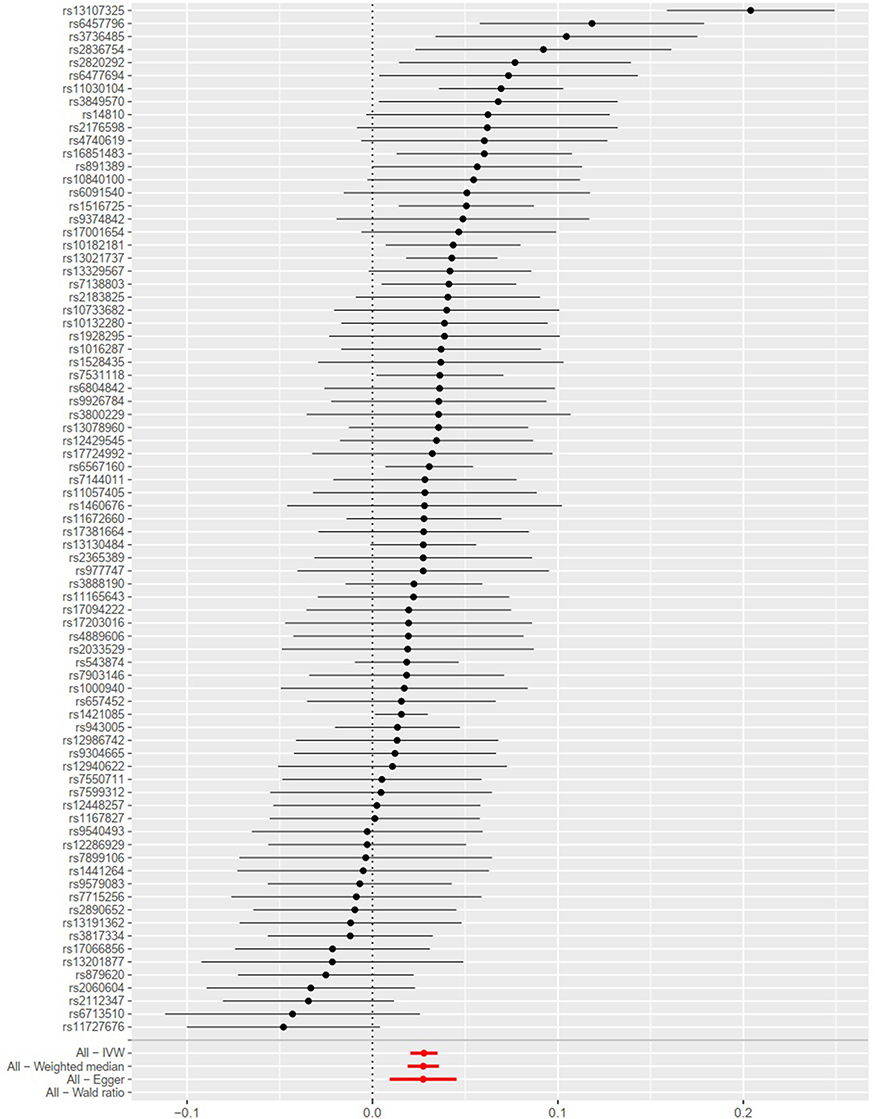 |
Figure 1 Forest plot of single nucleotide polymorphisms (SNPs) associated with body mass index (BMI) and the risk of osteoarthritis. Black points represent the log odds ratio (OR) for osteoarthritis per standard deviation (SD) increase in BMI, which is produced by using each SNP selected as a separate instrument (rs1000940, rs10132280, rs1016287, rs10182181, rs10733682, rs10840100, rs11030104, rs11057405, rs11165643, rs11672660, rs1167827, rs11727676, rs12286929, rs12429545, rs12448257, rs12940622, rs12986742, rs13021737, rs13078960, rs13107325, rs13130484, rs13191362, rs13201877, rs13329567, rs1421085, rs1441264, rs1460676, rs14810, rs1516725, rs1528435, rs16851483, rs17001654, rs17066856, rs17094222, rs17203016, rs17381664, rs17724992, rs1928295, rs2033529, rs2060604, rs2112347, rs2176598, rs2183825, rs2365389, rs2820292, rs2836754, rs2890652, rs3736485, rs3800229, rs3817334, rs3849570, rs3888190, rs4740619, rs4889606, rs543874, rs6091540, rs6457796, rs6477694, rs6567160, rs657452, rs6713510, rs6804842, rs7138803, rs7144011, rs7531118, rs7550711, rs7599312, rs7715256, rs7899106, rs7903146, rs879620, rs891389, rs9304665, rs9374842, rs943005, rs9540493, rs9579083, rs977747, and rs9926784). Red points show the combined causal estimate using all SNPs together as a single instrument, using the three different methods (the inverse‐variance weighted (IVW) method, weighted median estimator, and MR‐Egger). Horizontal line segments denote 95% confidence intervals of the estimate. |
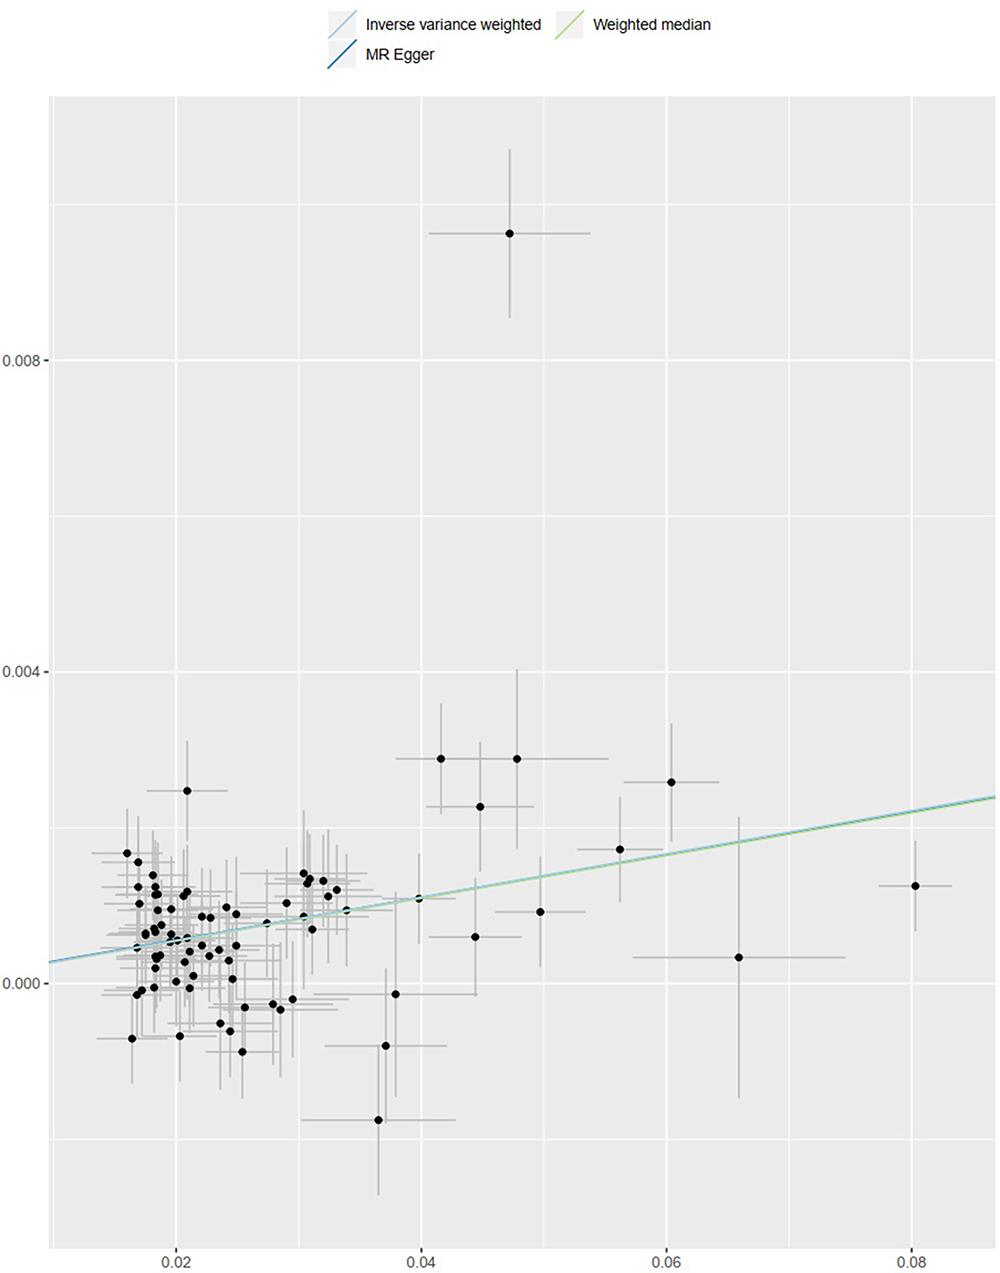 |
Figure 2 Scatter plot of SNPs associated with BMI and the risk of osteoarthritis. The plot presents the effect sizes of the SNP-BMI association (x-axis, SD units) and the SNP-osteoarthritis association (y-axis, log (OR)) with 95% confidence intervals. The regression slopes of the lines correspond to causal estimates using the three Mendelian randomization (MR) methods (the IVW method, weighted median estimator, and MR‐Egger). |
Sensitivity Analysis
There was no evidence that the result was affected by genetic pleiotropy (MR-Egger regression intercept=1.3×10⁻⁵, SE=0.00025, P=0.959). From the result of the Leave-one-out method, there was no single SNP playing a decisive role in the causal inference (Figure 3).
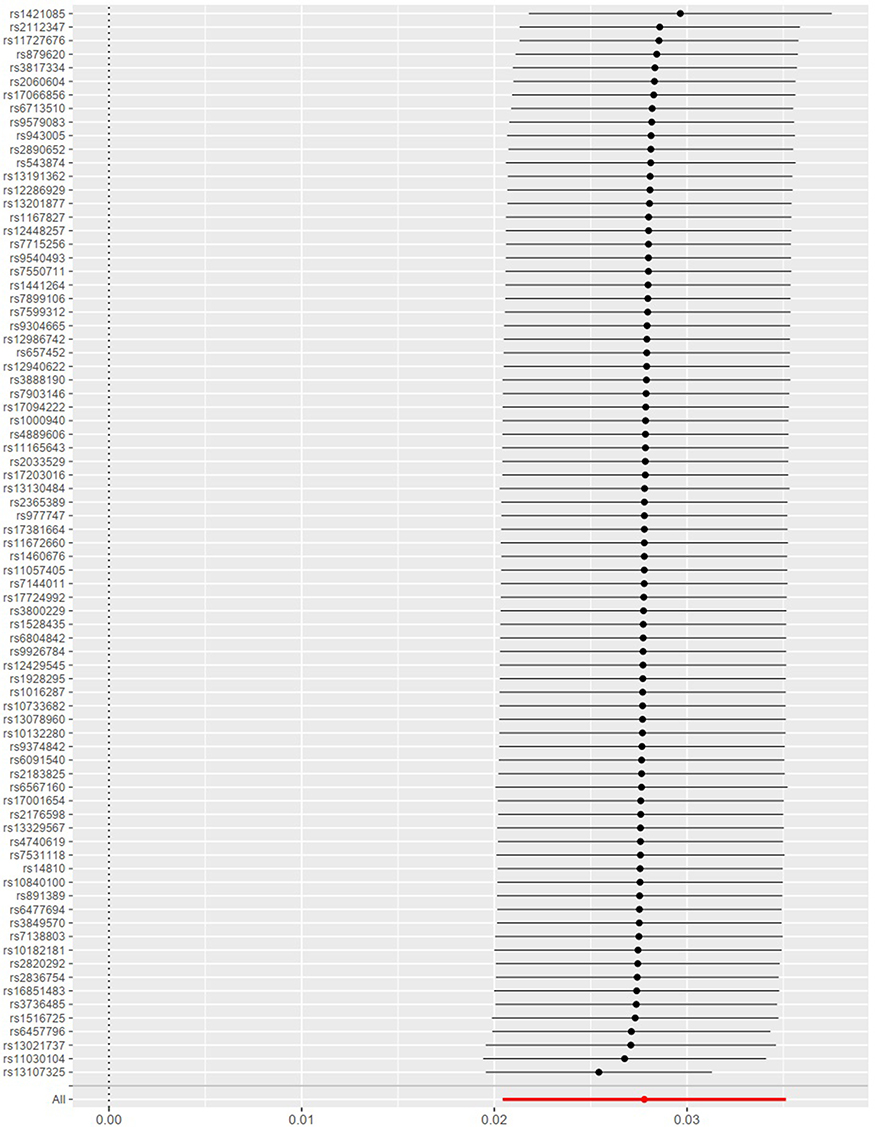 |
Figure 3 Leave-one-out of SNPs associated with BMI and their risk of osteoarthritis. Each black point represents result of the IVW MR method applied to estimate the causal effect of BMI on osteoarthritis excluding particular SNP (rs1000940, rs10132280, rs1016287, rs10182181, rs10733682, rs10840100, rs11030104, rs11057405, rs11165643, rs11672660, rs1167827, rs11727676, rs12286929, rs12429545, rs12448257, rs12940622, rs12986742, rs13021737, rs13078960, rs13107325, rs13130484, rs13191362, rs13201877, rs13329567, rs1421085, rs1441264, rs1460676, rs14810, rs1516725, rs1528435, rs16851483, rs17001654, rs17066856, rs17094222, rs17203016, rs17381664, rs17724992, rs1928295, rs2033529, rs2060604, rs2112347, rs2176598, rs2183825, rs2365389, rs2820292, rs2836754, rs2890652, rs3736485, rs3800229, rs3817334, rs3849570, rs3888190, rs4740619, rs4889606, rs543874, rs6091540, rs6457796, rs6477694, rs6567160, rs657452, rs6713510, rs6804842, rs7138803, rs7144011, rs7531118, rs7550711, rs7599312, rs7715256, rs7899106, rs7903146, rs879620, rs891389, rs9304665, rs9374842, rs943005, rs9540493, rs9579083, rs977747, and rs9926784) from the analysis. Each red point depicts the IVW estimate using all SNPs. No single SNP is strongly driving the overall effect of BMI on osteoarthritis in this leave-one-out sensitivity analysis. |
Discussion
Osteoarthritis is a chronic joint inflammatory disease with joint swelling, pain and dysfunction as the main clinical manifestations, which seriously affects the quality of life of patients and increases the economic burden of the family and society.2 In recent years, with the gradual intensification of the aging trend in the population, the prevalence rate of osteoarthritis is also increasing year by year.1,2 Age, sex, joint injury and obesity are important risk factors for osteoarthritis, among which overweight and obesity are easier to control and prevent than other risk factors. However, due to the influence of confounding factors, it is difficult for classical epidemiological studies to explain the causal sequence of exposure factors and disease results. The purpose of this study is to explore the relationship between BMI and the risk of osteoarthritis through a two-sample Mendelian randomized study based on GWAS. The result indicated that the causal relationship between BMI with the increased risk of osteoarthritis.
In this study, we explored the relationship between BMI and the risk of osteoarthritis through a two-sample MR study based on GWAS. 79 SNPs significantly related to BMI were selected as tool variables. When using the IVW method, weighted median estimator, and MR-Egger MR method with data from the GWAS study of osteoarthritis, it was found that there was a causal relationship between high BMI and the increased risk of osteoarthritis. The main implication of our findings is that it supports weight control as a intervention for the prevention and management of osteoarthritis.
Overweight and obesity are modifiable and easier to manage than other risk factors of osteoarthritis (such as age, sex, and joint injury), and therefore it becomes a promising target for management of osteoarthritis if overweight and obesity do casually increase the risk of the occurrence and/or progress of osteoarthritis. The association between overweight and osteoarthritis has been reported in several studies. Raud et al17 found that there was a dose-response relation between BMI and the knee of osteoarthritis. A Spanish research demonstrated that the osteoarthritis risk both in hip and knee was increased in being overweight.18 However, due to the potential influence of confounding factors and reverse causality, it is difficult for conventional observational studies to establish the causal relationship between BMI and osteoarthritis, while the MR method is a promising tool for such an investigation, since it uses genetic variations as instrumental variables of exposure factors to infer the causal relationship between exposure factors and outcomes. There were a few available studies that used the MR method to investigate the relationship between BMI and osteoarthritis.19,20 Hindy et al19 used methods including independent sample traditional and multivariate MR, and two sample traditional and multivariate MR methods to explore the causal relationship between BMI and osteoarthritis. Their results showed that there was a causal relationship between high BMI and low LDL and osteoarthritis. However, the study population they investigated was mainly from Malmö Diet and Cancer Study, which contained 4,226 cases and 23,456 controls in 1991 to 1996. Instead, we used the GWAS data released in 2018, with 38,472 cases and 424,461 controls. The updated data and increased sample sizes increased the strengths of our study, which had more practical significance and statistical power to confirm the investigated causal relationship. Funck‐Brentano et al20 also found a causal relationship between high BMI and knee arthritis and hip arthritis through MR method, but not with hand arthritis. The conclusion of our study was similar to these two studies, but in addition to the use of updated data and a larger sample size, the methods we used for investigation were more rigorous since a sensitivity analysis using the method of leave-one-out was conducted and consistent results were observed.
The etiology of the causal effect of BMI on osteoarthritis is not completely clear. Some studies have suggested that individuals with high BMI might be with increased joint load and therefore it accelerates the aging of the articular surface, leading to the occurrence and aggravation of osteoarthritis.21 In addition, obesity can induce the development of inflammation by increasing the intermediates produced by lipid metabolism, leading to osteoarthritis.22 However, more researches are need for further study.
Our study had some strengths. First, the MR method was used in the study, and therefore confounding factors and reverse causality were well controlled, at least to a great extent. Second, the study was based on data from published GWAS researches and GWAS meta-analyses, with a large sample size and genetic variations. However, the study also had some limitations. First, genetic polymorphisms are difficult to validate, and even if we used the MR-Egger method, misclassification in genetic polymorphisms cannot be completely ruled out. Second, the GWAS dataset of BMI used in this study was based on a mixed population, while the population from which the data of osteoarthritis was derived was European. This might lead to the bias from population stratification, and it remains unknown whether the result can be directly applied to other populations, which warrants further investigations. Third, there might be over-identification in the two-sample MR study, which may overestimate the association between SNP and exposure.23
Conclusion
This study indicated that high BMI might be causally associated with increased risk of osteoarthritis, which supports the importance of weight control for the prevention and treatment of osteoarthritis. Further researches are needed to explore the underlying mechanisms of this causal relationship.
Compliance with Ethical Guidelines
This article does not contain any studies with human participants or animals performed by any of the authors.
Disclosure
The authors declare that they have no competing interests.
References
1. Geyer M, Schönfeld C. Novel insights into the pathogenesis of osteoarthritis. Curr Rheumatol Rev. 2018;14(2):98–107. doi:10.2174/1573397113666170807122312
2. Glyn-Jones S, Palmer AJR, Agricola R, et al. Osteoarthritis. Lancet. 2015;386(9991):376–387. doi:10.1016/S0140-6736(14)60802-3
3. Blagojevic M, Jinks C, Jeffery A, et al. Risk factors for onset of osteoarthritis of the knee in older adults: a systematic review and meta-analysis. Osteoarthritis Cartilage. 2010;18(1):24–33. doi:10.1016/j.joca.2009.08.010
4. Butterworth PA, Landorf KB, Smith SE, et al. The association between body mass index and musculoskeletal foot disorders: a systematic review. Obes Rev. 2012;13(7):630–642. doi:10.1111/j.1467-789X.2012.00996.x
5. Kolasinski SL, Neogi T, Hochberg MC, et al. 2019 American College of Rheumatology/Arthritis Foundation guideline for the management of osteoarthritis of the hand, hip, and knee. Arthritis Rheumatol. 2020;72(2):220–233. doi:10.1002/acr.24131
6. Messier SP, Mihalko SL, Legault C, et al. Effects of intensive diet and exercise on knee joint loads, inflammation, and clinical outcomes among overweight and obese adults with knee osteoarthritis: the IDEA randomized clinical trial. JAMA. 2013;310(12):1263–1273. doi:10.1001/jama.2013.277669
7. Ference BA, Ray KK, Catapano AL, et al. Mendelian randomization study of ACLY and cardiovascular disease. N Engl J Med. 2019;380(11):1033–1042. doi:10.1056/NEJMoa1806747
8. Li MJ, Liu Z, Wang P, et al. GWASdb v2: an update database for human genetic variants identified by genome-wide association studies. Nucleic Acids Res. 2016;44(D1):D869–D876. doi:10.1093/nar/gkv1317
9. Locke AE, Kahali B, Berndt SI, et al. Genetic studies of body mass index yield new insights for obesity biology. Nature. 2015;518(7538):197–206. doi:10.1038/nature14177
10. Burgess S, Thompson SG; CRP CHD Genetics Collaboration. Avoiding bias from weak instruments in Mendelian randomization studies. Int J Epidemiol. 2011;40(3):755–764. doi:10.1093/ije/dyr036
11. Elsworth BL, Lyon MS, Alexander T, et al. The MRC IEU OpenGWAS data infrastructure. bioRxiv. 2020.
12. Hemani G, Zheng J, Elsworth B, et al. The MR-Base platform supports systematic causal inference across the human phenome. Elife. 2018;7:e34408. doi:10.7554/eLife.34408
13. Bowden J, Del Greco MF, Minelli C, et al. A framework for the investigation of pleiotropy in two‐sample summary data Mendelian randomization. Stat Med. 2017;36(11):1783–1802. doi:10.1002/sim.7221
14. Bowden J, Davey smith G, Haycock PC, et al. Consistent estimation in Mendelian randomization with some invalid instruments using a weighted median estimator. Genet Epidemiol. 2016;40(4):304–314. doi:10.1002/gepi.21965
15. Hartwig FP, Davey Smith G, Bowden J. Robust inference in summary data Mendelian randomization via the zero modal pleiotropy assumption. Int J Epidemiol. 2017;46(6):1985–1998. doi:10.1093/ije/dyx102
16. Mikshowsky AA, Gianola D, Weigel KA. Assessing genomic prediction accuracy for Holstein sires using bootstrap aggregation sampling and leave-one-out cross validation. J Dairy Sci. 2017;100(1):453–464. doi:10.3168/jds.2016-11496
17. Raud B, Gay C, Guiguet-Auclair C, et al. Level of obesity is directly associated with the clinical and functional consequences of knee osteoarthritis. Sci Rep. 2020;10(1):1–7. doi:10.1038/s41598-020-60587-1
18. Reyes C, Leyland KM, Peat G, et al. Association between overweight and obesity and risk of clinically diagnosed knee, hip, and hand osteoarthritis: a population‐based cohort study. Arthritis Rheumatol. 2016;68(8):1869–1875. doi:10.1002/art.39707
19. Hindy G, Åkesson KE, Melander O, et al. Cardiometabolic polygenic risk scores and osteoarthritis outcomes: a Mendelian randomization study using data from the Malmö Diet and Cancer Study and the UK Biobank. Arthritis Rheumatol. 2019;71(6):925–934. doi:10.1002/art.40812
20. Funck‐Brentano T, Nethander M, Movérare‐Skrtic S, et al. Causal factors for knee, hip, and hand osteoarthritis: a Mendelian randomization study in the UK biobank. Arthritis Rheumatol. 2019;71(10):1634–1641. doi:10.1002/art.40928
21. Ibounig T, Simons T, Launonen A, et al. Glenohumeral osteoarthritis: an overview of etiology and diagnostics. Scand J Surg. 2020:1457496920935018. doi:10.1177/1457496920935018
22. Francisco V, Pérez T, Pino J, et al. Biomechanics, obesity, and osteoarthritis. The role of adipokines: when the levee breaks. J Orthop Res. 2018;36(2):594–604. doi:10.1002/jor.23788
23. Bowden J, Dudbridge F. Unbiased estimation of odds ratios: combining genomewide association scans with replication studies. Genetic Epidemiol. 2009;33(5):406–418. doi:10.1002/gepi.20394
 © 2021 The Author(s). This work is published and licensed by Dove Medical Press Limited. The full terms of this license are available at https://www.dovepress.com/terms.php and incorporate the Creative Commons Attribution - Non Commercial (unported, v3.0) License.
By accessing the work you hereby accept the Terms. Non-commercial uses of the work are permitted without any further permission from Dove Medical Press Limited, provided the work is properly attributed. For permission for commercial use of this work, please see paragraphs 4.2 and 5 of our Terms.
© 2021 The Author(s). This work is published and licensed by Dove Medical Press Limited. The full terms of this license are available at https://www.dovepress.com/terms.php and incorporate the Creative Commons Attribution - Non Commercial (unported, v3.0) License.
By accessing the work you hereby accept the Terms. Non-commercial uses of the work are permitted without any further permission from Dove Medical Press Limited, provided the work is properly attributed. For permission for commercial use of this work, please see paragraphs 4.2 and 5 of our Terms.