")
Back to Journals » Cancer Management and Research » Volume 9
The burden of selected cancers in the US: health behaviors and health care resource utilization
Authors Iadeluca L , Mardekian J , Chander P, Hopps M, Makinson GT
Received 3 June 2017
Accepted for publication 11 August 2017
Published 28 November 2017 Volume 2017:9 Pages 721—730
DOI https://doi.org/10.2147/CMAR.S143148
Checked for plagiarism Yes
Review by Single anonymous peer review
Peer reviewer comments 2
Editor who approved publication: Dr Antonella D'Anneo
Laura Iadeluca,1 Jack Mardekian,1 Pratibha Chander,2 Markay Hopps,1 Geoffrey T Makinson1
1Pfizer Inc., 2Atrium Staffing, New York, NY, USA
Objective: To characterize the disease burden among survivors of those cancers having the highest incidence in the US.
Methods: Adult (≥18 years) survivors of the 11 most frequently diagnosed cancers were identified from publically available data sources, including the Surveillance Epidemiology and End Results 9 1973–2012, National Health Interview Survey 2013, and the Medical Expenditure Panel Survey 2011. Chi-square tests and one-way analyses of variance were utilized to assess differences between cancer survivors and non-cancer controls in behavioral characteristics, symptoms and functions, preventative screenings, and health care costs.
Results: Hematologic malignancies, melanoma, and breast, prostate, lung, colon/rectal, bladder, kidney/renal, uterine, thyroid, and pancreatic cancers had the highest incidence rates. Breast cancer had the highest incidence among women (156.4 per 100,000) and prostate cancer among men (167.2 per 100,000). The presence of pain (P=0.0003), fatigue (P=0.0005), and sadness (P=0.0012) was consistently higher in cancer survivors 40–64 years old vs. non-cancer controls. Cancer survivors ≥65 years old had higher rates of any functional limitations (P=0.0039) and reported a lack of exercise (P<0.0001) compared with the non-cancer controls. However, obesity rates were similar between cancer survivors and non-cancer controls. Among cancer survivors, an estimated 13.5 million spent $169.4 billion a year on treatment, with the highest direct expenditures for breast cancer ($39 billion), prostate cancer ($37 billion), and hematologic malignancies ($25 billion). Prescription medications and office-based visits contributed equally as the cost drivers of direct medical spending for breast cancer, while inpatient hospitalization was the driver for prostate (52.8%) and lung (38.6%) cancers.
Conclusion: Understanding the resource utilization implications, health, and well-being of cancer survivors can inform approaches to interventions for improving long-term care.
Keywords: cancer survivor, epidemiology, survivorship, function, health care resource utilization, costs
Introduction
Cancer remains one of the primary public health concerns in the US. It has been estimated that ~40% of men and women will receive a cancer diagnosis at some point during their lifetime.1 While cancer is associated with substantial mortality, the number of people living beyond a cancer diagnosis is increasing and is projected to be 19 million by 2024.1 With improved survival rates after diagnosis, cancer is shifting from a terminal illness to a chronic disease.
Cancer will result in a greater burden of disease due to increasing health care utilization and costs of care. Disease morbidity and mortality, as well as economic measures, such as health care expenditures and productivity loss, are commonly used to quantify the total burden of disease.2 However, relatively little is known about the economics of cancer survivorship.3
Cancers vary by patients affected, risk factors, outcomes, and resource utilizations. Population studies designed to characterize differences in epidemiology and outcomes among cancer types can guide approaches for targeted disease management that may help improve patient outcomes and reduce costs. Therefore, the purpose of this study was to provide an overview of trends among cancer survivors and compare functional limitations, health care resource utilization, and expenditures relative to US adults without cancer.
Methods
Data sources and population
The current analysis was limited to subjects ≥18 years old. Publicly available data sources used to characterize the burden of cancer among US adults included the Surveillance Epidemiology and End Results (SEER) database,4 the National Health Interview Survey (NHIS),5 and the Medical Expenditure Panel Survey (MEPS).6
SEER is a database developed and maintained by the US National Cancer Institute. The database provides information on cancer incidence and survival from several population-based cancer registries throughout the US. Newly diagnosed invasive cancer cases were obtained from the SEER 9 registries database from 1973 to 2012 covering ~9.4% of the US population.4 The 11 cancers with the highest frequency from the SEER 2011 prevalence data were included in this study. Cancer types were defined using the International Classification of Diseases for Oncology, third edition (ICD-O-3) of the World Health Organization (WHO).7
NHIS, which is administered by the US Census Bureau, is a cross-sectional household interview survey of a nationally representative sample of civilian, noninstitutionalized individuals within the US.5 NHIS 2013 provides information on various health components such as cancer history, health behaviors, cancer screening behaviors, and functional limitations (i.e. reductions in performance of activities). We utilized the 2013 NHIS dataset as it was the most recent data release with supplementary questions including expanded content measuring cancer screening in adults. Participants were classified as cancer survivors based on the question “Have you ever been told by a doctor or other health professional that you had cancer or malignancy of any kind?”. Those who responded “Yes” and had hematologic malignancies, melanoma, and breast, prostate, lung, colon/rectal, bladder, kidney/renal, uterine, thyroid, or pancreatic cancers were included in the analysis, and those who responded “No” comprised the non-cancer control population; all other respondents were excluded from further analysis.
Health care expenditures were measured using the 2011 MEPS household component survey, which is conducted by the Agency for Healthcare Research and Quality (AHRQ) and National Center for Health Statistics (NCHS).6 The MEPS consists of surveys of families and individuals, their medical providers, and employers across the US, and represents the most complete data source on health care utilization and costs. Expenditures in MEPS comprised direct payments for care provided during the year, including out-of-pocket payments and payments by private insurance, Medicaid, Medicare, and other sources, and are reported in 2011 USD. Provider data obtained through a supplemental survey of hospital events, physician office visits, and home health care are used for cost data. Payment information for prescription medications is obtained directly from pharmacies. MEPS 2011 data were supplemented with a self-administered questionnaire for current cancer patients and cancer survivors identified in MEPS. The supplement provided information on financial impacts, long-lasting effects of disease, and employment outcomes for cancer survivors and their families. Adult cancer survivors were identified from a survey question asking if a doctor or health professional had ever told them they had cancer or a malignancy of any kind. Similar to the NHIS population, the analysis population was limited to only those who were diagnosed with the selected cancers.
All data from the SEER, NHIS, and MEPS databases are de-identified and fully compliant with the Health Insurance Portability and Accountability Act of 1996; since this was a secondary analysis of these data, review and approval by an institutional review board was not required.
Outcomes
From NHIS, we utilized data on demographic characteristics of the populations and the presence of comorbidities; several self-reported behavioral risk factors including smoking, exercise, obesity, and alcohol consumption were evaluated. The age of diagnosis and experiences with cancer treatment were obtained for cancer survivors. Cancer screening was assessed based on the length of time since the last preventative care screen for specific cancer types (mammogram, prostate-specific antigen, fecal occult blood, and Pap test). In addition, we examined cancer screening by age groups based on the recommended ages for each of the screening approaches. Functional limitations are presented as any limitation affecting activities of daily living or instrumental activities of daily living, or work limitations. We report on specific symptoms such as pain (within the past 3 months), fatigue (within the past 3 months), and sadness (within the past 30 days). From the MEPS dataset, costs of care were assessed based on the source of payment and health care resource utilization categories of office-based visits, emergency room (ER) use, hospital outpatient visits, inpatient visits, prescription medications, and home health care.
Statistical analyses
Incidence rates per 100,000 person years were calculated and age-adjusted to the year 2000. Descriptive statistics, chi-square tests for categorical variables, and Student’s t-test for continuous variables were used to characterize and compare cancer survivors and non-cancer controls for the 11 most frequently diagnosed cancers within the US. Estimates were weighted to account for the NHIS and MEPS complex survey design. A P-value <0.05 was considered statistically significant, with no adjustments for multiplicity. All analyses were performed using SAS version 9.4 (SAS Institute Inc., Cary, NC, USA).
Results
Cancer incidence and survival
According to SEER data, the 11 most commonly diagnosed cancers in the US (incidence per 100,000 population) were breast (81.4), prostate (80.9), lung (77.5), and colon/rectal (64.7) cancers, followed by hematologic malignancies (47.9), and bladder (25.5), melanoma (20.1), uterine (18.2), pancreatic (14.8), kidney/renal (14.2), and thyroid (10.2) cancers. Breast cancer had the highest incidence among adult women, 156.4 per 100,000 women, and prostate cancer had the highest incidence among adult men, 167.2 per 100,000 men. Except for thyroid cancer, incidence rates of other cancers were higher among men than among women.
Many of the cancers had a high 5-year relative survival rate, with nearly all cancers showing >50% survival regardless of stage of diagnosis. Thyroid, prostate, melanoma, and breast cancers had the highest 5-year survival rates, ~90% or greater. However, in adults diagnosed with distant stage of cancer, 5-year relative survival decreases (thyroid: 59.8%; prostate: 30.7%; melanoma: 15.6%; breast: 21.9%). Lung and pancreatic cancers had the lowest survival rates, 15.6% and 4.6%, respectively. For each tumor type, 5-year relative survival rate decreased with increasing stage of disease from local to regional and distant.
Characteristics of cancer survivors and non-cancer controls
Cancer survivors were more likely to be older, female, White, and had greater unemployment than non-cancer controls (Table 1). There were also significant differences in income and education levels, although the differences between populations were numerically small, which was a possible consequence of a large sample size.
 | Table 1 Demographic characteristics of cancer survivors and non-cancer controls from the US National Health Interview Survey, 2013 Note: aPercentages are age-adjusted except for age groups. Abbreviation: GED, General Education Development. |
Cancer survivors had a higher prevalence of comorbid conditions than non-cancer controls regardless of age (Table 2). In particular, cancer survivors 18–39 years old had a significantly higher prevalence of angina, arthritis, COPD, heart attack, and stroke compared with non-cancer controls in the same age group. Cancer survivors 40–64 years old had a significantly higher prevalence of all comorbid conditions, with the exception of diabetes, compared with non-cancer controls. Cancer survivors ≥65 years old had a significantly higher prevalence of arthritis, COPD, and heart attack than their non-cancer counterparts.
 | Table 2 Comorbid conditions of cancer survivors relative to non-cancer controls stratified by age group from the US National Health Interview Survey, 2013 |
Symptoms and functions
Among 40- to 64-year-old cancer survivors, the presence of pain (P=0.0003), fatigue (P=0.0005), and sadness (P=0.0012) was consistently higher compared with non-cancer controls (Table 3). Cancer survivors ≥65 years old had similar prevalence of pain (P=0.822), fatigue (P=0.877), and sadness (P=0.619) compared with non-cancer controls. However, a higher proportion of cancer survivors in this age group reported functional limitations compared with non-cancer controls (22.9% vs. 17.9%, respectively; P=0.0039). Young cancer survivors (18–39 years old) reported similar symptoms of sadness (37.0% vs. 34.6%; P=0.097), fatigue (34.3% vs. 32.8%; P=0.855), and pain (33.7% vs. 23.0%; P=0.137) compared with non-cancer controls of the same age. However, there was a greater prevalence of functional limitations among the cancer survivors aged 18–39 years than their non-cancer counterparts (17.4% vs. 3.6%; P=0.0041).
 | Table 3 Presence of symptoms and functional impairment in cancer survivors relative to non-cancer controls in the US National Health Interview Survey, 2013 Note: aAny limitation is defined as a limitation in activities of daily living, instrumental activities of daily living, or work limitation. |
Risk factors and preventative care
A significantly higher proportion of cancer survivors relative to non-cancer controls self-reported current smoking (48.9% vs. 46.9%; P<0.0001) (Table 4), but differences were observed when stratified by age among those who ever smoked. Current smoking appeared to be driven by age. While young cancer survivors (18–39 years) had a numerically higher prevalence of current smoking (67.2% vs. 62.9%; P=0.697), non-cancer controls had a numerically higher prevalence of current smoking compared with cancer survivors in both 40- to 64-year-old (46.6% vs. 41.8%; P=0.149) and ≥65-year-old (18.9% vs. 15.8%; P=0.164) age groups. Overall, 73.1% of cancer survivors reported a lack of exercise compared with 62.7% of non-cancer controls (P<0.0001). However, cancer survivors and non-cancer controls had similar rates of obesity (67.1% vs. 63.9%; P=0.163). Alcohol consumption, defined as more than one drink per day, was similar between cancer survivors (51.4%) and non-cancer controls (52.2%; P<0.0001). However, when stratifying the data by age, cancer survivors 40–64 years old had significantly lower alcohol consumption compared with non-cancer controls (41.7% vs. 49.9%; P=0.0048).
 | Table 4 Prevalence of behavioral risk factors among cancer survivors relative to non-cancer controls in the US National Health Interview Survey, 2013 Note: aAmong those who reported ever smoking. |
The time frame for the most recent cancer screening tests among US adults ≥50 years old was similar for cancer survivors and non-cancer controls (Table 5). However, more than half (55%) of the non-cancer controls reported never having undergone a colonoscopy or sigmoidoscopy compared with ~30% of cancer survivors who reported never having undergone a colonoscopy or sigmoidoscopy.
 | Table 5 Most recent cancer screening tests among cancer survivors .50 years old who reported having a screening test relative to non-cancer controls in the US National Health Interview Survey, 2013 |
Medical spending
Total annual direct spending for the 11 most frequent cancers was estimated at $169.4 billion, with breast and prostate cancers having the highest direct expenditures at $39.0 billion and $36.8 billion, respectively (Figure 1). These two cancers accounted for 41.7% of total spending, which can be attributed to their higher incidence and favorable survival rates. The estimate for pancreatic cancer, with the lowest annual direct medical spending among all cancers, was $4.2 billion.
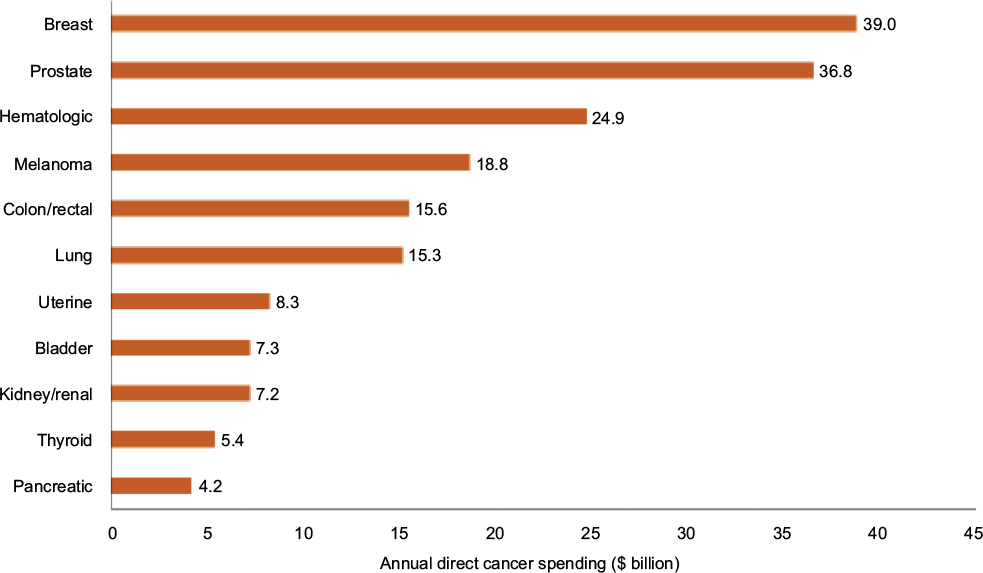 | Figure 1 Annual direct spending for the cancers having the highest incidence in the US adult population from the Medical Expenditure Panel Survey (MEPS), 2011 (N=1,181). Notes: The total individual costs add up to greater than the estimated total $169.4 billion, since individual patients may fall into more than one cancer category. Among 1,910 cancer survivors in National Health Interview Survey 2013, 1,181 patients were linked to MEPS 2011. |
Resource utilization costs showed diverse patterns among the four cancers having the highest incidence rates (Figure 2). While ER and home health care costs were consistently low across these cancer types, inpatient hospitalizations appeared to be the primary driver of costs for prostate ($18.6 billion; 52.8% of spending) and lung cancers ($5.8 billion; 38.6% of spending). For breast cancer, costs were driven almost equally by prescription medications ($11.2 billion) and office-based visits ($11.1 billion), with each category accounting for ~30% of annual direct spending. In patients with colorectal cancer, office-based visits ($4.1 billion; 27.0% of spending) was the primary cost driver, followed by prescription medications ($3.9 billion; 25.9% of spending). Primary payment source varied by the type of cancer; for example, 42.9% of breast cancer spending was paid through private insurance, while 65.8% of prostate and 38.9% of colorectal cancer spending were paid through a combination of Medicare and private insurance. Lung cancer spending was most frequently paid by Medicare (46.0%), closely followed by a combination of Medicare and private insurance (31.6%).
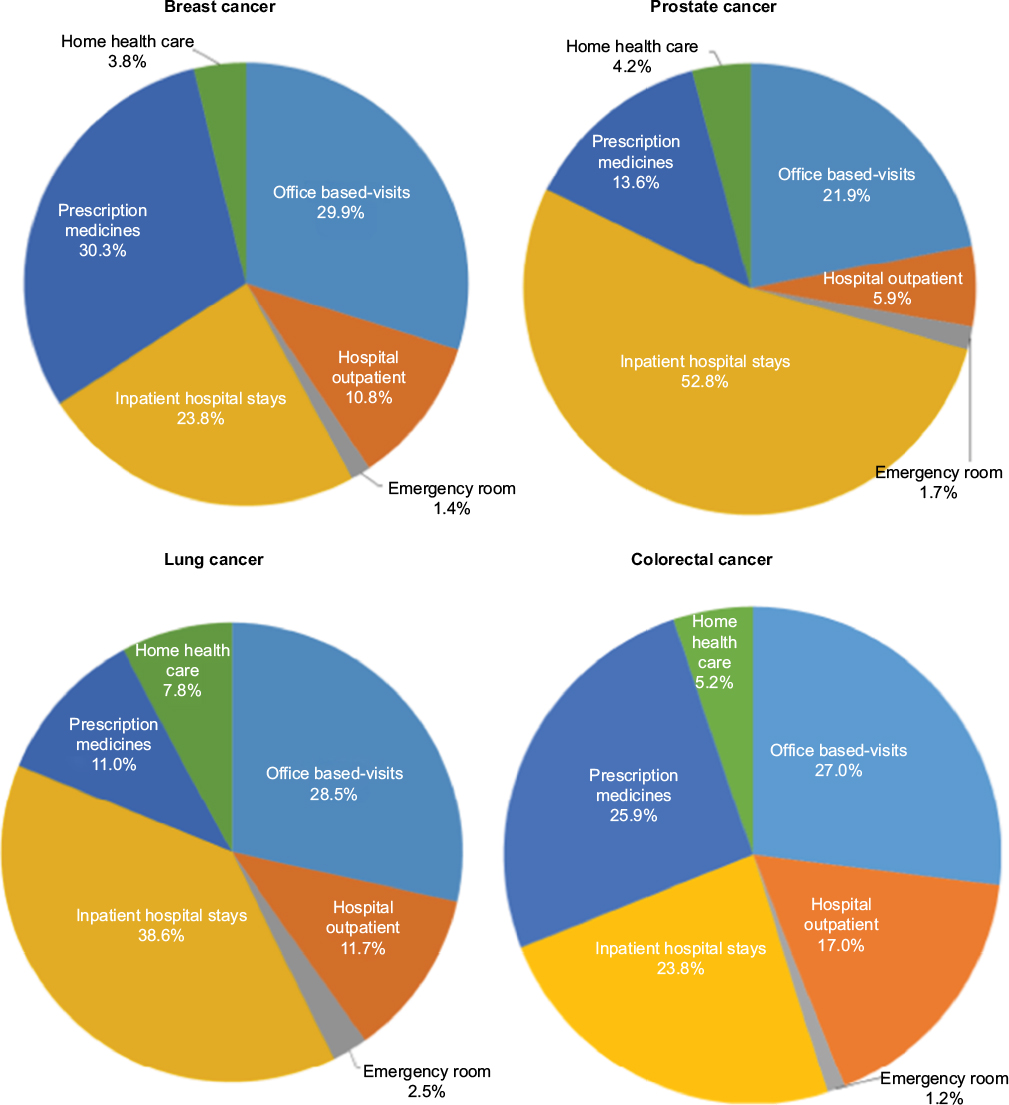 | Figure 2 Annual direct spending by resource category for the four cancers with the highest incidence in the US adult population from the Medical Expenditure Panel Survey (MEPS), 2011. |
Discussion
Although the socioeconomic impact of specific cancers is well recognized, the current analysis provides a population-level evaluation of the epidemiology and burden, especially with regard to health care resource utilization costs, associated with the 11 most common cancers. The cancer burden is dependent upon, at least to some extent, the increasing rate of cancer survival.1,8 The concept of cancer survivorship is evolving as survival rates increase and focus is shifting toward the management and improvement of patient quality of life as an important component of care.9
Several symptoms that likely contribute to quality of life are evaluated in the current analysis including pain, sadness, fatigue, and functional limitations. For these, cancer survivors 40–64 years old reported higher rates, and those ≥65 years old reported the lowest rates except for functional limitations, the rates of which were lowest in those 18–39 years old and may be a consequence of age-related factors. In older cancer survivors, symptoms were present with a similar frequency as those of non-cancer controls. However, reporting of functional limitations was higher in cancer survivors than in non-cancer controls. The similarity in symptoms may not be surprising, given that older age is also associated with a variety of comorbid conditions besides cancer that can have similar affects, potentially attenuating the difference between cancer survivors and non-cancer controls. Our findings agree with previous research of cancer survivors that found poorer health and disability.10
There is a significant comorbidity burden associated with cancer survival across all age groups. Interestingly, several conditions that are generally considered to be age related including musculoskeletal diseases and cardio- and cerebrovascular conditions, such as angina, heart attack, and stroke, had a substantially higher prevalence among 18- to 39-year-old cancer survivors than non-cancer controls. The higher prevalence of these comorbidities in the younger demographic may relate to the observation that cardiovascular disease and cancer share common risk factors or to cancer treatment-related effects.11 In addition, several behavioral risk factors including smoking, lack of exercise, and obesity also have a high prevalence in this age group.
Most behavioral risk factors have a higher prevalence in cancer survivors relative to non-cancer controls regardless of age group. In particular, among cancer survivors who ever smoked, almost half still report being current smokers. Within each age group, we find that current smoking, among ever smokers, is similar in cancer survivors as non-cancer controls similar to other studies.12 A notable exception is alcohol consumption, which is present to a similar extent in the cancer and non-cancer populations. While smoking has been well publicized as a known risk factor for cancer, both obesity and alcohol consumption are associated with specific types of cancer,13,14 with obesity also associated with cancer survival and recurrence.15 The presence of these risk factors suggests that even among cancer survivors, there may be little behavior modification for further reducing downstream risk of cancer.
Despite cancer survival, there is generally poor adherence to cancer screening guidelines which recommended testing every 1–2 years for colorectal (fecal occult blood test), prostate (prostate-specific antigen test), and breast (mammography) cancers.16 For all screening tests, more than half of the cancer survivors report that the duration since their last test exceeded the recommended testing frequency. Adherence rates among cancer survivors were similar to or arguably slightly lower than those among the non-cancer controls, since higher proportions of cancer survivors reported that their most recent tests were ≥5 years ago. Others reported that cancer survivors have higher screening rates than the general population; however, this study examined employed cancer survivors who may reflect a healthier cancer population.17
We have shown that total annual direct spending for cancer is high at an estimated $169 billion. Previous MEPS analyses found that cancer had a significant effect on total medical expenditures and patient time costs of adult survivors, even for longer term survivors.18,19 Annual direct spending varies by cancer type, but the most expensive cancers have both the highest incidence and the highest 5-year relative survival rates. Among the four most common cancers, both health care spending by resource and source of spending varied by the type of cancer. Resource utilization for prostate and lung cancers was driven by inpatient hospitalizations, whereas for breast and colorectal cancers, office-based visits and prescription medications were the two main drivers, which may be a reflection of the increased use of oral treatments.20 The majority of payments are through Medicare or a combination of Medicare and private insurance which is to be expected given the demographics of the cancer population. Although we did not examine productivity losses, a recent publication showed that in addition to excess medical expenditures, nonelderly breast and colorectal survivors experienced greater productivity losses.21
Limitations
Since this is a cross-sectional, observational study, the results presented are unadjusted; therefore, causal inferences cannot be made and all relationships should be considered associative. Additionally, there are potential sample size limitations; for example, breast cancer analyses were limited to women since estimates for male breast cancer are unreliable. Other limitations that should be considered include potential errors in coding or recordkeeping in the clinical databases and recall bias in the general population survey. These analyses focused on the top 11 cancers as determined by the SEER, and therefore may not be generalizable to other tumor types. Finally, while the analysis used the most recent data available, the databases have overlapping years or have different years of data collection, thereby reflecting the inherent challenges in measuring the burden of cancer among US adults.
Conclusion
Cancer is associated with a substantial patient burden resulting from the presence of symptoms and functional impairment, as well as an economic burden because of high direct medical costs. The high survival rate among patients with the most common types of cancer suggests that both the population and the needs of the cancer population will increase. Differences were observed between cancer survivors and non-cancer adults across demographic characteristics, comorbidity burdens, and behavioral risk factors and functional characteristics. These results enhance our understanding of the differences in the health and well-being of adults with cancer, as well as the patterns of health care resource utilization in this population. Furthermore, this study suggests the magnitude of health care spending, which differs across cancers for total costs as well as for cost drivers and sources of payment. Such an understanding represents an initial step toward the goal of informing the development of targeted interventions and policies for appropriate management of cancer patients.
Acknowledgment
This study was sponsored by Pfizer Inc., New York, NY, USA. The abstract of this paper was presented at the ISPOR 19th Annual European Congress as a poster presentation with interim findings. The poster’s abstract was published in “Poster Abstracts” in Value in Health. Available from: http://dx.doi.org/10.1016/j.jval.2016.09.2340.
Disclosure
LI, JM, MH, and GM are employees and shareholders of Pfizer, the sponsor of this study. PC is an employee of Atrium Staffing, who was a paid contractor to Pfizer in the development of this manuscript and data analysis. The authors report no other conflicts of interest in this work.
References
National Cancer Institute. Cancer statistics [updated March 14, 2016]. Available from: http://www.cancer.gov/about-cancer/understanding/statistics. Accessed November 25, 2016. | ||
Brown ML, Lipscomb J, Snyder C. The burden of illness of cancer: economic cost and quality of life. Annu Rev Publ Health. 2001;22:91–113. | ||
Richardson A, Addington-Hall J, Amir Z, et al. Knowledge, ignorance and priorities for research in key areas of cancer survivorship: findings from a scoping review. Br J Cancer. 2011;105 (Suppl 1):S82–S94. | ||
National Cancer Institute. Surveillance Epidemiology and End Results (SEER) Program. SEER*Stat Database: incidence – SEER 9 Regs Research Data, Nov 2014 Sub (1973–2012) <Katrina/Rita Population Adjustment> – Linked to County Attributes – Total U.S., 1969–2013 Counties, National Cancer Institute, DCCPS, Surveillance Research Program, Surveillance Systems Branch, released April 2015, based on the November 2014 submission. Available from: https://seer.cancer.gov/data/. Accessed October 16, 2017. | ||
National Center for Health Statistics, Centers for Disease Control and Prevention. 2013 National Health Interview Survey: public use data release. Available from: ftp://ftp.cdc.gov/pub/Health_Statistics/NCHS/ Dataset_Documentation/NHIS/2013/srvydesc.pdf. Accessed October 16, 2017. | ||
Agency for Healthcare Research and Quality. Medical Expenditure Panel Survey. HC-147 2011 Full year consolidated data file. Agency for Healthcare Research and Quality Center for Financing, Access, and Cost Trends. 2013. Available from: https://meps.ahrq.gov/mepsweb/data_stats/download_data_files_results.jsp?cboDataYear=2013&buttonYearandDataType=1%2CSearch+all+data+files&buttonYearandDataType=Search. Accessed October 16, 2017. | ||
Fritz AY, Percy C, Jack A, et al, editors. International Classification of Diseases for Oncology (ICD-O). 3rd ed. Geneva, Switzerland: World Health Organization; 2000. | ||
de Moor JS, Mariotto AB, Parry C, et al. Cancer survivors in the United States: prevalence across the survivorship trajectory and implications for care. Cancer Epidemiol Biomarkers Prev. 2013;22(4):561–570. | ||
Bell K, Ristovski-Slijepcevic S. Cancer survivorship: why labels matter. J Clin Oncol. 2013;31(4):409–411. | ||
Hewitt M, Rowland JH, Yancik R. Cancer survivors in the United States: age, health, and disability. J Gerontol A Biol Sci Med Sci. 2003;58(1):82–91. | ||
Koene RJ, Prizment AE, Blaes A, Konety SH. Shared risk factors in cardiovascular disease and cancer. Circulation. 2016;133(11):1104–1114. | ||
Bellizzi KM, Rowland JH, Jeffery DD, McNeel T. Health behaviors of cancer survivors: examining opportunities for cancer control intervention. J Clin Oncol. 2005;23(34):8884–8893. | ||
Renehan AG, Tyson M, Egger M, Heller RF, Zwahlen M. Body-mass index and incidence of cancer: a systematic review and meta-analysis of prospective observational studies. Lancet. 2008;371(9612):569–578. | ||
Connor J. Alcohol consumption as a cause of cancer. Addiction. 2017;112(2):222–228. | ||
Demark-Wahnefried W, Platz EA, Ligibel JA, et al. The role of obesity in cancer survival and recurrence. Cancer Epidemiol Biomarkers Prev. 2012;21(8):1244–1259. | ||
American Cancer Society. American Cancer Society guidelines for the early detection of cancer [updated 2016]. Available from: http://www.cancer.org/healthy/findcancerearly/cancerscreeningguidelines/american-cancer-society-guidelines-for-the-early-detection-of-cancer. Accessed November 25, 2016. | ||
Clarke TC, Soler-Vila H, Fleming LE, Christ SL, Lee DJ, Arheart KL. Trends in adherence to recommended cancer screening: the US population and working cancer survivors. Front Oncol. 2012;2:190. | ||
Short PF, Moran JR, Punekar R. Medical expenditures of adult cancer survivors aged <65 years in the United States. Cancer. 2011;117(12):2791–2800. | ||
Yabroff KR, Guy GP Jr, Ekwueme DU, et al. Annual patient time costs associated with medical care among cancer survivors in the United States. Med Care. 2014;52(7):594–601. | ||
Weingart SN, Brown E, Bach PB, et al. NCCN Task Force report: oral chemotherapy. J Natl Compr Cancer Netw. 2008;6 (Suppl 3):S1–S14. | ||
Zheng Z, Yabroff KR, Guy GP Jr, et al. Annual medical expenditure and productivity loss among colorectal, female breast, and prostate cancer survivors in the United States. J Natl Cancer Inst. 2016;108(5). |
 © 2017 The Author(s). This work is published and licensed by Dove Medical Press Limited. The full terms of this license are available at https://www.dovepress.com/terms.php and incorporate the Creative Commons Attribution - Non Commercial (unported, v3.0) License.
By accessing the work you hereby accept the Terms. Non-commercial uses of the work are permitted without any further permission from Dove Medical Press Limited, provided the work is properly attributed. For permission for commercial use of this work, please see paragraphs 4.2 and 5 of our Terms.
© 2017 The Author(s). This work is published and licensed by Dove Medical Press Limited. The full terms of this license are available at https://www.dovepress.com/terms.php and incorporate the Creative Commons Attribution - Non Commercial (unported, v3.0) License.
By accessing the work you hereby accept the Terms. Non-commercial uses of the work are permitted without any further permission from Dove Medical Press Limited, provided the work is properly attributed. For permission for commercial use of this work, please see paragraphs 4.2 and 5 of our Terms.