")
Back to Journals » Diabetes, Metabolic Syndrome and Obesity » Volume 13
The Association of Syntax Score with Levels of Lipoprotein(a) and Inflammatory Biomarkers in Patients with Stable Coronary Artery Disease and Different Low-Density Lipoprotein Cholesterol Levels
Authors Xu W , Guan H, Gao D, Wang Z, Ba Y , Yang H, Shen W, Lian J, Zhou J
Received 5 September 2020
Accepted for publication 29 October 2020
Published 12 November 2020 Volume 2020:13 Pages 4297—4310
DOI https://doi.org/10.2147/DMSO.S279814
Checked for plagiarism Yes
Review by Single anonymous peer review
Peer reviewer comments 2
Editor who approved publication: Professor Ming-Hui Zou
Weifeng Xu,* Haiwang Guan,* Da Gao, Zicheng Wang, Yanna Ba, Hao Yang, Wenjun Shen, Jiangfang Lian, Jianqing Zhou
Department of Cardiology, Ningbo Medical Center Lihuili Hospital, Ningbo 315040, People’s Republic of China
*These authors contributed equally to this work
Correspondence: Jiangfang Lian; Jianqing Zhou
Department of Cardiology, Ningbo Medical Center Lihuili Hospital, Ningbo, People’s Republic of China
Tel +86 13566305960
; +86 13780084909
Email [email protected]; [email protected]
Introduction: Lipoprotein(a) (Lp(a)) is associated with the severity of coronary lesions evaluated using Syntax score in patients with stable coronary artery disease (CAD). However, the effect of low-density lipoprotein cholesterol (LDL-C) levels on the association of Lp(a) levels with Syntax score remains unclear.
Methods: A total of 646 patients with stable CAD were enrolled in the present study. Lp(a) levels were measured with an AU5800 Chemistry Analyzer. Syntax scores were calculated by two advanced interventional cardiologists. SPSS 22.0 was used for statistical analyses.
Results: The concentration of Lp(a) ranged from 1 to 192 mg/dL. Pearson’s correlation analysis showed a positive correlation between Syntax score and the level of Lp(a) (r = 0.108, p = 0.006). The LDL-C ≥ 100 mg/dL group presented with a higher Lp(a) level, 16 (9– 29) vs 13 (7– 24). Pearson’s correlation analysis identified a correlation between Lp(a) level and Syntax score (r = 0.249, p < 0.001) only in the LDL-C ≥ 100 mg/dL group. Multivariate logistic regression analysis revealed the positive predictive value of an Lp(a) level > 30 mg/dL for a Syntax score ≥ 23 only in the LDL-C ≥ 100 mg/dL group, adjusted odds ratio 2.895, p = 0.010. A receiver operating characteristic curve analysis confirmed the predictive value of Lp(a) levels for a Syntax score ≥ 23 in the LDL-C ≥ 100 mg/dL group with a cutoff value for Lp(a) > 30 mg/dL.
Discussion: The association between Lp(a) level and Syntax score was only maintained in the LDL-C ≥ 100 mg/dL group. An Lp(a) level > 30 mg/dL was an independent predictor of a Syntax score ≥ 23 only in the LDL-C ≥ 100 mg/dL group. The effect of LDL-C levels on the association of Lp(a) levels with Syntax score requires further investigations.
Keywords: lipoprotein(a), low-density lipoprotein cholesterol, stable coronary artery disease, syntax score
Atherosclerotic cardiovascular disease (ASCVD) remains the leading cause of death worldwide.1 Stable coronary artery disease (CAD) is usually characterized by repeated episodes of a reversible mismatch in the myocardial oxygen demand and supply. Annual mortality rates of patients with stable CAD range from 1.2% to 2.4%. An individual’s prognosis may vary considerably. A prognostic assessment is important for the management of patients with stable CAD. In general, the outcome is worse in patients with a greater number of diseased vessels, more proximal locations of coronary stenoses, greater severity of lesions, and more extensive ischemia, which is simplified by the Syntax score.2 The Syntax score is a unique tool designed to evaluate the complexity of coronary lesions and to guide the selection of a revascularization strategy in patients with significant multivessel and left main CAD.3 A higher Syntax score predicts a higher incidence of major adverse cardiovascular events among patients with stable CAD.4–6 Lipoprotein(a) (Lp(a)) level is associated with the severity of coronary lesions evaluated using the Syntax score in patients with stable CAD.7,8 A genome-wide association study identified Lp(a)-associated variants that were related to Syntax score in Han Chinese patients with stable CAD.9 Additionally, an elevated Lp(a) level is associated with an increased risk of cardiovascular events.10 The amount of low-density lipoprotein cholesterol (LDL-C) contained in Lp(a) was calculated. However, the effect of LDL-C on the association of Lp(a) levels with Syntax score in patients with stable CAD remained unclear. The monocyte to high-density lipoprotein cholesterol ratio (MHR) was reported to be related to coronary lesion severity and future cardiovascular events in patients with acute coronary syndrome (ACS).11 The systemic immune-inflammation index (SII) was reported to be related to the clinical outcomes of patients with CAD.12 However, the relationships between Lp(a) levels and the MHR and SII remains unclear. The present study aimed to investigate the specific association of Lp(a) levels with Syntax score in patients with different LDL-C levels and to determine its relationships with the MHR and SII.
Methods
Consecutive patients presenting with stable angina pectoris or angina-equivalent symptoms who underwent coronary angiography (CAG) at Ningbo Medical Center Lihuili Hospital between February 2017 and July 2018 were enrolled in this retrospective study. CAG procedures were successful in all patients. Patients without ≥50% stenosis in the epicardial coronary arteries were excluded. Patients with a recent diagnosis of ST-elevation myocardial infarction (STEMI) or non-ST-elevation acute coronary syndrome (NSTE-ACS) (≤12 months before the CAG procedure), prior percutaneous coronary intervention (PCI), prior coronary artery bypass grafting (CABG), severe renal insufficiency (creatinine clearance rate ≤ 60 mL/min·1.73 m2), serious liver dysfunction (alanine aminotransferase (ALT) or aspartate aminotransferase (AST) > 3x upper limits of normal), or thyroid disease were excluded.
This study was conducted in accordance with the Declaration of Helsinki and was approved by the ethics committee of Ningbo Medical Center Lihuili Hospital. A written informed consent was obtained from each participant.
All detailed clinical, biochemical, and angiographic data were retrospectively collected for the entire study population, including age, sex, history of hypertension (HTN) and diabetes mellitus (DM), current smoking status, family history of early-onset CAD, systolic blood pressure (SBP), diastolic blood pressure (DBP), and prior medications used, including angiotensin-converting enzyme inhibitors (ACEIs)/angiotensin receptor blockers (ARBs), calcium channel blockers (CCBs), beta-blockers, diuretics, statins, and antiplatelet agents. HTN was defined as SBP ≥140 mmHg and/or DBP ≥90 mmHg in repeated measurements or the current use of anti-hypertensive medicine. DM was defined as a fasting blood glucose (FBG) level ≥126 mg/dL or random blood glucose level ≥ 200 mg/dL in repeated measurements, or the current use of anti-diabetes medicine. A current smoker was defined someone who smoked a minimum of 10 cigarettes a day. A family history of CAD was defined as a history of early-onset CAD or sudden cardiac death in a first-degree relative younger than 55 years of age for men and 65 years of age for women.
Blood samples were obtained from the antecubital vein of each patient after a 12-hour overnight fast. The levels of biochemical parameters, including albumin (ALB), ALT, AST, gamma-glutamyl transferase (GGT), total bilirubin (TBIL), FBG, serum creatinine (Scr), uric acid (UA), high-sensitivity C-reactive protein (hsCRP), triglyceride (TG), total cholesterol (TC), LDL-C, high-density lipoprotein cholesterol (HDL-C) and Lp(a) were measured with an AU5800 Chemistry Analyzer (Beckman Coulter K.K, Tokyo, Japan). Complete blood count parameters with differential analysis, including white blood cell (WBC), neutrophils (NEU), monocyte (MON), lymphocyte (LYM), hemoglobin (HGB) and platelet (PLT), was measured with an automated DxH 800 hematology analyzer (Beckman Coulter Inc., California, USA). MHR was calculated by dividing the MON count by HDL-C level. SII was calculated as follows: PLT×NEU/LYM. Echocardiography was performed on all participants, and Simpson’s method was used to measure the left ventricular ejection fraction (LVEF).
Angiographic data were obtained from coronary angiography with the standard Judkins technique via radial or femoral access. The right and left coronary arteries were evaluated by capturing ≥2 orthogonal plane images with a Philips Allura Xper FD10 cardiovascular X-ray system (Philips Healthcare/Philips Medical Systems BV, Eindhoven, The Netherlands). CAD was defined as at least 1 lesion with a ≥ 50% diameter stenosis of an epicardial coronary artery. The Syntax score was calculated by two advanced interventional cardiologists for each lesion with ≥50% diameter stenosis in each epicardial vessel ≥1.5 mm using the Syntax score calculator 2.28 (available online at www.SYNTAXscore.com).
SPSS 22.0 (SPSS Inc., Chicago, IL, USA) was used for statistical analyses. Categorical variables are reported as numbers and percentages and differences were analyzed using the chi-square test. Continuous variables are reported as means ± standard deviations (SD) or medians (interquartile ranges), depending on the results of Kolmogorov–Smirnov test for a normal distribution. Student’s t-test or one-way ANOVA was used for continuous variables with a normal distribution; the Mann–Whitney U-test or Kruskal–Wallis test was used for continuous variables without a normal distribution. Pearson’s correlation test was used to evaluate the relationship between variables. Univariate and multivariate logistic regression analyses were used to determine the independent predictors of Lp(a) levels >30 mg/dL and a Syntax score ≥23; confounding factors were defined as age, sex, HTN, DM, current smoker, family history of CAD, SBP, DBP, ALB, ALT, AST, GGT, TBIL, FBG, Scr, UA, hsCRP, WBC, HGB, PLT, LVEF, and prior use of ACEIs/ARBs, CCBs, beta-blockers, diuretics, statins or antiplatelet agents. A receiver operating characteristic (ROC) curve was constructed to identify the sensitivity and specificity of Lp(a) levels for predicting a Syntax score ≥23 when LDL-C ≥100 mg/dL and when LDL-C < 100 mg/dL. P < 0.05 was considered statistically significant.
Results
A total of 646 patients with stable CAD (422 males, mean age of 63.6±10.1 years) were enrolled in this study. The concentration of Lp(a) ranged from 1 to 192 mg/dL (median 14 mg/dL, interquartile range 7 to 25 mg/dL). The clinical, biochemical, and angiographic characteristics of the study population stratified according to the Lp(a) level are shown in Table 1. Patients with Lp(a) >30 mg/dL had a higher Syntax score, higher TC and LDL-C levels, and a higher prevalence of HTN. The incidence of triple vessel disease and a Syntax score ≥23 was significantly higher in the Lp(a) >30 mg/dL group. Differences in MHR, SII, and hsCRP levels were not observed between the two groups. Pearson’s correlation analysis showed a positive correlation between Syntax score and Lp(a) levels (r = 0.108, p = 0.006), hsCRP levels (r = 0.174, p < 0.001), MHR (r = 0.210, p < 0.001), and SII (r = 0.184, p < 0.001) (Figure 1). In contrast, Lp(a) levels were not correlated with hsCRP levels (r = −0.018, p = 0.657), MHR (r= −0.005, p = 0.903), or SII (r = 0.019, p = 0.632) (Figure 2).
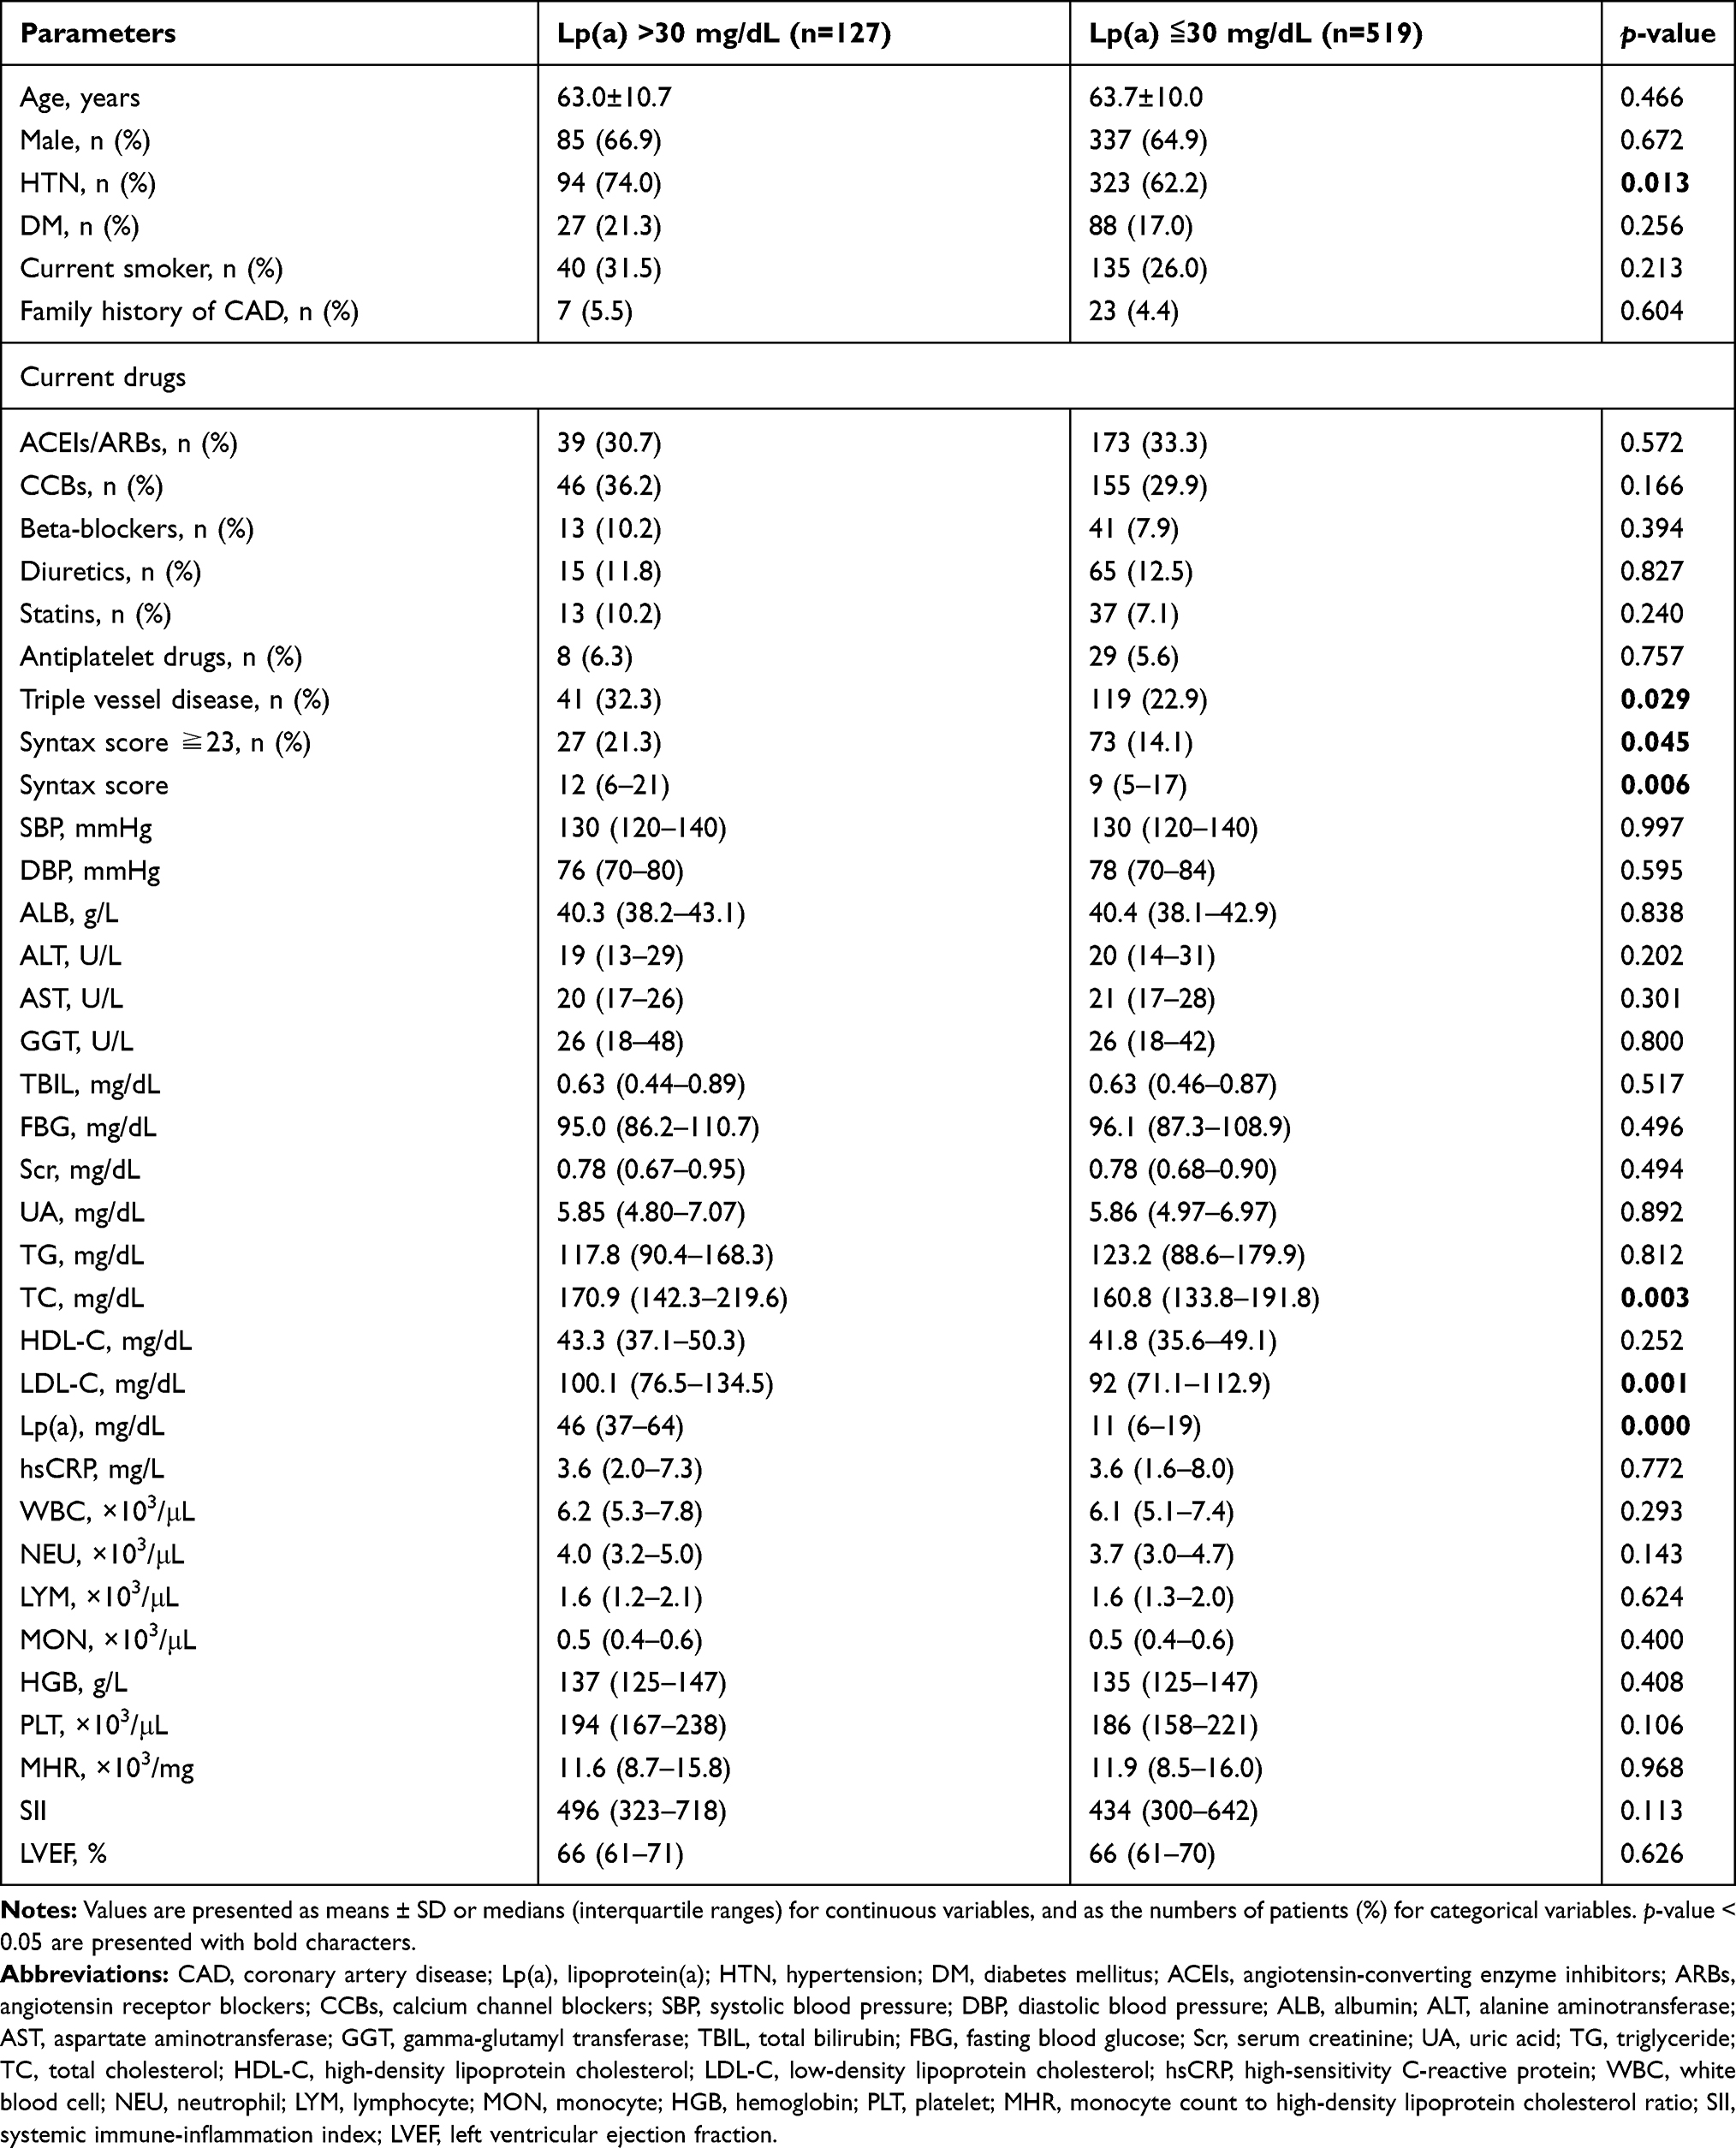 |
Table 1 Clinical, Biochemical and Angiographic Characteristics of Patients with Stable CAD in the Lp(a) >30 mg/dL Group and in Lp(a) ≦30 mg/dL Group |
 |
Figure 1 Scatter/dot graphs showing positive correlations between the Syntax score and Lp(a) levels (A), hsCRP levels (B), MHR (C) and SII (D) in patients with stable CAD. |
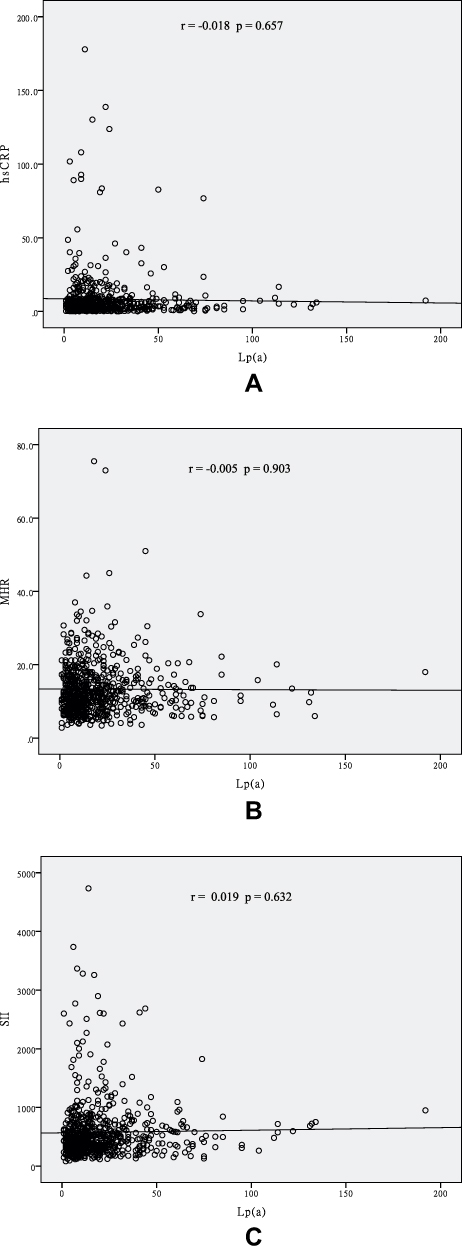 |
Figure 2 Scatter/dot graphs showing that Lp(a) levels were not correlated with hsCRP levels (A), MHR (B) and SII (C) in patients with stable CAD. |
Patients were divided into two groups according to the concentration of LDL-C: LDL-C ≥ 100 mg/dL (n=268, 41.5%) and LDL-C < 100 mg/dL (n=378, 58.5%). Clinical, biochemical, and angiographic characteristics of both groups are presented in Table 2. The LDL-C ≥100 mg/dL group showed significantly higher Lp(a) levels, 16 (9–29) vs 13 (7–24), accompanied by a higher prevalence of triple vessel disease and a trend toward a higher incidence of Syntax score ≥23. The patients in the LDL-C ≥100 mg/dL group were younger, had higher SBP and DBP, higher levels of ALB, ALT, GGT, FBG, UA, TG, TC, HDL-C, LDL-C, hsCRP, WBC, LYM, HGB, and PLT, and a lower LVEF. Patients in the LDL-C ≥100 mg/dL group were more likely to be treated with diuretics and have a family history of CAD but were less likely to be taking statins and antiplatelet drugs.
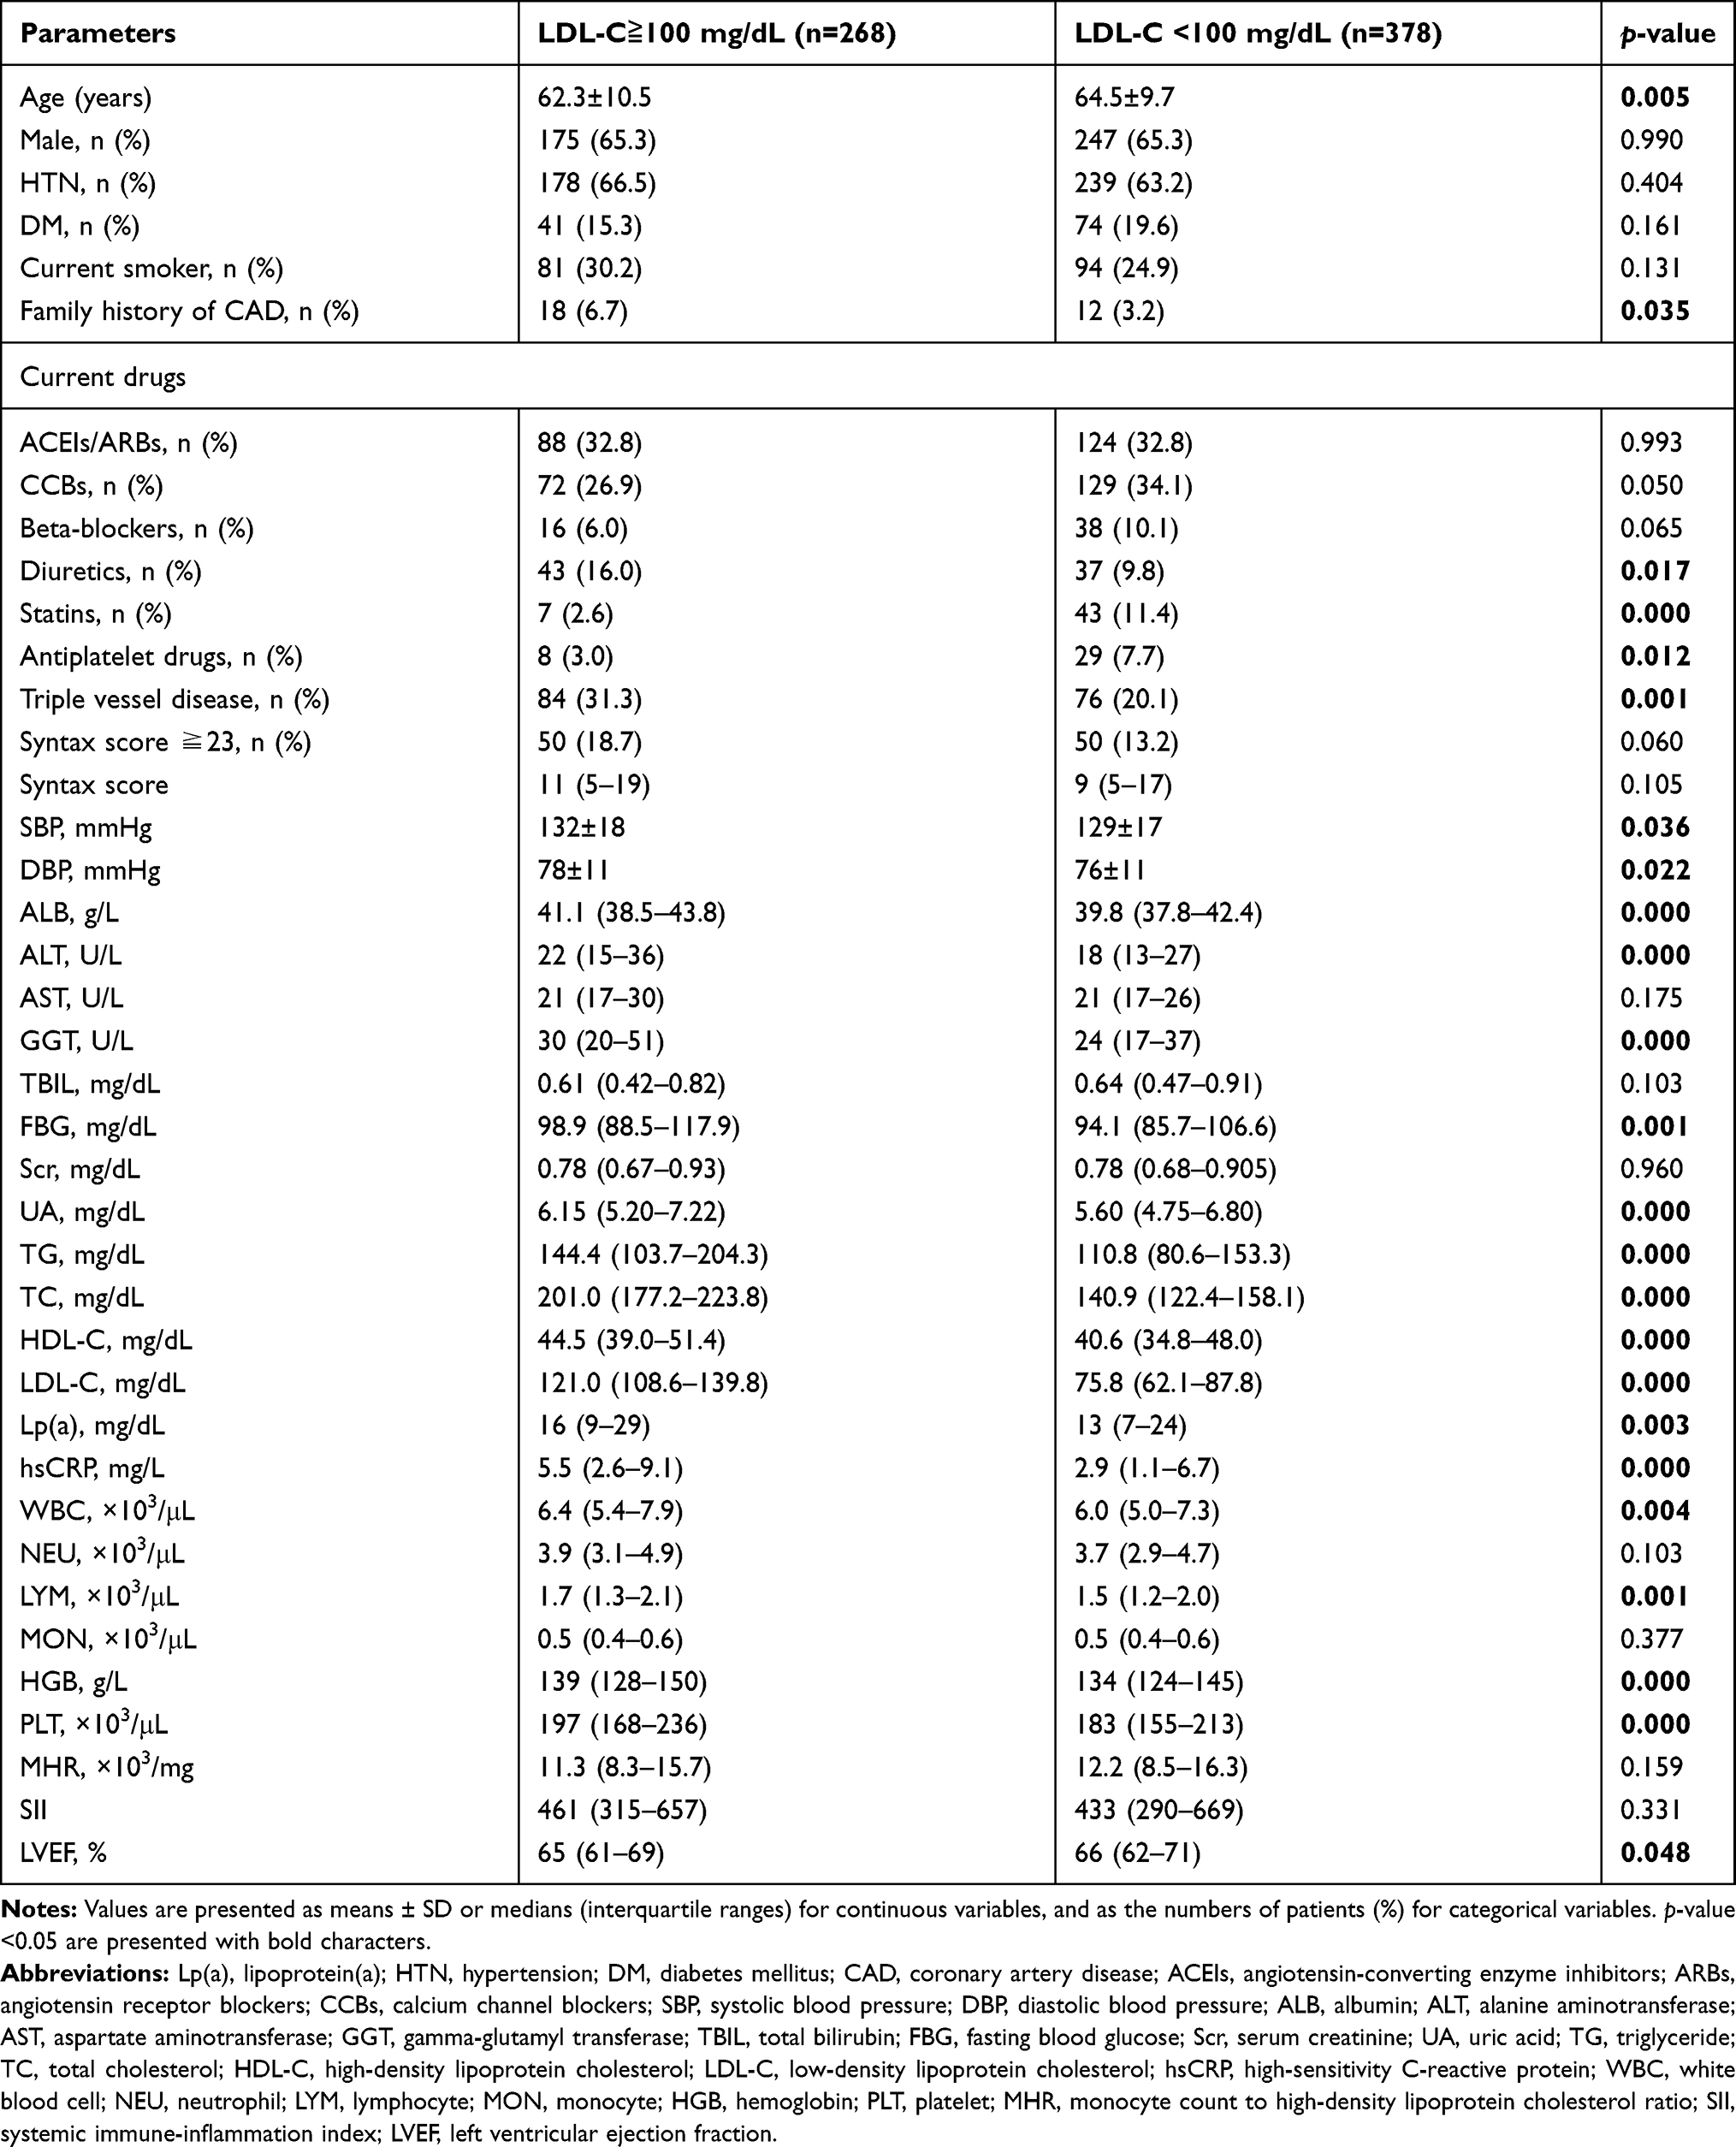 |
Table 2 Clinical, Biochemical and Angiographic Characteristics of Patients with Stable CAD in the LDL-C ≧100 mg/dL Group and LDL-C <100 mg/dL Group |
The clinical, biochemical, and angiographic characteristics of patients in the LDL-C ≥100 mg/dL group, stratified according to Lp(a) level, are presented in Table 3. Patients in the Lp(a) >30 mg/dL group had a higher Syntax score, higher TC and LDL-C levels, and a higher prevalence of HTN. These patients were more likely to have triple vessel disease, a Syntax score ≥23, and to be treated with statins. Pearson’s correlation analysis identified correlations between Lp(a) and LDL-C level (r = 0.258, p < 0.001) (Figure 3A) and Syntax score (r = 0.249, p < 0.001) (Figure 4A) in the LDL-C ≥100 mg/dL group. As shown in Table 4, the multivariate logistic regression analysis revealed a positive predictive value of an Lp(a) level >30 mg/dL for a Syntax score ≥23 in the LDL-C ≥ 100 mg/dL group after adjustment for confounding factors, adjusted OR 2.895 [95% CI 1.286–6.518], p = 0.010. The ROC curve analysis confirmed the predictive value of the Lp(a) level for a Syntax score ≥ 23 in the group with LDL-C ≥100 mg/dL. Using a cutoff value of 30 mg/dL, the sensitivity was 44.0% and specificity was 79.8%, with an area under the curve (AUC) of 0.630 (95% CI 0.536–0.724), p = 0.004 (Figure 5A).
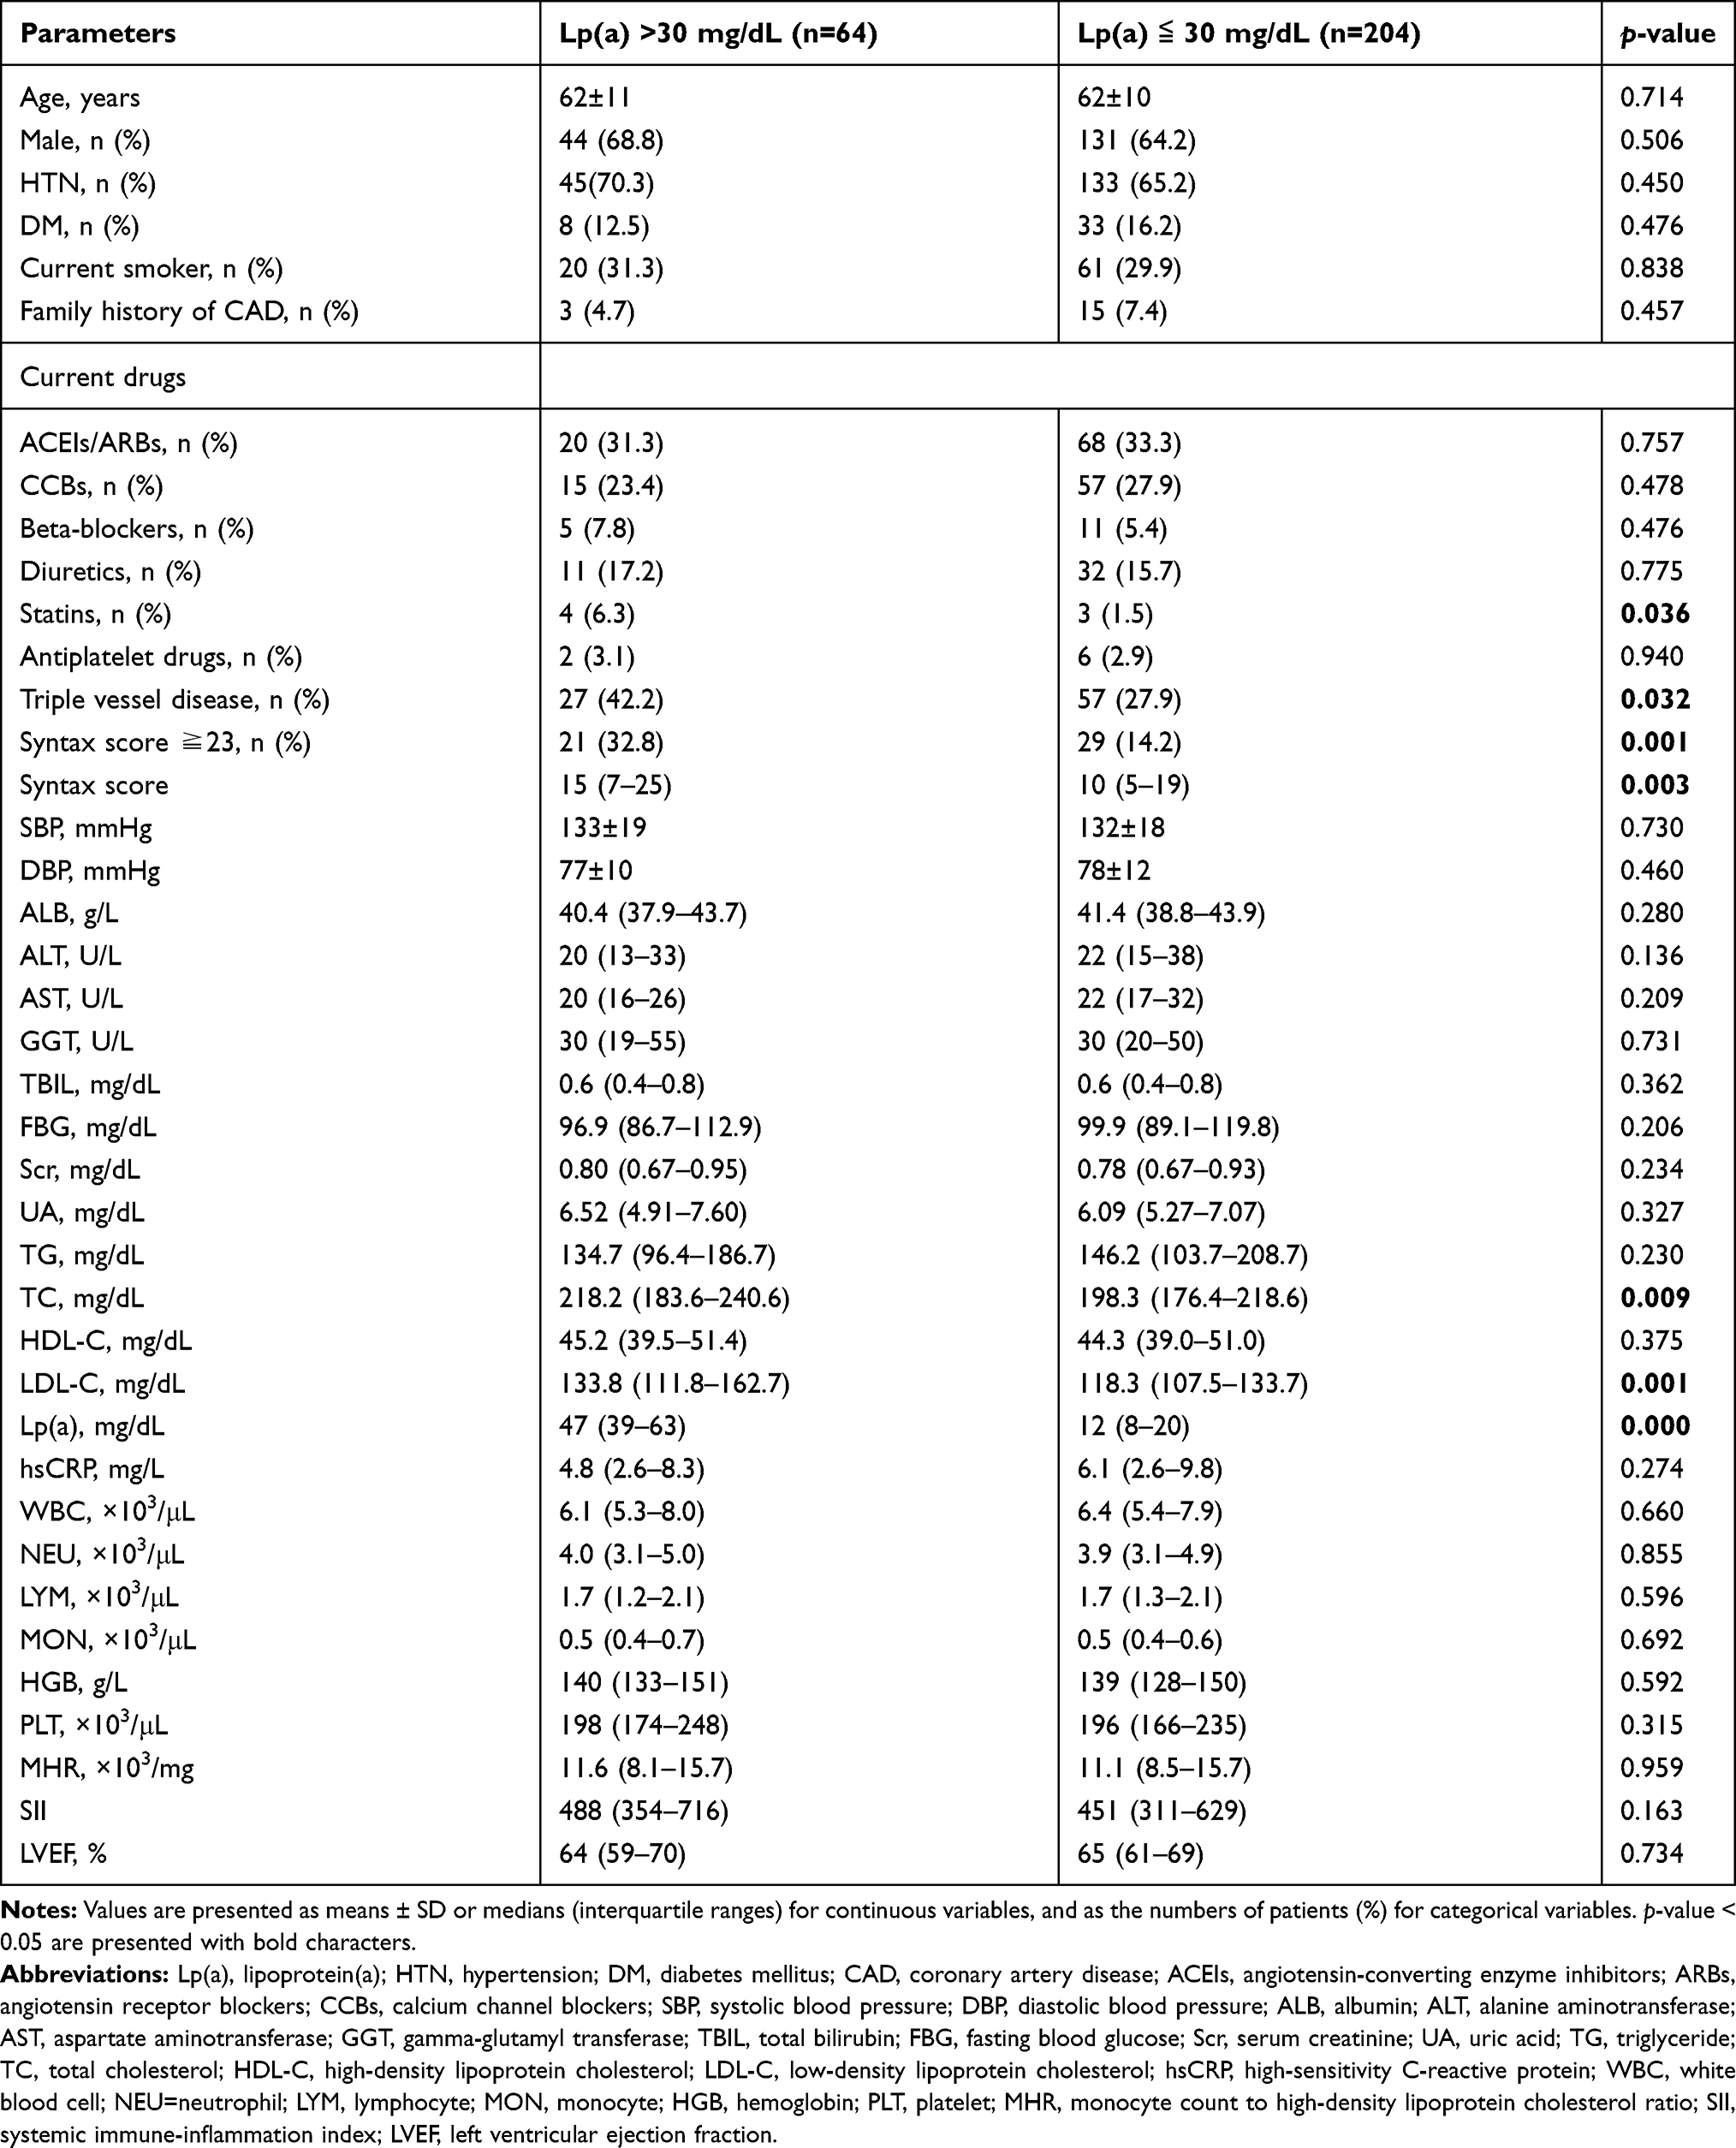 |
Table 3 Clinical, Biochemical and Angiographic Characteristics of the Lp(a) >30 mg/dL Subgroup and Lp(a) ≦ 30 mg/dL Subgroup in the LDL-C ≧100 mg/dL Group |
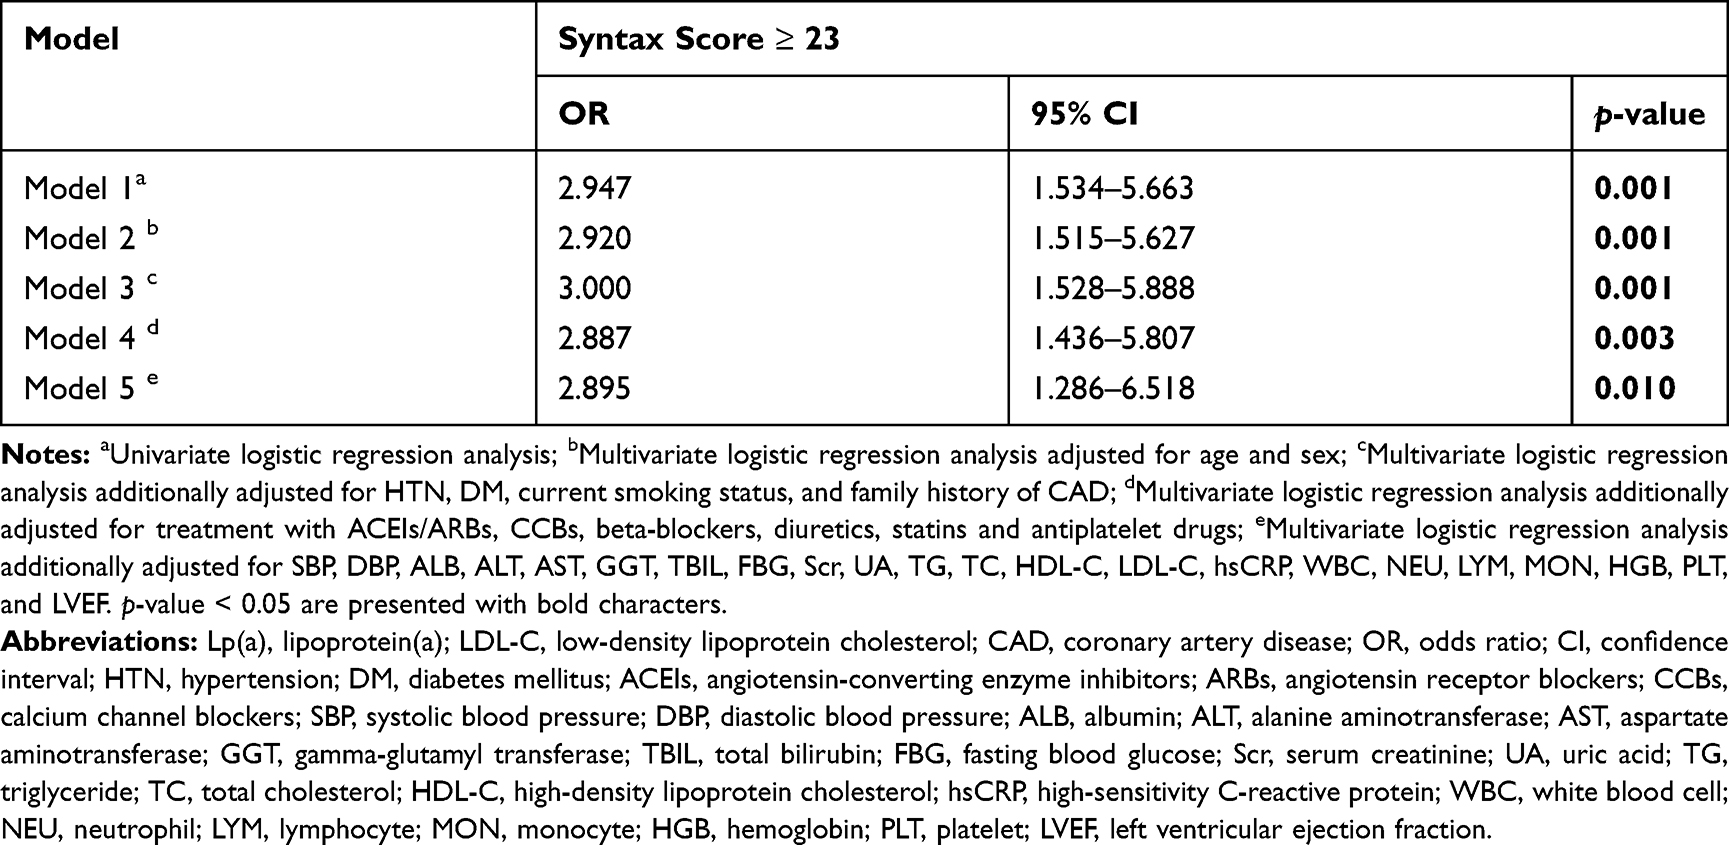 |
Table 4 Univariate and Multivariate Logistic Regression Analyses Showing the Ability of an Lp(a) Level >30 mg/dL to Predict a Syntax Score ≥23 in the LDL-C ≧100 mg/dL Group |
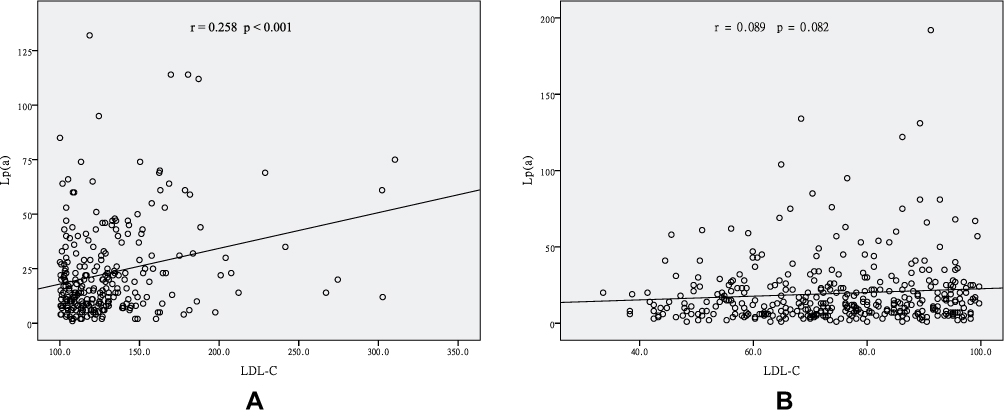 |
Figure 3 Scatter/dot graphs showing a positive correlation between LDL-C and Lp(a) levels in the LDL-C ≧100 mg/dL group (A), but not in the LDL-C <100 mg/dL group (B). |
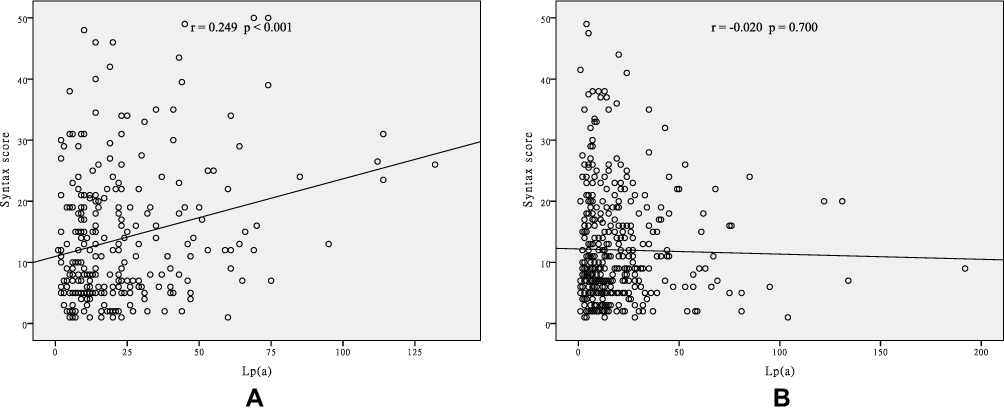 |
Figure 4 Scatter/dot graphs showing a positive correlation between Lp(a) levels and the Syntax score in the LDL-C ≧100 mg/dL group (A), but not in the LDL-C <100 mg/dL group (B). |
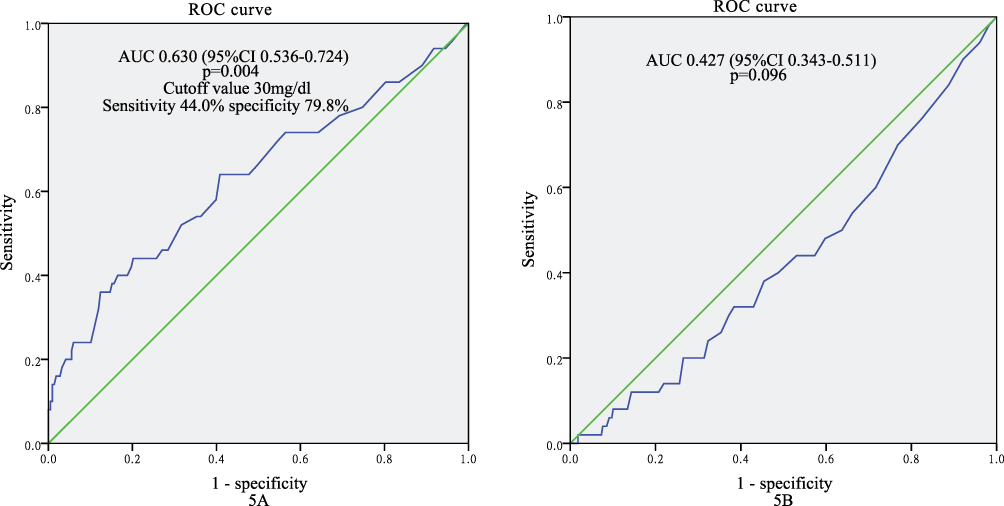 |
Figure 5 ROC curves showing the ability of an Lp(a) cutoff value of 30 mg/dL to predict a Syntax score≥ 23 with a sensitivity of 44.0% and specificity of 79.8% in the LDL-C ≧ 100 mg/dL group (A), but not in the LDL-C <100 mg/dL group (B). |
The clinical, biochemical, and angiographic characteristics of patients in the group with LDL-C <100 mg/dL, stratified according to Lp(a) level, are presented in Table 5. Patients with Lp(a) > 30 mg/dL were more likely to have HTN, DM, and be treated with CCBs. The prevalence of triple vessel disease and a Syntax score ≥23 was similar in the Lp(a) >30 mg/dL and Lp(a) ≤30 mg/dL groups. A significant difference in Syntax score was not observed between the Lp(a) >30 mg/dL and Lp(a) ≤30 mg/dL groups. Pearson’s correlation analysis showed that Lp(a) levels were not correlated with LDL-C levels (r = 0.089, p = 0.082) (Figure 3B) or Syntax score (r = −0.020, p = 0.700) (Figure 4B) in the LDL-C <100 mg/dL group. The multivariate logistic regression analysis did not show a predictive value of Lp(a) levels >30 mg/dL for a Syntax score ≥23 in the LDL-C <100 mg/dL group, as shown in Table 6, nor did the ROC curve analysis identify a predictive value of Lp(a) levels for a Syntax score ≥23 (Figure 5B).
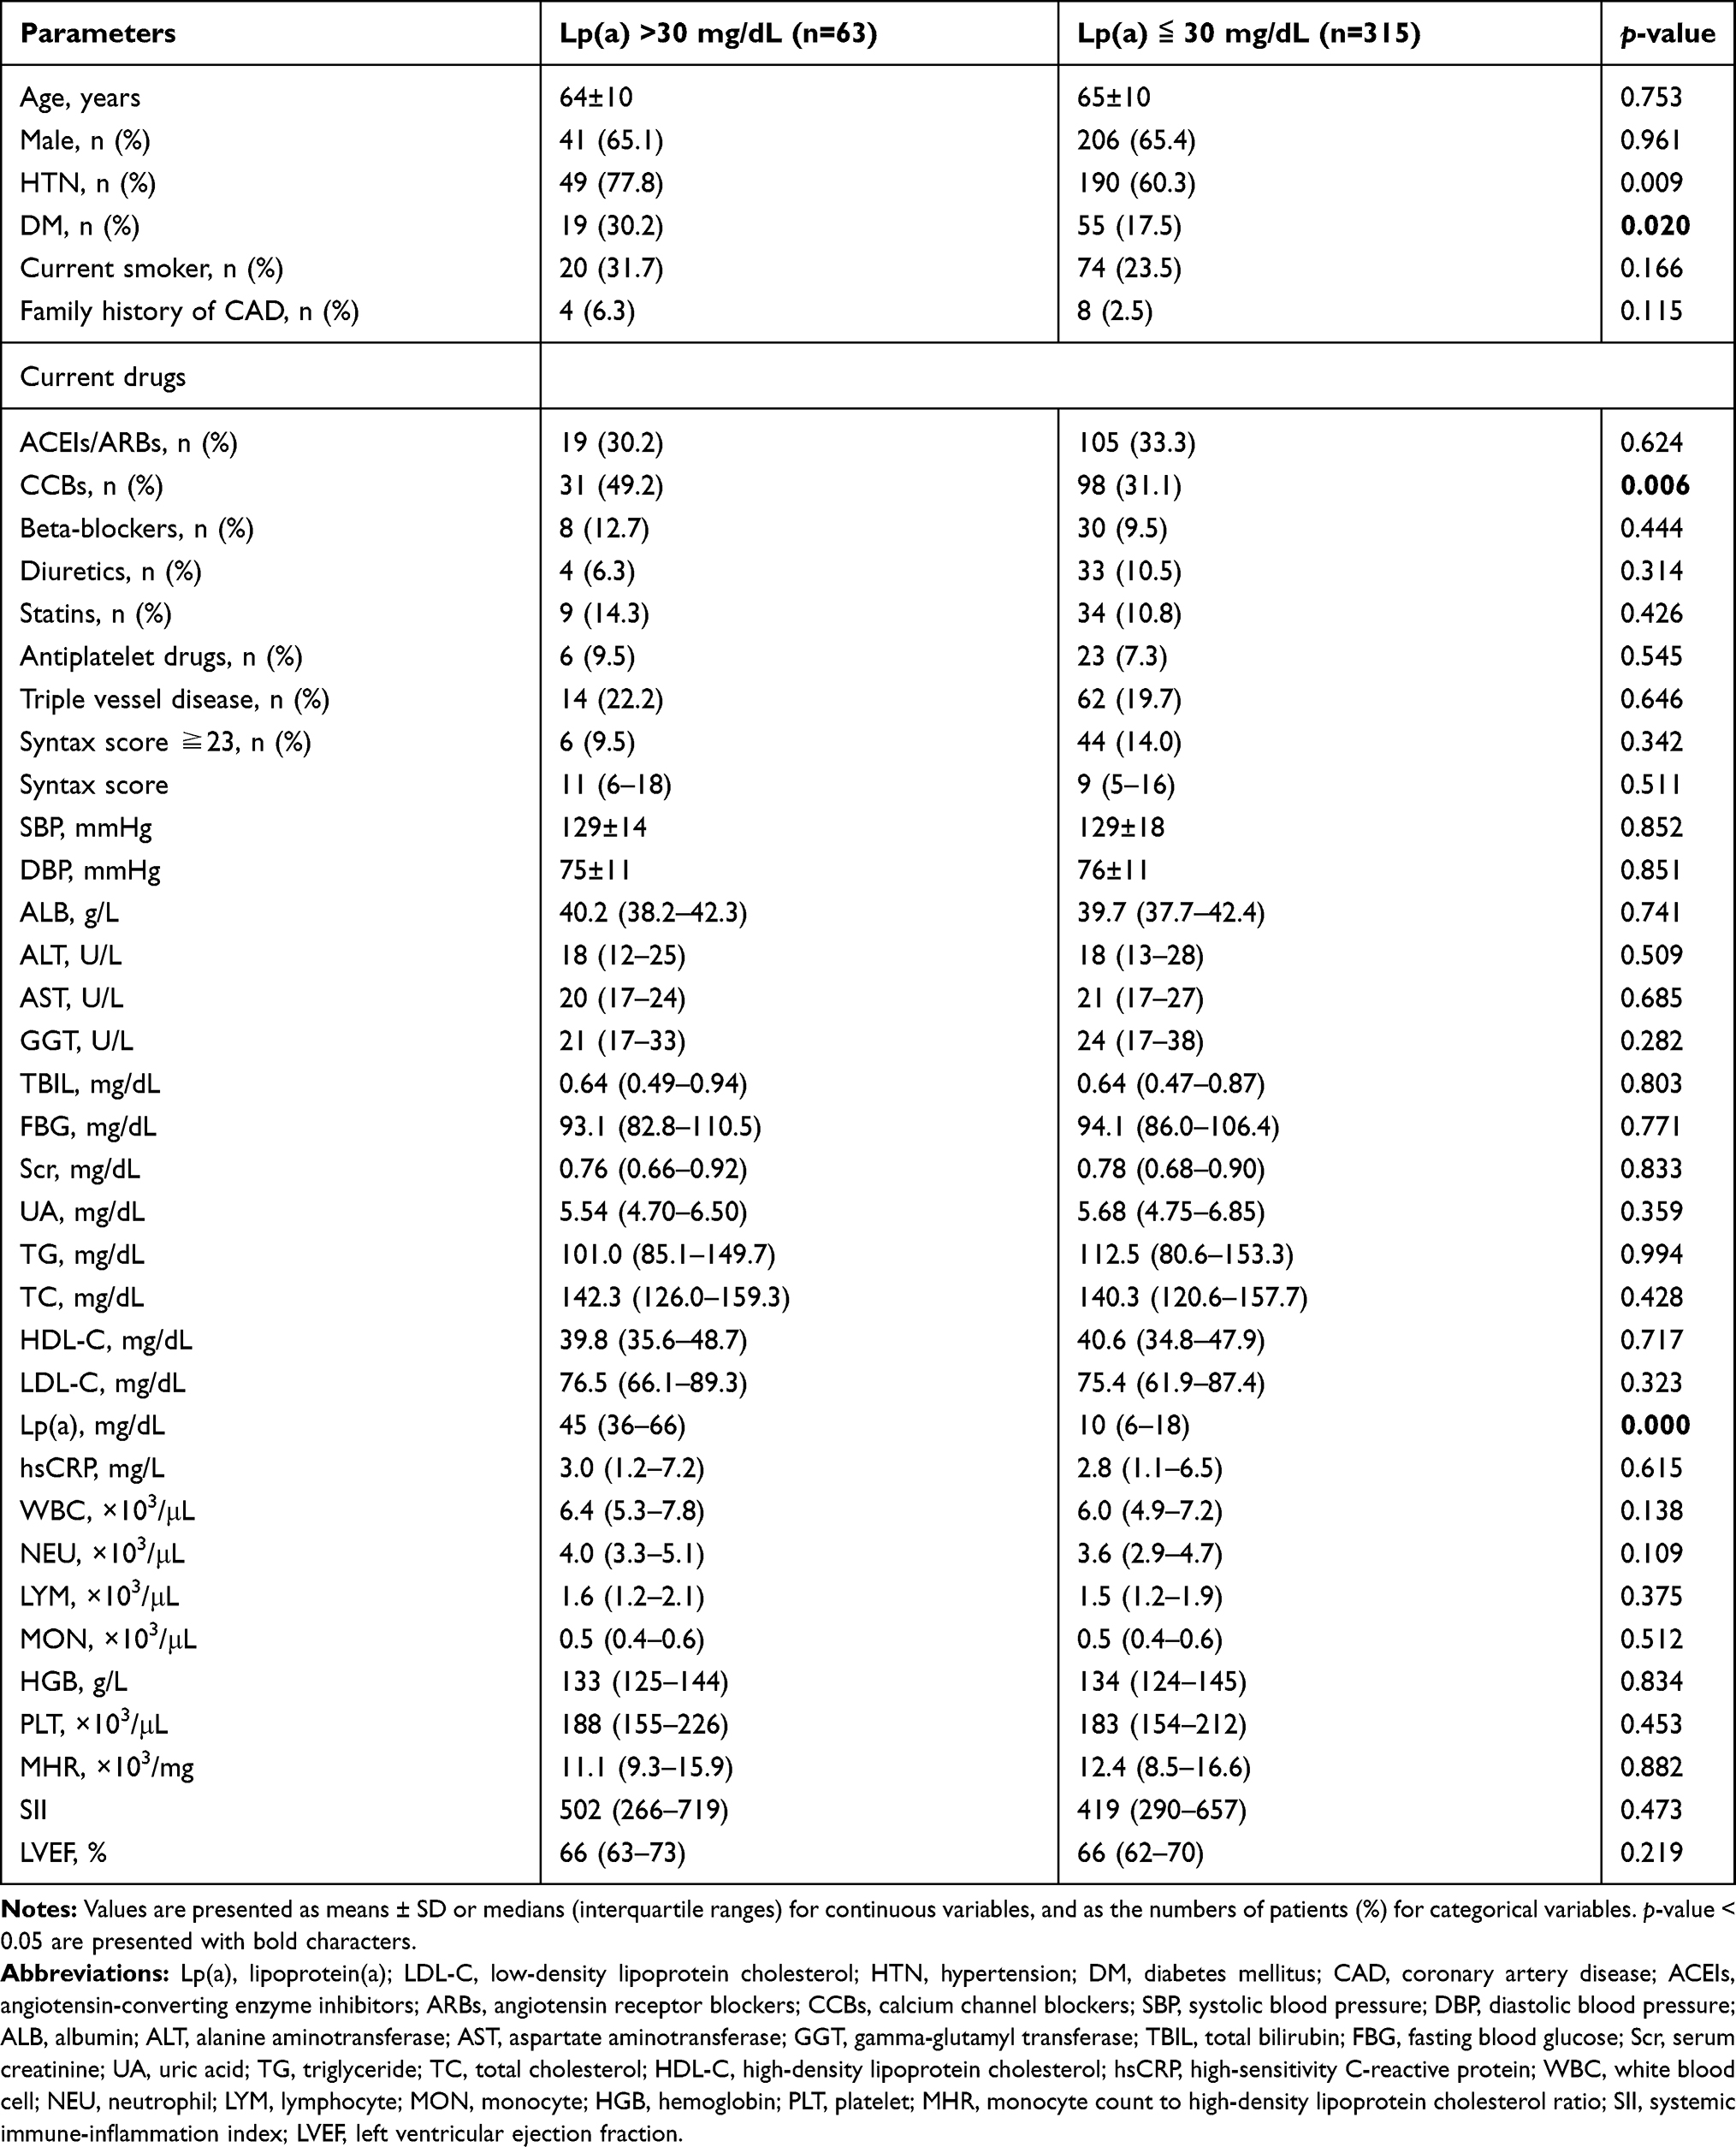 |
Table 5 Clinical, Biochemical and Angiographic Characteristics of the Lp(a) >30 mg/dL Subgroup and Lp(a) ≦30 mg/dL Subgroup in the LDL-C <100 mg/dL Group |
 |
Table 6 Univariate and Multivariate Logistic Regression Analyses Showing No Predictive Value of an Lp(a) Level>30 mg/dL for a Syntax Score ≥23 in the LDL-C <100 mg/dL Group |
Discussion
Our study demonstrated that significantly higher Lp(a) levels were detected in the LDL-C ≥100 mg/dL group than in the LDL-C <100 mg/dL group. Lp(a) levels were positively correlated with LDL-C level and Syntax score, consistent with the results of several previous studies.7–9 When patients were stratified according to LDL-C level, the Lp(a) level was only associated with Syntax score in the LDL-C ≥100 mg/dL group. Lp(a) levels were not associated with the levels of inflammatory biomarkers, including hsCRP levels, MHR, and SII.
Lipid disorder is a major risk factor for ASCVD. It has been divided into 4 “clinical” categories: elevated LDL-C levels, low HDL-C levels, elevated TG levels, and elevated Lp(a) levels. Lp(a) carries all the atherogenic risk of LDL particles and is more atherogenic than LDL. In addition to the proatherogenic components of LDL-C, Lp(a) contains apolipoprotein(a) (apo(a)). Apo(a) potentiates atherothrombosis by inducing inflammation through its content of oxidized phospholipids, which facilitate its accumulation in the arterial wall. Coronary lesions from human subjects with sudden death showed a progressive increase in Lp(a) level as lesions progressed, with the highest levels observed in ruptured plaques. Genetic studies showed a potent and linear increase in the risk of patients with highly elevated Lp(a) levels compared with patients with low levels.13 In subjects at intermediate risk, based on the Framingham and Reynolds risk scores, the addition and inclusion of Lp(a) levels to these risk scores enabled the reclassification of 40% of individuals into either lower or higher risk categories.14 A large meta-analysis identified continuous, independent, and modest associations of Lp(a) concentration with risk of CAD and stroke.15 An Lp(a) level >30 mg/dL is considered elevated and is recommended to be a risk factor for ASCVD by the 2016 Canadian Cardiovascular Society Guidelines for the Management of Dyslipidemia.16 As shown in the present study, 20% (127/646) of the participants had an elevated Lp(a) level, defined as >30 mg/dL, which is lower than the proportion (30–40%) reported in other studies and may be attributed to differences in the study population. Patients with ACS have a significantly higher Lp(a) level than patients with stable CAD, and a higher Lp(a) level is associated with more complex coronary lesions evaluated using the Gensini score.17,18 The Syntax score was developed as a tool to grade the complexity and severity of CAD and to guide the selection of revascularization strategy in patients with multivessel and left main CAD.3 Previous studies have categorized the SYNTAX score to identify patients as low (≤22) or medium/high (≥23). Lp(a) level is associated with Syntax score in several studies of Australian, Chinese, and Indian populations, consistent with the results of our study.7–9,19
The cholesterol content of Lp(a) is included in the LDL-C measurement, and some studies have shown that strategies that lower LDL-C levels attenuate or even eliminate the risk attributable to elevated Lp(a) levels.20,21 Thus, the association of Lp(a) levels with Syntax score must be examined in patients with various LDL-C levels. US population studies suggest an optimal LDL-C level is about 100 mg/dL. As shown in our study, a significantly higher Lp(a) concentration was observed in patients with LDL-C ≥100 mg/dL than LDL-C <100 mg/dL, and an LDL-C level ≥100 mg/dL was an independent predictor of an Lp(a) level >30 mg/dL. Lp(a) levels were positively correlated with Syntax score when LDL-C ≥100 mg/dL, but not when LDL-C <100 mg/dL. After adjustment for confounding factors, including medications, biochemical parameters, and LVEF, Lp(a) levels >30 mg/dL remained an independent predictor of a Syntax score ≥23 in the LDL-C ≥100 mg/dL group. However, the predictive value of Lp(a) level >30 mg/dL for Syntax score ≥23 was eliminated when LDL-C <100 mg/dL. Lp(a) is composed of 30–45% cholesterol by mass, which is part of the “LDL-C” level calculated using various methods in most laboratories. The calculated “LDL-C” level not only reflects LDL-C but also the cholesterol part of Lp(a), particularly in patients with ASCVD. Researchers have not yet determined whether the content of Lp(a)-cholesterol as a percentage of Lp(a) mass remains constant with decreasing LDL-C levels.22 Based on the findings from our study, the relationship between Lp(a) and LDL-C levels differed among patients with various LDL-C levels. This finding may partially explain the differences in the association of Lp(a) levels with Syntax score when LDL-C ≥100 mg/dL compared with LDL-C <100 mg/dL. The use of Lp(a) levels as a predictor of a high Syntax score in patients with stable CAD may be limited to patients with an LDL-C level ≥100 mg/dL.
Inflammation was identified as another cause of the initiation and progression of atherosclerosis.23 The hsCRP levels, MHR and SII are all nonspecific markers of inflammation. They were simultaneously correlated with Syntax score in our study. CRP is released by hepatocytes during infection or damaged vascular smooth muscle cells in atherosclerotic plaques. Based on robust evidence, CRP levels are associated with ASCVD events24 and are measured using the hsCRP assay. The hsCRP level has been reported to be associated with Syntax score.25–27 MHR was initially discovered to be associated with cardiovascular outcomes and was identified as an independent predictor of major adverse cardiovascular events in patients with chronic kidney disease.28 The positive correlation of MHR with Syntax score in patients with stable CAD has been identified in several studies.29–31 SII is an inflammation-related indicator that integrates neutrophil, platelet, and lymphocyte counts and predicts the outcomes of patients with CAD.12,32 Nevertheless, the Lp(a) level was not associated with hsCRP levels, MHR, or SII, indicating that Lp(a) employs a distinct mechanism to exacerbate atherosclerosis that is not completely attributable to inflammation.
Our study had several limitations. First, as an observational study, our study was susceptible to confounding factors, which may influence the association of Lp(a) levels with Syntax score; second, the Lp(a) concentration was only measured once in each patient, and it was detected as mass concentration but not particle concentration. Therefore, variations in molecular weights might over or underestimate the real concentrations of Lp(a). Finally, this study was performed at a single center, and the sample size maybe not be sufficiently large to draw a definite conclusion. A prospective study with a larger sample size is warranted to confirm the findings of our study.
In conclusion, the Syntax score was correlated with the levels of Lp(a) and inflammatory biomarkers, including hsCRP, MHR, and SII in patients with stable CAD. Lp(a) levels were correlated with LDL-C levels, but not hsCRP, MHR, or SII. Furthermore, the association between Lp(a) levels and Syntax score was only maintained in the group of patients with LDL-C ≥100 mg/dL. An Lp(a) level >30 mg/dL was an independent predictor of a Syntax score ≥23, but only when LDL-C ≥100 mg/dL. The value of Lp(a) levels in predicting the severity of diseased coronary vessels and the effect of LDL-C levels on the association of Lp(a) levels with Syntax score require more extensive investigations.
Acknowledgments
We thank International Science Editing for editing this manuscript. Weifeng Xu and Haiwang Guan re co-first authors for this study.
Disclosure
The authors have no conflicts of interest to disclose.
References
1. Arnett DK, Blumenthal RS, Albert MA, et al. 2019 ACC/AHA guideline on the primary prevention of cardiovascular disease: executive summary: a report of the american college of cardiology/american heart association task force on clinical practice guidelines. J Am Coll Cardiol. 2019;74(10):1376–1414. doi:10.1016/j.jacc.2019.03.009
2. Montalescot G, Sechtem U, Achenbach S, et al. 2013 ESC guidelines on the management of stable coronary artery disease: the Task Force on the management of stable coronary artery disease of the European Society of Cardiology. Eur Heart J. 2013;34(38):2949–3003.
3. Sianos G, Morel MA, Kappetein AP, et al. The SYNTAX Score: an angiographic tool grading the complexity of coronary artery disease. EuroIntervention. 2005;1(2):219–227.
4. Cho Y, Shimura S, Aki A, et al. The SYNTAX score is correlated with long-term outcomes of coronary artery bypass grafting for complex coronary artery lesions. Interact Cardiovasc Thorac Surg. 2016;23(1):125–132. doi:10.1093/icvts/ivw057
5. Ikeno F, Brooks MM, Nakagawa K, et al. SYNTAX Score and Long-Term Outcomes. J Am Coll Cardiol. 2017;69(4):395–403. doi:10.1016/j.jacc.2016.10.067
6. Karabag Y, Rencuzogullari I, Cagdas M, et al. Association of serum uric acid levels with SYNTAX score II and long term mortality in the patients with stable angina pectoris who undergo percutaneous coronary interventions due to multivessel and/or unprotected left main disease. Int J Cardiovasc Imaging. 2019;35(1):1–7. doi:10.1007/s10554-018-1446-6
7. Xu N, Tang X-F, Yao Y, et al. Lipoprotein(a) levels are associated with coronary severity but not with outcomes in Chinese patients underwent percutaneous coronary intervention. Nutrition, Metabolism and Cardiovascular Diseases. 2020;30(2):265–273. doi:10.1016/j.numecd.2019.09.020
8. Ashfaq F, Goel PK, Moorthy N, et al. Lipoprotein (A) and SYNTAX Score Association with Severity of Coronary Artery Atherosclerosis in North India. Sultan Qaboos Univ Med J. 2012;12(4):465–472. doi:10.12816/0003172
9. Liu Y, Ma H, Zhu Q, et al. A genome-wide association study on lipoprotein (a) levels and coronary artery disease severity in a Chinese population. J Lipid Res. 2019;60(8):1440–1448. doi:10.1194/jlr.P091009
10. Dai W, Long J, Cheng Y, et al. Elevated plasma lipoprotein(a) levels were associated with increased risk of cardiovascular events in Chinese patients with stable coronary artery disease. Sci Rep. 2018;8(1):7726.
11. Cetin MS, Ozcan Cetin EH, Kalender E, et al. Monocyte to HDL cholesterol ratio predicts coronary artery disease severity and future major cardiovascular adverse events in acute coronary syndrome. Heart Lung Circ. 2016;25(11):1077–1086. doi:10.1016/j.hlc.2016.02.023
12. Yang Y-L, Wu C-H, Hsu P-F, et al. Systemic immune-inflammation index (SII) predicted clinical outcome in patients with coronary artery disease. Eur J Clin Invest. 2020;50(5):e13230. doi:10.1111/eci.13230
13. Tsimikas SA. A Test in Context: lipoprotein(a). J Am Coll Cardiol. 2017;69(6):692–711. doi:10.1016/j.jacc.2016.11.042
14. Willeit P, Kiechl S, Kronenberg F, et al. Discrimination and net reclassification of cardiovascular risk with lipoprotein(a): prospective 15-year outcomes in the Bruneck Study. J Am Coll Cardiol. 2014;64(9):851–860. doi:10.1016/j.jacc.2014.03.061
15. Erqou S, Kaptoge S, Perry PL, et al. Lipoprotein(a) concentration and the risk of coronary heart disease, stroke, and nonvascular mortality. JAMA. 2009;302(4):412–423.
16. Anderson TJ, Gregoire J, Pearson GJ, et al. 2016 Canadian Cardiovascular Society Guidelines for the Management of Dyslipidemia for the Prevention of Cardiovascular Disease in the Adult. Can J Cardiol. 2016;32(11):1263–1282. doi:10.1016/j.cjca.2016.07.510
17. Ma Y, Rao J, Long J, et al. Correlation of lipoprotein(a) with clinical stability and severity of coronary artery lesions in patients with coronary artery disease. Nan Fang Yi Ke Da Xue Xue Bao. 2019;39(2):235–240.
18. Zhou B-Y, Sun D, Wang C, et al. Plasma lipoprotein(a) concentration is associated with the coronary severity but not with events in stable coronary artery disease patients: A Chinese cohort study. Heart Lung Circ. 2019;28(7):1009–1017. doi:10.1016/j.hlc.2018.05.190
19. Chieng D, Pang J, Ellis KL, et al. Elevated lipoprotein(a) and low-density lipoprotein cholesterol as predictors of the severity and complexity of angiographic lesions in patients with premature coronary artery disease. J Clin Lipidol. 2018;12(4):1019–1026. doi:10.1016/j.jacl.2018.03.090
20. Cantin B, Gagnon F, Moorjani S, et al. Is lipoprotein(a) an independent risk factor for ischemic heart disease in men? The Quebec Cardiovascular Study. J Am Coll Cardiol. 1998;31(3):519–525. doi:10.1016/S0735-1097(97)00528-7
21. O’Donoghue ML, Morrow DA, Tsimikas S, et al. Lipoprotein(a) for risk assessment in patients with established coronary artery disease. J Am Coll Cardiol. 2014;63(6):520–527. doi:10.1016/j.jacc.2013.09.042
22. Yeang C, Witztum JL, Tsimikas S. ‘LDL-C’ = LDL-C + Lp(a)-C. Curr Opin Lipidol. 2015;26(3):169–178. doi:10.1097/MOL.0000000000000171
23. Geovanini GR, Libby P. Atherosclerosis and inflammation: overview and updates. Clinical Science. 2018;132(12):1243–1252. doi:10.1042/CS20180306
24. Buckley DI, Fu R, Freeman M, et al. C-reactive protein as a risk factor for coronary heart disease: a systematic review and meta-analyses for the U.S. Preventive Services Task Force. Ann Intern Med. 2009;151(7):483–495. doi:10.7326/0003-4819-151-7-200910060-00009
25. Xing Y, Guo J-T, Gai L-Y, et al. Association of uric acid and C-reactive protein with the severity of coronary artery disease Using SYNTAX score and clinical SYNTAX score. Heart Surg Forum. 2019;22(3):E247–E252. doi:10.1532/hsf.2397
26. Karadeniz M, Duran M, Akyel A, et al. High sensitive CRP level is associated with intermediate and high syntax score in patients with acute coronary syndrome. Int Heart J. 2015;56(4):377–380. doi:10.1536/ihj.14-299
27. Liu Y, Jia S-D, Yao Y, et al. Impact of high-sensitivity C-reactive protein on coronary artery disease severity and outcomes in patients undergoing percutaneous coronary intervention. J Cardiol. 2020;75(1):60–65. doi:10.1016/j.jjcc.2019.06.012
28. Kanbay M, Solak Y, Unal HU, et al. Monocyte count/HDL cholesterol ratio and cardiovascular events in patients with chronic kidney disease. Int Urol Nephrol. 2014;46(8):1619–1625. doi:10.1007/s11255-014-0730-1
29. Akboga MK, Balci KG, Maden O, et al. Usefulness of monocyte to HDL-cholesterol ratio to predict high SYNTAX score in patients with stable coronary artery disease. Biomark Med. 2016;10(4):375–383. doi:10.2217/bmm-2015-0050
30. Kundi H, Kiziltunc E, Cetin M, et al. Zusammenhang des Monozyten-/HDL-C-Quotienten mit dem SYNTAX-Score bei Patienten mit stabiler koronarer Herzkrankheit. Herz. 2016;41(6):523–529. doi:10.1007/s00059-015-4393-1
31. Xu W, Guan H, Gao D, et al. Sex-specific association of monocyte count to high-density lipoprotein ratio with SYNTAX score in patients with suspected stable coronary artery disease. Medicine. 2019;98(41):e17536. doi:10.1097/MD.0000000000017536
32. Huang J, Zhang Q, Wang R, et al. Systemic immune-inflammatory index predicts clinical outcomes for elderly patients with acute myocardial infarction receiving percutaneous coronary intervention. Med Sci Monitor. 2019;25:9690–9701. doi:10.12659/MSM.919802
 © 2020 The Author(s). This work is published and licensed by Dove Medical Press Limited. The full terms of this license are available at https://www.dovepress.com/terms.php and incorporate the Creative Commons Attribution - Non Commercial (unported, v3.0) License.
By accessing the work you hereby accept the Terms. Non-commercial uses of the work are permitted without any further permission from Dove Medical Press Limited, provided the work is properly attributed. For permission for commercial use of this work, please see paragraphs 4.2 and 5 of our Terms.
© 2020 The Author(s). This work is published and licensed by Dove Medical Press Limited. The full terms of this license are available at https://www.dovepress.com/terms.php and incorporate the Creative Commons Attribution - Non Commercial (unported, v3.0) License.
By accessing the work you hereby accept the Terms. Non-commercial uses of the work are permitted without any further permission from Dove Medical Press Limited, provided the work is properly attributed. For permission for commercial use of this work, please see paragraphs 4.2 and 5 of our Terms.