")
Back to Journals » Diabetes, Metabolic Syndrome and Obesity » Volume 13
The Association of Metabolic Syndrome and Its Components with Electrocardiogram Parameters and Abnormalities Among an Iranian Rural Population: The Fasa PERSIAN Cohort Study
Authors Yazdanpanah MH , Sayyadipoor S, Hojati SR , Nikmanesh A, Farjam M, Homayounfar R
Received 16 May 2020
Accepted for publication 4 August 2020
Published 24 August 2020 Volume 2020:13 Pages 2975—2987
DOI https://doi.org/10.2147/DMSO.S263093
Checked for plagiarism Yes
Review by Single anonymous peer review
Peer reviewer comments 3
Editor who approved publication: Prof. Dr. Antonio Brunetti
Mohammad Hosein Yazdanpanah,1,2 Sepideh Sayyadipoor,2 Sayed Reza Hojati,2 Amirreza Nikmanesh,2 Mojtaba Farjam,1 Reza Homayounfar1,3
1Noncommunicable Diseases Research Center, Fasa University of Medical Sciences, Fasa, Iran; 2Student Research Committee, Fasa University of Medical Sciences, Fasa, Iran; 3National Nutrition and Food Technology Research Institute, Faculty of Nutrition Sciences and Food Technology, Shahid Beheshti University of Medical Sciences, Tehran, Iran
Correspondence: Reza Homayounfar
Noncommunicable Diseases Research Center, Fasa University of Medical Sciences, Fasa, Iran
Tel +989125140840
Email [email protected]
Background: Metabolic syndrome (MetS) as a set of cardiac risk factors and its growing prevalence is one of the major concerns in different societies. In this study, we aimed to investigate the relationship between Mets and electrocardiogram (ECG) parameters and abnormalities as indicators for subclinical cardiovascular diseases (CVD).
Methods: In this sub-analysis study, we used the data from Fasa PERSIAN Cohort Study which includes subjects age 35– 70 years. Subjects with available ECG data included in the study (n=7002) and subjects with missing data on MetS components and non-sinus rhythm ECG were excluded (n=44). The MetS definition based on the Adult Treatment Panel (ATP) III guidelines and also a 12-lead ECG was obtained from all participants.
Results: Our study population (n=6958) showed a mean age of 48.60± 9.34 years and also 1656 (24.2%) subjects had MetS. Except for P duration, PR interval and S amplitude in men and P amplitude, S amplitude, Sokolow-Lyon Index, and QT interval in women, other ECG parameters differ significantly between subjects with and without Mets (P< 0.05). Also among ECG abnormalities, prolonged P duration (≥ 120ms), QRS duration (≥ 100ms), and QTc interval (> 450ms in male, > 470ms in female) had a significant association with MetS in the total population. Waist circumferences (WC) showed the most count of significant relationship with ECG parameters in both genders. In males, WC more than ATP cut-points had significant associations with prolonged P and QRS duration, and also blood pressure (BP) had significant associations with prolonged P and QRS durations and QTc interval. In females, the MetS component except triglyceride had at least a significant relationship with prolonged P and/or QRS duration.
Conclusion: MetS and its component especially WC and BP were associated with ECG parameters and abnormalities. These associations with ECG as a marker of subclinical CVD showed the importance of MetS and each component in our population to monitor in the further longitudinal studies.
Keywords: electrocardiogram, metabolic syndrome, P wave, QRS complex, QTc interval
Introduction
The metabolic syndrome (MetS) or X syndrome refers to a set of obesity, hypertension, hyperlipidemia, microalbuminuria, and impaired glucose metabolism risk factors1 first defined by Reaven in 1988.2 With a growing prevalence, the MetS affected 10–23% of the world population between 2002 and 2004.3 From 2003 to 2012, the prevalence of MetS in the United States was approximately 33%.4 Studies conducted in the Middle East between 2003 and 2014 showed that MetS had a prevalence of about 25% and rapid growth, even more than the American and European populations.5 The prevalence rate of MetS was more than 30% in different studies in Iran.6,7
In another definition, this syndrome was defined as a set of cardiac risk factors8 showing its role in developing cardiovascular disease (CVD). For example, MetS account for 25% of CVDs9. On the other hand, it increases the risk of CVD by 61%.10 Each component of the MetS has a distinct role in the development of CVD; however, the distinct role of each component is greater than in the general.11 CVD is the leading cause of premature mortality in the world with 17.9 million deaths in 2012, which is predicted to increase to 23 million deaths in 2030. Moreover, the low- and medium-income countries, specifically the Eastern Mediterranean countries, account for 50% of deaths and 80% of the global burden from this disease. The death from CVD in Iran increased from 26.6% in 1981 to 43.3% in 1995.12 According to the GBD’s reports, CVD has been the leading cause of mortality between 2010 and 2015 in Iran, accounting for more than 20% of all diseases and 46% of all deaths.13
Electrocardiogram (ECG) can be regarded as a simple comprehensive method to check the heart’s activity history. As a test with a high prediction value, it can be used to predict the chance of CVD development.14 It is worth noting that the majority of studies have investigated the effects of MetS only on one or few markers from the patients’ electrocardiograms, such as aortic stiffness,15 T-wave axis,16,17 resting heart rate,18 QT interval, ST segment, and Q-wave,14 or assessed the effect of only one component of the MetS, such as blood glucose,19,20 obesity,21 and/or abdominal adiposity22 on the majority of ECG markers. This suggests that there are few similar studies in the world and no similar study in Iran as comprehensive as the present study.
The genetic, cultural, and geographical differences, among many others, justify differences between various studies conducted in different geographic regions. In many areas, the cohort studies on metabolic subjects have investigated the effects of MetS and its components on the ECGs. It is worth noting that some of these studies produced different results, indicating that although a few relevant studies exist in the world, this relationship continues to remain unknown.14,23 Besides, knowing the effects of MetS and its components on ECG can be helpful for CVD risk prediction, and used by health authorities and decision-makers to change its epidemic spread in Iran.24
Methods
Study Design and Population
In this sub-analysis of Fasa Cohort Study, as a part of the PERSIAN cohort study, near 11,100 people aged 35 to 70 years were included25 Each participant has signed informed consent at the beginning of the study. All subjects with available data of ECGs and without reported or known CVD were included in the study (n=7002). All included subjects were at the same socioeconomic level, with the same ethnic and same residential region. Also, subjects with detected non-sinus rhythm ECG and missing data on Mets components haves been excluded (n=44,) and finally 6958 subjects remained in the study.
Characteristics of Subjects
Basic data including age, sex, smoking status, alcohol consumption, and chronic diseases such as diabetes and hypertension were questioned and recorded by an internet-based questionnaire. All medication that was taken within 2 weeks before registration has been questioned and recorded. A list of drugs (selected medications) which has been provided by CredibleMeds, as an American organization, including drugs with known risk and drugs with a possible risk for Torsades de pointes, which counts 187 cardiac and non-cardiac drugs in total was used to recognize the drugs which have been known as effective factors in QT interval prolongation.26 Physical activity was measured by a 20-item questionnaire that can measure routine physical activities of rural Iranians. The amount of each activity in hours and minutes was determined; the MET-value of each activity was multiplied by its duration, and MET-min of each activity was calculated. Finally, the sum of all activities was calculated as the total physical activity (MET/24h).
Measurements
For the anthropometry calculations, height was measured by a stadiometer with an accuracy of 0.1 cm and weight was measured by a digital scale with an accuracy of 0.1 kilograms. Body mass index (BMI) was calculated using weight divided by the square of height (kg/m2). Waist circumference (WC) was measured at the midpoint of the inferior border of the lowest ribs to the anterior superior iliac spine, using an inelastic tape. Hip circumference was considered at the widest part of the participants’ hip. Wrist circumference was measured just below the wrist bone.
For evaluating blood pressure (BP), participants first rested for 15 minutes, after which with an interval of five minutes, two consecutive BP’s were measured from participants and reported by an average of systolic and diastolic pressure in mmHg. Triglyceride (TG), total cholesterol (TC), low-density lipoprotein cholesterol (LDL), high-density lipoprotein cholesterol (HDL), and fasting blood sugar (FBS) all obtained from venous blood samples taken in a 10–14h fasting condition. TC and HDL measures were assayed by using the Mindray BS380 autoanalyzer (Mindray Medical International, Shenzhen, China) as the biochemical tests. Laboratory testing of FBS was done using glucose oxidize test. We used the Friedewald formula to calculate LDL.27
Electrocardiogram
A 12-Lead ECG was obtained from the participants using a computer-based paperless device (Cardiax®28) with a 2000 Hz sampling rate and 0.04 µV/bit (24-bit resolution). Patients were in the supine position 15 minutes before recording and were told to relax, breathe normally, refrain from moving and talking, but remain awake during the procedure. As this device provide us a more detailed value of the duration, amplitude, and axis of the ECG waves, we used ECG parameters such as Heart rate (bpm), P duration (ms), P amplitude II (mV), PR interval (ms), QRS duration (ms), R amplitude V5 (mV), S amplitude V1 (mV), QT interval (ms), QTc interval (ms), P axis (°) and QRS axis (°). All ECGs analyzed and reported Automatically by Cardiax software (version 3.50.2, International Medical Equipment Developing Co. Ltd., Budapest, Hungary) and exported to central data software. Also, prolonged PR interval was considered as PR interval≥ 200 ms, prolonged P duration was considered as P duration≥ 120 ms, prolonged QRS duration was considered as QRS duration ≥ 100 ms. Bazett’s formula29 was used to calculate heart-rate corrected QT interval (QTc) also we used clinical standard cut-offs for prolonged QTc interval (Man>450ms, Woman>470). Moreover, Sokolow-Lyon index was calculated as the sum of S amplitude V1 and R amplitude V5/630
Metabolic Syndrome Definition
The MetS were assumed to be present provided that three or more of the following parameters are met, based on the NCEP ATP III guidelines:31
- The WC more than 94 cm for men and more than 80 cm for women
- HDL less than 40 mg/dL in men and less than 50 mg/dL in women or receiving drug therapy for reduced HDL
- TG level ≥ 150 mg/dL or receiving drug therapy for hypertriglyceridemia
- BP ≥ 130/85 mmHg or receiving blood pressure-lowering drugs
- FBS ≥ 101 mg/dL or receiving glucose-lowering drugs
Data Analysis
Descriptive statistics were reported as number (percentage) or mean ± SD. Independent T-test was used to compare quantitative variables between the two groups. Also, both linear and logistic regression analyses performed for multivariate analysis. Regression adjusting was done with variables such as age, heart rate, smoking history, educational years, diabetes history, regular consumption of alcohol, physical activity, and selected medications (just for QT and QTc interval analysis). All the statistical analyses performed in SPSS 22.0 (IBM Corp., Armonk, N.Y., USA), Microsoft Excel 2019 software and for graphs, we used Prism version 8.00 (GraphPad Software, La Jolla California USA). Also, P-value<0.05 considered as statistically significant P-value.
Ethics Approval
Our study was following relevant guidelines and regulations of our regional and national research ethics committees, also the protocol of this study has the approval of regional and national research ethics committees (the equivalent of institutional review boards) of FUMS (reference number: IR.FUMS.REC. 1399.019).
Results
A total of 6958 participants, including 3001 (43.13%) male and 3957 (56.87%) female with a mean of age 48.60±9.34 years in total population were analyzed. Table 1 presents the demographic characteristics of the participants. According to this table, 1656 (24.2%) of the participants satisfied the MetS criteria. Participants with MetS had a significantly higher mean of age, anthropometrics variables, lipid profiles, and FBS. Physical activity was statistically significantly higher in those without MetS (p<0.001). Moreover, the majority of MetS subjects were women (80%) and being smoker and regular consumption of alcohol was higher in subjects without MetS.
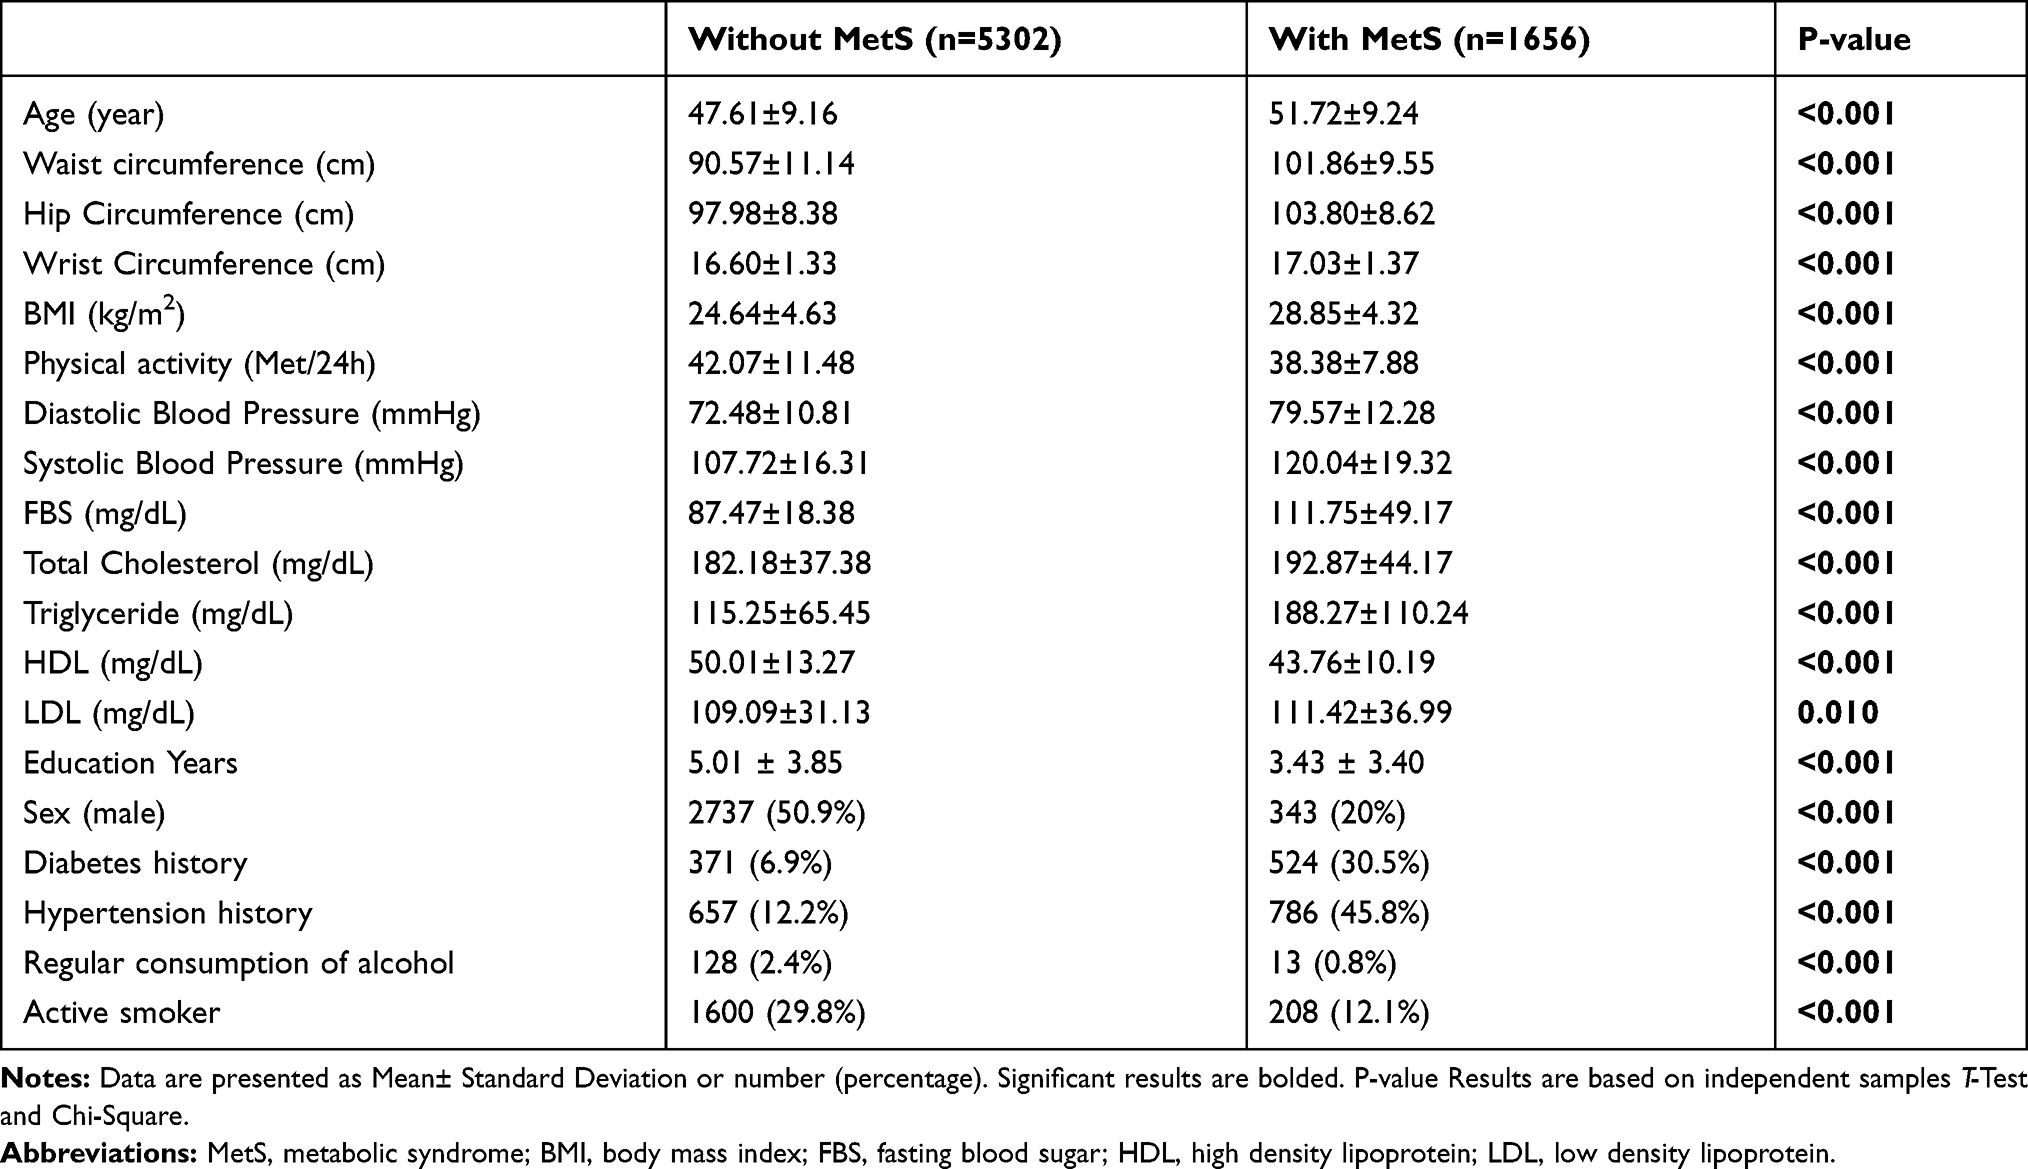 |
Table 1 Baseline Characteristics of the Population According to Metabolic Syndrome (n=6958) |
In Table 2, As can be seen, male participants with MetS had a significantly higher heart rate, longer QRS duration, and QTc interval (p<0.001); whereas, their P amplitude II, R amplitude V5, Sokolow-Lyon Index, QT interval, P axis, and QRS axis were lower (p<0.001). Among the female participants, those with MetS had a significantly higher heart rate (p<0.001), longer P duration (p=0.002), longer QRS duration (p<0.001), longer QTc interval (p<0.001), lower P axis (p=0.017), and lower QRS axis (p<0.001). Among the total population, 82 (1.1%) of subjects had prolonged PR interval, 670 (9.6%) had prolonged P duration, 2504 (35.98%) had Prolonged QRS duration, 691 (9.93%) had prolonged QTc interval. ECG abnormalities were more frequent in males. According to MetS, significantly higher frequency observed in prolonged P duration and prolonged QTc interval in males and prolonged P duration, QRS duration, and QTc interval in females (p<0.001).
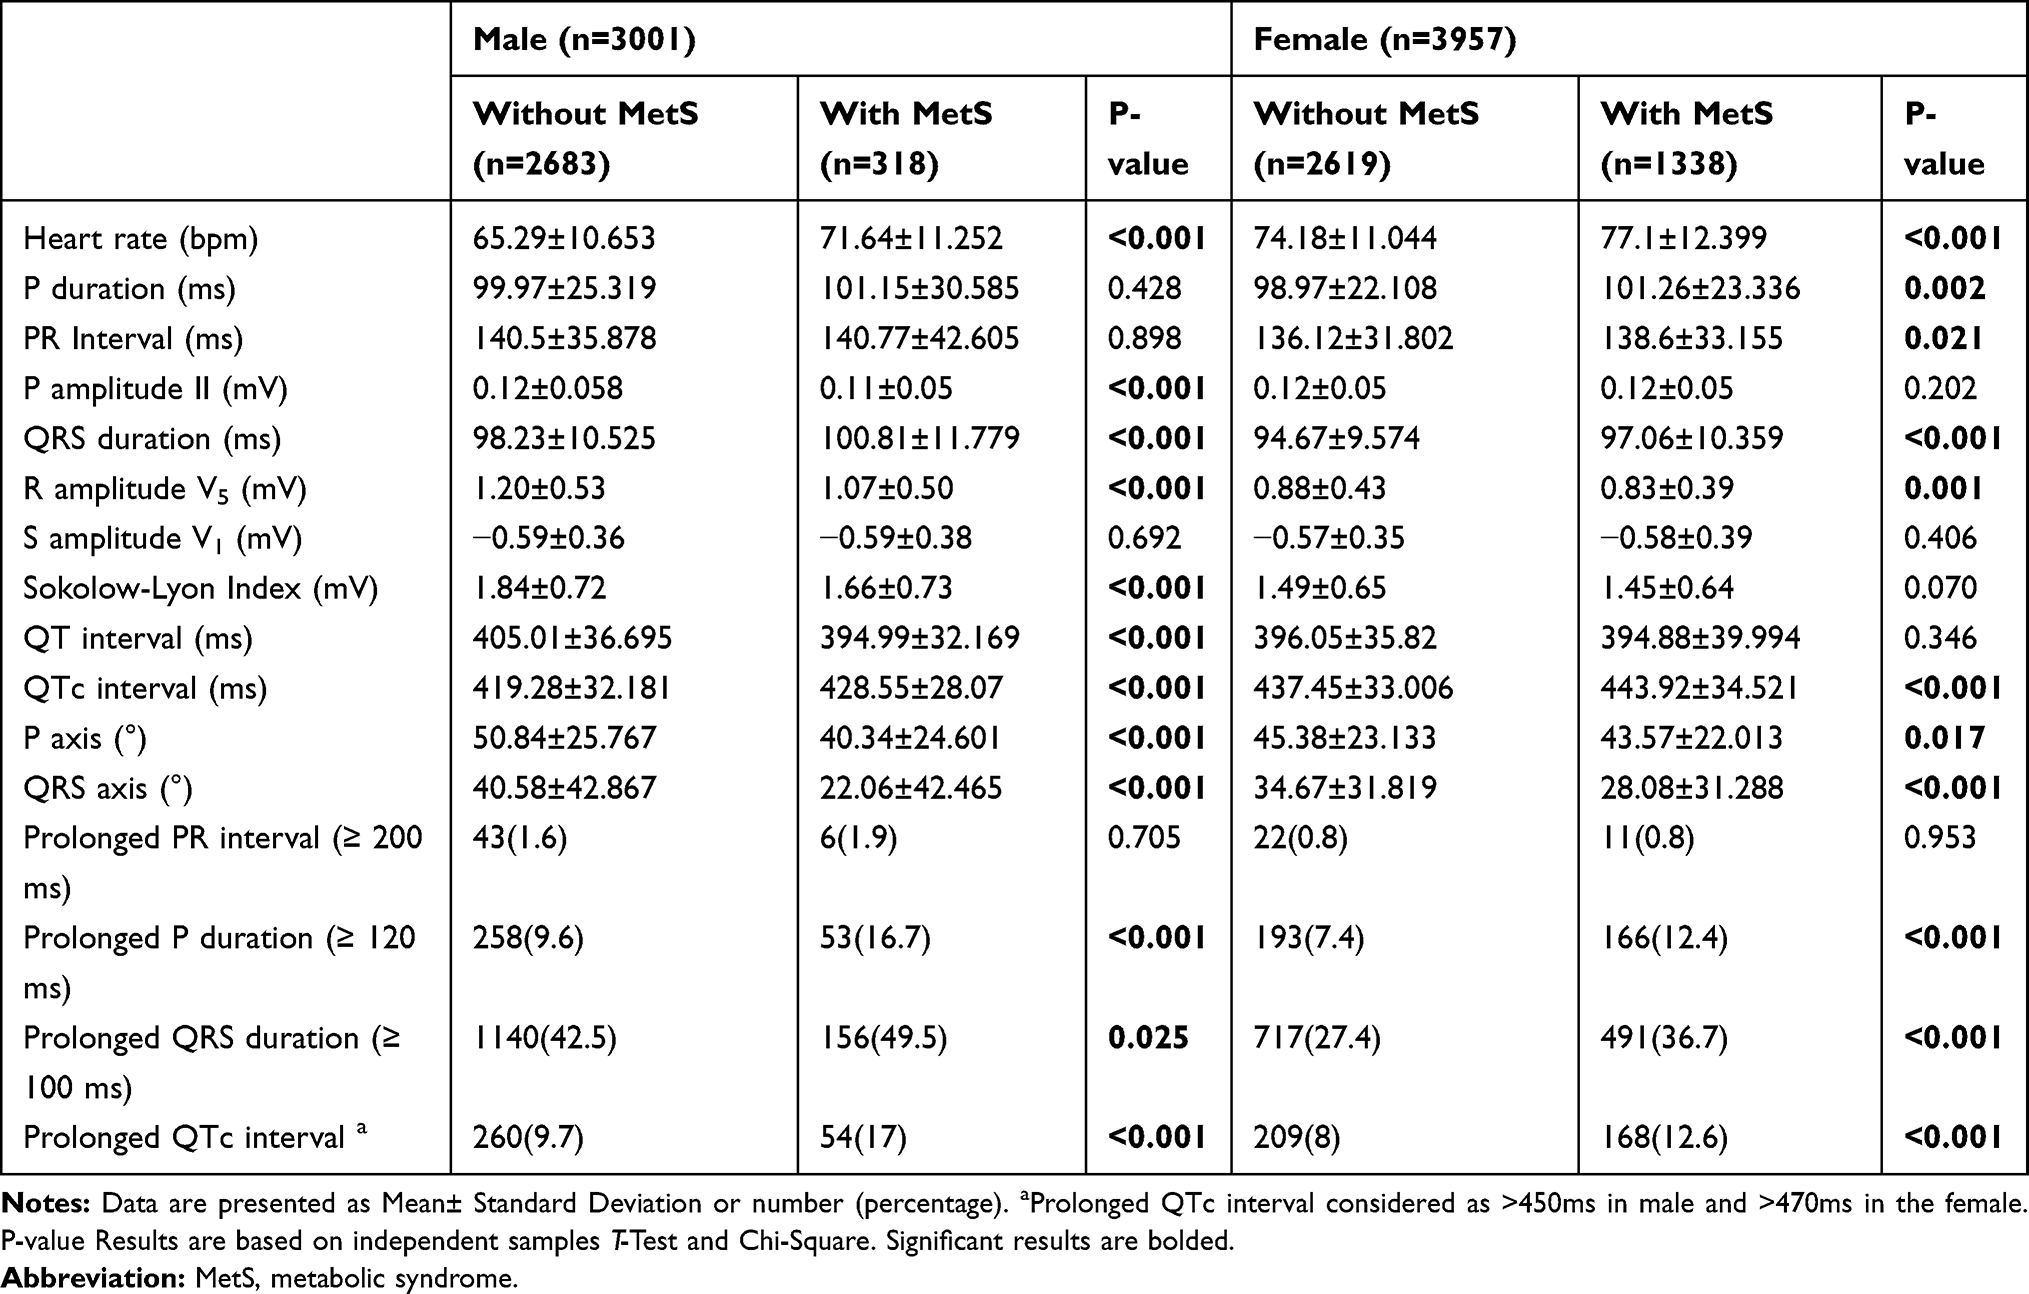 |
Table 2 Baseline ECG Parameters of the Population According to Metabolic Syndrome in Both Gender |
Table S1 shows the association between EGC parameters and abnormalities with MetS in the males and females. The highest positive beta-coefficient and 95% CI was related to heart rate and the highest negative was related to the QRS axis in males and P axis in females. Among ECG abnormalities prolonged P and QRS durations odds ratios (95% CI) respectively were 1.561 (1.112–2.191) and 1.394 (1.095–1.774) with P-value<0.05 in male. In the female gender, the both mentioned abnormalities were still significant, also in addition to these abnormalities, prolonged QTc interval was in a significant association with MetS(P-value=0.003) in females. Table 3 represents the results of the linear regression model of the association of MetS components with ECG parameters in both genders. Among MetS components, WC was significantly related to all ECG parameters in males. In females, just the QT interval did not show any significant association with WC. In both genders, it seems that FBS had the lowest count of significant relationships but the highest positive relationship in females was related to FBS and heart rate and in males was related to SBP and Sokolow-Lyon Index with a standardized beta coefficient 0.189 and 0.182 (P-value<0.001) respectively. Also, the highest negative relationship was related to WC and P axis with −0.268 and WC and R amplitude V5 with −0.226 (P-value<0.001), respectively in males and females. Also, Table S2 represents the results of the linear regression model of MetS components as binary outcomes with ECG parameters in both genders.
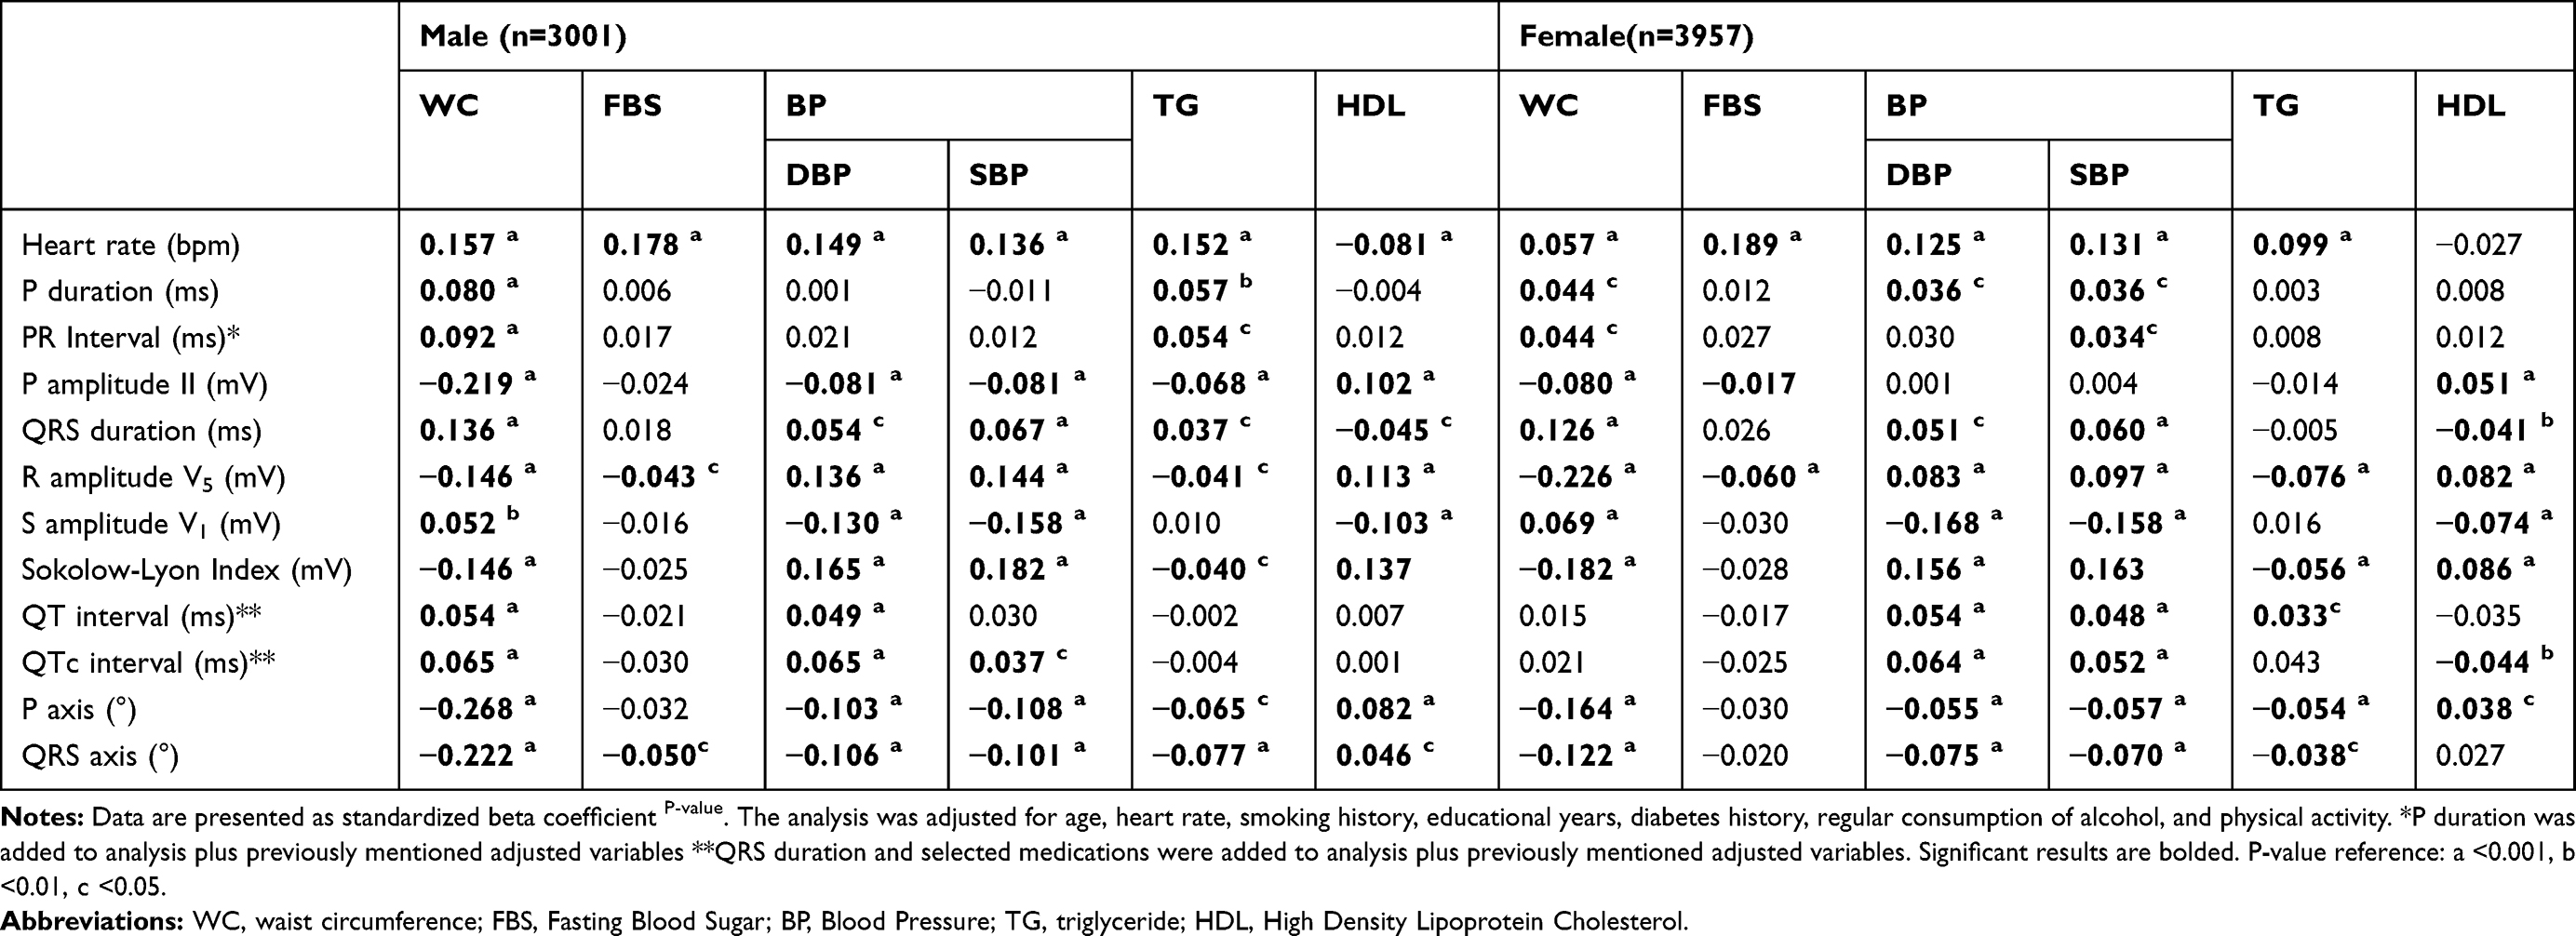 |
Table 3 A Multivariate Linear Model of Association of ECG Parameters with Metabolic Syndrome Components in Both Genders |
Figure 1 represents a comparison of ECG parameters’ means between different MetS scores in the total population. Overall, a significant increase of means was seen in multiple ECG parameters including heart rate, P duration, QRS duration, QTc interval, and P amplitude II. Also, a significant decrease of means was seen in the QT interval, P axis, QRS axis, R amplitude V5, and Sokolow-Lyon Index.
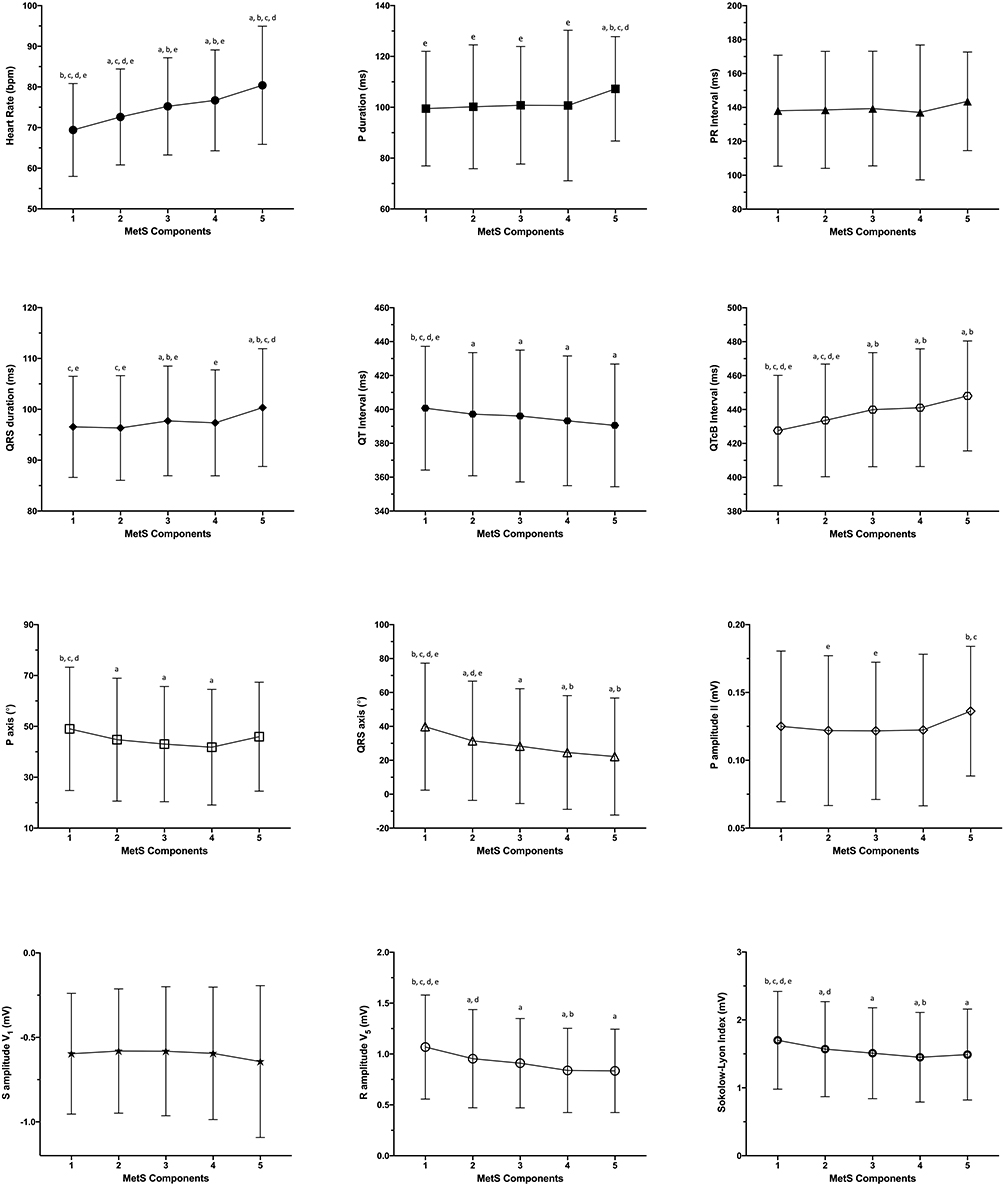 |
Figure 1 Comparison of ECG parameters’ means in different metabolic syndrome scores in the total population. a: significant difference to subjects with score 1, b: significant difference to subjects with score 2, c: significant difference to subjects with score 3, d: significant difference to subjects with score 4, e: significant difference to subjects with score 5. Abbreviations: MetS, Metabolic syndrome. |
In ECG abnormalities, in males, just three of the MetS components including WC, BP, and HDL were significantly associated with prolonged P duration with odds ratios (95% CI), 1.849 (1.352–2.528), 1.323 (1.006–1.739) and 1.286 (1.013–1.631) respectively. Also, WC was related to prolonged QRS duration with 1.552 (1.231–1.956) and P-value<0.001, and BP was related to prolonged QT interval with 1.421 (1.067–1.893) and prolonged QRS duration with 1.215 (1.011–1.459) P-value<0.05. But in females, just prolonged P duration and prolonged QRS duration were in significant associations with MetS components, prolonged P duration with WC, FBS and BP, and prolonged QRS duration with WC, BP, and HDL. Among these variables, the highest OR was related to BP and prolonged P duration with 1.758 (1.392–2.221) and P-value<0.001 (Table 4).
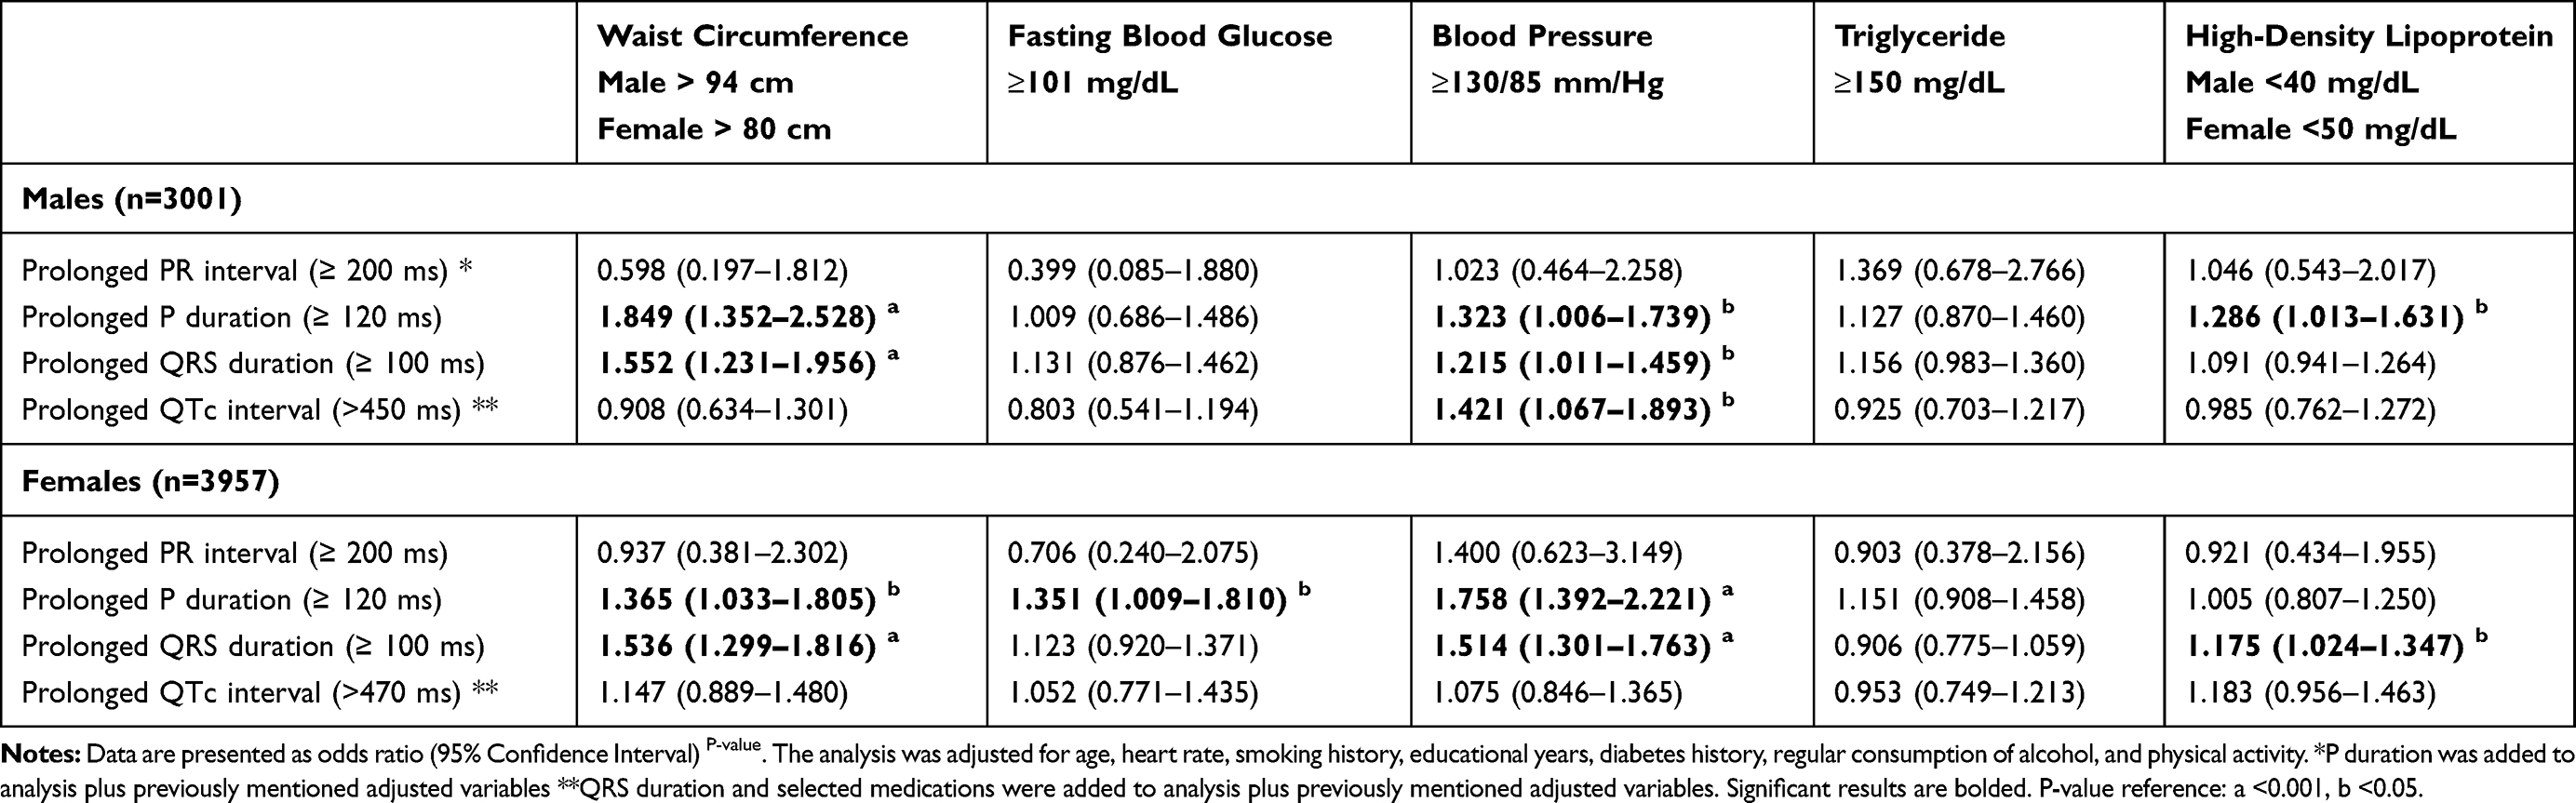 |
Table 4 A Multivariate Model of Association of ECG Abnormalities with Metabolic Syndrome Components According to Gender |
According to Table 5, it seems that WC and BP are the two MetS components (as binary outcomes) which have significant associations with having single or multiple ECG abnormalities. In male, WC with odds ratios (95% CI) 1.381 (1.095–1.742) and 1.571 (1.149–2.147) was related to having single or multiple ECG abnormalities (P-value<0.05) respectively. In females, such relationships observed with smaller odds ratios. Also, BP with an odds ratio (95% CI), 1.628 (1.265–2.094) and P-value<0.001, was related to having multiple ECG abnormalities in males but there was not any significant association between BP and having single abnormality (P-value=0.468) while in females it was significant with 1.356 (1.169–1.573) and P-value<0.001.
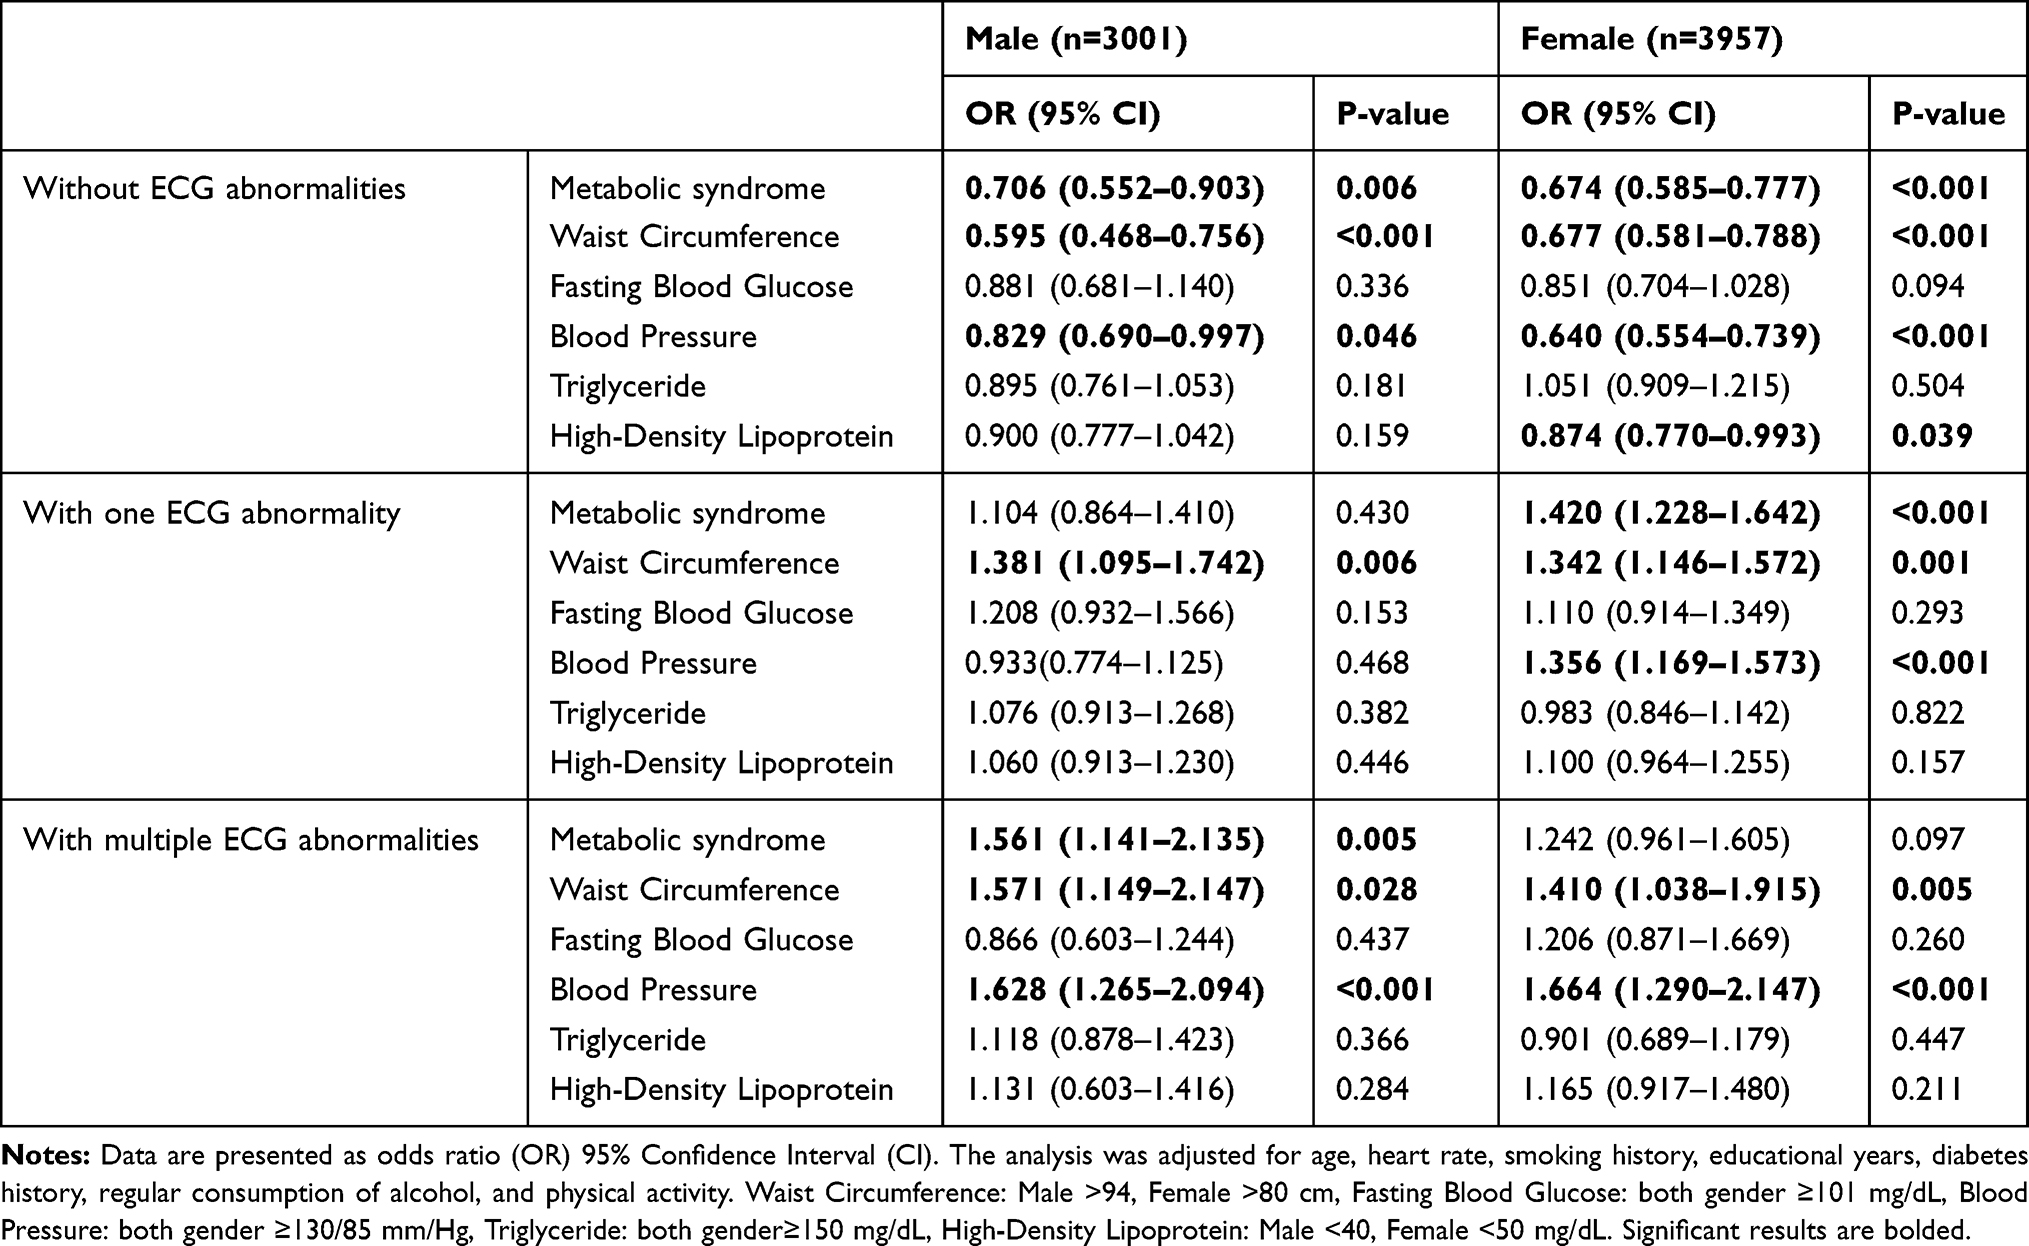 |
Table 5 A Multivariate Model of Association of ECG Abnormalities with Metabolic Syndrome and Its Components as Binary Outcomes According to Gender |
In total, 707 (35.8%) of subjects with MetS score of 1, 693 (35.5%) of subjects with MetS score of 2, 445 (41%) of subjects with MetS score of 3, 167 (37.0%) of subjects with MetS score of 4, 49 (40.8%) of subjects with MetS score of 4 had one ECG abnormality which was an insignificant difference (P=0.021). Also, 171 (8.6%) of subjects with MetS score of 1, 183 (9.4%) of subjects with MetS score of 2, 108 (10%) of subjects with MetS score of 3, 60 (13.3%) of subjects with MetS score of 4, 24 (20%) of subjects with MetS score of 4 had multiple ECG abnormalities which were insignificant difference (P<0.001). ECG abnormalities’ frequency in different MetS scores has been presented in Figure 2 according to gender. Significant differences among different MetS scores in men were related to the frequency of multiple ECG abnormalities while both single/multiple ECG abnormalities showed significant differences in women (P<0.001). Also, Table S3 shows the odds ratios of having different MetS scores with ECG abnormalities according to gender comparing to the reference group of subjects (MetS score=0).
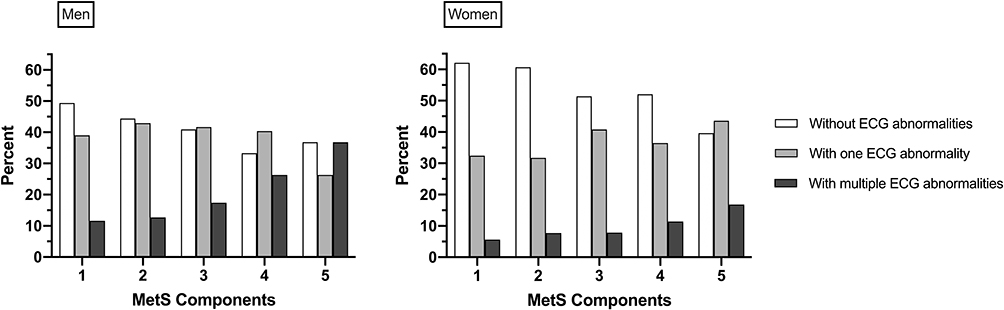 |
Figure 2 Frequencies of ECG abnormalities in different metabolic syndrome scores in both gender. Abbreviation: MetS, Metabolic syndrome. |
Discussion
In this study with a large number of Iranian population main findings of the study were i) In overall, the mean of Heart rate, P duration, PR Interval, QRS duration S amplitude, and QTc interval was higher in subjects with MetS but the mean of P amplitude, R amplitude, Sokolow-Lyon Index, QT interval, P axis, and QRS axis was lower in the subject with MetS. ii) ECG abnormalities including prolonged PR interval, P duration, QRS duration, and QTc interval frequencies were higher in subjects with metabolic syndrome. However, just prolonged P duration and QTc interval in men and prolonged P duration, QRS duration, and QTc interval in women were at a significant difference. iii) The MetS were associated with prolonged P duration and QTc interval in males. This association in female subjects was seen with all ECG abnormalities except prolonged PR interval. iv) Among MetS components, WC had the highest count of significant relationship with ECG parameters in both genders, and the highest positive relationship in females was related to FBS and heart rate and in males was related to SBP and Sokolow-Lyon Index. Also, the highest negative relationship was related to WC and P axis and R amplitude V5 respectively in males and females. v) Among relationships between MetS components and ECG abnormalities, WC had significant associations with prolonged P and QRS duration and BP had significant associations with prolonged P and QRS duration and QTc interval in males. Also, prolonged P and HDL had a significant association. In females, the MetS component except TG had at least a significant relationship with prolonged P and/or QRS duration. vi) Considering ATP cut-points for MetS components, Subjects with WC and BP more than cut-points seem to be more prone to have single/multiple ECG abnormalities which were higher in males than females. Also, MetS may increase the frequency of having multiple ECG abnormalities near 80% and 30% respectively in men and women significantly.
It should be mentioned that these findings were independent of other risk factors such as age, heart rate, smoking history, educational years, diabetes history, regular consumption of alcohol, and physical activity.
Metabolic Syndrome and ECG Parameters
Our results showed that it seems MetS is in a significant positive association with heart rate as first ranked and following by QRS duration in men and QTc interval in women. Queen et al,14 reported that the odds ratio in having MetS in subjects with HR more than 72 bpm in comparison to those with HR lower than 65.6 bpm is 2.38. They have also reported that the odds ratio in having MetS in subjects with QTcB more than 422 ms in comparison to those with QTc lower than 396 ms is 1.69. However, they had a different study design but it supports our result in the case of association of HR, QTc, and MetS. In a recent study with a smaller sample size, the PR interval had the strongest association with metabolic syndrome.21 Surprisingly PR interval in our study was not at a significant relationship with metabolic syndrome. A cross-sectional analysis in the Netherlands23 reported the mean of P and QRS axis 44.2 and 23.0 respectively in non-obese subjects which were near our results. Also, the same as our results, they observed a negative significant relationship between P and QRS axis with metabolic syndrome. In our study P axis was the first and QRS was the second parameter in having the highest negative relationship with MetS in women while vice versa was seen in men. A few studies are focusing on different ECG wave amplitudes with metabolic syndrome. A study that has been performed just on men, reported that a lower mean of P, R, and S amplitudes in subjects with MetS.32 Among these amplitudes, just R amplitude was in the significant differences between the two groups. Our findings also have shown almost the same results.
Metabolic Syndrome and ECG Abnormalities
Our findings suggested that prolonged P duration in men and prolonged QRS in women among ECG abnormalities had the strongest significant association with metabolic syndrome. There was just another significant association in men among ECG abnormalities which were related to prolonged QRS duration. Also, the three statistically significant associations in women from highest to lowest association respectively were prolonged QRS duration, prolonged QT interval, and prolonged P duration. Ebong et al,33 in a study on 6765 subjects aged from 45–84, reported that among those with MetS, 65.1% of men and 50% of women had abnormalities in their ECG. Although we had very different criteria for ECG abnormalities, in our study 61.8% of men and 49.9% of women which was near the previously reported results. Also, having multiple ECG abnormalities seems to have a higher significant association than having one ECG abnormality in both genders. In men, MetS seem to prone subjects to have multiple ECG abnormalities more than 78% as subjects without MetS. Also, female subject with Mets had a higher significant association (near more than 35%) with having one ECG abnormality which did not apply to men.
Each Metabolic Syndrome Component and ECG Parameters
Waist circumference in men was at a significant positive association with all ECG parameters except P and R amplitude, Sokolow-Lyon index, P, and Q axis. The same relations were seen in females except for QT and QTc intervals and waist circumference which was not at a significant association which may be due to heart rate variability. Elffers et al,22 reported that waist circumference positively was associated with QRS duration, P duration, and negatively was associated with the QRS axis and without any associations with the P axis. Their results support our findings however in the case of the P axis there was a negative association in our study.
FBS in men was only associated with heart rate, R amplitude, and QRS axis. In women, FBS had a significant relation with heart rate, P, and R amplitudes. A few studies are focusing on blood glucose and ECG parameters but Paudyal et al on 100 participate, indicated a possible association between Impaired and left axis deviation.34 Our negative association between FBS and QRS axis can indicate the same somehow but, this relationship was not significant. Another study reported a slight increase in PR interval in subjects with higher FBS.35 We observed this association in both genders however it was one of the smallest and again insignificant.
Both Systolic and diastolic BP in men were associated with ECG parameters except P duration and PR interval. Systolic BP also did not show a significant relationship with the QT interval. These exceptions in women were P amplitude. Also, Systolic BP did not show a significant relationship with the PR interval in addition to the previous one. Alonso et al, on 3180 participate from the MESA study suggested that Systolic and diastolic BP were not strongly associated with PR interval or P duration which can support our results in men.36 In other studies, with focusing on QT interval and QRS duration, the authors observed that central aortic blood pressure can be a risk factor for QTc prolongation and longer QRS durations.37,38 It seems BP after WC had the highest count of significant relationships especially diastolic blood pressure in both genders.
TG in our study was the most different variable in having a significant relationship with ECG parameters between men and women. In men, TG was related to ECG parameters except for QTc interval and S amplitude but in women, it had significant associations with heart rate, R amplitudes, Sokolow-Lyon index, QT interval, P and QRS axis. Although we did not find any correlation between TG and PR interval in women and a slight significant relationship in men but Adegoke et al,39 reported that triglyceride had a positive correlation with the PR interval (r = 0.3). This difference may be due to their different population and age because they have studied children with sickle cell anemia. In another study on 69 men,32 TG was related to the P axis and QRS axis negatively with r=−0.374 and −0.363 respectively which was higher than our result which may be due to their small sample size and unadjusted results.
HDL as another lipid profile among MetS components was at a significant association with heart rate, P amplitudes, QRS duration, R and S amplitudes, Sokolow-Lyon index, P and QRS axis in men. In women, P, R and S amplitudes, Sokolow-Lyon index, P axis, and QTc interval indicated a significant relationship with HDL. A Previous population-based study reported a J-shaped association between QTc interval and HDL40 which can be as a support for our results. In another study,32 HDL was related to the P axis and QRS axis positively with r=0.426 and 0.219 respectively which was much higher in comparison with our result. Also, it should be mentioned that in their study HDL and QRS axis were not statistically significant while our results showed a significant positive relationship in men.
Each Metabolic Syndrome Component and ECG Abnormalities
In subjects with WC and BP more than ATP cut-points, it seems the chance of having prolonged P and/or QRS duration may be significantly higher. Moreover, HDL and BP had significant relationships with prolonged P duration and prolonged QTc interval. In males, WC had a higher value in comparison with BP and HDL in having ECG abnormality. In females, BP increases the frequency of prolonged P duration near 75% and increases the frequency of prolonged QRS duration near 50%. Interestingly HDL in our study show just a significant association in subjects without ECG abnormalities which can represent its protective effect on ECG abnormalities. Overall, it can be interpreted that MetS can increase the chance of having single or multiple ECG abnormalities, especially multiple ECG abnormalities in men.
Possible Mechanism
There are several possible mechanisms of components of MetS and electrical status and heart’s structure which may manifest as ECG abnormalities. These effects of MetS on ECG variables may be direct, indirect, or interrelated with each other. Waist circumference as a representative of central obesity could result in increased sympathetic activity, diaphragm elevation, and increased cardiac output.41,42 Hypertension also can result in elevated cardiac output and this elevation may cause increased left ventricular (LV) wall stress, which stimulates myocardial hypertrophy.43 Also, the interrelation between obesity with an increased predisposition to hypertension is another point. Other studies have suggested leftward shifts of P and QRS axis were related to obesity.44,45 Obesity also may increase cardiac loading and lead to remodeling of the heart muscle and finally PR prolongation. These effects of obesity may be due to hormones produced by the adipose tissue which can result in electrophysiological changes.46 Higher FBS levels are associated with hypertension, hyperlipidemia, and a prothrombotic state which can interact synergistically to increase cardiac and ECG changes.47 Also, as it is known atherosclerosis can increase myocardial ischemia which can lead to scarring and heart dysfunction and ultimately ECG changes.43
Strengths and Limitations
A strength in our study was our large study population (n=6960). Data collection of digital ECGs were done under highly standardized conditions and enabled us to report more detailed ECG data. Another strength was the extensive measurements of confounding factors in the Fasa PERSIAN Cohort Study which made us examine the relationship of MetS and its component with ECG parameters more accurately and independent from effective factors. In this study, we used ECG as a predictor for future CVD risks and examined the role of MetS and its components separately for better screening. Also, to our knowledge, this is the first study that aimed to investigate the relationship between metabolic syndrome, its components, and ECG parameters in an Iranian population.
Our study is not free from limitations. First, as this study has a cross-sectional design, it limits our ability to infer any causality. For sure longer follow-ups in our study and other populations can reveal more results in case of these relationships. Second, our study was based on a rural population. As the subject we assessed may differ from a rural to urban subjects and the modernized urban population increasing in both developed or developing countries, it should be investigated in further studies with an urban Iranian population. Third, our study subjects were aged from 35–70 and we may not apply our findings to a younger Iranian population.
Conclusion
In conclusion, our study indicated that MetS and its components may have several different relationships on ECG parameters or abnormalities, and also, we suggest WC and BP as the two MetS components which had more and stronger associations with ECG parameters or abnormalities. Our results support this idea that MetS as an effective role player in ECG which is representative of subclinical CVD should be considered and screened to maintain subjects in a healthier lifestyle.
Data Sharing Statement
The datasets used and/or analyzed during the current study are available from the corresponding author on reasonable request to the corresponding author.
Ethics Approval and Consent to Participate
The study protocol was following the Helsinki Declaration and confirmed by the Ethics Committee of Fasa University of Medical Sciences (Approval Code: IR.FUMS.REC. 1399.019). The participants were informed about the research objectives and the written informed consent was obtained from the subjects before starting the survey.
Acknowledgments
The authors appreciate All people that patiently contributed to this study and Fasa University of Medical Sciences for supports of this work.
Author Contributions
All authors made substantial contributions to conception and design, acquisition of data, or analysis and interpretation of data; took part in drafting the article or revising it critically for important intellectual content; agreed to submit to the current journal; gave final approval of the version to be published; and agree to be accountable for all aspects of the work.
Disclosure
The authors report no conflicts of interest in this work.
References
1. Rochlani Y, Pothineni NV, Kovelamudi S, Mehta JL. Metabolic syndrome: pathophysiology, management, and modulation by natural compounds. Ther Adv Cardiovasc Dis. 2017;11(8):215–225. doi:10.1177/1753944717711379
2. Reaven GM. Role of insulin resistance in human disease. Diabetes. 1988;37(12):1595–1607. doi:10.2337/diab.37.12.1595
3. Wild SH, Byrne CD. The global burden of the metabolic syndrome and its consequences for diabetes and cardiovascular disease. Metab Syndr. 2005;1–41.
4. Aguilar M, Bhuket T, Torres S, Liu B, Wong RJ. Prevalence of the metabolic syndrome in the United States, 2003–2012. JAMA. 2015;313(19):1973–1974. doi:10.1001/jama.2015.4260
5. Ansarimoghaddam A, Adineh HA, Zareban I, Iranpour S, HosseinZadeh A, Kh F. Prevalence of metabolic syndrome in Middle-East countries: meta-analysis of cross-sectional studies. Diabetes Metab Syndr. 2018;12(2):195–201. doi:10.1016/j.dsx.2017.11.004
6. Zabetian A, Hadaegh F, Azizi F. Prevalence of metabolic syndrome in Iranian adult population, concordance between the IDF with the ATPIII and the WHO definitions. Diabetes Res Clin Pract. 2007;77(2):251–257. doi:10.1016/j.diabres.2006.12.001
7. Azizi F, Salehi P, Etemadi A, Zahedi-Asl S. Prevalence of metabolic syndrome in an urban population: Tehran lipid and glucose study. Diabetes Res Clin Pract. 2003;61(1):29–37. doi:10.1016/S0168-8227(03)00066-4
8. Grundy S, Cleeman JI, Daniels SR, et al. Diagnosis and management of the metabolic syndrome: an American heart association/national heart, lung, and blood institute scientific statement. Circulation. 2005;112(17):2735–2752. doi:10.1161/CIRCULATIONAHA.105.169404
9. Noda H, Iso H, Saito I, Konishi M, Inoue M, Tsugane S. The impact of the metabolic syndrome and its components on the incidence of ischemic heart disease and stroke: the Japan public health center-based study. Hypertens Res. 2009;32(4):289–298. doi:10.1038/hr.2009.14
10. Galassi A, Reynolds K, He J. Metabolic syndrome and risk of cardiovascular disease: a meta-analysis. Am J Med. 2006;119(10):812–819. doi:10.1016/j.amjmed.2006.02.031
11. Mehta RH, Westerhout CM, Zheng Y, et al. Association of metabolic syndrome and its individual components with outcomes among patients with high-risk non–ST-segment elevation acute coronary syndromes. Am Heart J. 2014;168(2):182–188. e181. doi:10.1016/j.ahj.2014.04.009
12. Sarrafzadegan N, Mohammadifard N. Cardiovascular disease in iran in the last 40 years: prevalence, mortality, morbidity, challenges and strategies for cardiovascular prevention. Arch Iran Med. 2019;22(4).
13. Naghavi M, Shahraz S, Sepanlou SG, et al. Health transition in Iran toward chronic diseases based on results of global burden of disease 2010. Arch Iran Med. 2014;17(5):321. doi:0141707/AIM.009
14. Queen SR, Smulevitz B, Rentfro AR, et al. Electrocardiographic abnormalities among Mexican Americans: correlations with diabetes, obesity, and the metabolic syndrome. World J Cardiovasc Dis. 2012;2(2):50. doi:10.4236/wjcd.2012.22009
15. Safar ME, Thomas F, Blacher J, et al. Metabolic syndrome and age-related progression of aortic stiffness. J Am Coll Cardiol. 2006;47(1):72–75. doi:10.1016/j.jacc.2005.08.052
16. Kors JA, de Bruyne MC, Hoes AW, et al. T axis as an indicator of risk of cardiac events in elderly people. Lancet. 1998;352(9128):601–605. doi:10.1016/S0140-6736(97)10190-8
17. Rago L, Di Castelnuovo A, Assanelli D, et al. T-wave axis deviation, metabolic syndrome and estimated cardiovascular risk–in men and women of the MOLI-SANI study. Atherosclerosis. 2013;226(2):412–418. doi:10.1016/j.atherosclerosis.2012.11.010
18. Jiang X, Liu X, Wu S, et al. Metabolic syndrome is associated with and predicted by resting heart rate: a cross-sectional and longitudinal study. Heart. 2015;101(1):44–49. doi:10.1136/heartjnl-2014-305685
19. Tokatli A, Kiliçaslan F, Alis M, Yiginer O, Uzun M. Prolonged Tp-e interval, Tp-e/QT ratio and Tp-e/QTc ratio in patients with type 2 diabetes mellitus. Endocrinol Metab. 2016;31(1):105–112. doi:10.3803/EnM.2016.31.1.105
20. Kuzu F. The effect of type 2 diabetes on electrocardiographic markers of significant cardiac events. Pak J Med Sci. 2018;34(3):626. doi:10.12669/pjms.343.14562
21. Ahmad MI, Mongraw‐Chaffin M, Lewis KH, Chen H, Ard JD, Soliman EZ. Association of obesity phenotypes with electrocardiographic markers of poor outcomes in the general population. Obesity. 2019;27(12):2076–2083. doi:10.1002/oby.22647
22. Elffers TW, de Mutsert R, Lamb HJ, et al. Relation of overall and abdominal adiposity with electrocardiogram parameters of subclinical cardiovascular disease in individuals aged 45 to 65 years (from the Netherlands epidemiology of obesity study). Am J Cardiol. 2018;121(5):570–578. doi:10.1016/j.amjcard.2017.11.030
23. Elffers TW, de Mutsert R, Lamb HJ, et al. Association of metabolic syndrome and electrocardiographic markers of subclinical cardiovascular disease. Diabetol Metab Syndr. 2017;9(1):40. doi:10.1186/s13098-017-0238-9
24. Esteghamati A, Hafezi-Nejad N, Sheikhbahaei S, et al. Risk of coronary heart disease associated with metabolic syndrome and its individual components in Iranian subjects: a matched cohort study. J Clin Lipidol. 2014;8(3):279–286. doi:10.1016/j.jacl.2014.02.002
25. Farjam M, Bahrami H, Bahramali E, et al. A cohort study protocol to analyze the predisposing factors to common chronic non-communicable diseases in rural areas: fasa cohort study. BMC Public Health. 2016;16(1):1090. doi:10.1186/s12889-016-3760-z
26. Woosley R, Heise CW, Romero KA Available from: www.Crediblemeds.org.
27. Friedewald WT, Levy RI, Fredrickson DS. Estimation of the concentration of low-density lipoprotein cholesterol in plasma, without use of the preparative ultracentrifuge. Clin Chem. 1972;18(6):499–502. doi:10.1093/clinchem/18.6.499
28. Kivimèki M, Lawlor DA, Smith GD, et al. Association of age at menarche with cardiovascular risk factors, vascular structure, and function in adulthood: the cardiovascular risk in young Finns study. Am J Clin Nutr. 2008;87(6):1876–1882. doi:10.1093/ajcn/87.6.1876
29. Bazett HC. An analysis of the time relations of electrocardiograms. Heart. 1920;7:353–370.
30. Sokolow M, Lyon TP. The ventricular complex in left ventricular hypertrophy as obtained by unipolar precordial and limb leads. Am Heart J. 1949;37(2):161–186. doi:10.1016/0002-8703(49)90562-1
31. Enas EA, Mohan V, Deepa M, Farooq S, Pazhoor S, Chennikkara H. The metabolic syndrome and dyslipidemia among Asian Indians: a population with high rates of diabetes and premature coronary artery disease. J Cardiometab Syndr. 2007;2(4):267–275. doi:10.1111/j.1559-4564.2007.07392.x
32. Graner M, Pentikäinen M, Siren R, et al. Electrocardiographic changes associated with insulin resistance. Nutr Metab Cardiovasc Dis. 2014;24(3):315–320. doi:10.1016/j.numecd.2013.09.013
33. Ebong IA, Bertoni AG, Soliman EZ, et al. Electrocardiographic abnormalities associated with the metabolic syndrome and its components: the multi-ethnic study of atherosclerosis. Metab Syndr Relat Disord. 2012;10(2):92–97. doi:10.1089/met.2011.0090
34. Paudyal A, Dev Bhattarai M, Bahadur Karki B, Bajracharya MR, Rajouria AD, Pradhan A. Left axis deviation in electrocardiogram with normal QRS duration in ambulatory adults without cardiac symptoms: a possible marker of glucose intolerance. J Nepal Med Assoc. 2013;52(192). doi:10.31729/jnma.2425
35. McDonagh E, Rudolph C, Cheraskin E. The relationship of subtle differences in fasting blood glucose with subtle differences in the electrocardiogram: a study of the PR interval. Med Hypotheses. 1982;8(3):261–268. doi:10.1016/0306-9877(82)90122-0
36. Alonso A, Soliman EZ, Chen LY, Bluemke DA, Heckbert SR. Association of blood pressure and aortic distensibility with P wave indices and PR interval: the multi-ethnic study of atherosclerosis (MESA). J Electrocardiol. 2013;46(4):
37. Huang Y, Tang S, Chen J-Y, et al. Central aortic systolic blood pressure can predict prolonged QTc duration better than brachial artery systolic blood pressure in rural community residents. Clin Exp Hypertens. 2018;40(3):238–243. doi:10.1080/10641963.2017.1356843
38. 林夏怡, 温似春, 汤松涛, 黄雨晴, 冯颖青. Central aortic systolic blood pressure can better predict prolonged QRS duration than brachial artery systolic blood pressure in rural community residents. South China J Cardiol. 2017;(3):5.
39. Adegoke SA, Okeniyi JAO, Akintunde AA. Electrocardiographic abnormalities and dyslipidaemic syndrome in children with sickle cell anaemia. Cardiovasc J Afr. 2016;22(1):16. doi:10.5830/CVJA-2015-059
40. Del Giorno R, Gabutti S, Troiani C, et al. Association between HDL cholesterol and QTc interval: a population-based epidemiological study. J Clin Med. 2019;8(10):1527. doi:10.3390/jcm8101527
41. Eisenstein I, Edelstein J, Sarma R, Sanmarco M, Selvester RH. The electrocardiogram in obesity. J Electrocardiol. 1982;15(2):115–118. doi:10.1016/S0022-0736(82)80003-4
42. Landsberg L. Diet, Obesity and Hypertension: An Hypothesis Involving Insulin, the Sympathetic Nervous System, and Adaptive Thermogenesis. Citeseer; 1986.
43. Krauser DG, Devereux RB. Ventricular hypertrophy and hypertension. Herz Kardiovaskuläre Erkrankungen. 2006;31(4):305–316.
44. Alpert MA, Terry BE, Cohen MV, Fan TM, Painter JA, Massey CV. The electrocardiogram in morbid obesity. Am J Cardiol. 2000;85(7):908–910. doi:10.1016/S0002-9149(99)00894-2
45. Magnani JW, Lopez FL, Soliman EZ, Maclehose RF, Crow RS, Alonso A. P wave indices, obesity, and the metabolic syndrome: the atherosclerosis risk in communities study. Obesity. 2012;20(3):666–672. doi:10.1038/oby.2011.53
46. Abel ED, Litwin SE, Sweeney G. Cardiac remodeling in obesity. Physiol Rev. 2008;88(2):389–419. doi:10.1152/physrev.00017.2007
47. Fox KA, Despres J-P, Richard A-J, Brette S, Deanfield JE. Does abdominal obesity have a similar impact on cardiovascular disease and diabetes? A study of 91 246 ambulant patients in 27 European Countries. Eur Heart J. 2009;30(24):3055–3063. doi:10.1093/eurheartj/ehp371
 © 2020 The Author(s). This work is published and licensed by Dove Medical Press Limited. The full terms of this license are available at https://www.dovepress.com/terms.php and incorporate the Creative Commons Attribution - Non Commercial (unported, v3.0) License.
By accessing the work you hereby accept the Terms. Non-commercial uses of the work are permitted without any further permission from Dove Medical Press Limited, provided the work is properly attributed. For permission for commercial use of this work, please see paragraphs 4.2 and 5 of our Terms.
© 2020 The Author(s). This work is published and licensed by Dove Medical Press Limited. The full terms of this license are available at https://www.dovepress.com/terms.php and incorporate the Creative Commons Attribution - Non Commercial (unported, v3.0) License.
By accessing the work you hereby accept the Terms. Non-commercial uses of the work are permitted without any further permission from Dove Medical Press Limited, provided the work is properly attributed. For permission for commercial use of this work, please see paragraphs 4.2 and 5 of our Terms.