")
Back to Journals » Risk Management and Healthcare Policy » Volume 15
The Association of Eating Behaviour on the Growth of Children from the Interior Districts of Sabah, Malaysia
Authors Tan ECH , Avoi R , Robinson F , Jeffree MS , Syed Abdul Rahim SS , Ibrahim MY, Mohd Yusuff AS , Lukman KA
Received 22 October 2021
Accepted for publication 11 December 2021
Published 2 April 2022 Volume 2022:15 Pages 563—570
DOI https://doi.org/10.2147/RMHP.S330358
Checked for plagiarism Yes
Review by Single anonymous peer review
Peer reviewer comments 2
Editor who approved publication: Professor Mecit Can Emre Simsekler
Eric Chee How Tan,1,2 Richard Avoi,1 Fredie Robinson,1 Mohammad Saffree Jeffree,1 Syed Sharizman Syed Abdul Rahim,1 Mohd Yusof Ibrahim,1 Aza Sherin Mohd Yusuff,3 Khamisah Awang Lukman1,4
1Department of Community and Family Medicine, Faculty of Medicine and Health Sciences, Universiti Malaysia Sabah, Kota Kinabalu, Sabah, Malaysia; 2Tawau Area Health Office, Ministry of Health Malaysia, Tawau, Sabah, Malaysia; 3Faculty of Medicine and Health Sciences, Universiti Sains Islam Malaysia, Nilai, Negeri Sembilan, Malaysia; 4Center for Occupational Safety & Health, Universiti Malaysia Sabah, Kota Kinabalu, Sabah, Malaysia
Correspondence: Khamisah Awang Lukman, Tel +60198337543, Email [email protected]
Background: The double burden of malnutrition among children is an emerging public health problem, especially in developing countries. Eating behaviours have been hypothesised to contribute to both being underweight and overweight in children and adults. The objective of this study was to examine the association between the Child Eating Behaviour Questionnaire (CEBQ) subscale scores and body mass index (BMI) z-scores among Malaysian children under-5 years.
Methods: This was a cross-sectional study conducted in 2020 by recruiting a sample of 500 children aged 24– 59 months old from clinics located in the interior districts of Sabah, Malaysia. The CEBQ was completed by the mothers on behalf of the child to assess their eating behaviour traits. The height and weight of the child were measured using standardised instrument. The BMI-for-age percentile, z-scores for BMI-for-age, height-for-age and weight-for-age were determined and classified using World Health Organization AnthroPlus software. The relationship between the CEBQ subscale scores and BMI z-scores were evaluated using multiple linear regression models adjusting for potential confounders.
Results: The prevalence of underweight, stunting and wasting were 20.2%, 29.2% and 5.6%, respectively, whereas the prevalence of overweight and obese was 5.0%. There were significant positive association between Food responsiveness, Emotional overeating, Enjoyment of food with BMI z-scores (p< 0.05; unstandardised regression coefficient: 0.17 to 0.38). In contrast, there were significant negative association between Satiety responsiveness, Slowness of eating, Food fussiness with BMI z-scores (p< 0.01; unstandardised regression coefficient: − 0.35 to − 0.36).
Conclusion: These findings show that specific eating behaviours can influence the growth of children under-5 years. Therefore, policymakers should formulate a nutrition policy that incorporates behavioural assessment and behavioural intervention in the prevention and management of malnutrition among children in Malaysia.
Keywords: appetite, malnutrition, Child Eating Behaviour Questionnaire, body mass index
Introduction
The emergence of double burden of malnutrition among children is a public health problem, especially in developing countries such as Malaysia.1 Malaysia’s National Health and Morbidity Survey (NHMS) in 2019 reported that the prevalence of stunting, underweight, wasting, overweight, and obesity were 21.8%, 14.1%, 9.4% and 5.6%, respectively, among Malaysian children under-5 years.2 Individual differences in eating behaviour have been hypothesised to contribute both to being underweight and overweight.3
Children’s Eating Behaviour Questionnaire (CEBQ) is a validated questionnaire that is feasible in large studies to assess the eight types of eating behaviours in children.3 The CEBQ contains four subscales that measure “food approach” behaviours such as Food Responsiveness (FR), Enjoyment of Food (EF), Emotional Overeating (EOE), Desire to Drink (DD) and four subscales that measure “food avoidant” behaviours, namely Satiety Responsiveness (SR), Slowness in Eating (SE), Emotional Undereating (EUE), Food Fussiness (FF).4
FR refers to the tendency to eat in response to food cues such as sight and smell of food; meanwhile, EF reflects a more general interest in food and desire to eat.5 EOE refers to overeating in response to negative emotions, whereas EUE represents a reduction in consumption due to emotional discomfort or distress.3 DD is described as wanting to consume sugar-sweetened beverages.3 The reduction of eating speed during a meal because of lack of interest in food characterises SE.6 SR reflects the ability to adjust eating in response to internal feelings of satiety.7 FF refers to being highly selective about which food to eat and indicates a rejection of specific foods, including unfamiliar and new foods.6
The eating behaviour patterns become established at the end of the preschool period and tend to remain stable through the life of the child.8 As a result, children affected by overweight or obesity were prone to remain overweight or obese in adulthood.9 Thus, research should primarily focus on eating behaviours in young children, unlike previous paediatric studies that mainly involve school-aged children and adolescent.10 The objective of this study was to examine the association between the scores of the Child Eating Behaviour Questionnaire and BMI z-scores among Malaysian children under-5 years.
Methodology
Design and Study Population
This was a cross-sectional analytical study, which was conducted in the district of Tenom, Keningau, Nabawan and Tambunan in the state of Sabah, Malaysia, from July to October 2020. The sampling frame was children aged 24–59 months old who were under follow up with the participating public-funded health facilities within the study period. A total of 550 samples were selected via proportionate stratified random sampling from the 15 participating health facilities. Of these, a total of 500 children who had complete data for the questionnaire were included in the analysis with a response rate of 91%.
There were two sets of respondents, the children and their caretakers. Children aged 24–59 months old were eligible for the study if they were Malaysian citizens and residents in the district of Tenom, Keningau, Tambunan and Nabawan. Children who had a mental disorder, physical disability or suffering any serious disease were excluded from this study. Informed consent was obtained from the adult respondents and conformed to the Malaysian ethical standard for research. This study was conducted in accordance with the Declaration of Helsinki. Full ethical approvals were obtained from the Medical Research and Ethics Committee of the Ministry of Health Malaysia (NMRR-19-2468-49983) and from University Malaysia Sabah (JKEtika3/19(28)).
Questionnaire
The nurses from all the health facilities were trained by the researchers for the administration of the questionnaires during the interview sessions. The questionnaire comprises questions relating to the CEBQ subscales, socioeconomic and demographic status of the child and caretaker. The CEBQ is a 35-item parent-rated validated questionnaire designed to measure the eating behaviours using a 1–5 Likert scale from “never” to ‘always’. The CEBQ has a good internal consistency with Cronbach’s α ranging between 0.72 to 0.91 and adequate test-retest reliability (r: 0.52–0.87).3
The CEBQ consists of eight subscales, with each subscale containing three to six items. The scoring of the CEBQ subscales is obtained by adding up the scores of questions that belonged to the same subscale producing the item mean value and standard deviation of the eight subscales. The CEBQ questionnaire was previously translated to Malay via forward and backward translation by Loh et al.5 Prior permission was obtained from Dr Clare Llewellyn to use the English and Malay version of CEBQ. Written informed consent was obtained from all the respondents prior to the study.
Anthropometric Measurement
Anthropometric measurements on children under-5 years were performed by trained clinical staff following a standard protocol. Children barefooted in lightweight clothing were asked to step on the calibrated digital weighing scale (SECA model 708), which measured the weight of the child to the nearest 10g. The height of the children was measured with a SECA stadiometer. The BMI-for-age percentile, z-scores for BMI-for-age, Height-for-age, Weight-for-age were determined and classified using World Health Organization AnthroPlus software version 1.0.4.
Statistical Analysis
Data that were obtained from the questionnaires were cleaned, edited, coded and analysed with SPSS version 23. The prevalence of the nutritional status of the children is expressed as frequency (percentage) with 95% confidence interval. The nutritional status is determined based on the z-scores for BMI-for-age, Height-for-age, Weight-for-age. The BMI-for-age percentile is also classified into four groups of BMI categories, namely underweight (<5th centile), normal weight (≥5th to ≤85th centile), overweight (>85th to ≤95th centile) and obese (>95th centile).11
Descriptive analysis was conducted on the demographic and socioeconomic characteristics of the study respondents. Pearson’s correlation was computed to evaluate the relationships between mean item scale scores between CEBQ subscales. Based on Cohen’s criteria, the correlation coefficient represents the effect size of the correlation where correlation between 0.50 and 1.00 is regarded as large, correlations between 0.30 to 0.49 is considered medium, while the correlation between 0.10 and 0.29 is considered small.12
Simple linear regression analyses were conducted to determine the association between CEBQ subscale score, age, ethnicity, household income, parental smoking and education level with child BMI z-scores. The socioeconomic and demographic factors that were significant from the univariable analysis were included in multiple linear regression analysis. The relationship between the CEBQ subscale scores and BMI z-scores were evaluated using multiple linear regression models adjusting for potential confounders, namely sex, ethnicity, household income, education level and occupation.
Two different models were presented in this current study. Model 1 shows the unadjusted unstandardised regression coefficient (B) results of all eight dimensions of CEBQ subscales. Model 2 shows the adjusted unstandardised regression coefficient results after adjusting for confounding variables. The level of significance was set at 5%. The mean scores on CEBQ were then plotted for each weight category to visually demonstrate the differences between the BMI group.
Results
Sample Characteristics
The prevalence of undernutrition among children under-5 years using the conventional measures were underweight 20.2%, stunting 29.2% and wasting 5.6%; meanwhile, the prevalence of overweight and obese was 5.0% (Table 1). The mean age of the study population was 38.91 ± 11.33 months. The three age groups were approximately the same size. As shown in Table 2, the male sex slightly outnumbers the female sex. The majority of the children included in the study population (78.6%) had normal weight. Children with overweight and obesity were more often of non-Kadazandusun and non-Murut origin.
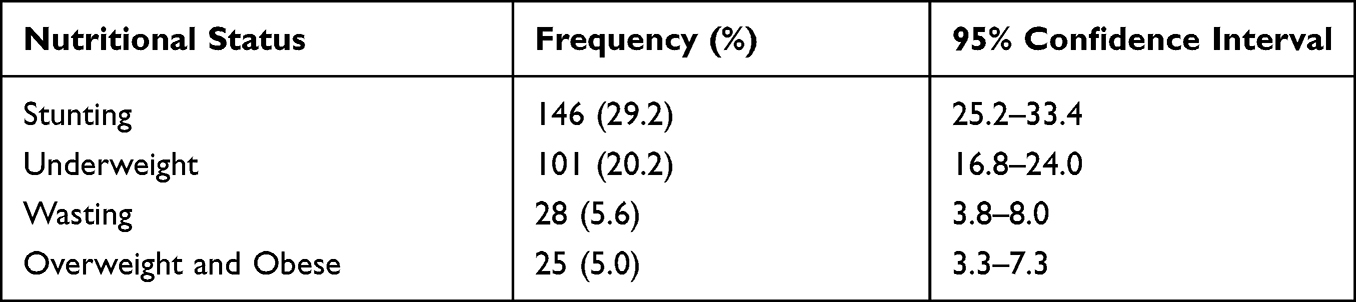 |
Table 1 Prevalence of Stunting, Underweight, Wasting and Overweight and Obese Among Children Under-5 Years in the Interior Districts of Sabah in 2020 |
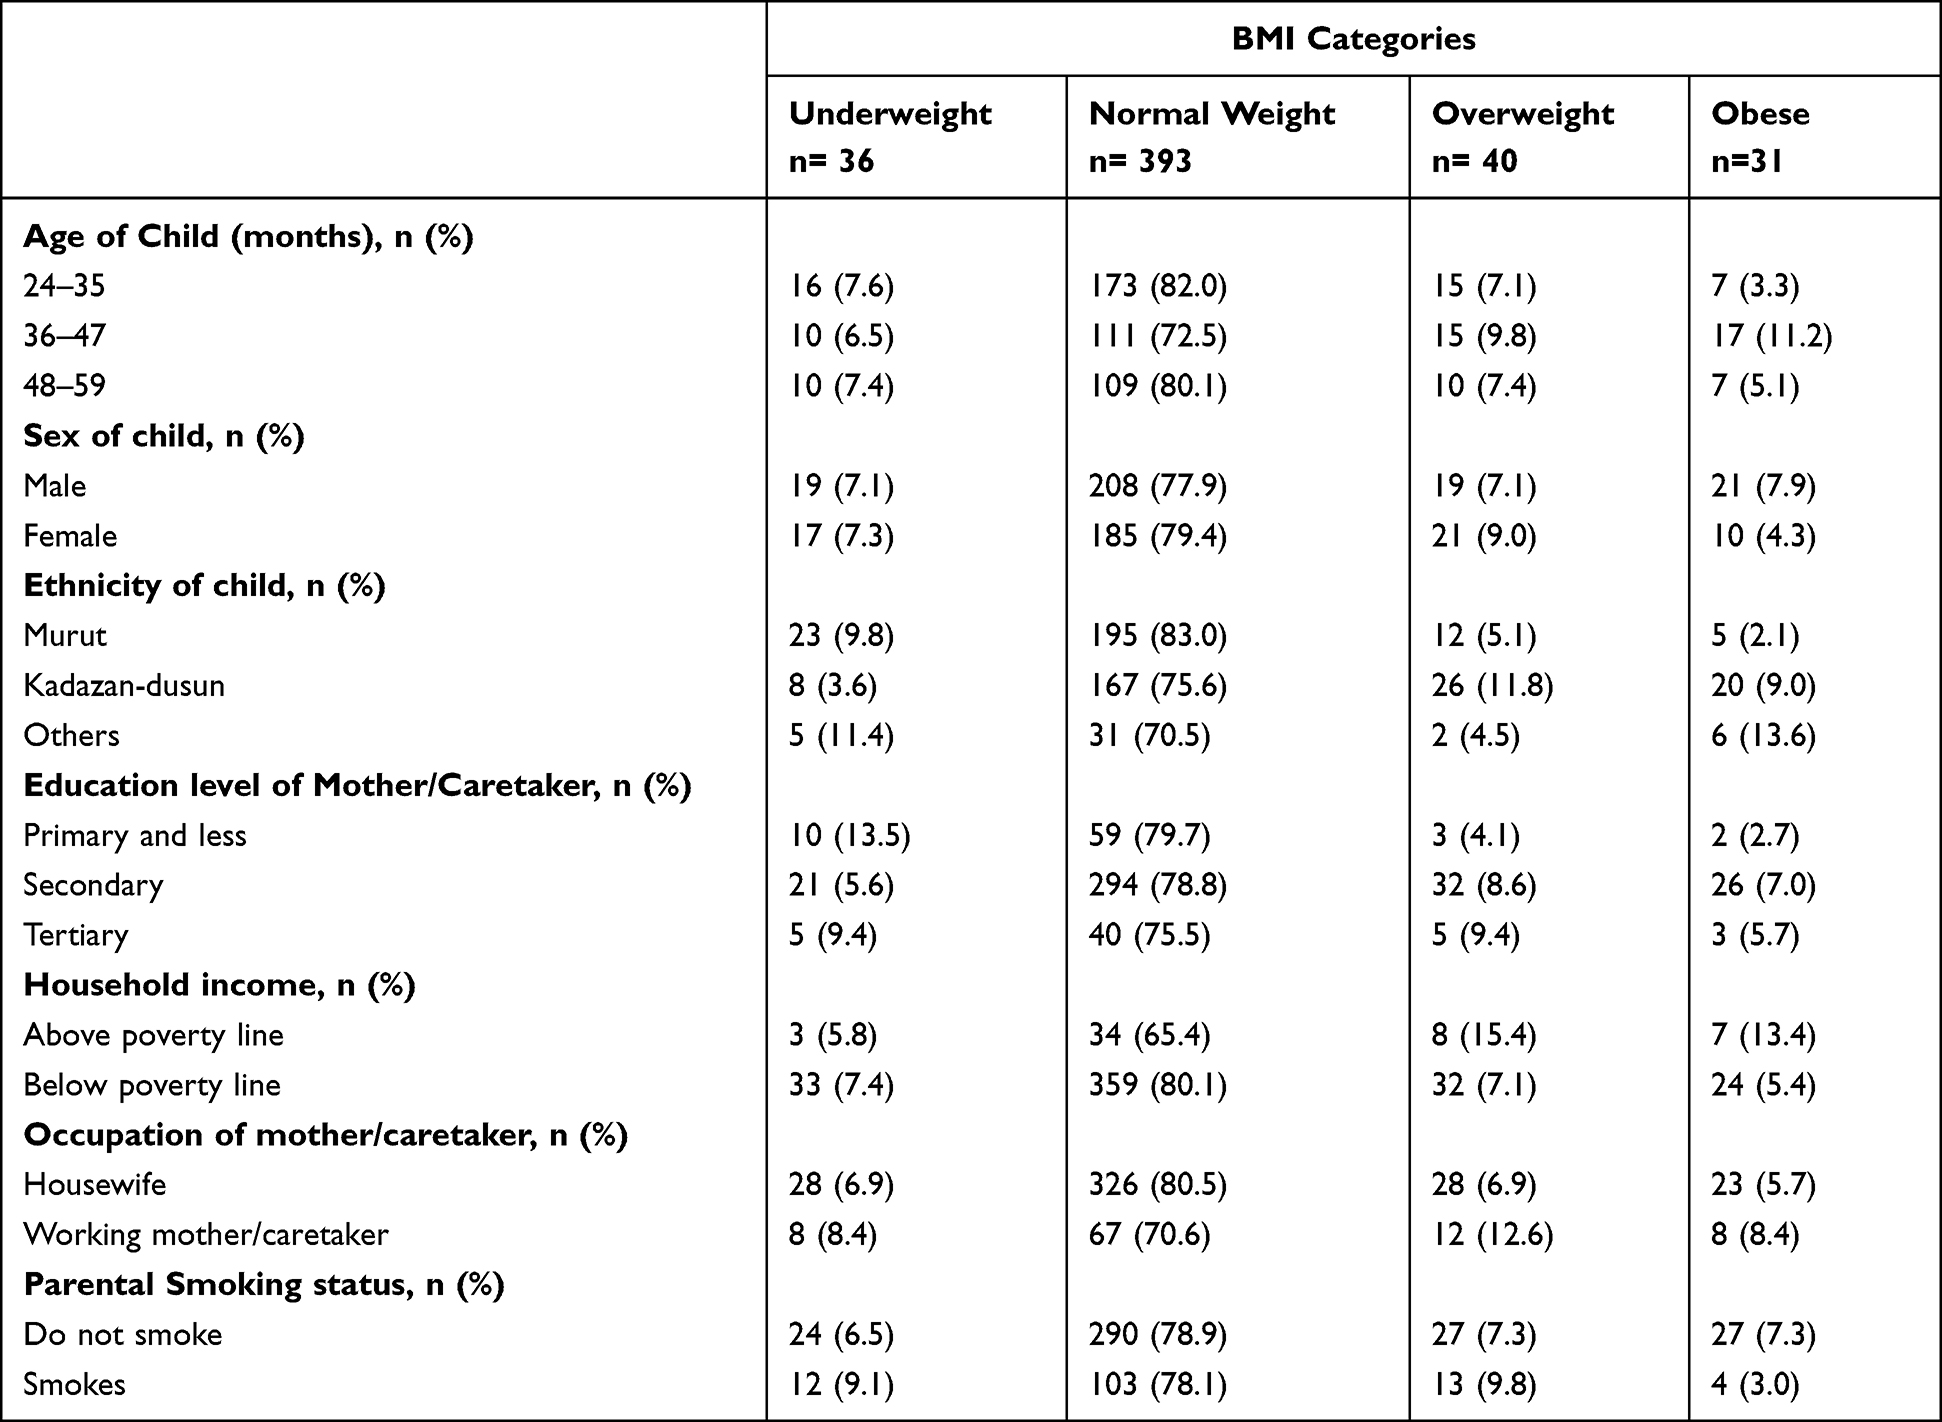 |
Table 2 Sociodemographic Characteristics of Children and Their Parents According to the BMI Categories of Children Under-5 Years in the District of Keningau, Tenom, Tambunan and Nabawan |
In contrast, higher proportions of children from the Murut ethnicity were found to be underweight. Mothers or caretakers of underweight children were more often lower educated; meanwhile, those with tertiary education more often had overweight and obese children. Apart from that, families with household income above the poverty line were reported as 15.4% overweight, 13.4% obese and 5.8% underweight. On the contrary, 7.4% of children were underweight, 7.1% overweight, and 5.4% obese were from families with household income below the poverty line. The poverty line income for Sabah was RM 2537 in 2019.13
Correlations Between Scales
As shown in Table 3, a large effect size correlation between “food approach” subscales were observed for EF – FR, whereas medium correlations were found for FR – EOE subscales and FR – DD. Besides that, small correlations were reported between “food approach” subscales for EF – EOE, EF – DD subscales and EOE – DD. In contrast, a large effect size correlation was observed between the “food avoidant” subscales, namely, SR – SE, meanwhile medium correlations were found between FF – SR and EUE – SE. Moreover, small correlations were reported between “food avoidant” subscales for FF– EUE and EUE – SR.
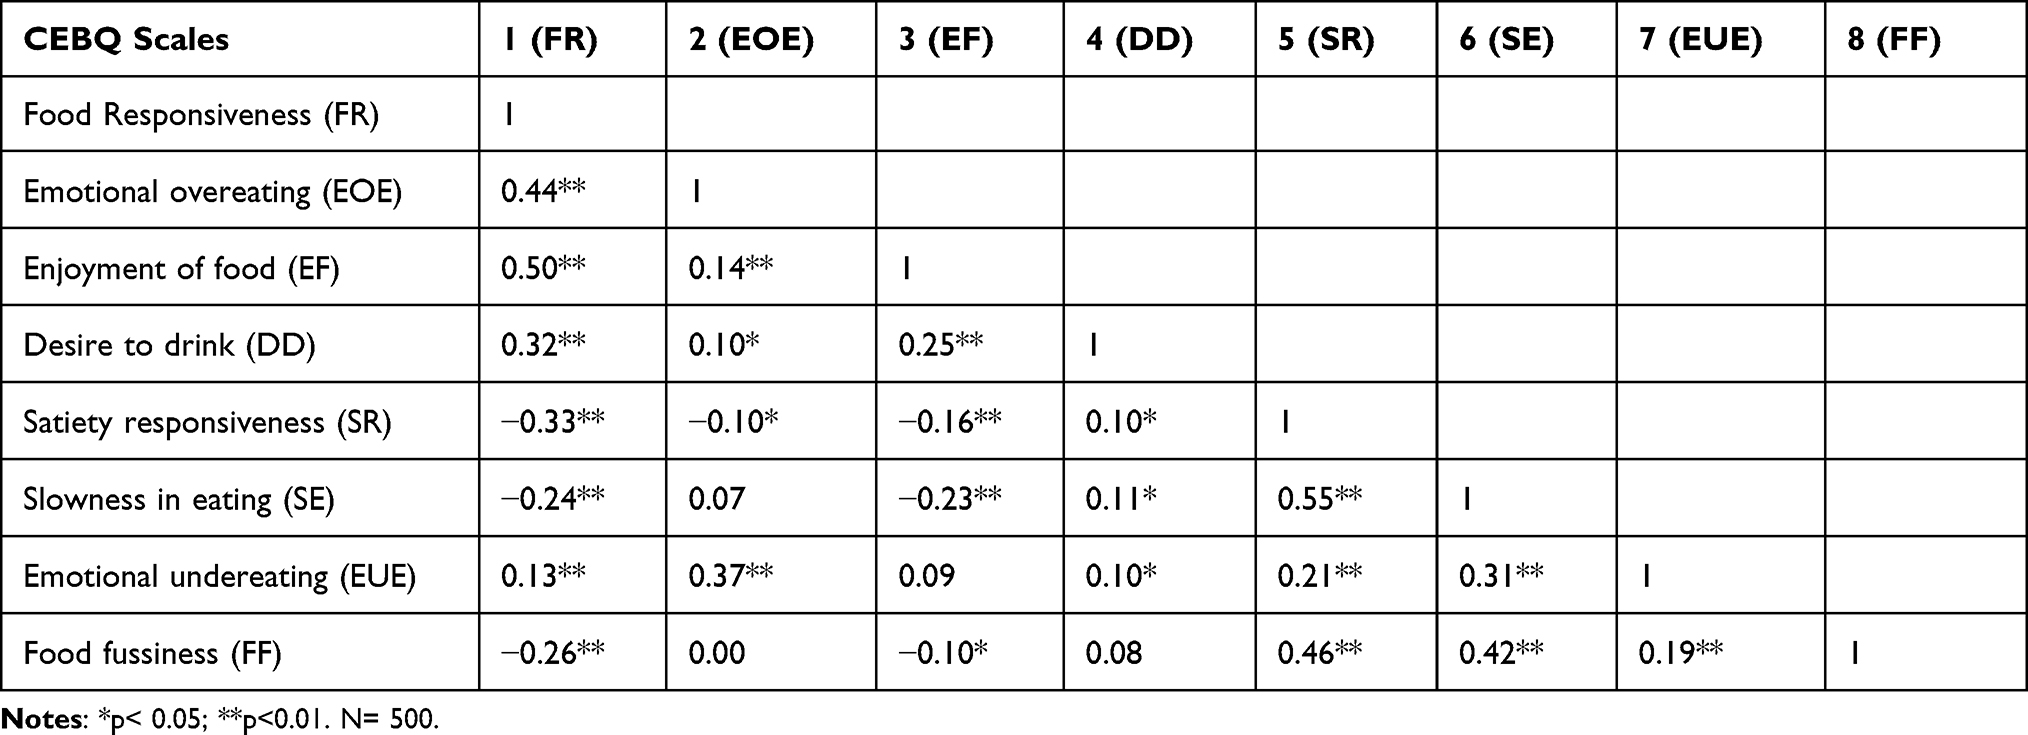 |
Table 3 Pearson’s Correlations Between the CEBQ Subscales |
Regression Analysis
Table 4 presents a summary of the Simple Linear Regression and Multiple linear regression analyses of CEBQ subscales scores with BMI z-scores adjusted for confounders such as sex, ethnicity, household income, education level and occupation. There were significant positive association between FR, EOE, EF with BMI z-score. Adjusted for confounders, for every unit increase in FR, EOE and EF, there were corresponding increase in BMI z-scores by 0.17 (B: 0.17; 95% confidence interval between 0.03 to 0.30, p<0.05), 0.38 (B: 0.38; 95% confidence interval between 0.27 to 0.49, p<0.01) and 0.24 (B: 0.24; 95% confidence interval between 0.13 to 0.35, p<0.01) respectively.
 |
Table 4 Multiple Linear Regression Analyses CEBQ Subscale Scores and BMI z-Scores |
In contrast, there were significant negative association between SR, SE, FF with BMI z-scores. Specifically, after adjusting for confounders, one unit increase in SR, SE and FF decrease the BMI z-scores by 0.35 (B: −0.35; 95% confidence interval between −0.53 to −0.18, p<0.01), 0.35 (B: −0.35; 95% confidence interval between −0.52 to −0.20, p<0.01) and 0.36 (B: −0.36; 95% confidence interval between −0.54 to −0.19, p<0.01) respectively. There were no significant association observed between DD, EUE, with BMI z-scores.
This current study demonstrates a positive graded relation between the magnitude of these “food approach” eating behaviours scores with BMI categories (Figure 1). Meanwhile, there appears to be a negative graded relation between the mean “food avoidant” eating behaviours scores with BMI categories (Figure 2).
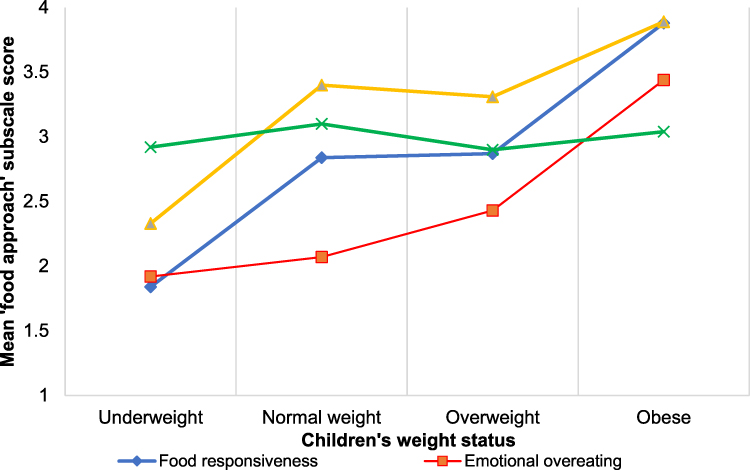 |
Figure 1 Mean “food approach” subscale scores by body mass index category. |
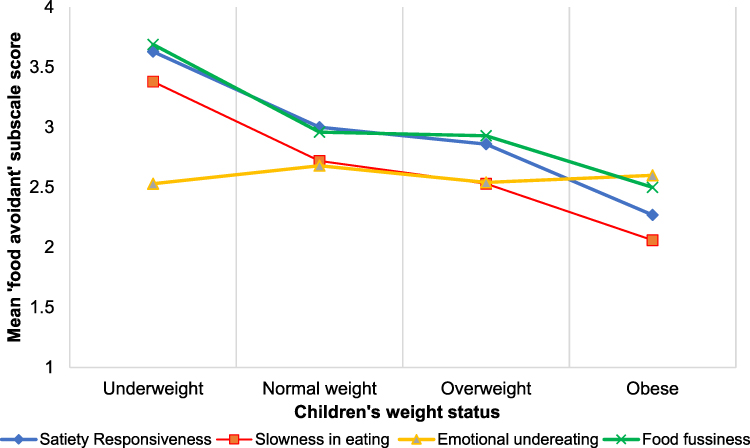 |
Figure 2 Mean “food avoidant” subscale scores by body mass index category. |
Discussion
To the best of my knowledge, this present study is the first to investigate the effects of eating behaviours on the BMI z-scores among children under-5 years in Malaysia and in the state of Sabah. The current study reported a higher prevalence of stunting among children under-5 years in the interior districts of Sabah as compared to the national average. This was consistent with the findings from the NHMS 2019, which recorded a higher prevalence of stunting in rural areas as compared to urban areas.2
This present study demonstrated that FR, EF, DD and EOE were positively correlated as each scale independently, hence collectively known as “food approach” eating behaviour. Likewise, the CEBQ subscales of SR, SE, EUE, FF also demonstrated positive inter-correlations between each scale independently, which represents “Food avoidant” eating behaviour. These findings were comparable with prior research.3,4,14 “Food approach” eating behaviours refers to the behaviour of moving towards or a desire for food, whereas “food avoidant” eating behaviours refers to the behaviour of moving away from food.
Interestingly, this present study unravels a positive association observed between FR and BMI z-score. A possible explanation is that children with high FR are generally more responsive to the food cues from the environment, such as sight and smell of food, compared to children with low FR.3 These findings were consistent with the previous studies.4,14,15 Moreover, FR becomes more apparent as the children get older and more autonomous in their eating habits.4 Thus, FR eating behaviour could be a potential behavioural predictor of the individual’s susceptibility to obesity.
As hypothesised, the EF was positively related with the BMI z-score similarly with FR since both eating behaviours promote the intake of food. This is further substantiated by a large effect correlation observed between EF–FR, which suggest that EF is comparable to FR eating behaviour but involves a more general interest in food and desire to eat.3 Theoretically, the CEBQ subscales of EF and FR capture the activation of the hedonic control of the appetite system.16 The current study findings suggest that the high-level EF appetitive trait in children may contribute to weight gain, which ultimately leads to obesity.
The positive relationship observed between EOE and BMI z-score replicates the prior findings.4,15 This finding presented here further substantiated previous literature regarding the proposed idea originated in the psychosomatic theory of obesity that eating due to emotional stress rather than due to hunger may result in excessive weight gain.15 Moreover, more often, the composition of food consumed by emotional eaters is high in sugar content, laden with fat and energy-dense foods that invariably increases the risk of developing obesity. However, this finding contradicts previous studies.14,17 Jansen et al argue that EOE onset occurs later in life because the children are probably too young to exhibit excessive eating and snacking behaviour and may not have free access to foods yet.17
In line with our hypothesis, a significant inverse relationship was observed between SR with BMI z-score, which supports the notion that children who have a higher level of SR eating behaviour tend to have lower BMI z-scores. This finding concurs with the previous studies.4,15 The possible explanation is that children with a high level of SR are generally more sensitive to internal satiety cues, which contributes to their capability to have better control over their food consumption.4 This is in line with a previous study that shows that overweight and underweight children have different satiety responses as compared to normal weight children.17
This current study demonstrated that the BMI z-score was inversely associated with FF. This observation mirrors previous work, which shows that children having higher levels of FF tend to have lower BMI z-score as compared to those with low levels of the corresponding eating behaviours.4,15 Children with high-level FF tend to consume food that is less diverse which may lack essential nutrients such as vitamins, minerals, proteins and fibres.17 As a result, children that consume insufficient nutrients hinders their own adequate weight gain and growth, which ultimately leads them to become underweight, stunted and/or wasted in the long term.17–19
There were significant negative association between SE with BMI z-scores. Okubo et al postulate that individuals who eat quickly tend to have consumed higher calories as compared to individuals who eat slowly, as they consume more food before the brain recognises the satiety cues.20 The slow eating rate can also be attributed to the lack of enjoyment and interest in food.6 Furthermore, a previous study also demonstrated that overweight and obese children tend to eat faster with a greater bite-size compared to normal weight children.21
This present study has limitations that warrant discussion. The study is a cross-sectional study which does not allow for causal inferences to be made. The responses for the CEBQ were subjectively obtained from the mother or caretaker of the child that was subjected to information bias. In addition, the sample population might not be representative of the children aged 24–59 months from the entire state of Sabah and Malaysia, as the data collection is only confined to the four interior districts of Sabah.
Conclusion
In conclusion, these findings found that most “food approach” eating behaviours were positively associated with BMI z-scores, whereas most “food avoidant” eating behaviours were inversely associated with BMI z-score among children under-5 years. Therefore, policymakers should formulate a nutrition policy that incorporates behavioural assessment and behavioural intervention in the prevention and management of malnutrition among children in Malaysia. A future longitudinal study will be a valuable addition to strengthen the inferences and allow for a clearer understanding of the impact of eating behaviours on the growth of children under-5 years.
Acknowledgment
The authors would like to thank the Director General of Health Malaysia for the permission to publish this paper. The authors would also like to thank all the participating health clinics and nurses working in the Ministry of Health for facilitating data collection. The authors are also indebted to the mothers of the children or caretakers for their participation in the study. I would like to gratefully acknowledge the permission given by Dr Clare Llewellyn to use the Child Eating Behaviour Questionnaire in my present study.
Funding
The study was supported by the UMSGreat research grant from University Malaysia Sabah (GUG0369-1/2019).
Disclosure
The authors declare that they have no competing interests in this work.
References
1. Wan Muda WM, Sundaram JK, Tan ZG. Addressing malnutrition in Malaysia. Khazanah Research Institute; 2019. Available from: http://www.krinstitute.org/assets/contentMS/img/template/editor/Discussion.Paper_Addressing.Malnutrition.in.Malaysia.pdf.
2. Institute for Public Health. Non-communicable diseases: risk factors and other health problems (Vol. 1); 2019. Available from: http://www.iku.gov.my/nhms-2019.
3. Wardle J, Guthrie CA, Sanderson S, Rapoport L. Development of the children’s eating behaviour questionnaire. J Child Psychol Psychiatry. 2001;42(7):963–970. doi:10.1111/1469-7610.00792
4. Viana V, Sinde S, Saxton JC. Children’s eating behaviour questionnaire: associations with BMI in Portuguese children. Br J Nutr. 2008;100(2):445–450. doi:10.1017/S0007114508894391
5. Loh DA, Moy FM, Zaharan NL, Mohamed Z. Eating behaviour among multi-ethnic adolescents in a middle-income country as measured by the self-reported children’s eating behaviour questionnaire. PLoS One. 2013;8(12):1–12. doi:10.1371/journal.pone.0082885
6. Tay CW, Chin YS, Lee ST, Khouw I, Poh BK. Association of eating behavior with nutritional status and body composition in primary school-aged children. Asia Pac J Public Health. 2016;28(5):47S–58S. doi:10.1177/1010539516651475
7. Carnell S, Wardle J. Appetite and adiposity in children: evidence for a behavioral susceptibility theory of obesity. Am J Clin Nutr. 2008;88(1):22–29. doi:10.1093/ajcn/88.1.22
8. Ashcroft J, Semmler C, Carnell S, van Jaarsveld CHM, Wardle J. Continuity and stability of eating behaviour traits in children. Eur J Clin Nutr. 2008;62(8):985–990. doi:10.1038/sj.ejcn.1602855
9. Biro FM, Wien M. Childhood obesity and adult morbidities. Am J Clin Nutr. 2010;91(5):1499–1505. doi:10.3945/ajcn.2010.28701B
10. Alhamad AH. Validation of the Children ‘ s Eating Behaviour Questionnaire (CEBQ) in the population of Saudi preschoolers. University of Waikato; 2013.
11. World Health Organization. The new WHO child growth standards. WHO Press. 2006;52(SUPP.1):13–17. doi:10.4067/S0370-41062009000400012
12. Pallant J. SPSS Survival Manual.
13. Department of Statistics Malaysia. Household income and basic amenities survey report by state and administrative sabah. 2019. Available from: https://www.dosm.gov.my/v1/index.php.
14. Sleddens EFC, Kremers SPJ, Thijs C. The Children’s Eating Behaviour Questionnaire: factorial validity and association with Body Mass Index in Dutch children aged 6–7. Int J Behav Nutr Phys Act. 2008;5:1–9. doi:10.1186/1479-5868-5-49
15. Webber L, Hill C, Saxton J, Van Jaarsveld CHM, Wardle J. Eating behaviour and weight in children. Int J Obes. 2010;33(1):1–14. doi:10.1038/ijo.2008.219
16. Harrold JA, Dovey TM, Blundell JE, Halford JCG. CNS regulation of appetite. Neuropharmacology. 2012;63(1):3–17. doi:10.1016/j.neuropharm.2012.01.007
17. Jansen PW, Roza SJ, Jaddoe VWV, et al. Children’s eating behavior, feeding practices of parents and weight problems in early childhood: results from the population-based Generation R Study. Int J Behav Nutr Phys Act. 2012;9:1–11. doi:10.1186/1479-5868-9-130
18. Tan CH, Maluda M, Yusof MHI, Sherin A, Lukman KA. Intervention to address childhood undernutrition: a systematic review. Borneo Epidemiol J. 2021;2:1–9. doi:10.51200/bej.v2i1.3235
19. Kininmonth A, Smith A, Carnell S, Steinsbekk S, Fildes A, Llewellyn C. The association between childhood adiposity and appetite assessed using the Child Eating Behavior Questionnaire and Baby Eating Behavior Questionnaire: a systematic review and meta-analysis. Obes Rev. 2021;22(5):1–23. doi:10.1111/obr.13169
20. Okubo H, Miyake Y, Sasaki S, Tanaka K, Hirota Y. Rate of eating in early life is positively associated with current and later body mass index among young Japanese children: the Osaka Maternal and Child Health Study. Nutr Res. 2017;37:20–28. doi:10.1016/j.nutres.2016.11.011
21. Passos DR, Gigante DP, Maciel FV, Matijasevich A. Children’s eating behaviour: comparison between normal and overweight children from a school in Pelotas, Rio Grande do Sul, Brazil. Revista Paulista de Pediatria. 2015;33(1):42–49. doi:10.1111/obr.13169
 © 2022 The Author(s). This work is published and licensed by Dove Medical Press Limited. The full terms of this license are available at https://www.dovepress.com/terms.php and incorporate the Creative Commons Attribution - Non Commercial (unported, v3.0) License.
By accessing the work you hereby accept the Terms. Non-commercial uses of the work are permitted without any further permission from Dove Medical Press Limited, provided the work is properly attributed. For permission for commercial use of this work, please see paragraphs 4.2 and 5 of our Terms.
© 2022 The Author(s). This work is published and licensed by Dove Medical Press Limited. The full terms of this license are available at https://www.dovepress.com/terms.php and incorporate the Creative Commons Attribution - Non Commercial (unported, v3.0) License.
By accessing the work you hereby accept the Terms. Non-commercial uses of the work are permitted without any further permission from Dove Medical Press Limited, provided the work is properly attributed. For permission for commercial use of this work, please see paragraphs 4.2 and 5 of our Terms.