")
Back to Journals » Diabetes, Metabolic Syndrome and Obesity » Volume 14
The Association Between Insulin Resistance, Leptin, and Resistin and Diabetic Nephropathy in Type 2 Diabetes Mellitus Patients with Different Body Mass Indexes
Authors Huang J, Peng X, Dong K, Tao J, Yang Y
Received 2 February 2021
Accepted for publication 15 April 2021
Published 24 May 2021 Volume 2021:14 Pages 2357—2365
DOI https://doi.org/10.2147/DMSO.S305054
Checked for plagiarism Yes
Review by Single anonymous peer review
Peer reviewer comments 3
Editor who approved publication: Prof. Dr. Juei-Tang Cheng
Jiaojiao Huang, Xuemin Peng, Kun Dong, Jing Tao, Yan Yang
Department of Endocrinology, Tongji Hospital, Tongji Medical College, Huazhong University of Science and Technology, Wuhan, Hubei, People’s Republic of China
Correspondence: Yan Yang
Department of Endocrinology, Tongji Hospital, Tongji Medical College, Huazhong University of Science and Technology, 1095 Jiefang Avenue, Wuhan, Hubei, 430030, People’s Republic of China
Tel +86-27-83663331
Fax +86-27-83662883
Email [email protected]
Aim: This study aimed to compare HOMA-IR, leptin, and resistin as the risk factors for diabetic nephropathy in the type 2 diabetes mellitus (T2DM) patients with different BMI classifications.
Materials and Methods: A total of 309 patients with T2DM were enrolled in this cross-sectional study. All participants were divided into three groups according to BMI: the normal weight group (18.5 kg/m2≤BMI< 24 kg/m2), the overweight group (24kg/m2≤BMI< 28 kg/m2) and the obesity group (BMI≥ 28 kg/m2). The clinical information and laboratory examinations were recorded in detail. Leptin and resistin levels were measured using enzyme-linked immunosorbent assay (ELISA).
Results: Higher HOMA-IR, leptin and resistin levels were found to be the risk factors for diabetic nephropathy when we made comparisons in the total population (P< 0.05). In the normal weight group, logistic regression analysis showed that T2DM patients with higher HOMA-IR (OR=4.210, P=0.001), leptin (OR=2.474, P=0.031) and resistin levels (OR=8.299, P< 0.001) had nearly 4-fold, 2-fold and 8-fold risk for diabetic nephropathy, respectively, after adjustments. The receiver operating characteristic (ROC) curves indicated that the area under the curves (AUCs) of HOMA-IR and resistin were 0.699 (95% CI 0.617– 0.772) and 0.790 (95% CI 0.715– 0.854), respectively, which were significantly larger than the AUC of 0.5 (all P< 0.001). However, no significant association was observed between HOMA-IR, leptin, and resistin and renal complications (all P> 0.05) in the overweight and obesity groups in both logistic regression and AUC analysis.
Conclusion: Higher insulin resistance, leptin and resistin levels were observed as risk factors for diabetic nephropathy in T2DM patients with lower BMI. These were not obvious in the overweight and obese patients.
Keywords: type 2 diabetes mellitus, insulin resistance, leptin, resistin, diabetic nephropathy
Introduction
Type 2 diabetes mellitus (T2DM) has become a major public health challenge in China, which is primarily attributed to the rapidly increasing prevalence of obesity.1,2 However, the mean body mass index (BMI) of Chinese patients with T2DM is relatively lower (about 25 kg/m2).1,2 Some reports have suggested that the risk of developing cardiovascular events and microvascular complications was higher in the non-obese patients than in the obese individuals with T2DM.3,4 Diabetic nephropathy is a serious diabetic complication, and is one of the main causes of adverse outcomes in patients with diabetes. Epidemiological investigations revealed that patients with diabetic kidney disease have exceeded chronic kidney disease due to glomerulonephritis in China.5 Thus, early identification and intervention on related risk factors for diabetic nephropathy in T2DM patients with different BMIs, particularly non-obese patients, is of great clinical significance.
Leptin is a hormone that plays an essential role in regulating body weight and energy balance.6 It is primarily secreted by white adipose tissue. Leptin replacement therapy facilitated the reversal of morbid obesity in leptin-deficient mice.7 Additionally, the fundamental action of leptin on glucose homeostasis is also of great importance. Streptozotocin-related diabetic mice showed a dramatic improvement in insulin sensitivity, and demonstrated normalized glycemic levels after leptin treatment.8,9 The association between leptin and diabetic nephropathy has been broadly explored. Serum leptin levels were found to be a risk factor for renal function decline,10 while some reports have shown that there was no difference in leptin levels of diabetic patients with or without nephropathy.11 Given that obesity is a typical characteristic of T2DM, we suspected that obesity mediated the contradictory relationship between leptin and diabetic nephropathy. It is worthwhile to identify the leptin as a risk factor for diabetic nephropathy in non-obese and obese patients with T2DM, respectively.
Resistin is a small secreted protein that is mainly produced by peripheral blood mononuclear cells (PBMCs), bone marrow cells and macrophages in humans.12 The pro-inflammatory role of resistin has been confirmed in many diseases, including coronary artery disease (CAD), rheumatoid arthritis (RA), kidney disease and T2DM.13–15 The activation of chronic low-grade inflammation is closely involved in the pathogenesis of obesity16 and diabetic nephropathy.17 The majority of studies on the inflammatory cytokines of diabetic kidney diseases were conducted on obese patients with T2DM, which made it difficult to determine how obesity and T2DM individually affect the association between resistin and diabetic nephropathy. Exploring the effects of resistin on renal function in non-obese and obese T2DM patients seems can be noteworthy.
The current study aimed to evaluate the influence of leptin and resistin levels on diabetic nephropathy in patients with T2DM with different BMI classifications. This may provide more precise information on the clinical application of leptin and resistin.
Materials and Methods
Study Population
A total of 325 patients with T2DM in Tongji Hospital from March 2019 to June 2019 were recruited for this study. The medical histories, clinical diagnosis, and treatment histories were recorded in detail. The exclusion criteria were as follows: younger than 20 years, with acute diabetic complications or with insufficient clinical information. Finally, 309 participants were included in this cross-sectional study.
This study was approved by the ethics committee of Tongji Hospital in Wuhan, Hubei (IRB ID:TJ-C20160206). All procedures complied with the principles of the Declaration of Helsinki. Written informed consent was obtained from all the patients.
Clinical Measurements
The standard methods were used in clinical laboratories to obtain relevant clinical indexes. Fasting plasma glucose (FPG), alanine transaminase (ALT), aspartate aminotransferase (AST), total cholesterol (TC), triglycerides (TG), high-density lipoprotein cholesterol (HDL-C), and low-density lipoprotein cholesterol (LDL-C) levels were measured using a Cobas 8000 auto-analyzer (Roche, Basel, CH) within 1 h after blood collection. Renal functions, including serum creatinine (Scr), estimated glomerular filtration rate (eGFR, based on the CKD-EPI equation), urine albumin/creatinine ratio (UACR), and urinary albumin excretion (UAE) were measured simultaneously. Hemoglobin (HbA1c) levels were estimated using high-performance liquid chromatography (Bio-Rad, Hercules, CA, USA). Serum C-peptide concentrations were detected by radioimmunoassay (Human C-peptide RIA; Linco, St Charles, MO, USA). Blood samples collected to test glucose, insulin and C-peptide concentrations were at 8:00 AM after an overnight fast (>8 h).
In order to test the leptin and resistin levels, blood samples were collected in tubes mixed with heparin and centrifuged at 1000 g for 15 min at 4°C. The levels of leptin and resistin were measured using a Human Quantikine ELISA assay (R&D Systems Inc., Minneapolis, MN, USA). The coefficients of variation (CVs) of intra-assay and inter-assay for leptin kit were 3.0–3.3% and 3.4–5.4% respectively. For the resistin kit, the intra-assay and inter-assay CVs were 3.8–5.3% and 7.8–9.2% respectively.
BMI was calculated using this formula: BMI=weight (kg)/height (m)2. Homoeostasis model assessment (HOMA) was built to evaluate the beta-cell function (HOMA-B) and insulin resistance state (HOMA-IR). We calculated the relevant values based on C-peptide concentrations using HOMA calculator (University of Oxford, Oxford, UK).
Definitions of Obesity and Diabetic Nephropathy
The diagnostic criteria for T2DM patients based on the American Diabetes Association recommendations,18 include: fasting blood glucose ≥ 7.0 mmol/L, random blood glucose or 2 h postprandial glucose ≥ 11.1 mmol/L. Patients who were taking antidiabetic agents, or adopting lifestyle interventions for known T2DM were also included in this study.
Diabetic nephropathy is regarded as an increase in UACR (>3.5 mg/mmol in females, and >2.5 mg/mmol in males), or a rise in UAE (≥30 mg/24 h) and a decline in renal function which was mainly assessed by eGFR.19
All T2DM patients were classified into three subgroups according to Chinese obesity working group:20,21 the normal weight group (18.5 kg/m2≤BMI<24 kg/m2), the overweight group (BMI<28 kg/m2 and BMI≥24 kg/m2) and obesity group (BMI≥28 kg/m2). We excluded the T2DM patients with extremely low BMI (BMI<18.5 kg/m2) because only a few patients met this standard.
Statistical Analysis
Continuous variables were presented as means (±standard deviation, SD) if normally distributed, or as median (interquartile range, IQR) if skewedly distributed. The clinical characteristics of participants were compared using analysis of variance (ANOVA) for continuous variables and chi-squared test for categorical variables. The median values were regarded as the cut-off point when continuous variables were converted into categorical variables. Multivariate regression analysis was used to identify the risk factors associated with diabetic nephropathy. In the multivariate model, conventional risk factors were used as covariates, including age, sex, HbA1c, HOMA-B, smoking and drinking. Relevant odds ratios and 95% confidence intervals (CIs) were also assessed.
The predictive value of risk factors for diabetic nephropathy was evaluated using receiver operating characteristic (ROC). The area under the ROC curve (AUC), the optimal cut-off point, sensitivity, and specificity in the ROC plot were used to evaluate the diagnostic performance of the relevant clinical biomarkers. ROC analysis was conducted using the MedCalc software (version 19.3.1). All other statistical analyses were performed using GraphPad Prism (version 8) and SPSS software (version 24.0 for Windows). P value of < 0.05 was considered statistically significant.
Results
Characteristics of Study Population
All participants were subdivided into three groups according to BMI: normal weight, overweight and obesity. The comparisons of baseline characteristics among the three groups were shown in Table 1. Age, BMI, HOMA-IR, TG, HDL, BUN, and leptin were significantly different among the three groups (P<0.05). There were no notable differences in the HbA1c, HOMA-B, ALT, AST, TC, LDL, Scr, eGFR and resistin after comparison (P>0.05). The incidence of diabetic nephropathy in the normal weight, overweight and obesity group were 39.6%, 36.3% and 38.5% respectively, with no significant difference (P=0.863).
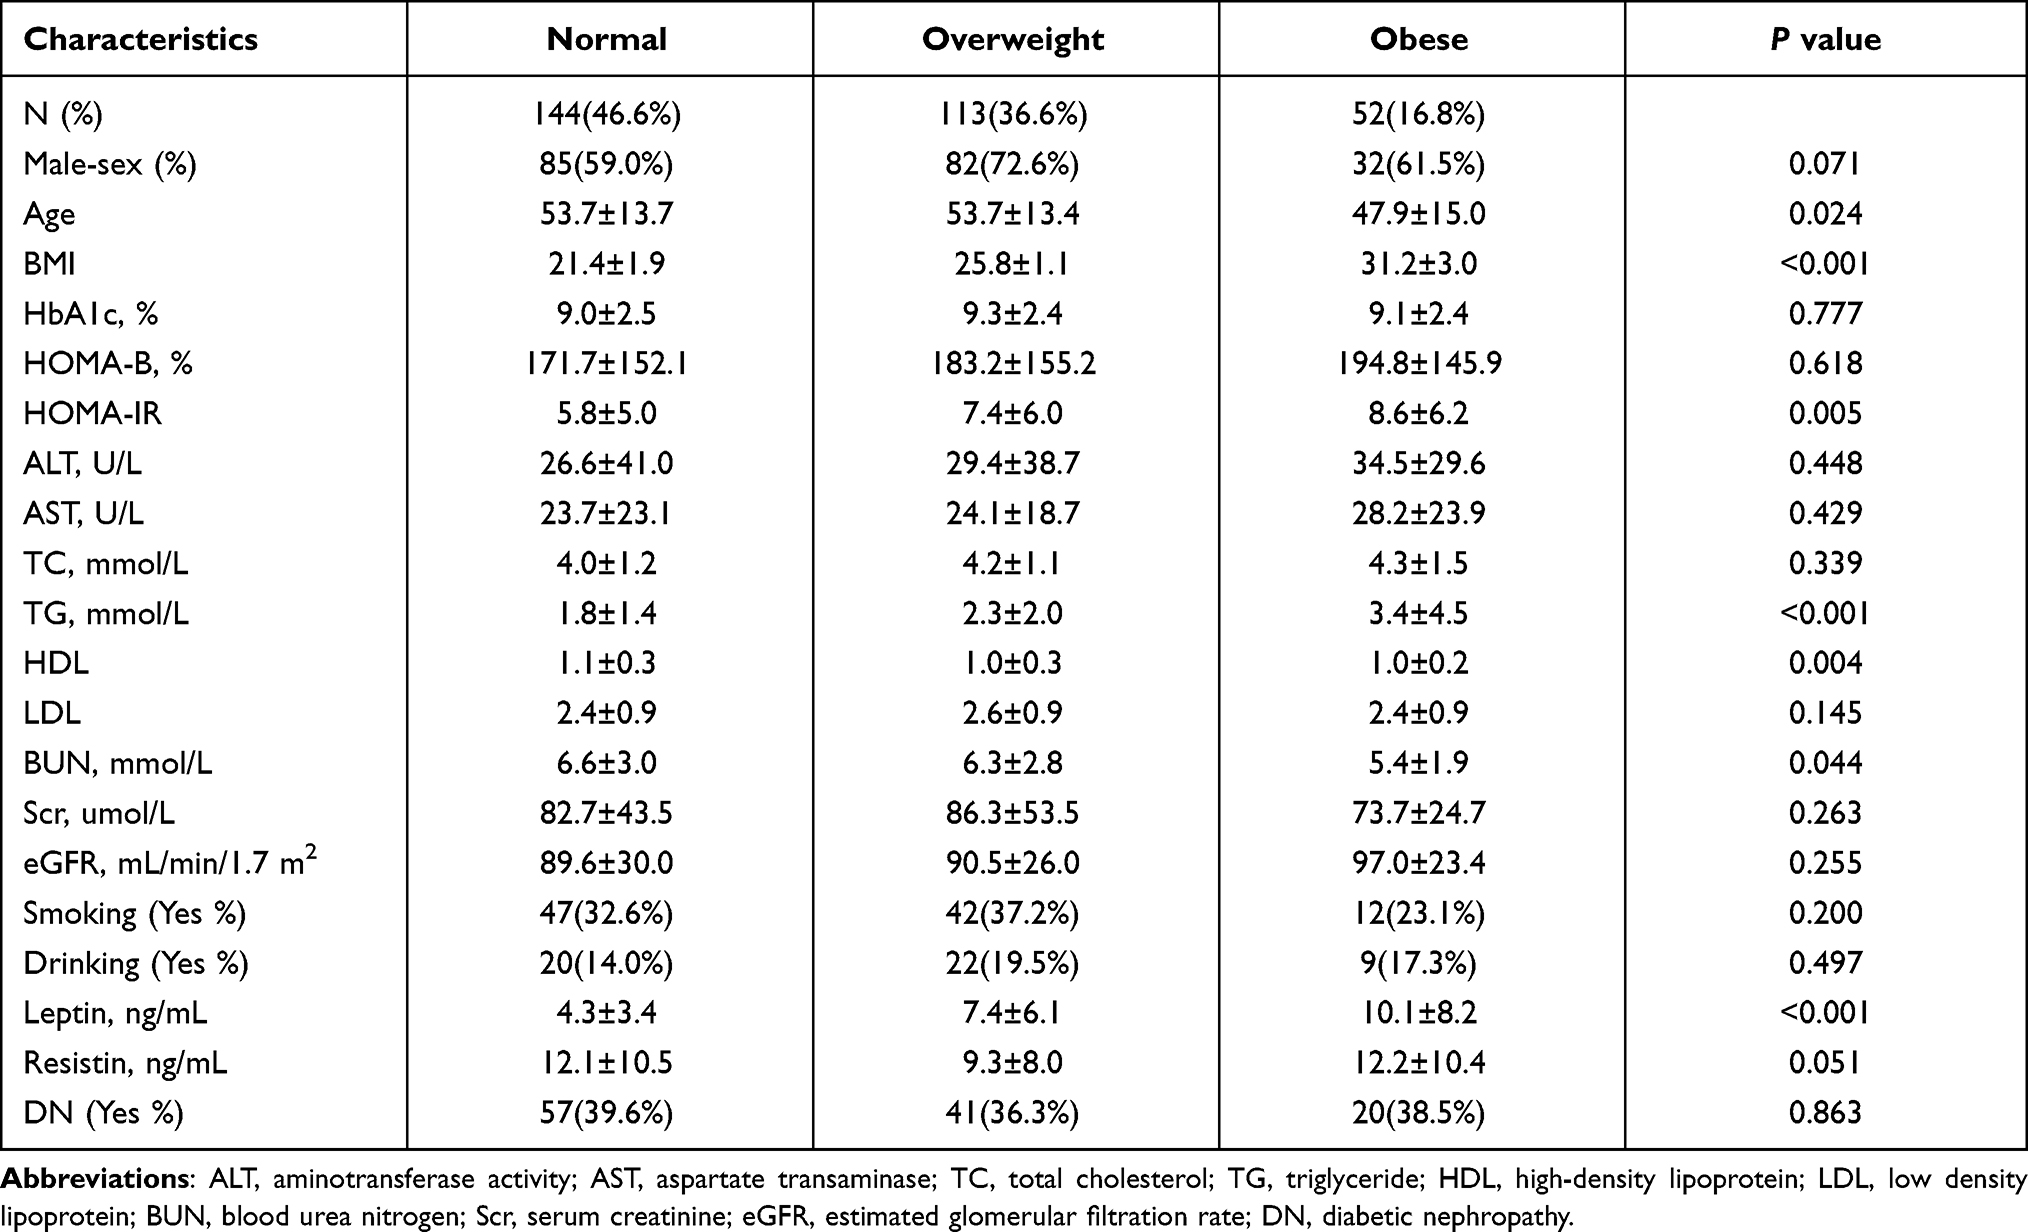 |
Table 1 Clinical and Metabolic Parameters of T2DM Patients |
HOMA-IR, Leptin and Resistin Were the Risk Factors for Diabetic Nephropathy in the Total Study Population
Logistic regression analysis was applied to evaluate whether adipokines and traditional clinical indexes contributed to an increased risk in diabetic nephropathy (Figure 1 and Supplementary Table). Sex, age, HbA1c, HOMA-B, HOMA-IR, leptin, resistin, smoking and drinking status were used as the variables in the logistic regression. We found that age (OR=1.911, P=0.013) and smoking status (OR =2.940, P=0.003) were independent risk factors for diabetic nephropathy. The higher HOMA-IR (adjusted OR=2.533 95% CI 1.369–4.685, P=0.003) and leptin levels (OR=1.929, 95% CI 1.122–3.316, P=0.017) showed approximately two-fold risk of diabetic nephropathy when compared to patients with lower index levels. Similarly, T2DM patients with higher resistin levels were more susceptible to developing renal complications (OR=2.980, 95% CI 1.779–4.990, P<0.001).
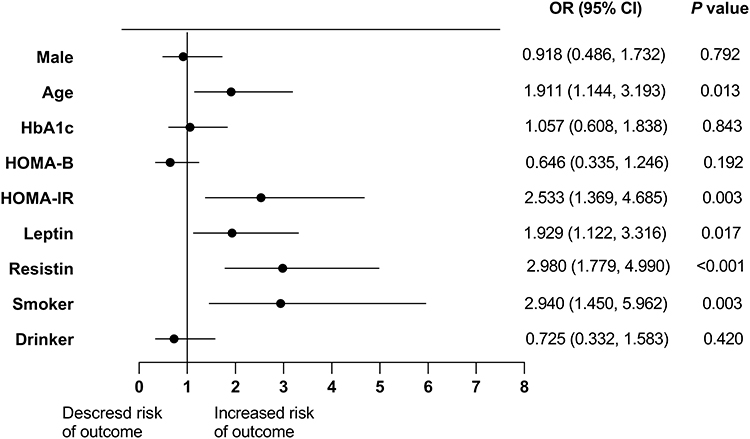 |
Figure 1 The association between clinical indexes and diabetic nephropathy in the total population. The median of some variables (HbA1c, HOMA-B, HOMA-IR, leptin and resistin) were used as cut-off points when creating groups. The values less than median were as the reference. |
In the Normal Weight Group, HOMA-IR, Leptin and Resistin Were the Risk Factors for Diabetic Nephropathy
To identify whether the association between adipokines and diabetic nephropathy was mediated by obesity, we compared the adipokines as the risk factors for diabetic nephropathy in the normal weight, overweight, and obesity groups. All the participants were divided into two comparable subgroups by setting the median value of the variables as cut-off values (Table 2). Logistic regression analysis showed that there was nearly 4-fold, 2-fold, and 8-fold increased risk of diabetic nephropathy in patients with higher HOMA-IR levels (OR=4.210, 95% CI 1.776–9.936, P=0.001), higher leptin levels (OR=2.474, 95% CI 1.084–5.650, P=0.031) and higher resistin levels (OR=8.299, 95% CI 3.611–19.072, P<0.001), respectively, after multiple adjustments.
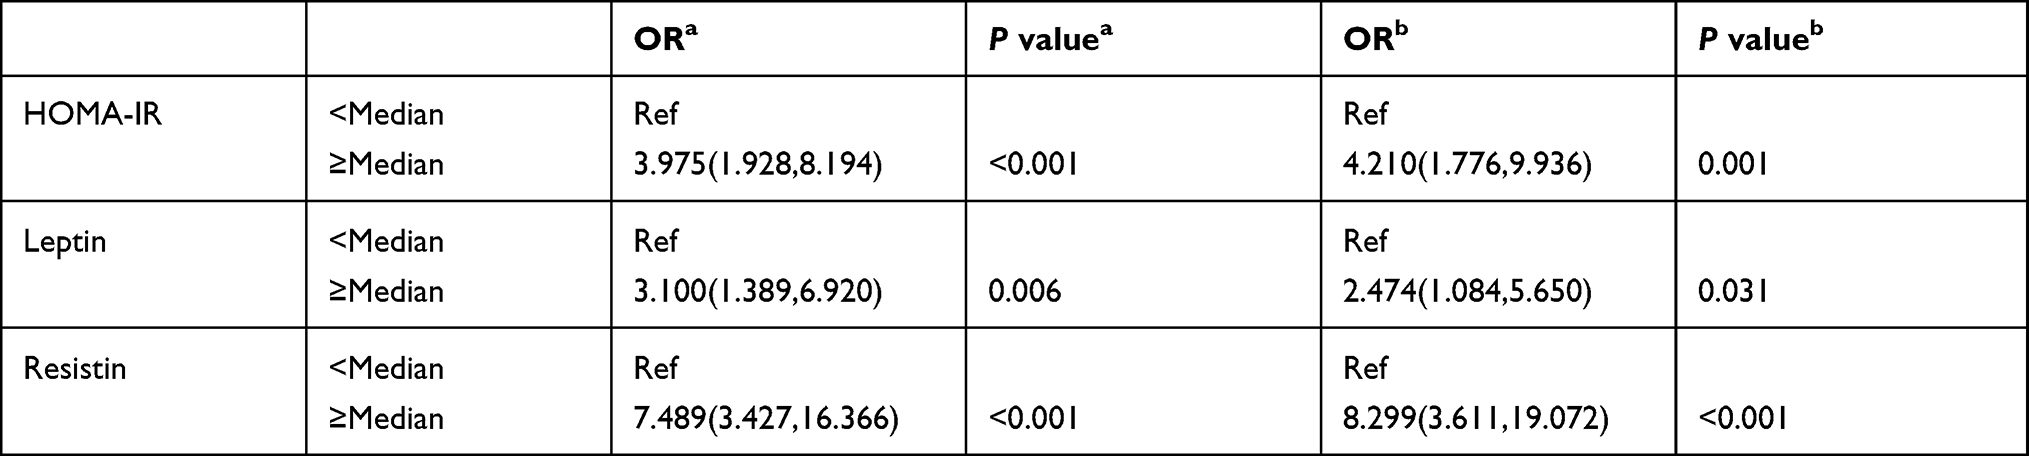 |
Table 2 Logistic Regression Analysis of Risk Factors for Diabetic Nephropathy in the Normal Weight Group |
To compare the predictive values of HOMA-IR, leptin, and resistin for renal complications in different BMI status, we performed ROC curves for three variables in the normal weight, overweight, and obesity groups. When HOMA-IR, leptin, and resistin were used as predictors, the AUC was 0.699 (95% CI 0.617–0.772), 0.593 (95% CI 0.508–0.674) and 0.790 (95% CI 0.715–0.854), respectively (Figure 2A). Meanwhile, the sensitivity and specificity were as follows: HOMA-IR (sensitivity, 75.4%; specificity, 59.8%), leptin (sensitivity, 49.1%; specificity, 72.4%), and resistin (sensitivity, 75.4%; specificity, 75.9%). The AUCs of HOMA-IR and resistin were significantly larger than the area of 0.5 (all P<0.001). The area of leptin was still larger than the area of 0.5, although the difference was not statistically significant (P=0.06).
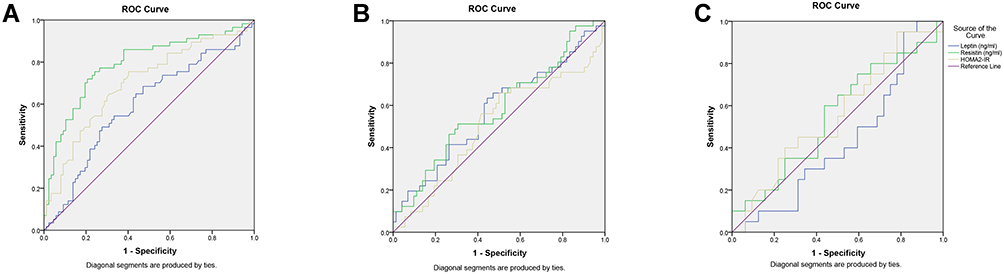 |
Figure 2 Receiver operating characteristic (ROC) curves analysis of insulin resistance, leptin, and resistin for diabetic nephropathy in normal-weight, overweight and obese patients with T2DM. ROC curves and corresponding areas under the curve (AUC) for diabetic nephropathy were performed in normal-weight (A), overweight (B) and obese patients (C) with T2DM. |
In the Overweight Group, Higher HOMA-IR, Leptin and Resistin Were Not Associated with Diabetic Nephropathy
In the overweight group, we adopted the analysis methods similar to those in the normal weight group (Table 3). However, overweight patients with T2DM did not show an increase in the incidence of renal complications with higher HOMA-IR levels (OR=1.903, 95% CI 0.748–4.841, P=0.177), higher leptin levels (OR=2.371, 95% CI 0.898–6.262, P=0.081) and higher resistin levels (OR=1.199, 95% CI 0.526–2.732, P=0.666).
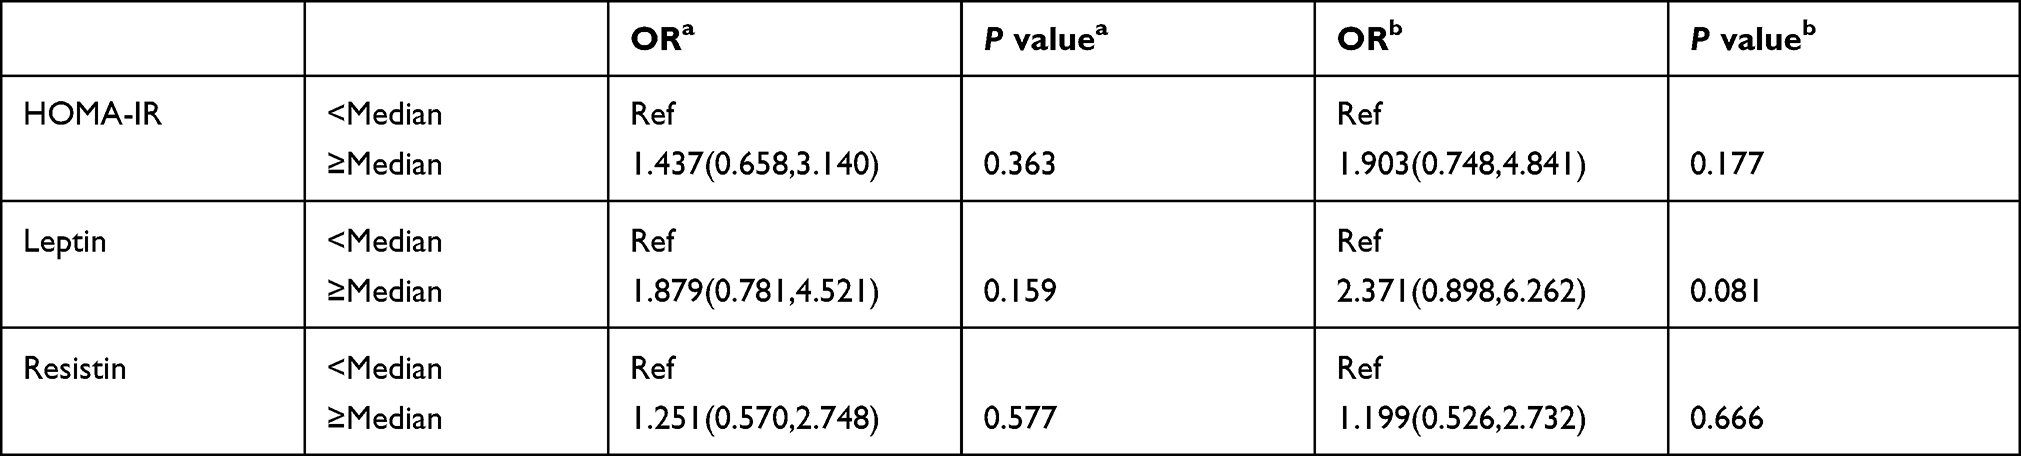 |
Table 3 Logistic Regression Analysis of Risk Factors for Diabetic Nephropathy in the Overweight Group |
ROC curves were also performed to identify the values of HOMA-IR, leptin and resistin as biomarkers for diabetic nephropathy (Figure 2B). In the overweight group, the AUCs for HOMA-IR, leptin and resistin were 0.507 (95% CI 0.411–0.602), 0.573 (95% CI 0.476–0.665) and 0.584 (95% CI 0.488–0.676), respectively. The AUCs of all factors were not significantly higher than that of the area of 0.5 (all P>0.05).
In the Obesity Group, HOMA-IR, Leptin and Resistin Were Not the Risk Factors for Diabetic Nephropathy
The relationship between adipokines and diabetic nephropathy in the obesity group was shown in Table 4. After adjustment for multiple variables, no significance was observed between HOMA-IR, leptin, and resistin and renal complications (all P>0.05).
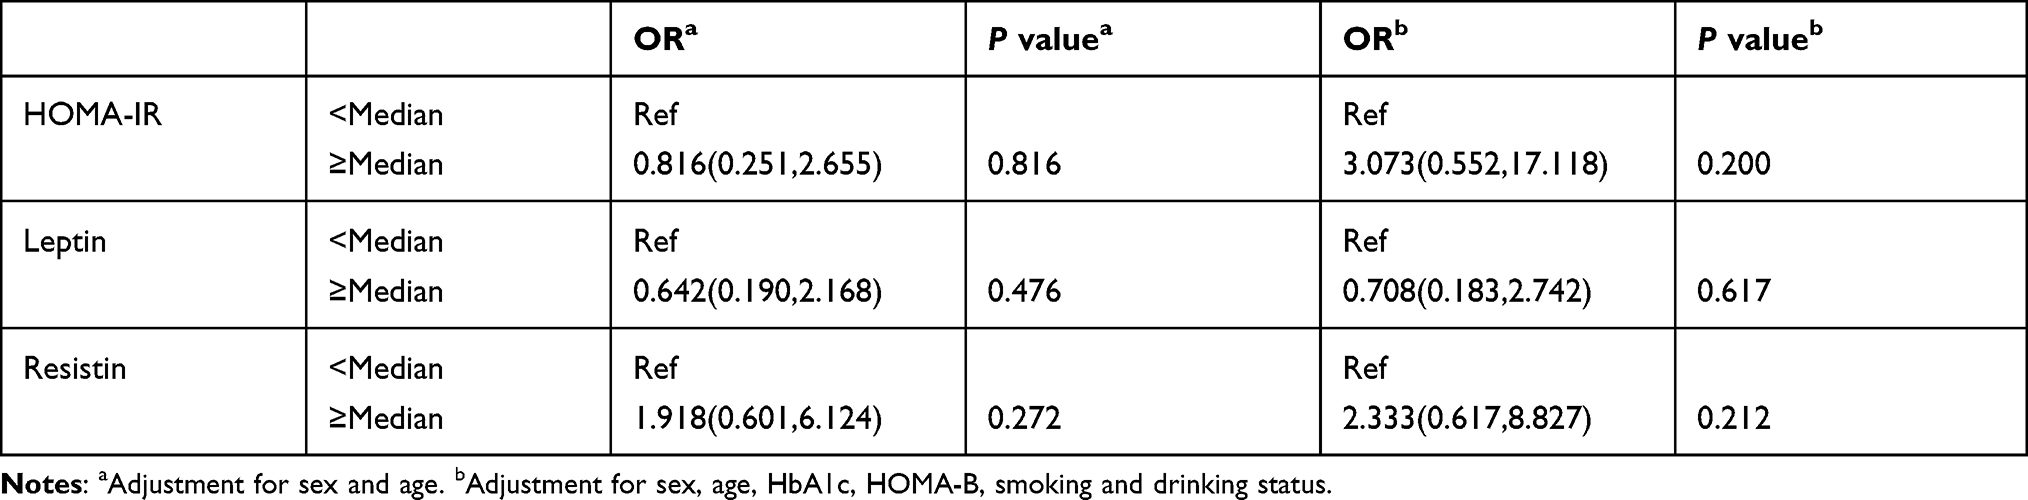 |
Table 4 Logistic Regression Analysis of Risk Factors for Diabetic Nephropathy in the Obesity Group |
The ROC plots indicated that the AUCs for HOMA-IR, leptin, and resistin were 0.556 (95% CI 0.412–0.694), 0.570 (95% CI 0.426–0.707) and 0.552 (95% CI 0.407–0.690), respectively (Figure 2C). Similar to the overweight group, there were no significant differences between the AUCs of HOMA-IR, leptin and resistin and the area of 0.5 (all P>0.05).
Discussion
In this cross-sectional study, we investigated the association between HOMA-IR, leptin, and resistin and diabetic nephropathy in T2DM patients with different BMIs. Overall, HOMA-IR, leptin, and resistin were the risk factors for diabetic nephropathy in the total study population. However, when participants were divided into three groups according to BMI, we found that higher levels of HOMA-IR, leptin, and resistin were the risk factors for diabetic nephropathy in the normal weight group, not in the overweight and obesity groups.
Our results showed that the levels of insulin resistance, leptin, and resistin were closely related to the decline in diabetic kidney function in the total study population. Numerous reports have demonstrated the roles of HOMA-IR, leptin and resistin in diabetic nephropathy. Studies have suggested that higher HOMA-IR levels were associated with an increased incidence of microalbuminuria.22,23 Elevated serum leptin levels were observed in T2DM patients with the early stages of renal diseases.24 In the study by Bonito et al, resistin was found valuable in predicting the renal disease progression in patients with diabetes.15
We explored the roles of HOMA-IR, leptin, and resistin in the renal function of the normal-weight, overweight and obese T2DM patients, respectively. Obesity plays an important role in the development of T2DM. However, compared to Western countries, T2DM is more prevalent in the non-obese population in China.2 Non-obese patients with diabetes were reported to be at an increased risk of developing cardiovascular events and microvascular complications.3,4 Moreover, they experienced higher total mortality25 as compared to obese patients with diabetes due to “obesity paradox”.3,26 In our results, the relationships between HOMA-IR, leptin, and resistin and diabetic nephropathy were more observed in normal-weight patients than in overweight and obese patients.
Our analysis showed that insulin resistance was a risk factor for diabetic nephropathy in T2DM patients with a lower BMI, but not in overweight and obese patients. In a lean mouse model of T2DM, a marked insulin resistance was found with progressive diabetic nephropathy.27 A report on the association between insulin resistance and kidney dysfunction also showed that HOMA-IR levels were not higher in obese patients with chronic kidney disease (CKD) and was not inversely correlated with eGFR.28 These results implied that although insulin resistance was closely associated with BMI, they were not synonymous. Insulin resistance contributed to the increased risk of diabetic nephropathy independent of BMI. Similar results were observed in the evaluation of cardiovascular disease risks.29 Thus, when non-obese patients with T2DM have higher insulin resistance, the possibility of diabetic nephropathy should be considered.
Leptin is an adipocyte-secreted hormone that is generally accepted as a regulator of metabolic homeostasis. We found that higher leptin levels were a risk factor for diabetic nephropathy in normal-weight patients with T2DM. Hanai et al found that the lean patients with lower leptin levels and the obese patients with higher leptin levels had an increased risk for kidney function decline.30 We speculated that this might be due to the difference in the diagnostic criteria for diabetic nephropathy. Hanai et al made analyses in the eGFR cohort and in the proteinuria cohort, respectively. In our study, the diagnosis of diabetic nephropathy was made by eGFR combined with proteinuria19 A report also showed an increase in serum leptin levels were associated with a decrease in lean body mass during peritoneal dialysis.31 In non-obese patients, abnormal fat pads accumulate in various parts of the body (ectopic fat deposition).32,33 Higher levels of leptin secreted from adipocytes may reflect the increased abnormal fat correlated with microvascular complications.33 Significant higher leptin levels can be observed in obese patients with T2DM.34 We speculated that the binding between leptin and its receptors might tend to be saturated in the kidney of these patients, or the leptin receptors of kidney were not sensitive enough due to leptin resistance.35 Thus, when we made analyses of leptin only in the obese patients, the effects of leptin on renal function may be not obvious.
Resistin is another adipocytokines derived mainly from PBMCs in humans. Considerable attention has been paid to the pro-inflammatory effects of resistin.36 In our study, a nearly 8-fold increased risk of diabetic nephropathy was found in the higher resistin group of the normal weight group with T2DM, and no significant difference was observed in the overweight and obesity groups. To our knowledge, there are few studies to directly explore the relationship between resistin and diabetic nephropathy in T2DM patients with different BMIs. Reports confirmed that the low BMI values showed powerful ability in predicting mortality in the CKD patients.37,38 Given that the low-grade inflammatory state may be the link between resistin with diabetic nephropathy in the non-obese East Asian populations with T2DM,39–41 there was no surprise that higher resistin levels correlated with the increased risk of diabetic nephropathy in normal-weight patients with T2DM.
At the same time, lower body weight in the obesity-related metabolic disorders may reflect potential illness (such as diabetic nephropathy) with more severity.25 Thus, the close relationship between higher HOMA-IR, leptin, and resistin levels and impaired renal function can be more easily observed in these patients. Leaner adults with diabetes may receive less rigorous screening for diabetes and its complications. By contrast, obese individuals may obtain more strict care and proper management by their healthcare providers,3 which would weaken the relationship between HOMA-IR, leptin and resistin and diabetic nephropathy in the obese patients with T2DM.
Our study is the first to compare insulin resistance, leptin and resistin with diabetic nephropathy in normal-weight, overweight and obesity patients with T2DM. However, several limitations of this study need to be addressed. First, we did not measure visceral adiposity to investigate the anthropometric features of normal-weight patients with T2DM. Second, related inflammatory indexes were not evaluated. Third, our study was a cross-sectional study, and a follow-up study is required to explore the causality between the risk factors and diabetic nephropathy.
In conclusion, higher insulin resistance, leptin and resistin levels implied a higher risk for diabetic nephropathy in normal-weight patients with T2DM, and these correlations were not obvious in overweight and obese patients with T2DM.
Acknowledgments
We thank all patients for making this study possible. We thank Bei Peng for technical advice and assistance with this study.
Author Contributions
All authors made a significant contribution to the work reported, whether that is in the conception, study design, execution, acquisition of data, analysis and interpretation, or in all these areas. All authors took part in drafting, revising or critically reviewing the article and gave final approval of the version to be published. All authors have agreed on the journal to which the article has been submitted and they agreed to be accountable for all aspects of the work.
Funding
This work was supported by the National Natural Science Foundation of China (Grants 81974114).
Disclosure
The authors declare that they have no conflicts of interest, financial or otherwise.
References
1. Yang W, Lu J, Weng J, et al. Prevalence of diabetes among men and women in China. N Engl J Med. 2010;362(12):1090–1101. doi:10.1056/NEJMoa0908292
2. Hu C, Jia W. Diabetes in China: epidemiology and Genetic Risk Factors and Their Clinical Utility in Personalized Medication. Diabetes. 2018;67(1):3–11. doi:10.2337/dbi17-0013
3. Pagidipati NJ, Zheng Y, Green JB, et al. Association of obesity with cardiovascular outcomes in patients with type 2 diabetes and cardiovascular disease: insights from TECOS. Am Heart J. 2020;219:47–57. doi:10.1016/j.ahj.2019.09.016
4. Mohan V, Vijayaprabha R, Rema M, et al. Clinical profile of lean NIDDM in South India. Diabetes Res Clin Pract. 1997;38(2):101–108. doi:10.1016/S0168-8227(97)00088-0
5. Zhang L, Long J, Jiang W, et al. Trends in Chronic Kidney Disease in China. N Engl J Med. 2016;375(9):905–906. doi:10.1056/NEJMc1602469
6. Halaas JL, Gajiwala KS, Maffei M, et al. Weight-reducing effects of the plasma protein encoded by the obese gene. Science. 1995;269(5223):543–546. doi:10.1126/science.7624777
7. Pelleymounter MA, Cullen MJ, Baker MB, et al. Effects of the obese gene product on body weight regulation in ob/ob mice. Science. 1995;269(5223):540–543. doi:10.1126/science.7624776
8. Denroche HC, Levi J, Wideman RD, et al. Leptin therapy reverses hyperglycemia in mice with streptozotocin-induced diabetes, independent of hepatic leptin signaling. Diabetes. 2011;60(5):1414–1423. doi:10.2337/db10-0958
9. Perry RJ, Zhang XM, Zhang D, et al. Leptin reverses diabetes by suppression of the hypothalamic-pituitary-adrenal axis. Nat Med. 2014;20(7):759–763. doi:10.1038/nm.3579
10. Hanai K, Babazono T, Mugishima M, et al. Association of serum leptin levels with progression of diabetic kidney disease in patients with type 2 diabetes. Diabetes Care. 2011;34(12):2557–2559. doi:10.2337/dc11-1039
11. Wilson C, Nelson R, Nicolson M, Pratley R. Plasma leptin concentrations: no difference between diabetic Pima Indians with and without nephropathy. Diabetologia. 1998;41(7):861–862. doi:10.1007/s001250051001
12. Acquarone E, Monacelli F, Borghi R, Nencioni A, Odetti P. Resistin: a reappraisal. Mech Ageing Dev. 2019;178:46–63. doi:10.1016/j.mad.2019.01.004
13. Emamalipour M, Seidi K, Jahanban-Esfahlan A, Jahanban-Esfahlan R. Implications of resistin in type 2 diabetes mellitus and coronary artery disease: impairing insulin function and inducing pro-inflammatory cytokines. J Cell Physiol. 2019;234(12):21758–21769. doi:10.1002/jcp.28913
14. Sato H, Muraoka S, Kusunoki N, et al. Resistin upregulates chemokine production by fibroblast-like synoviocytes from patients with rheumatoid arthritis. Arthritis Res Ther. 2017;19(1):263. doi:10.1186/s13075-017-1472-0
15. Bonito B, Silva AP, Rato F, Santos N, Neves PL. Resistin as a predictor of cardiovascular hospital admissions and renal deterioration in diabetic patients with chronic kidney disease. J Diabetes Complications. 2019;33(11):107422. doi:10.1016/j.jdiacomp.2019.107422
16. Saltiel AR, Olefsky JM. Inflammatory mechanisms linking obesity and metabolic disease. J Clin Invest. 2017;127(1):1–4. doi:10.1172/JCI92035
17. Navarro-González JF, Mora-Fernández C. The role of inflammatory cytokines in diabetic nephropathy. J Am Soc Nephrol. 2008;19(3):433–442. doi:10.1681/ASN.2007091048
18. American Diabetes Association. Standards of medical care in diabetes–2010. Diabetes Care. 2010;33(Suppl 1):S11–61. doi:10.2337/dc10-S011
19. Fineberg D, Jandeleit-Dahm KA, Cooper ME. Diabetic nephropathy: diagnosis and treatment. Nat Rev Endocrinol. 2013;9(12):713–723. doi:10.1038/nrendo.2013.184
20. Huang J, Chen Z, Yuan J, et al. Association Between Body Mass Index (BMI) and Brachial-Ankle Pulse Wave Velocity (baPWV) in Males with Hypertension: a Community-Based Cross-Section Study in North China. Med Sci Monitor. 2019;25:5241–5257. doi:10.12659/MSM.914881
21. Cheng TO. Chinese body mass index is much lower as a risk factor for coronary artery disease. Circulation. 2004;109(14):e184. doi:10.1161/01.CIR.0000124888.14804.D2
22. Sun X, Xiao Y, Wang B, et al. Associations of pancreatic β-cell function and insulin resistance with microalbuminuria in type 2 diabetes. Diabetes Res Clin Pract. 2015;110(3):e22–26. doi:10.1016/j.diabres.2015.09.012
23. Sarafidis PA, Ruilope LM. Insulin resistance, microalbuminuria, and chronic kidney disease. Curr Hypertens Rep. 2008;10(4):249–251. doi:10.1007/s11906-008-0046-6
24. Fruehwald-Schultes B, Kern W, Beyer J, Forst T, Pfützner A, Peters A. Elevated serum leptin concentrations in type 2 diabetic patients with microalbuminuria and macroalbuminuria. Metabolism. 1999;48(10):1290–1293. doi:10.1016/S0026-0495(99)90270-6
25. Carnethon MR, De Chavez PJ, Biggs ML, et al. Association of weight status with mortality in adults with incident diabetes. JAMA. 2012;308(6):581–590. doi:10.1001/jama.2012.9282
26. Lavie CJ, De Schutter A, Parto P, et al. Obesity and Prevalence of Cardiovascular Diseases and Prognosis-The Obesity Paradox Updated. Prog Cardiovasc Dis. 2016;58(5):537–547. doi:10.1016/j.pcad.2016.01.008
27. Mallipattu SK, Gallagher EJ, LeRoith D, et al. Diabetic nephropathy in a nonobese mouse model of type 2 diabetes mellitus. Am J Physiol Renal Physiol. 2014;306(9):F1008–1017. doi:10.1152/ajprenal.00597.2013
28. Gatti A, Morini E, De Cosmo S, et al. Metabolic syndrome is not a risk factor for kidney dysfunction in obese non-diabetic subjects. Obesity. 2008;16(4):899–901. doi:10.1038/oby.2007.59
29. McLaughlin T, Allison G, Abbasi F, Lamendola C, Reaven G. Prevalence of insulin resistance and associated cardiovascular disease risk factors among normal weight, overweight, and obese individuals. Metabolism. 2004;53(4):495–499. doi:10.1016/j.metabol.2003.10.032
30. Hanai K, Babazono T, Takagi M, et al. Obesity as an effect modifier of the association between leptin and diabetic kidney disease. J Diabetes Investig. 2014;5(2):213–220. doi:10.1111/jdi.12138
31. Stenvinkel P, Lindholm B, Lönnqvist F, Katzarski K, Heimbürger O. Increases in serum leptin levels during peritoneal dialysis are associated with inflammation and a decrease in lean body mass. J Am Soc Nephrol. 2000;11(7):1303–1309.
32. Scott RA, Fall T, Pasko D, et al. Common genetic variants highlight the role of insulin resistance and body fat distribution in type 2 diabetes, independent of obesity. Diabetes. 2014;63(12):4378–4387. doi:10.2337/db14-0319
33. Olaogun I, Farag M, Hamid P. The Pathophysiology of Type 2 Diabetes Mellitus in Non-obese Individuals: an Overview of the Current Understanding. Cureus. 2020;12(4):e7614.
34. Liu W, Zhou X, Li Y, et al. Serum leptin, resistin, and adiponectin levels in obese and non-obese patients with newly diagnosed type 2 diabetes mellitus: a population-based study. Medicine. 2020;99(6):e19052. doi:10.1097/MD.0000000000019052
35. Liu J, Yang X, Yu S, Zheng R. The Leptin Resistance. Adv Exp Med Biol. 2018;1090:145–163.
36. Huang X, Yang Z. Resistin’s, obesity and insulin resistance: the continuing disconnect between rodents and humans. J Endocrinol Invest. 2016;39(6):607–615. doi:10.1007/s40618-015-0408-2
37. Fouque D, Kalantar-Zadeh K, Kopple J, et al. A proposed nomenclature and diagnostic criteria for protein-energy wasting in acute and chronic kidney disease. Kidney Int. 2008;73(4):391–398. doi:10.1038/sj.ki.5002585
38. Mafra D, Guebre-Egziabher F, Fouque D. Body mass index, muscle and fat in chronic kidney disease: questions about survival. Nephrol Dial Transplant. 2008;23(8):2461–2466. doi:10.1093/ndt/gfn053
39. Nazare JA, Smith JD, Borel AL, et al. Ethnic influences on the relations between abdominal subcutaneous and visceral adiposity, liver fat, and cardiometabolic risk profile: the International Study of Prediction of Intra-Abdominal Adiposity and Its Relationship With Cardiometabolic Risk/Intra-Abdominal Adiposity. Am J Clin Nutr. 2012;96(4):714–726. doi:10.3945/ajcn.112.035758
40. Mathis D. Immunological goings-on in visceral adipose tissue. Cell Metab. 2013;17(6):851–859. doi:10.1016/j.cmet.2013.05.008
41. Foster MC, Hwang SJ, Massaro JM, et al. Association of subcutaneous and visceral adiposity with albuminuria: the Framingham Heart Study. Obesity. 2011;19(6):1284–1289. doi:10.1038/oby.2010.308
 © 2021 The Author(s). This work is published and licensed by Dove Medical Press Limited. The full terms of this license are available at https://www.dovepress.com/terms.php and incorporate the Creative Commons Attribution - Non Commercial (unported, v3.0) License.
By accessing the work you hereby accept the Terms. Non-commercial uses of the work are permitted without any further permission from Dove Medical Press Limited, provided the work is properly attributed. For permission for commercial use of this work, please see paragraphs 4.2 and 5 of our Terms.
© 2021 The Author(s). This work is published and licensed by Dove Medical Press Limited. The full terms of this license are available at https://www.dovepress.com/terms.php and incorporate the Creative Commons Attribution - Non Commercial (unported, v3.0) License.
By accessing the work you hereby accept the Terms. Non-commercial uses of the work are permitted without any further permission from Dove Medical Press Limited, provided the work is properly attributed. For permission for commercial use of this work, please see paragraphs 4.2 and 5 of our Terms.