")
Back to Journals » Cancer Management and Research » Volume 12
The Association Between Immune Characteristic and Clinical Pathology in Chinese Patients with Adenocarcinoma of Esophagogastric Junction
Authors Wang Y, Wang S, Zhu C, Cao H, Zhang Z, Zhao E
Received 23 October 2019
Accepted for publication 9 April 2020
Published 11 May 2020 Volume 2020:12 Pages 3259—3269
DOI https://doi.org/10.2147/CMAR.S235722
Checked for plagiarism Yes
Review by Single anonymous peer review
Peer reviewer comments 2
Editor who approved publication: Dr Antonella D'Anneo
Yangyang Wang,1,2,* Shuchang Wang,1,* Chunchao Zhu,1 Hui Cao,1 Zizhen Zhang,1 Enhao Zhao1
1Department of Gastrointestinal Surgery, Ren Ji Hospital, School of Medicine, Shanghai Jiao Tong University, Shanghai 200127, People’s Republic of China; 2State Key Laboratory for Oncogenes and Related Genes, Shanghai Cancer Institute, Ren Ji Hospital, School of Medicine, Shanghai Jiao Tong University, Shanghai 200240, People’s Republic of China
*These authors contributed equally to this work
Correspondence: Zizhen Zhang; Enhao Zhao
Department of Gastrointestinal Surgery, Ren Ji Hospital, School of Medicine, Shanghai Jiao Tong University, 160 Pujian Road, Shanghai 200127, People’s Republic of China
Tel +8618800299532
Fax +86-21-58394262
Email [email protected]; [email protected]
Purpose: Adenocarcinoma of the esophagogastric junction (AEG) patient immune characteristics were analyzed in this study, and these features were compared with patient clinical pathology and prognosis.
Patients and Methods: The clinicopathological data and prognostic information of 96 AEG patients who were admitted to Ren Ji Hospital between December 2008 and December 2015 were collected. PD-1/PD-L1, Tim-3/Gal-9, and CD3/CD8/Foxp3 expression in these patients, as well as the correlation of the expression of these molecules with clinicopathological data and survival time, were analyzed. Comparisons of count data were performed using the chi-square test or Fisher’s exact test. The survival rate and survival curves were calculated and drawn, respectively, with the Kaplan–Meier method, and the Log rank test was used for survival analysis.
Results: The positive rate for PD-L1 and Gal-9 in these AEG patients was 30.21% and 31.25%, respectively. Tim-3 positivity had a close relationship with patient Siewert type. CD8+ T cell infiltration and patient TNM stage, as well as CD3+CD8+ T cell infiltration and patient Lauren type, had a close relationship based on analysis of the correlation between immune factor expression and clinicopathological data. The group with high CD8+ T cell infiltration had an improved survival rate, while the combined analysis of Tim-3 and Gal-9 expression showed that the double-positive group had a significantly poorer prognosis than groups with other Tim-3 and Gal-9 expression patterns. The PD-L1 expression level had a close relationship with T cell infiltration in AEG patients, especially CD3+ and CD8+ T cell infiltration.
Conclusion: Tim-3 expression was higher in patients with Siewert type I tumors than in patients with tumors of other Siewert types. Patients with high CD8+ T cell infiltration had a better prognosis than patients with low CD8+ T cell infiltration, and CD8+ T cell infiltration was closely related to AEG patient TNM stage. The Tim-3 and Gal-9 double-positive group showed poor prognosis, and immune therapy could be recommended for these AEG patients.
Keywords: AEG, adenocarcinoma of the esophagogastric junction, Siewert type, immune characteristic, survival prognosis
Introduction
Adenocarcinoma of the esophagogastric junction (AEG) is a unique digestive tumor located in the esophagogastric junction of the digestive duct. It is generally classified into three subtypes according to the Siewert classification standard. According to the location of the tumor center within the esophagogastric junction (tumor center 5 cm away from the proximal or distal part), Siewert I, II and III subtypes are assigned.1 The morbidity and mortality of AEG have increased in recent years according to epidemiological analysis.2
In recent years, immune checkpoint therapy has made much progress, especially in melanoma, non-small-cell lung cancer (NSCLC), renal cancer, and so on. Some patients have received benefits or have even been cured by immune checkpoint inhibitor therapy,3,4 and these encouraging results led us to explore the immune characteristics of AGE patients. Programmed cell death protein 1 (PD-1), mainly expressed on infiltrating immune cells and especially on T cells, negatively regulates tumor-specific T cells, which makes PD-1 a marker of tumor-infiltrating lymphocyte (TIL) activation.5 One ligand of PD-1 is programmed cell death-ligand 1 (PD-L1), and PD-1 can specifically bind to PD-L1 to inhibit PD-1-positive T cells, eliminating tumor cells with PD-L1 expression on their surface. Ultimately, this results in immune suppression or immune escape.6 PD-1/PD-L1 is one of the most important immune checkpoints, and immune checkpoint inhibitors targeting this checkpoint have been approved by the FDA for cancer patient immune therapy. Anti-PD1 (nivolumab and pembrolizumab) and anti-PD-L1 (atezolizumab, avelumab and durvalumab) antibodies are being developed and have been approved for various cancers.7,8 Moreover, patients with some of the above cancers receive no benefits from targeted PD-1/PD-L1 checkpoint therapy, and other immune checkpoints need to be explored. T cell immunoglobulin mucin 3 (Tim-3) is selectively expressed on CD4+ Th1 and CD8+ Tc1 cells with IFN-γ producing function.9 Tim-3 can limit the Th1 and Tc1 cell responses in duration and magnitude. Galectin 9 (Gal‑9), a galectin and Tim-3 ligand, regulates effector, helper and cytotoxic T cell survival, proliferation and cytokine synthesis.10 Therefore, another immune checkpoint, Tim-3/Gal-9, has drawn attention from researchers for treating cancer patients who failed immune therapy with PD-1/PD-L1 checkpoint inhibitors.
At present, immune checkpoints and T cells have attracted much research in gastric cancer and esophageal cancer, while there have been few studies of these molecules in AEG. Therefore, in this study, by analyzing the unique immune characteristics of this tumor, we hope to unveil the relationship between immune characteristics and survival to provide clinical support for immune therapy in the future for AEG patients.
Patients and Methods
Clinicopathological Data of AEG Patients
This study was a retrospective case-control study, and we enrolled 96 AEG patients who were admitted to Ren Ji Hospital, School of Medicine, Shanghai Jiao Tong University, between December 2008 and December 2015. The patients included 65 males and 31 females, with a median age of 65 years and an age range of 22–89 years. According to the Siewert type classification, 7 patients, 38 patients and 51 patients had type I, type II, and type III disease, respectively. This study was approved by the Ethics Committee of Ren Ji Hospital, School of Medicine, Shanghai Jiao Tong University. All AEG patients in this study signed informed consent forms.
Inclusion and Exclusion Criteria
(1) All AEG patients underwent R0 radical resection. (2) The postoperative pathology results in all patients verified adenocarcinoma. (3) Patients with immune system disease or using immunosuppressants for organ transplantation were excluded. (4) Patients admitted with tumor perforation or hemorrhage for emergency operation were excluded. (5) Patients with recurrence after tumor resection were excluded. (6) All AEG patients in this study had integrated clinicopathological data and follow-up information.
Clinicopathological Information
In terms of the Lauren type of tumors in the study, there were 35 intestinal type and 61 diffuse or mixed type tumors. Tumor nerve invasion occurred in 15 patients, and tumor vessel invasion occurred in 17 patients. Overall, 8 patients, 18 patients and 70 patients had TNM stage I, II, and III tumors, respectively. The criteria for TNM stage were adopted for the American Joint Committee on Cancer (AJCC) and Union for International Cancer Control (UICC) 8th edition staging system. When the tumor center was located within 2 cm of the esophagogastric junction and invaded the junction, an esophageal tumor staging system was chosen. When the tumor had no invasion of the junction and the center of the tumor was 2 cm away from the junction, a gastric tumor staging system was selected. Once the tumor invaded the junction and the center of the tumor was 2 cm away from the junction, a gastric tumor staging system was adopted.
Patients Follow-Up
Telephone follow-up and outpatient follow-up were used to inquire about patient survival. Mortality included death from primary tumor recurrence or metastasis after operation.
Immunohistochemical Method
Immunohistochemistry (IHC) was performed on the TMA using antibodies specific to PD-L1 (1: 100, Abcam, UK, ab205921), PD-1 (1: 100, CST,USA, 43248), Tim‑3 (1:200, CST,USA, 45208), Gal‑9 (1:250, Abcam, UK, ab69630), CD3 (1: 200, Wuhan Goodbio Technology Co., Ltd., China), CD8 (1: 100, Wuhan Goodbio Technology Co., Ltd., China), and Foxp3 (1: 200, CST, USA, 98377). Briefly, after tissue sections were deparaffinized, rehydrated with graded ethanol, incubated with 0.3% hydrogen peroxide for 30 minutes, and blocked with 10% BSA (Sangon, Shanghai, China), slides were first incubated using the antibody at 4°C overnight and then labeled with the HRP second antibody (Thermo Scientific, US) at room temperature for 1 h. Positive staining was visualized with DAB substrate liquid (Gene Tech, Shanghai) and counterstained with hematoxylin.11 All the sections were observed and photographed with a microscope (Carl Zeiss, Germany). In the following analysis, we excluded immune cells in vessels, lymph nodes and lymphatics, necrotic tissue, or necrosis-adjacent areas.
Criteria for Immune Factor Expression
PD-L1-positivity was defined as tumor cell staining in more than 5% of cells in AEG patients.12 Gal-9-high and Gal-9-low expression designations were based on the combined assessment of the staining intensity and area of staining. Low PD-1 and Foxp3 expression levels were defined according to previous studies, and positivity was defined as more than 5 stained cells12 (in a 400x field); the designation CD3+ and CD8+ T cell high or low infiltration was based on the median number of cells.11 The same criterion of median number was adopted to divide the patients in Tim-3-high and Tim-3-low groups.
Statistical Analysis
SPSS 21.0 software was used in this study, and numerical data analysis was performed using the X2 test. The Kaplan–Meier method was used to calculate the survival rate, and the Log rank test was used for survival analysis. P < 0.05 indicated that the differences were statistically significant, while P < 0.01 indicated that the differences were obvious.
Results
Immune Factors Expression in AEG Tissue
PD-L1/PD-1 and Tim-3/Gal-9 expression are shown in Figure 1. PD-L1 expression was found in the cytoplasm of tumor cells, with 25 positive cases, accounting for 32.47% of the total patients. PD-1 expression was found in infiltrating immune cells, with 10 positive cases, accounting for 12.99% of all patients. The expression of another immune checkpoint protein, Gal-9, was found in the cytoplasm of tumor cells, with 30 positive cases, accounting for 31.25% of the whole group. The expression of its receptor, Tim-3, was found on infiltrating immune cells. CD3/CD8/Foxp3 expression is shown in Figure 2. In terms of FOXP3 expression in AEG tissue, there were 15 positive cases, accounting for 19.48% of all AEG patients.
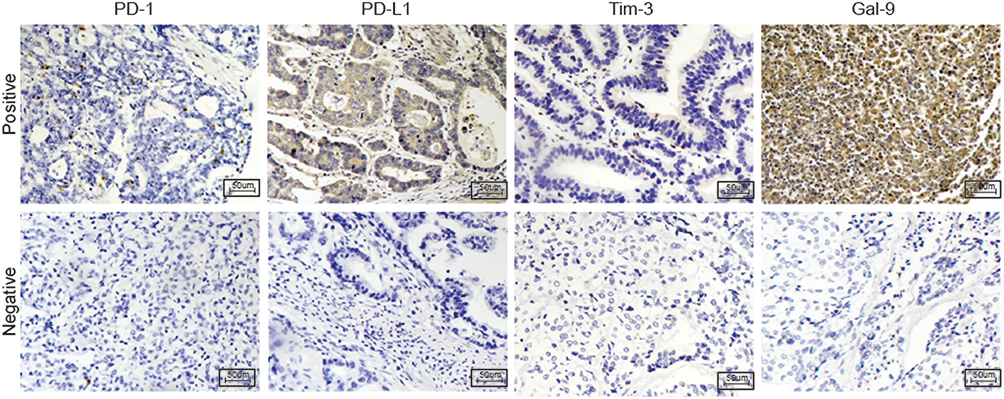 |
Figure 1 PD-1, PD-L1, Tim-3, and Gal-9 expression in AEG patients; the upper part shows positive expression, and the lower part shows negative expression. (200x original magnification). |
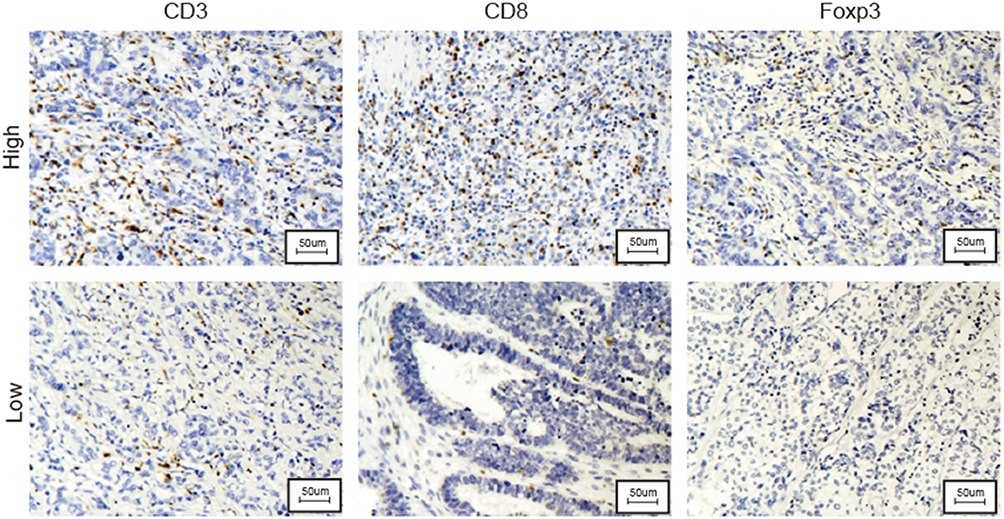 |
Figure 2 CD3-, CD8-, and Foxp3-positive T cell infiltration in AEG patients; the upper part shows high infiltration in the tumor, and the lower part shows low infiltration. |
The Correlation Between Immune Checkpoint Expression and Patient Survival
After analyzing the correlation between the PD-1/PD-L1 expression level and patient survival, no significant difference between the PD-L1-high and PD-L1-low expression groups was found (P = 0.1759). For PD-1, there was also no evident difference between the positive and negative groups (P = 0.9256). The details are shown in Figure 3. In the analysis of the correlation between Tim-3/Gal-9 expression and patient survival, although high expression of Tim-3 or Gal-9 showed a trend for association with poor survival, there was no significant difference in Tim-3 (P = 0.1448) or Gal-9 (P = 0.1360) expression between patients with poor and patients with good survival. However, combined Tim-3/Gal-9 expression showed a significant correlation with patient survival, and high expression of both was correlated with poor prognosis (P =0. 0193). The detailed combined results are shown in Figure 4. In terms of double-positive PD-1/PD-L1 patients, there were only 3 cases, and these patients all had relatively poor prognoses.
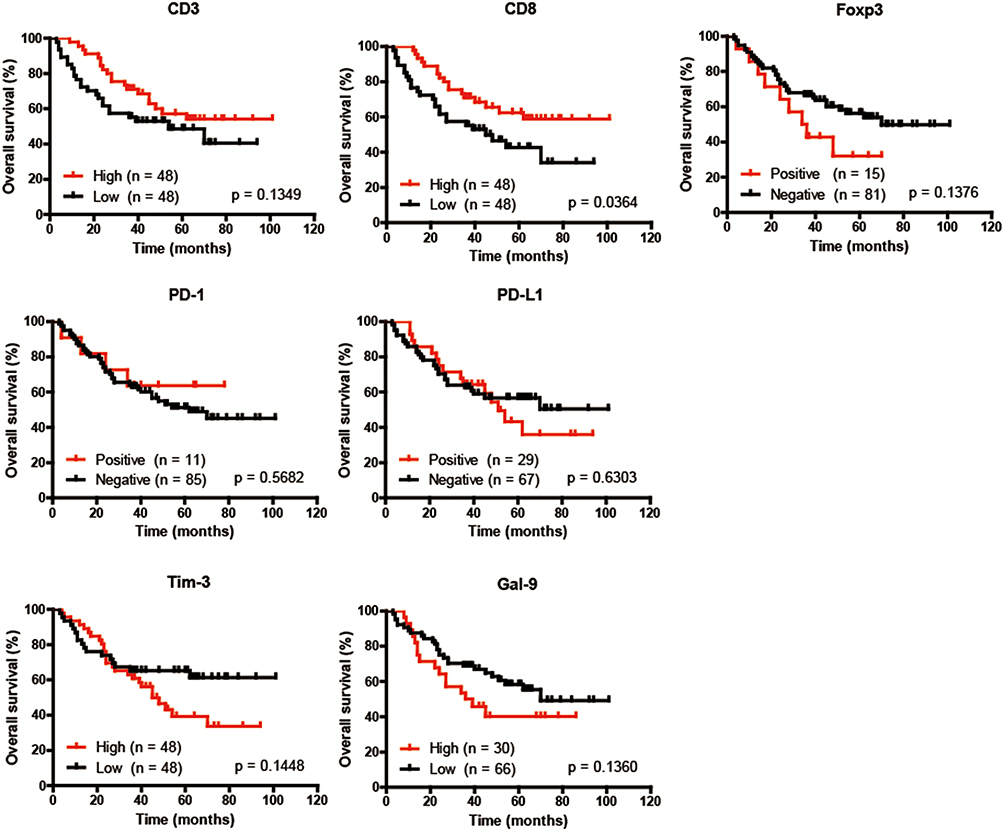 |
Figure 3 Kaplan–Meier survival curves for OS based on different CD3, CD8, Foxp3, PD-L1, PD-1, Tim-3 and Gal-9 expression statuses. |
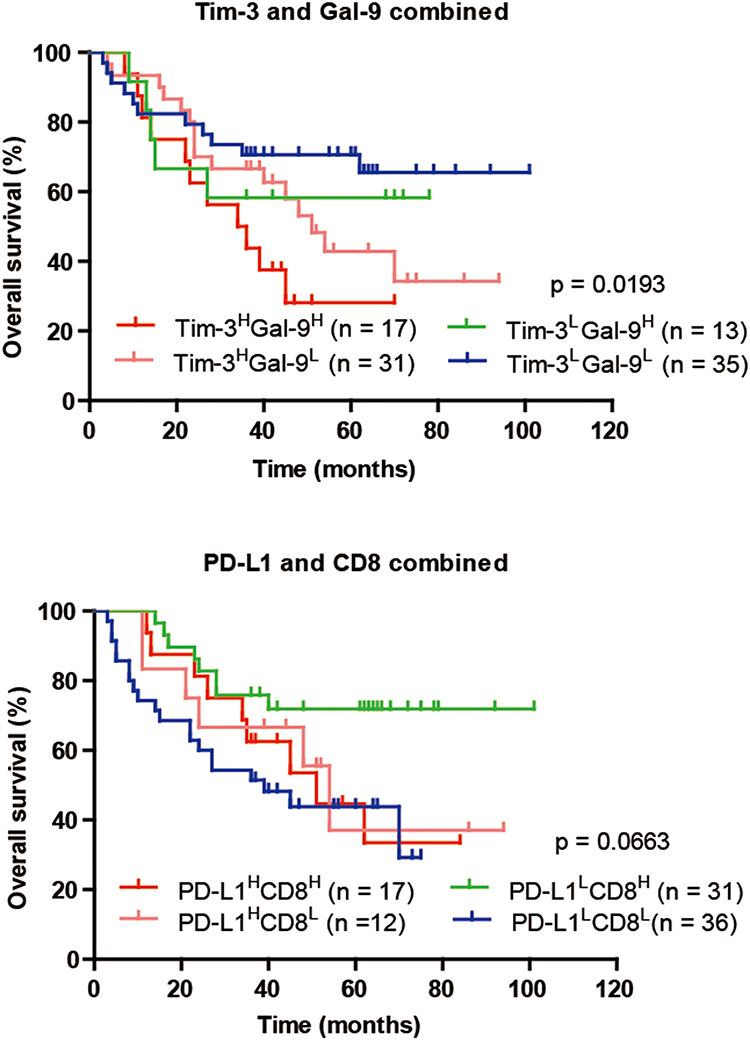 |
Figure 4 Combined analysis of the association between Tim‑3 and Gal‑9 expression and patient OS. Combined analysis of the association between PD-L1 and CD8 expression and patient OS. |
The Correlation Between T Cell Infiltration and Patient Survival
Regarding the relationship between CD3+, CD8+, FOXP3+ T cell infiltration and AEG patient prognosis, high CD3+ or CD8+ T cell infiltration showed a trend for improved survival. CD8+ T cells were significantly different (P = 0.0364) while CD3+ T cells were not significantly different (P = 0.1349) between patients with poor and good prognoses. High Foxp3+ T cell infiltration predicted worse survival in AEG patients, but there was no significant difference (P = 0.1376) (Figure 3). The combined analysis of PD-L1/CD8 expression also showed no evident difference among the four groups (P = 0.0663) (Figure 4).
The Correlation Between Immune Factor Expression and Patient Clinicopathologic Data
Next, the correlations of immune checkpoint expression and T cell infiltration with patient clinicopathologic data were analyzed. Clinicopathologic data included patient age and sex, tumor length, Lauren type, presence of intravascular cancer emboli, absence of invasion, surgical approach, T stage, N stage, TNM stage and Siewert type. The results showed that CD8+ T cell infiltration had a close relationship with TNM stage (P = 0.0254), and high Tim-3 expression also had a tight correlation with Siewert type (P = 0.0224). The patterns of CD3+ and CD8+ T cell infiltration differed significantly among Lauren types (P = 0.0197 and P = 0.0058, respectively): the diffuse and mixed types had more CD3+ and CD8+ T cell infiltration than the intestinal type. The detailed results are shown in Tables 1–3.
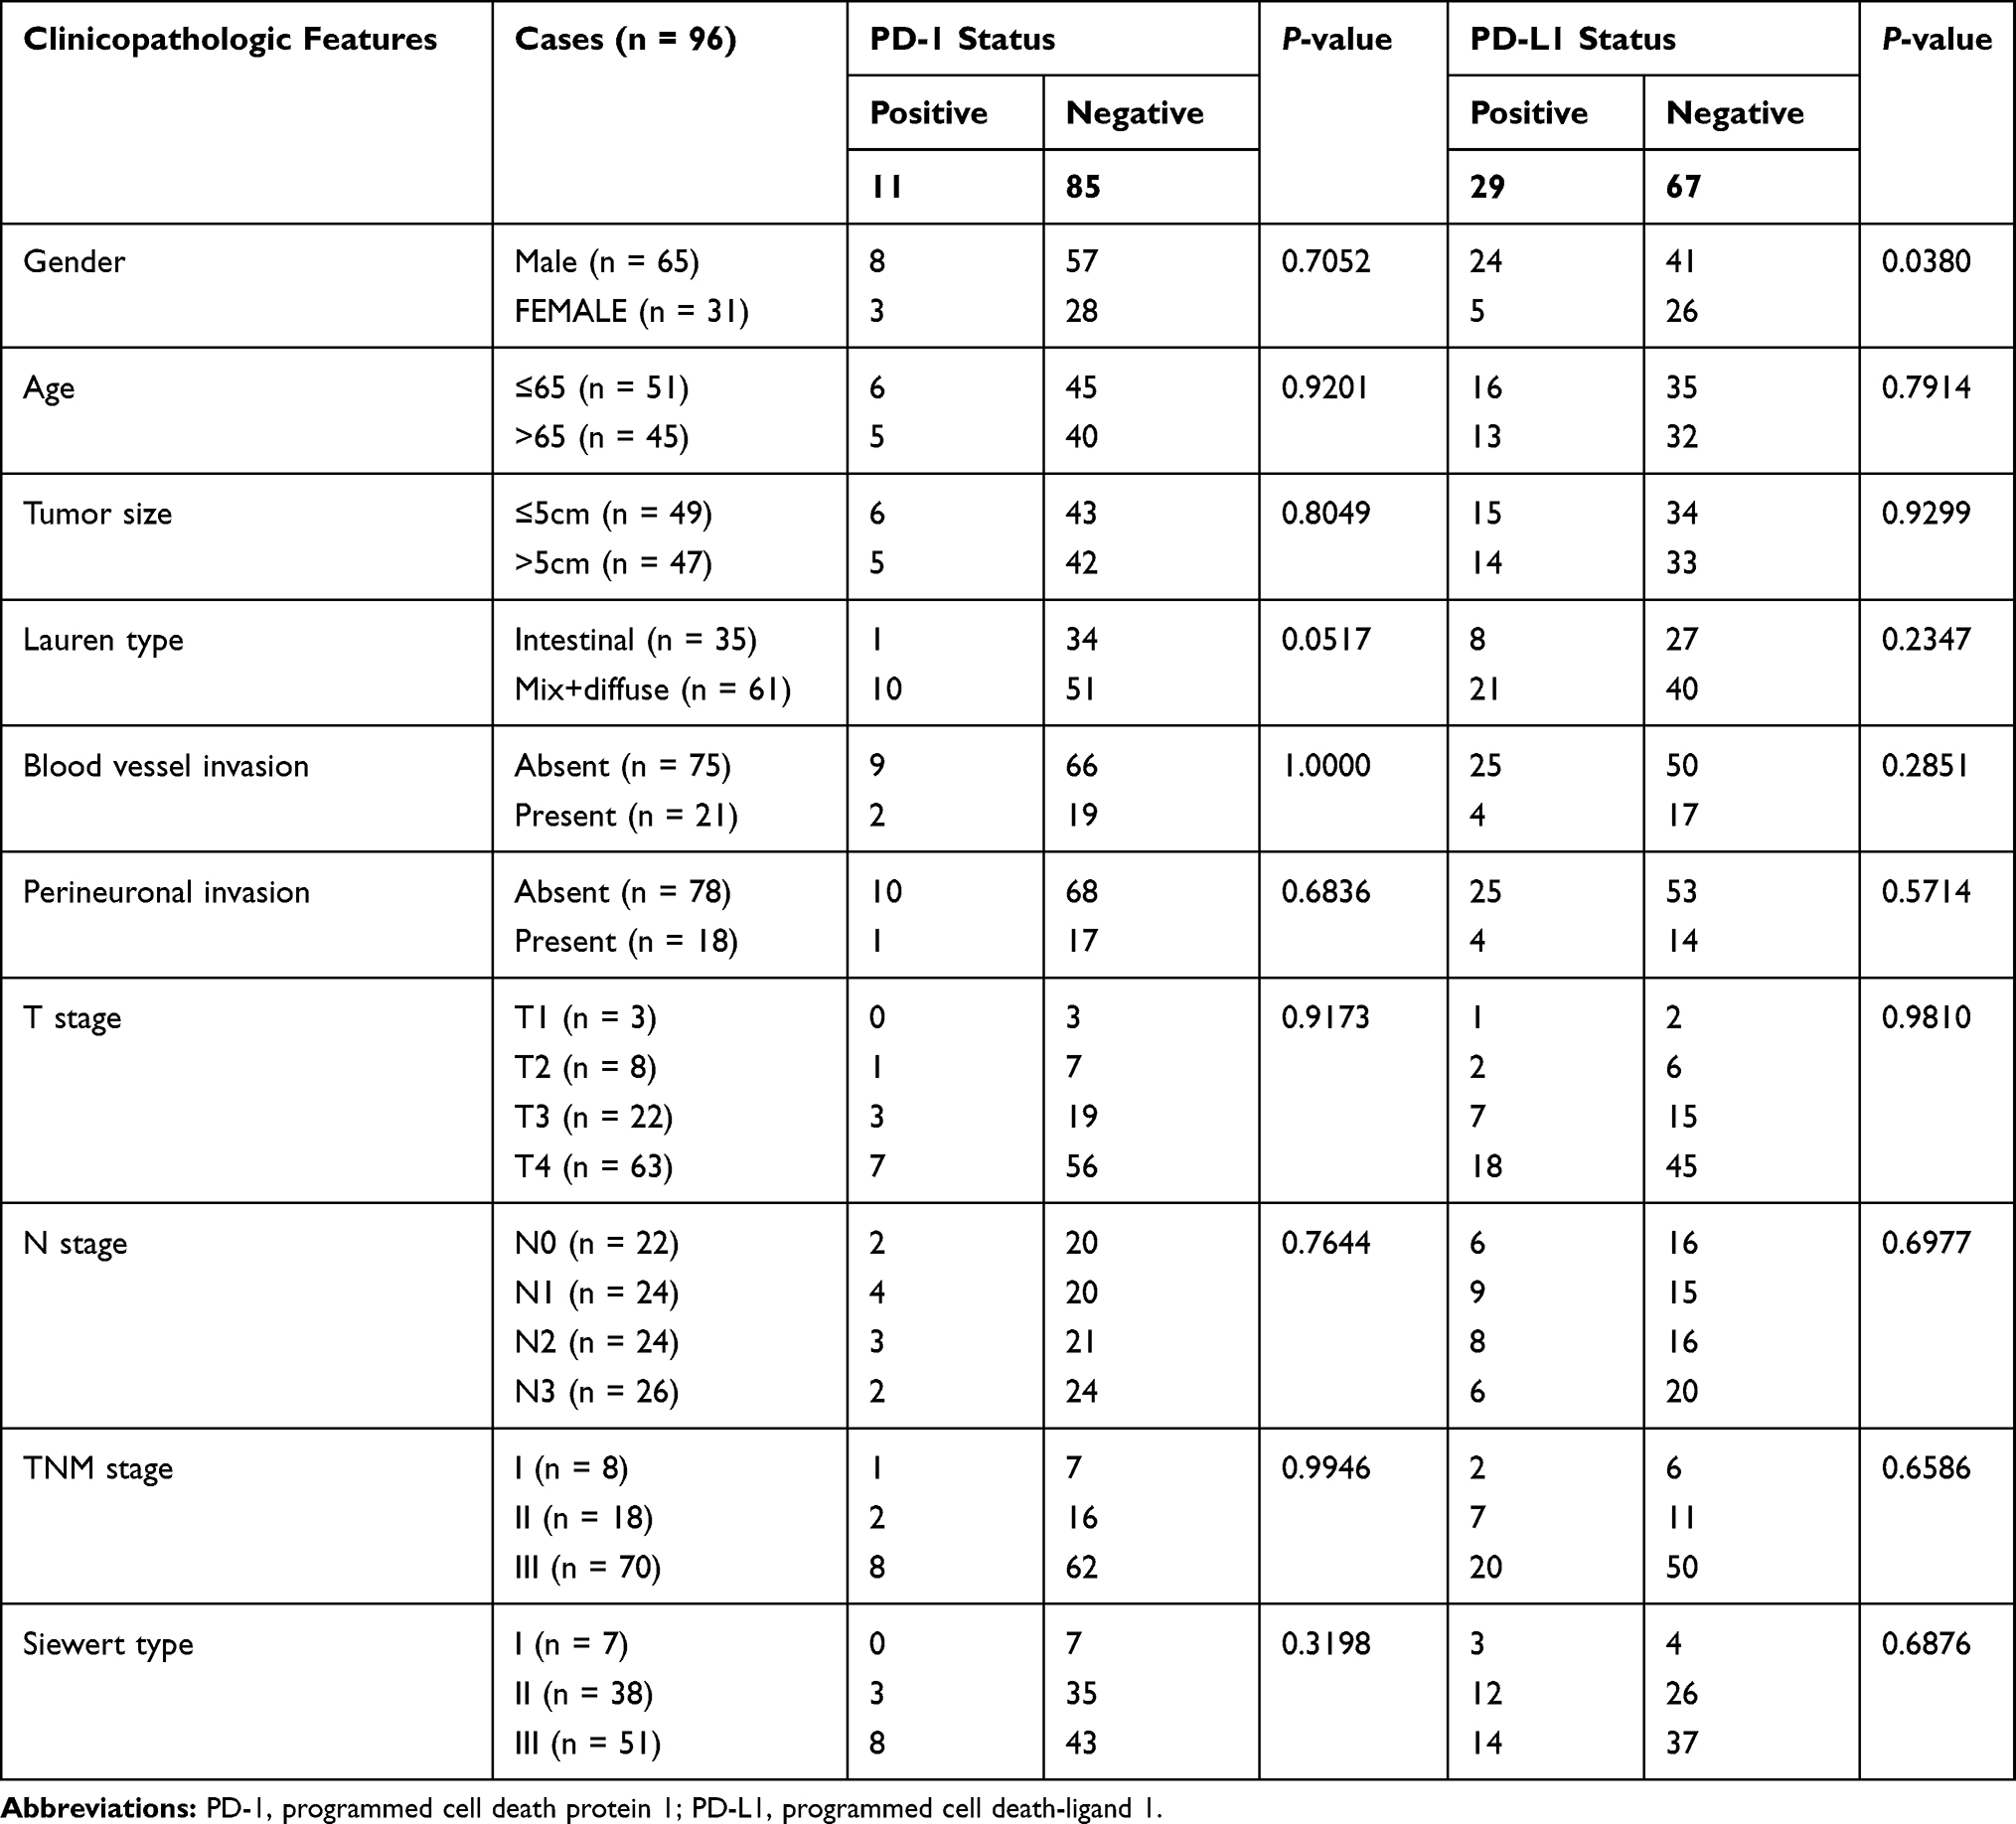 |
Table 1 The Correlation Between PD-1/PD-L1 Expression and Patient Clinicopathologic Data |
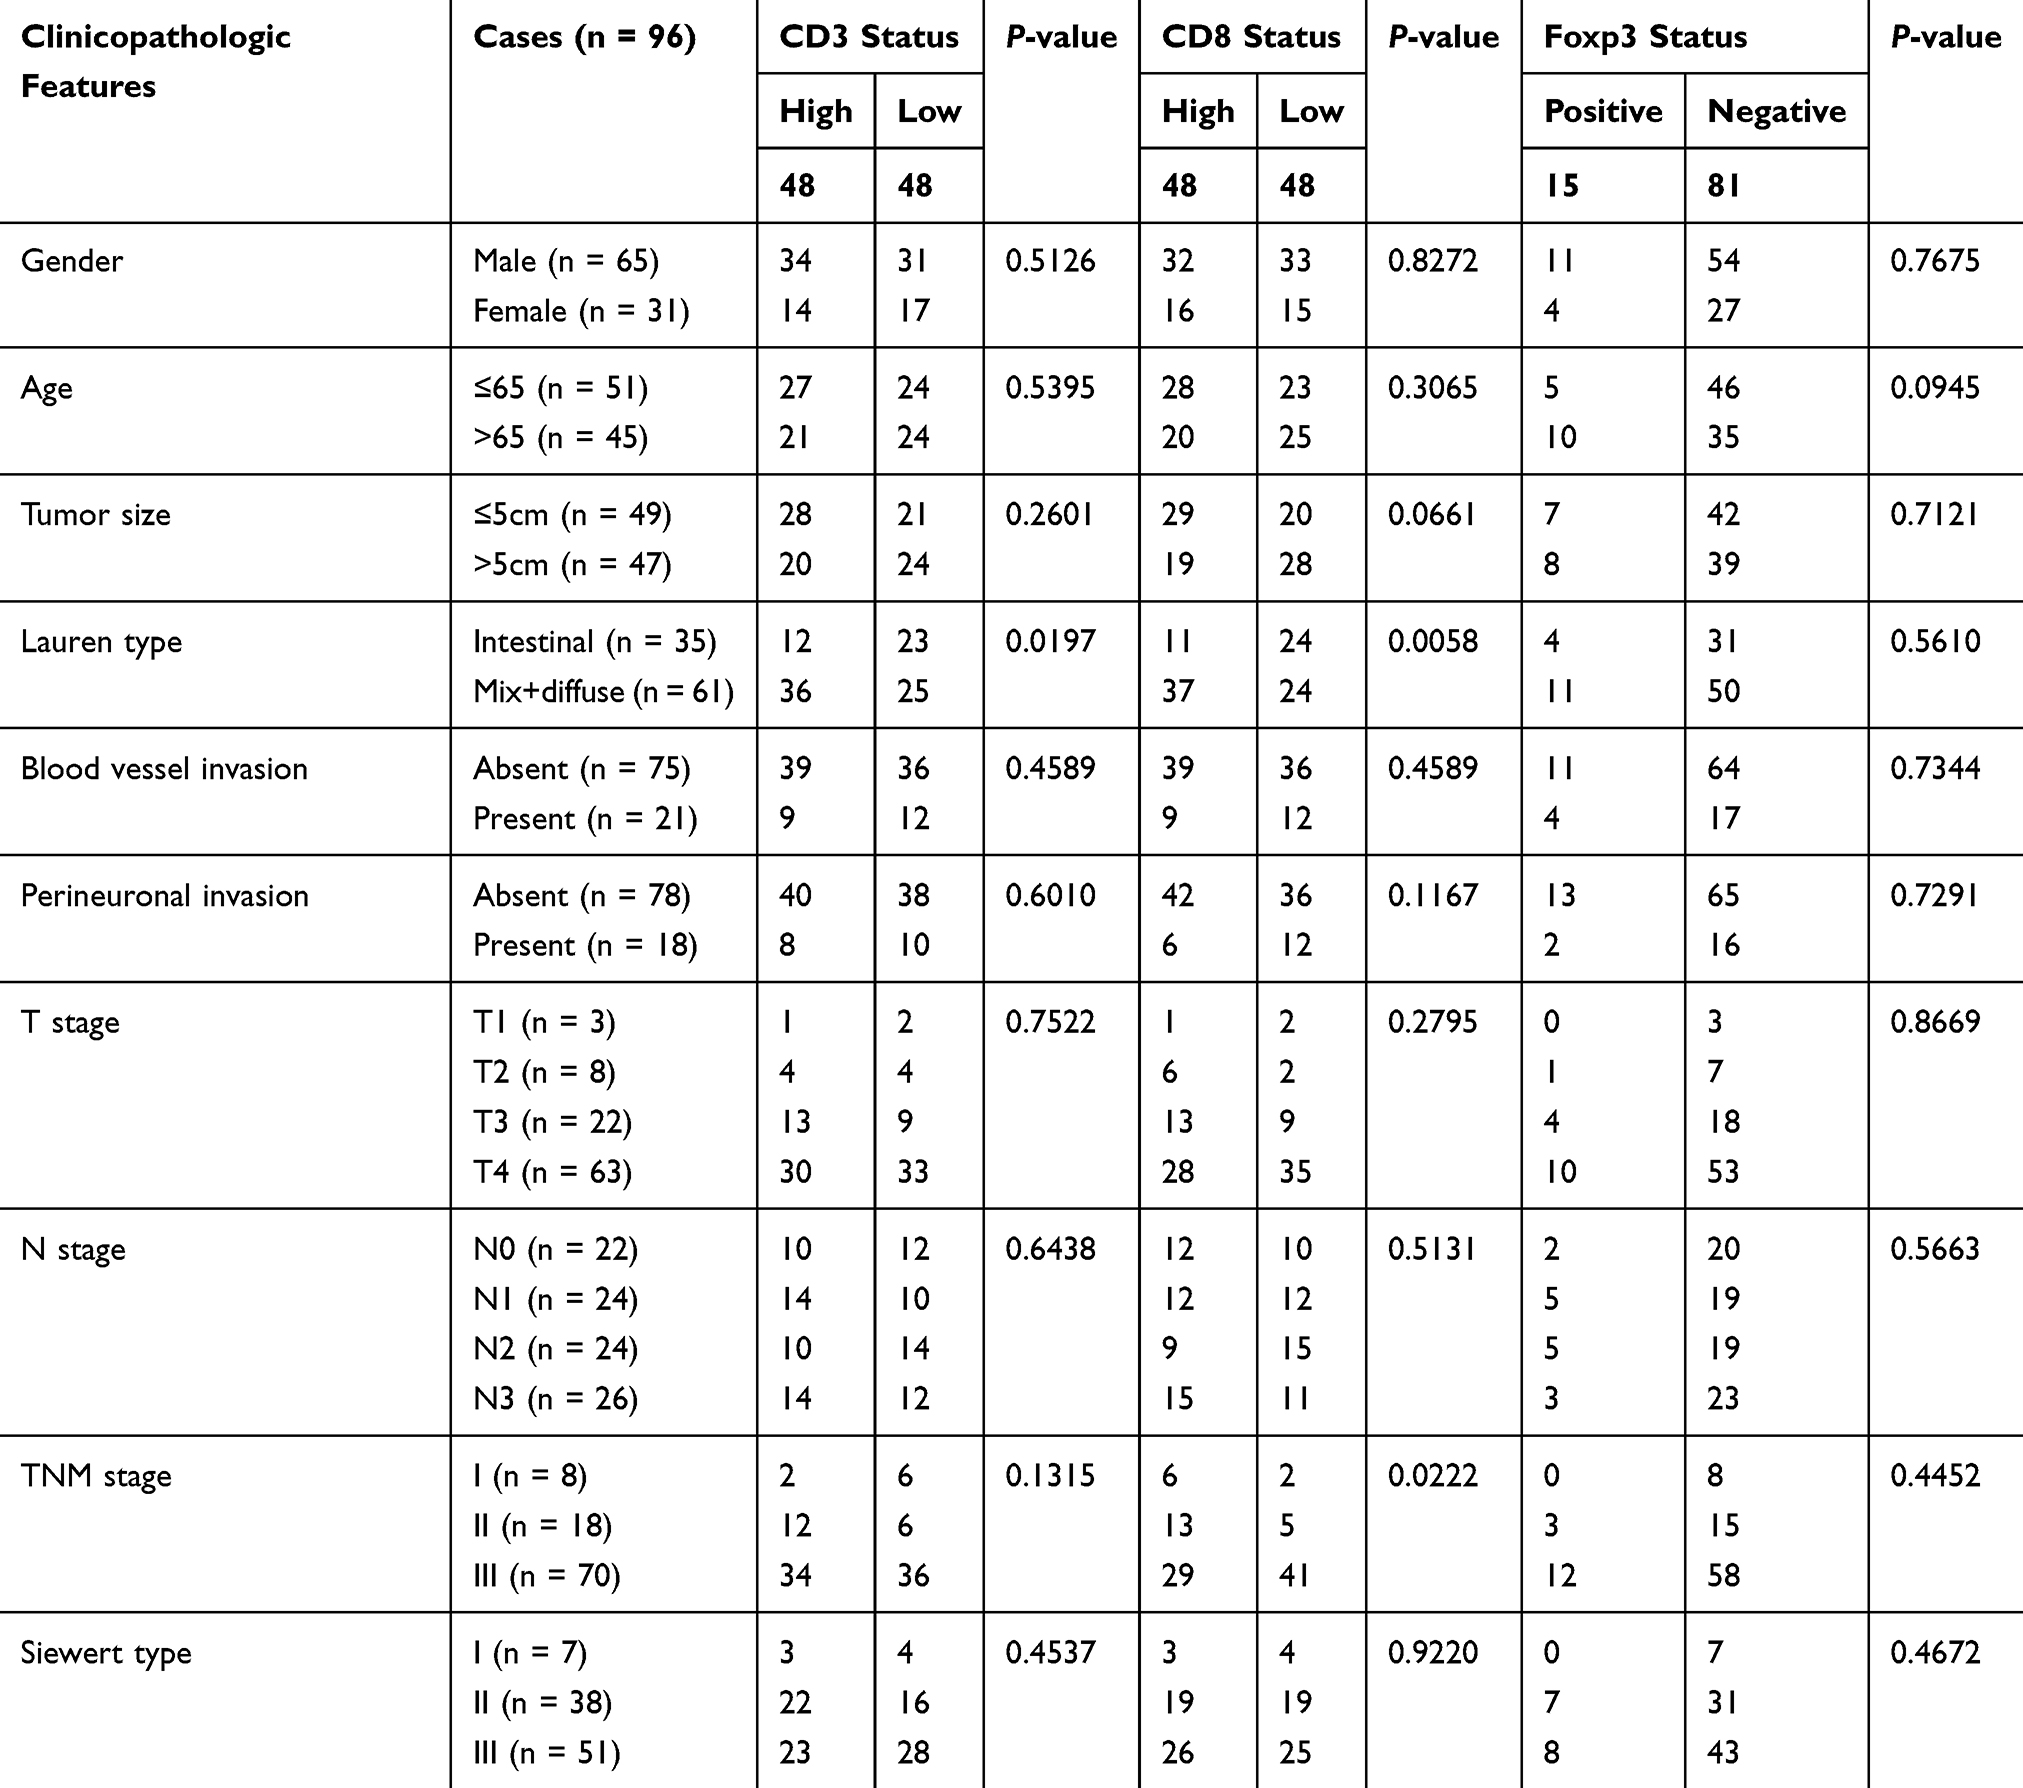 |
Table 2 The Correlation Between CD3/CD8/Foxp3 Expression and Patient Clinicopathologic Data |
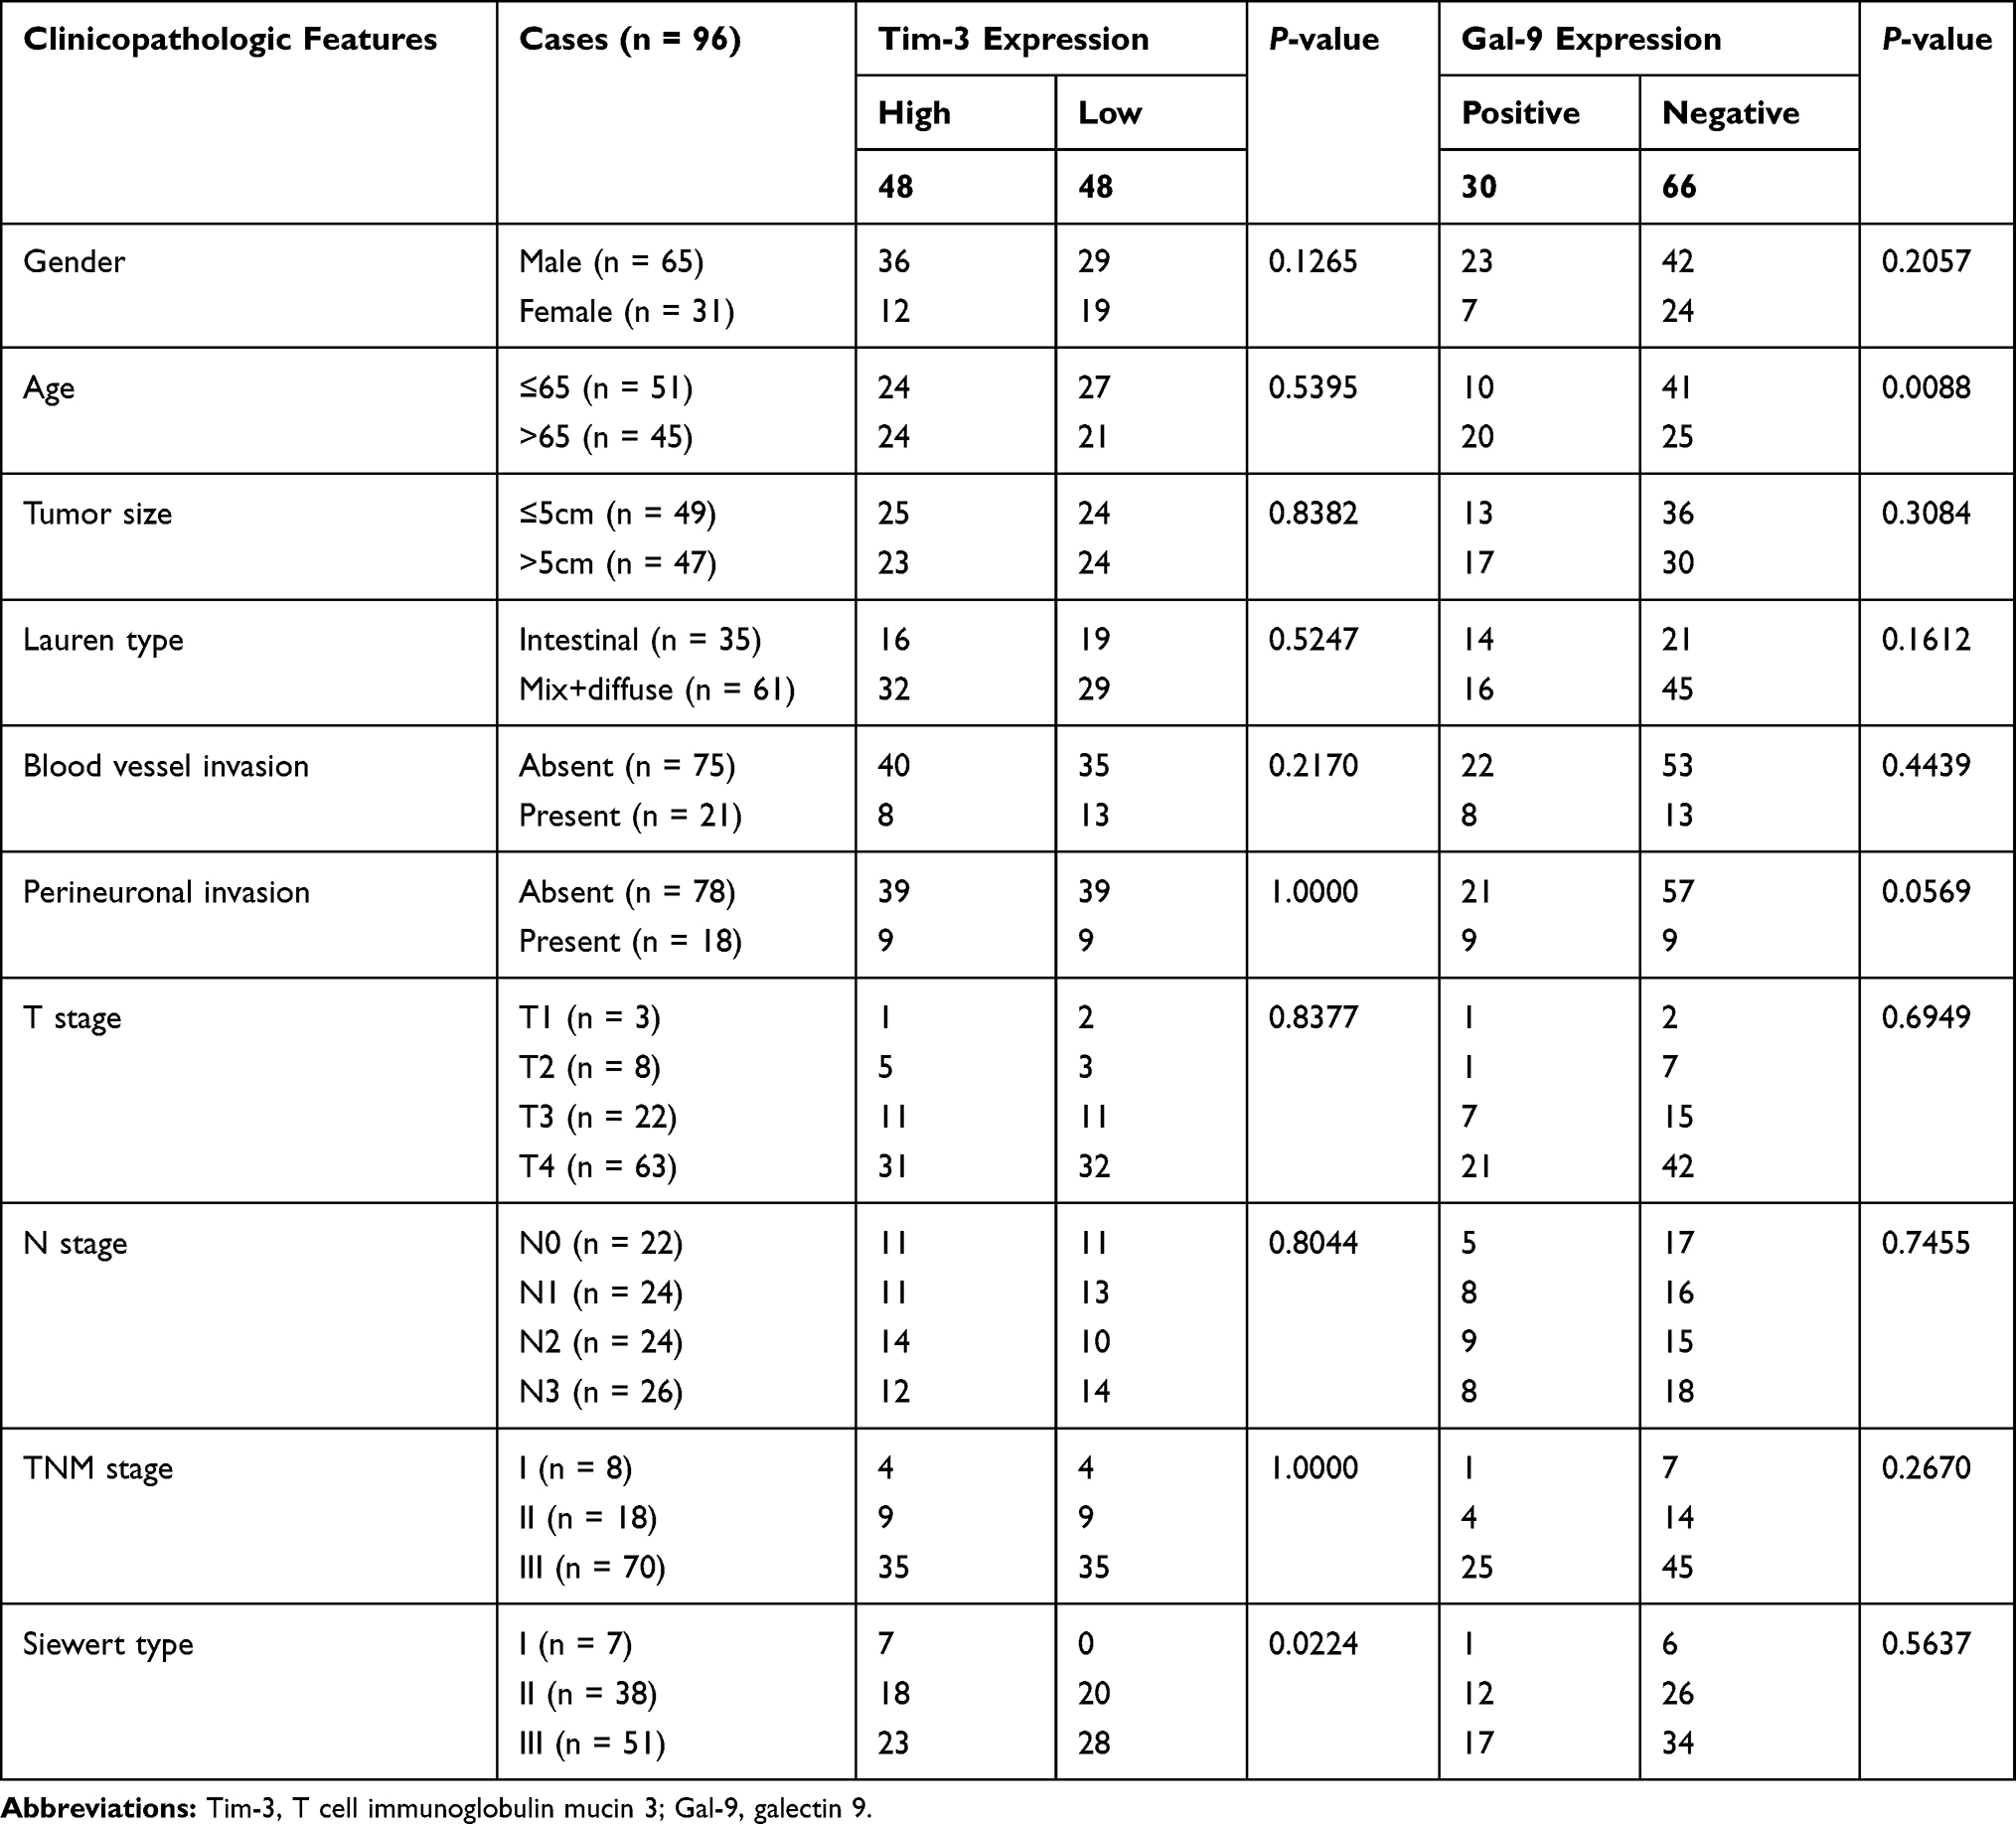 |
Table 3 The Correlation Between Tim-3/Gal-9 Expression and Patient Clinicopathologic Data |
The Association Between Immune Checkpoint Expression and T Cell Infiltration
As illustrated by the data, PD-L1-positive status was often accompanied by high infiltration of CD3+ and CD8+ T cells. For the other immune checkpoint markers, there were no evident correlations. The results are shown in Figure 5.
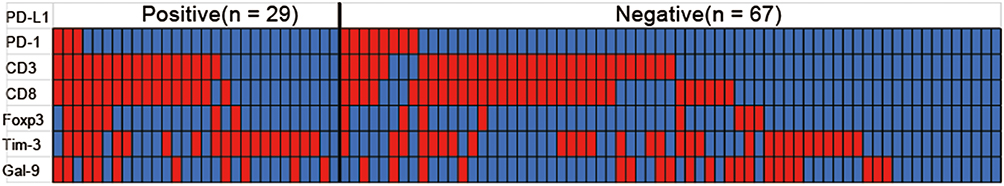 |
Figure 5 Heat map of PD-1, CD3, CD8, Foxp3, Tim-3 and Gal-9 expression and high and low infiltration (or high and low expression) in tumors of PD-L1-positive and PD-L1-negative AEG patients. |
Discussion
AEG is a unique tumor due to its specific location in the digestive duct. In this study, the immune characteristics of AEG were analyzed, and these immune features were compared with clinicopathologic data and patient survival. In this study, 12.99% of the patients showed positive PD-1 expression, while there was no significant difference among the positive and negative groups in the survival analysis. Moreover, in previous research, a high portion of PD-1-positive CD8+ T cells in peripheral blood was associated with more obvious immune suppression than a low proportion of PD-1-positive CD8+ T cells in peripheral blood in gastric cancer patients.13 In this study, there was also no obvious relationship between a positive PD-1 status and clinicopathologic data, so PD-1 status may not function as a major indicator for predicting AEG patient survival. Another study published in Nature Review Cancer in 2016 showed14 that patients with high PD-L1 expression may achieve better survival than patients with low PD-L1 expression. In the adaptive immune reaction, cytotoxic T lymphocytes (CTLs) in the tumor microenvironment can secrete IFN-γ when undergoing antigen stimulation, which can lead to an adaptive immune response, while tumor cells upregulate PD-L1 expression to avoid the killing of PD-1-positive T cells, and this PD-L1 upregulation is considered evidence of systemic immune system activation. In this scenario, the immune system is mobilized to kill and eliminate tumor cells. In this study, PD-L1-positive patients accounted for 32.47% of the study population, a similar proportion as previous studies in gastric cancer and other digestive cancers.15–17 Although the analysis of AEG patients showed that patients with positive or negative PD-L1 expression had no significant differences in survival time, clinicopathologic data or Siewert types, the positive patients showed an improved trend in survival. These above results were the same as those of previous studies in stomach cancer,18 colorectal cancer,19 gallbladder cancer,20 breast cancer,21 metastatic melanoma22 and other tumors.23 In this study, PD-L1 expression had no correlation with clinicopathologic data, perhaps due to the limited number of patients.
A significant association between high Tim‑3 expression and Siewert type I tumors was observed in the AEG patients, but there was no difference in patient survival. Different Siewert types may have different kinds of mucosal cells with different infiltrating immune cells, and blockage of Tim-3 in Siewert I AEG patients may be recommended for immune therapy in the future. In a previous study of gastric cancer, patients with high tumor infiltration of Tim-3+ cells exhibited shorter survival times than those with the low infiltration. Tim-3+ infiltrating immune cells in tumors were associated with a poor prognosis after univariate and multivariate analysis.24 For the Tim-3 ligand Gal-9, there were no significant differences in patient survival between the high and low expression groups. However, some previous studies in many types of cancer found that Gal-9 and other galectin family members can function as prognostic markers.24–27 In the combined analysis of Tim-3/Gal-9, high expression of both Tim-3 and Gal-9 was associated with poor survival in AEG patients. The increase in CD8+ T cells accompanying Tim-3 protein expression provides immune tolerance once the cells encounter cancer cells expressing high levels of Gal-9.24 When immune system function is inhibited, the killing and elimination of tumor cells are attenuated. Tim-3/Gal-9-targeted immune therapy may be useful for AEG patients with these cellular characteristics.
The infiltration of T cells in AEG was investigated in this study. The surface molecules CD3, CD8, and Foxp3 are markers of tumor-infiltrating lymphocytes (TILs), cytotoxic lymphocytes (CTLs), and T regulation cell (Tregs), respectively. Correlations between T cell infiltration and patient survival or clinicopathologic data were analyzed. The association between high CD3+ and CD8+ T cell density and a favorable prognosis was reported in previous gastric cancer studies.28,29 In this study, no evident correlation was found between CD3+ T cell infiltration in tumors and patient survival. There may be many kinds of CD3+ T cells in the tumor microenvironment, and different kinds play different roles in the antitumor immune response. Patients with high infiltration of CD8+ T cells had a better prognosis than patients with low infiltration of CD8+ T cells, and CD8+ T cell infiltration was closely related to patient TNM stage, a finding that was consistent with previous studies in gastric cancer.30 A high infiltration of CD8+ T cells can lead to substantial elimination of tumors, which can inhibit tumor progression, resulting in early TNM stages among patients with these characteristics. In the tumor microenvironment, CD8+ T cells can directly kill tumor cells via adaptive immunity.29 In addition, patients with diffuse and mixed types of AEG had more CD3+ and CD8+ T cell infiltration than patients with the intestinal type, possibly because different histological types contain different kinds of cancer cells. These cancer cells may secrete various cytokines and chemokines to attract specific T cells or other immune cells. The exact reason for the discrepancy needs to be further explored.
Another unique type of T cell, Tregs, can function to suppress the majority of immune cells, such as B cells, CD4+ T cells, CD8+ T cells and NK T cells.31 The distinctive molecular marker of Tregs is Forkhead box protein 3 (Foxp3), an important member of the Forkhead transcription factor family.32 In most types of cancer, high infiltration of Tregs is considered to be a marker of poor prognosis due to the suppression of antitumor immunity by Tregs. A low OS rate and poor prognosis were associated with enhanced Foxp3+ T cell expression in gastric cancer patients in a previous study.33 In this study, Treg infiltration in tumor tissue was not significantly associated with AEG patient survival. A previous study showed that PD-L1-positive tumor patients had high infiltration of CD3+ or CD8+ T cells in tumor tissue.34,35 Similar results were obtained in our study; a PD-L1-positive status exhibited a strong relationship with CD3+ or CD8+ T cell infiltration in AEG patients, but patient with PD-L1/CD8 double-positive tumors showed no evident advantage in survival time.
Conclusion
In summary, the present study compared PD-1/PD-L1 and Tim-3/Gal-9 expression and T cell infiltration in AEG tumor tissues with patient clinicopathological features and survival. A larger patient sample size in the future is needed to make the conclusions of the present study more robust. Ultimately, blockade of the Tim-3/Gal-9 immune checkpoint axis may be a valuable immunotherapy strategy for the treatment of some AEG patients.
Acknowledgments
The authors would like to thank members of the Department of Pathology, Ren Ji Hospital, School of Medicine, Shanghai Jiao Tong University (Shanghai, China) for providing assistance.
Disclosure
The authors declare no conflicts of interest in this work.
References
1. Siewert JR, Stein HJ. Classification of adenocarcinoma of the oesophagogastric junction. Br J Surg. 1998;85(11):1457–1459.
2. Zhang S, Orita H, Fukunaga T. Current surgical treatment of esophagogastric junction adenocarcinoma. World J Gastrointest Oncol. 2019;11(8):567–578. doi:10.4251/wjgo.v11.i8.567
3. Topalian SL, Drake CG, Pardoll DM. Immune checkpoint blockade: a common denominator approach to cancer therapy. Cancer Cell. 2015;27(4):450–461. doi:10.1016/j.ccell.2015.03.001
4. Pardoll DM. The blockade of immune checkpoints in cancer immunotherapy. Nat Rev Cancer. 2012;12(4):252–264. doi:10.1038/nrc3239
5. Simon S, Vignard V, Florenceau L, et al. PD-1 expression conditions T cell avidity within an antigen-specific repertoire. Oncoimmunology. 2016;5(1):e1104448. doi:10.1080/2162402X.2015.1104448
6. Wang Q, Liu F, Liu L. Prognostic significance of PD-L1 in solid tumor: an updated meta-analysis. Medicine. 2017;96(18):e6369. doi:10.1097/MD.0000000000006369
7. Vanella V, Festino L, Strudel M, Simeone E, Grimaldi AM, Ascierto PA. PD-L1 inhibitors in the pipeline: promise and progress. Oncoimmunology. 2017;7(1):e1365209. doi:10.1080/2162402X.2017.1365209
8. Topalian SL, Hodi FS, Brahmer JR, et al. Safety, activity, and immune correlates of anti-PD-1 antibody in cancer. N Engl J Med. 2012;366(26):2443–2454. doi:10.1056/NEJMoa1200690
9. Monney L, Sabatos CA, Gaglia JL, et al. Th1-specific cell surface protein Tim-3 regulates macrophage activation and severity of an autoimmune disease. Nature. 2002;415(6871):536–541. doi:10.1038/415536a
10. Liu FT, Rabinovich GA. Galectins as modulators of tumour progression. Nat Rev Cancer. 2005;5(1):29–41. doi:10.1038/nrc1527
11. Wang Y, Zhu C, Song W, Li J, Zhao G, Cao H. PD-L1 expression and CD8(+) T cell infiltration predict a favorable prognosis in advanced gastric cancer. J Immunol Res. 2018;2018:4180517. doi:10.1155/2018/4180517
12. Masugi Y, Nishihara R, Yang J, et al. Tumour CD274 (PD-L1) expression and T cells in colorectal cancer. Gut. 2017;66(8):1463–1473. doi:10.1136/gutjnl-2016-311421
13. Takano S, Saito H, Ikeguchi M. An increased number of PD-1+ and Tim-3+ CD8+ T cells is involved in immune evasion in gastric cancer. Surg Today. 2016;46(11):1341–1347. doi:10.1007/s00595-016-1305-9
14. Topalian SL, Taube JM, Anders RA, Pardoll DM. Mechanism-driven biomarkers to guide immune checkpoint blockade in cancer therapy. Nat Rev Cancer. 2016;16(5):275–287. doi:10.1038/nrc.2016.36
15. Zhang L, Qiu M, Jin Y, et al. Programmed cell death ligand 1 (PD-L1) expression on gastric cancer and its relationship with clinicopathologic factors. Int J Clin Exp Pathol. 2015;8(9):11084–11091.
16. Zheng Z, Bu Z, Liu X, et al. Level of circulating PD-L1 expression in patients with advanced gastric cancer and its clinical implications. Chin J Cancer Res. 2014;26(1):104–111. doi:10.3978/j.issn.1000-9604.2014.02.08
17. Wu P, Wu D, Li L, Chai Y, Huang J. PD-L1 and survival in solid tumors: a meta-analysis. PLoS One. 2015;10(6):e0131403. doi:10.1371/journal.pone.0131403
18. Kim JW, Nam KH, Ahn SH, et al. Prognostic implications of immunosuppressive protein expression in tumors as well as immune cell infiltration within the tumor microenvironment in gastric cancer. Gastric Cancer. 2016;19(1):42–52. doi:10.1007/s10120-014-0440-5
19. Dunne PD, McArt DG, O’Reilly PG, et al. Immune-derived PD-L1 gene expression defines a subgroup of stage II/III colorectal cancer patients with favorable prognosis who may be harmed by adjuvant chemotherapy. Cancer Immunol Res. 2016;4(7):582–591. doi:10.1158/2326-6066.CIR-15-0302
20. Liu Y, Carlsson R, Ambjorn M, et al. PD-L1 expression by neurons nearby tumors indicates better prognosis in glioblastoma patients. J Neurosci. 2013;33(35):14231–14245. doi:10.1523/JNEUROSCI.5812-12.2013
21. Schalper KA, Velcheti V, Carvajal D, et al. In situ tumor PD-L1 mRNA expression is associated with increased TILs and better outcome in breast carcinomas. Clin Cancer Res. 2014;20(10):2773–2782. doi:10.1158/1078-0432.CCR-13-2702
22. Taube JM, Anders RA, Young GD, et al. Colocalization of inflammatory response with B7-h1 expression in human melanocytic lesions supports an adaptive resistance mechanism of immune escape. Sci Transl Med. 2012;4(127):127ra137. doi:10.1126/scitranslmed.3003689
23. Lipson EJ, Vincent JG, Loyo M, et al. PD-L1 expression in the Merkel cell carcinoma microenvironment: association with inflammation, Merkel cell polyomavirus and overall survival. Cancer Immunol Res. 2013;1(1):54–63. doi:10.1158/2326-6066.CIR-13-0034
24. Wang Y, Zhao E, Zhang Z, Zhao G, Cao H. Association between Tim3 and Gal9 expression and gastric cancer prognosis. Oncol Rep. 2018;40(4):2115–2126. doi:10.3892/or.2018.6627
25. Szoke T, Kayser K, Baumhakel JD, et al. Prognostic significance of endogenous adhesion/growth-regulatory lectins in lung cancer. Oncology. 2005;69(2):167–174. doi:10.1159/000087841
26. Cedeno-Laurent F, Dimitroff CJ. Galectins and their ligands: negative regulators of anti-tumor immunity. Glycoconj J. 2012;29(8–9):619–625. doi:10.1007/s10719-012-9379-0
27. Ohue Y, Kurose K, Nozawa R, et al. Survival of lung adenocarcinoma patients predicted from expression of PD-L1, galectin-9, and XAGE1 (GAGED2a) on tumor cells and tumor-infiltrating T cells. Cancer Immunol Res. 2016;4(12):1049–1060. doi:10.1158/2326-6066.CIR-15-0266
28. Kawazoe A, Kuwata T, Kuboki Y, et al. Clinicopathological features of programmed death ligand 1 expression with tumor-infiltrating lymphocyte, mismatch repair, and Epstein-Barr virus status in a large cohort of gastric cancer patients. Gastric Cancer. 2017;20(3):407–415. doi:10.1007/s10120-016-0631-3
29. Lee HE, Chae SW, Lee YJ, et al. Prognostic implications of type and density of tumour-infiltrating lymphocytes in gastric cancer. Br J Cancer. 2008;99(10):1704–1711. doi:10.1038/sj.bjc.6604738
30. Kim KJ, Lee KS, Cho HJ, et al. Prognostic implications of tumor-infiltrating FoxP3+ regulatory T cells and CD8+ cytotoxic T cells in microsatellite-unstable gastric cancers. Hum Pathol. 2014;45(2):285–293.
31. Frydrychowicz M, Boruczkowski M, Kolecka-Bednarczyk A, Dworacki G. The dual role of Treg in cancer. Scand J Immunol. 2017;86(6):436–443. doi:10.1111/sji.12615
32. de Reuver PR, Mehta S, Gill P, et al. Immunoregulatory forkhead box protein p3-positive lymphocytes are associated with overall survival in patients with pancreatic neuroendocrine tumors. J Am Coll Surg. 2016;222(3):281–287. doi:10.1016/j.jamcollsurg.2015.12.008
33. Hou J, Yu Z, Xiang R, et al. Correlation between infiltration of FOXP3+ regulatory T cells and expression of B7-H1 in the tumor tissues of gastric cancer. Exp Mol Pathol. 2014;96(3):284–291. doi:10.1016/j.yexmp.2014.03.005
34. Ock CY, Keam B, Kim S, et al. Pan-cancer immunogenomic perspective on the tumor microenvironment based on PD-L1 and CD8 T-cell infiltration. Clin Cancer Res. 2016;22(9):2261–2270. doi:10.1158/1078-0432.CCR-15-2834
35. Teng MW, Ngiow SF, Ribas A, Smyth MJ. Classifying cancers based on T-cell infiltration and PD-L1. Cancer Res. 2015;75(11):2139–2145. doi:10.1158/0008-5472.CAN-15-0255
 © 2020 The Author(s). This work is published and licensed by Dove Medical Press Limited. The full terms of this license are available at https://www.dovepress.com/terms.php and incorporate the Creative Commons Attribution - Non Commercial (unported, v3.0) License.
By accessing the work you hereby accept the Terms. Non-commercial uses of the work are permitted without any further permission from Dove Medical Press Limited, provided the work is properly attributed. For permission for commercial use of this work, please see paragraphs 4.2 and 5 of our Terms.
© 2020 The Author(s). This work is published and licensed by Dove Medical Press Limited. The full terms of this license are available at https://www.dovepress.com/terms.php and incorporate the Creative Commons Attribution - Non Commercial (unported, v3.0) License.
By accessing the work you hereby accept the Terms. Non-commercial uses of the work are permitted without any further permission from Dove Medical Press Limited, provided the work is properly attributed. For permission for commercial use of this work, please see paragraphs 4.2 and 5 of our Terms.