")
Back to Journals » Diabetes, Metabolic Syndrome and Obesity » Volume 15
The Association Between Hypertriglyceridemic-Waist Phenotype and Chronic Kidney Disease in Patients with Type 2 Diabetes: A Cross-Sectional METAL Study
Authors Xuan Y, Zhang W, Wang Y, Wang B, Chen Y, Xia F, Zhang K, Li Q, Wang N, Lu Y
Received 3 February 2022
Accepted for publication 11 June 2022
Published 20 June 2022 Volume 2022:15 Pages 1885—1895
DOI https://doi.org/10.2147/DMSO.S359742
Checked for plagiarism Yes
Review by Single anonymous peer review
Peer reviewer comments 3
Editor who approved publication: Professor Ming-Hui Zou
Yan Xuan,1,2,* Wen Zhang,1,* Yuying Wang,1 Bin Wang,1 Yi Chen,1 Fangzhen Xia,1 Kun Zhang,1 Qing Li,1 Ningjian Wang,1 Yingli Lu1
1Institute and Department of Endocrinology and Metabolism, Shanghai Ninth People’s Hospital, Shanghai Jiao Tong University School of Medicine, Shanghai, People’s Republic of China; 2Department of Endocrinology, Luwan Branch, Ruijin Hospital, Shanghai Jiao Tong University School of Medicine, Shanghai, 200020, People’s Republic of China
*These authors contributed equally to this work
Correspondence: Yingli Lu, Institute and Department of Endocrinology and Metabolism, Shanghai Ninth People’s Hospital, Shanghai Jiao Tong University School of Medicine, Shanghai, 200011, People’s Republic of China, Tel +86-13636352507, Fax +86-21-63136856, Email [email protected]
Background: The aim of this study was measuring the association between the hypertriglyceridemic-waist (HTGW) phenotype and chronic kidney disease in a large type 2 diabetes population.
Methods: A total of 4254 diabetic patients from the cross-sectional Environmental Pollutant Exposure and Metabolic Diseases in Shanghai (METAL) study were enrolled. The hypertriglyceridemic-waist (HTGW) phenotype was defined as the presence of an elevated waist circumference (WC) and elevated triglyceride (TG) concentration. Chronic kidney disease (CKD) was defined as an estimated glomerular filtration rate (eGFR) less than 60 mL/min/1.73 m2 or urinary albumin creatinine ratio (uACR) more than 30 mg/g. Linear and multiple logistic regression models were used for measuring the association between HTGW phenotype and chronic kidney disease.
Results: The prevalence of CKD was 29% and 35.8% in total participants and participants with HTGW phenotype, respectively. Subjects in the HTGW phenotype group were more likely to have CKD (OR 1.47, 95% CI: 1.11, 1.95) compared with subjects in the normal waist circumference and normal triglycerides (NTNW) group. HTGW phenotype was both associated with the increasing risk of decreased eGFR (OR 1.31, 95% CI: 1.02, 1.75) and elevated uACR (OR 1.57, 95% CI: 1.18, 2.11). Furthermore, the stratified analysis showed that the strongest positive association between HTGW phenotype and CKD presence was found in the subgroup of presence of hypertension. The associations were all fully adjusted for age, sex, BMI, current smoking, current drinking and other confounding factors.
Conclusion: Our study suggested a positive association between the HTGW phenotype and CKD in Chinese type 2 diabetes patients. Further prospective studies are needed to confirm our findings and to investigate the underlying biological mechanisms.
Keywords: central obesity, type 2 diabetes mellitus, hypertriglyceridemia waist phenotype, chronic kidney disease
Introduction
Chronic kidney disease (CKD) has become a major public health concern worldwide for its increasing prevalence and devastating complications.1 Chronic kidney disease very likely goes to end-stage renal disease (ESRD) which needs renal replacement therapy for survival after losing about 90% of normal renal function.2 This situation increases the risk of cardiovascular disease (CVD)3 as well as mortality.4 Diabetes mellitus (DM) is the leading cause of ESRD, accounting for one-third of incident cases all over the world.5 Meanwhile, obesity increases the risk of CKD incidence and accelerates its progression to ESRD.6 The prevalence of obesity and diabetes has risen sharply, and they have been shown to be crucial risk factors for chronic kidney disease observed in China.7 Besides, the COVID-19 pandemic has refocused the adverse effects of obesity, diabetes and CKD on the general health status of individuals. There are growing concerns that CKD patients with diabetes and obesity are more likely to suffer from severe mortality during the COVID-19 pandemic.8,9 Thus, it is important to control some novel metabolic risk factors contributing to chronic kidney disease in patients with type 2 diabetes mellitus (T2DM).10
The hypertriglyceridemic waist (HTGW) phenotype was first proposed in 2000, and defined as the presence of an elevated waist circumference, together with high levels of triglycerides (TGs).11 Waist circumference (WC), a classical marker of central obesity, is associated with increasing risk of CKD incidence.12 Some evidencesuggested a link between high triglyceride levels and CKD incidence.13 The HTGW phenotype has advantages in assessing individuals with higher risk of metabolic abnormalities compared with elevated TG or enlarged WC used alone.14 Furthermore, several epidemiological studies showed the strong positive correlations of the HTGW phenotype with the risk of CVD,15,16 prediabetes and diabetes,17,18 hypertension,19,20 and hyperuricemia.21 Other studies reported the association of HTGW phenotype with an increasing risk of CKD in general middle-old adults22,23 and in lean people (BMI < 24 kg/m2).24 However, existing evidence on the association between HTGW and CKD remains controversial. Several studies found positive association between HTGW phenotype and CKD only in women,25,26 while another study of elderly participants came to an opposing conclusion.23 These studies were conducted in the general population, and few studies focused on diabetic patients with CKD. Meantime, studies assessing the association of HTGW phenotype with both decreased estimated glomerular filtration rate (eGFR) and elevated urine albumin/creatinine ratio (uACR) in T2DM population are rare. Therefore, our study aimed to prospectively explore the relationship of HTGW phenotype with chronic kidney disease in a large Chinese T2DM population.
Materials and Methods
Study Population
The cross-sectional Environmental Pollutant Exposure and Metabolic Diseases in Shanghai (METAL) study (www.chictr.org.cn, ChiCTR 1800017573) was conducted in 2018 to investigate the relationship between diabetes complications and risk factors in Chinese diabetic patients. We enrolled participants from seven communities in the Huangpu and Pudong districts in Shanghai. In 2018, we obtained the list of diabetic patients who were Chinese citizens ≥18 years old and had lived in their current area for ≥6 months from the registration platform in each community healthcare center and then randomly selected 50% of them (n = 4937) to receive the examination by using SPSS Statistics, Version 22 (IBM Corporation, Armonk, NY, USA).27,28 In total, 4937 patients with diabetes were taken for examination. Those missing laboratory results (n = 267), questionnaire data (n = 116), HTGW phenotype data (n = 99), or CKD data (n = 201) were excluded. Finally, a total of 4254 participants were enrolled in the study (Figure 1). The study protocol was approved by the Ethics Committee of Shanghai Jiao Tong University School of Medicine affiliated to the Shanghai Ninth People’s Hospital.
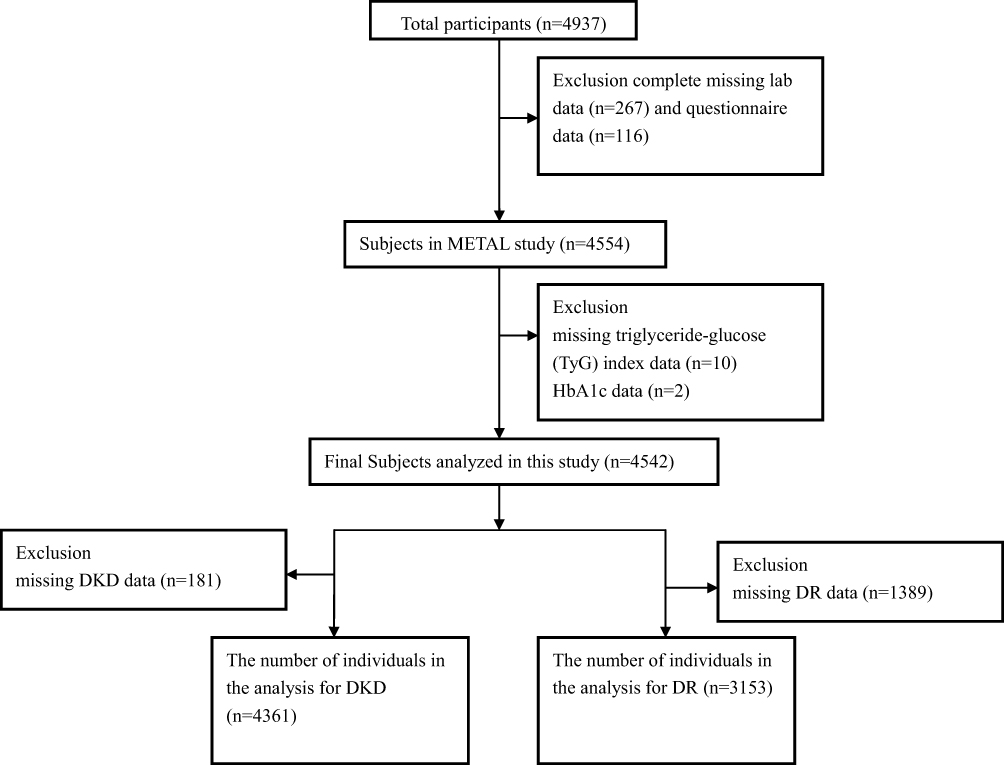 |
Figure 1 Flow chart of study participant selection (inclusions and exclusions). |
The informed consent was obtained from all participants included in our study. The protocol followed the ethical guidelines of the 1975 Declaration of Helsinki, as reflected by the a priori approval granted by the appropriate institutional review committee.
Clinical, Anthropometric and Laboratory Measurements
A questionnaire about sociodemographic characteristics, medical history, family history, and lifestyle factors was adopted during the interview. The interviews and clinical examinations, including measurements of weight, height, and blood pressure, were conducted according to a standard protocol. They were taken by the same trained experienced personnel group involved in the Survey on Prevalence in East China for Metabolic Diseases and Risk Factors (SPECT-China).29,30 Body mass index (BMI) was calculated as weight (in kilograms) divided by height (in meters squared). Normal weight was defined as BMI < 24 kg/m2, while overweight/obese was defined as BMI ≥24 kg/m2 according to the Cooperative Meta-Analysis Group of the Working Group on Obesity in China criteria.31 Insulin resistance was evaluated using homeostasis model assessment of insulin resistance (HOMA-IR), which was calculated as the fasting glucose (mmol/L) × fasting insulin (mIU/L)/22.5.32 Blood pressure (BP) was measured by an electronic sphygmomanometer (Omron HEM-7200 Monitor, Batteries, and Stopwatch) and recorded by a trained physician. Before the BP measurement, the participants in this study were required to rest in a seated position for at least 5 minutes, and BP was measured 3 times at 5-minute intervals. The mean of the 3 readings was calculated. Waist circumference was measured 1 cm above the umbilicus. Demographic information and lifestyle risk factors were gathered from standard questionnaires by trained staff. Drinking and smoking status were divided into never drinking/smoking and past or current drinking/smoking.
Blood samples were obtained after fasting for at least 8 h and were aliquoted and frozen at a central laboratory. Glycated hemoglobin (HbA1c) was measured by an automatic HbA1c analyzer (MEDCONN, Huizhong Medical Science and Technology Co., Ltd, Shanghai, China; Shanghai Huachen Biological Reagent Co., Ltd, Shanghai, China). Glutamic oxaloacetic transaminase (AST), glutamic pyruvic transaminase (ALT), fasting plasma glucose (FPG), total cholesterol (TC), triglycerides (TG), high-density lipoprotein (HDL-C) and low-density lipoprotein cholesterol (LDL-C) were also measured (AU680 Chemistry Analyzer, Beckman Coulter, Brea, CA, USA). TG was measured with assay kits from Beckman Coulter (catalog number: AUZ5612, assay sensitivity: 0.01 mmol/L, intra-assay variability: 6.25%). The eGFR was determined using the Chinese modified Chronic Kidney Disease Epidemiology Collaboration.33 The concentrations of urine albumin and creatinine were measured with a Beckman Coulter AU 680 (Brea, USA) using a turbidimetric immunoassay and an enzymatic method in a single spot urine sample respectively and uACR was calculated.
Definition of Variables
Hypertension was diagnosed as systolic blood pressure ≥140 mmHg, diastolic blood pressure ≥90 mmHg, or a self-reported previous physician’s diagnosis of hypertension. Chronic kidney disease was defined as an estimated glomerular filtration rate (eGFR) less than 60 mL/min/1.73 m2 or urinary albumin creatinine ratio (uACR) ≥ 30 mg/g.34
Definitions of HTGW and the Rest of the Phenotypes
Central obesity was defined as a waist circumference≥90 cm in men and≥80 cm in women.35 The triglyceride level≥1.7 mmol/L was considered abnormal.36 Participants were grouped into four phenotype groups according to the measurements of TG and WC: (1) normal waist circumference and triglycerides (NWNT):TG <1.7 mmol/L, WC <90 cm for men and WC < 80 cm for women; (2) elevated triglycerides and normal waist circumference (NWET): TG≥1.7 mmol/L, WC <90 cm for men and WC<80 cm for women; (3) normal triglycerides and elevated waist circumference (EWNT): TG <1.7 mmol/L, WC ≥90 cm for men and ≥80 cm for women; and (4) hypertriglyceridemic waist (HTGW): TG ≥1.7 mmol/L, WC ≥90 cm for men and ≥80 cm for women.37
Statistical Analyses
Data analyses were used by IBM SPSS version 22 statistical software (IBM Corp., Armonk, NY, USA). P <0.05 indicated significance (two-sided). Continuous variables were expressed as the mean ± SD if the data were normally distributed or the median (interquartile range) if the data were not normally distributed, and categorical variables were expressed as percentages (%). Linear and logistic regression analysis were carried out for the association of four phenotype groups and CKD presence. Because HOMA-IR values and uACR values were not normally distributed, we used a logarithmic transformation (base 10) to normalize the variables. Model 1 was adjusted for age, sex, BMI, current smoking and current drinking. Model 2 was adjusted for Model 1 plus AST, ALT, TC, LDL, FBG, HbA1c, UA, systolic blood pressure (SBP), diastolic blood pressure (DBP), anti-diabetes agents, hypertension and anti-hypertension agents.
For sensitivity analyses, we repeated the analyses to examine the association of triglyceride waist phenotypes and CKD presence. We performed stratified analyses by potential effect modifications: age (<65 years, ≥65 years), sex, BMI (<24 kg/m2, ≥24 kg/m2), HbA1c (<7%, ≥7%), presence or absence of hypertension and the same confounding factors as adjusted for the analyses.
Since the cut-off values of high WC were different in several studies,21,22,35 we used another cut-off value (high WC was defined as ≥102.0 for males and ≥88.0 cm for females)19,38 to analyse the association between the HTGW phenotype and CKD presence in diabetes patients (data shown in Supplement Tables 1–4).
Results
Baseline Clinical Characteristics
Of the 4254 patients with type 2 diabetes, 2271 (53.4%) were female, and the mean age was 66.6 (SD, 7.13) years. The baseline anthropometric parameters and biochemical indices according to four triglyceride waist phenotypes are shown in Table 1. Overall, participants in HTGW phenotype subgroup were older, had a higher proportion of female, worse life habits, were more likely to have a history of hypertension, overweight or obesity, CVD and poorer metabolic profiles including higher BMI, WC, blood pressure, lipids, FPG, HbA1c, UA and uACR and lower levels of HDL-C and eGFR (P <0.001, Table 1). In Table 1, the prevalence of CKD was 29.3% (1248/4254). In participants with HTGW phenotype, anti-diabetes medications were more prevalent (P <0.001). Participants in HTGW group had the highest prevalence of CKD (531/1484 (35.8%)) among the four subgroups (P <0.001). Participants in NWET and EWNT groups had a higher prevalence of CKD (464/1661 (27.9%), 93/319 (29.1%), respectively) than those in NWNT group (160/790 (20.2%)) (P <0.001).
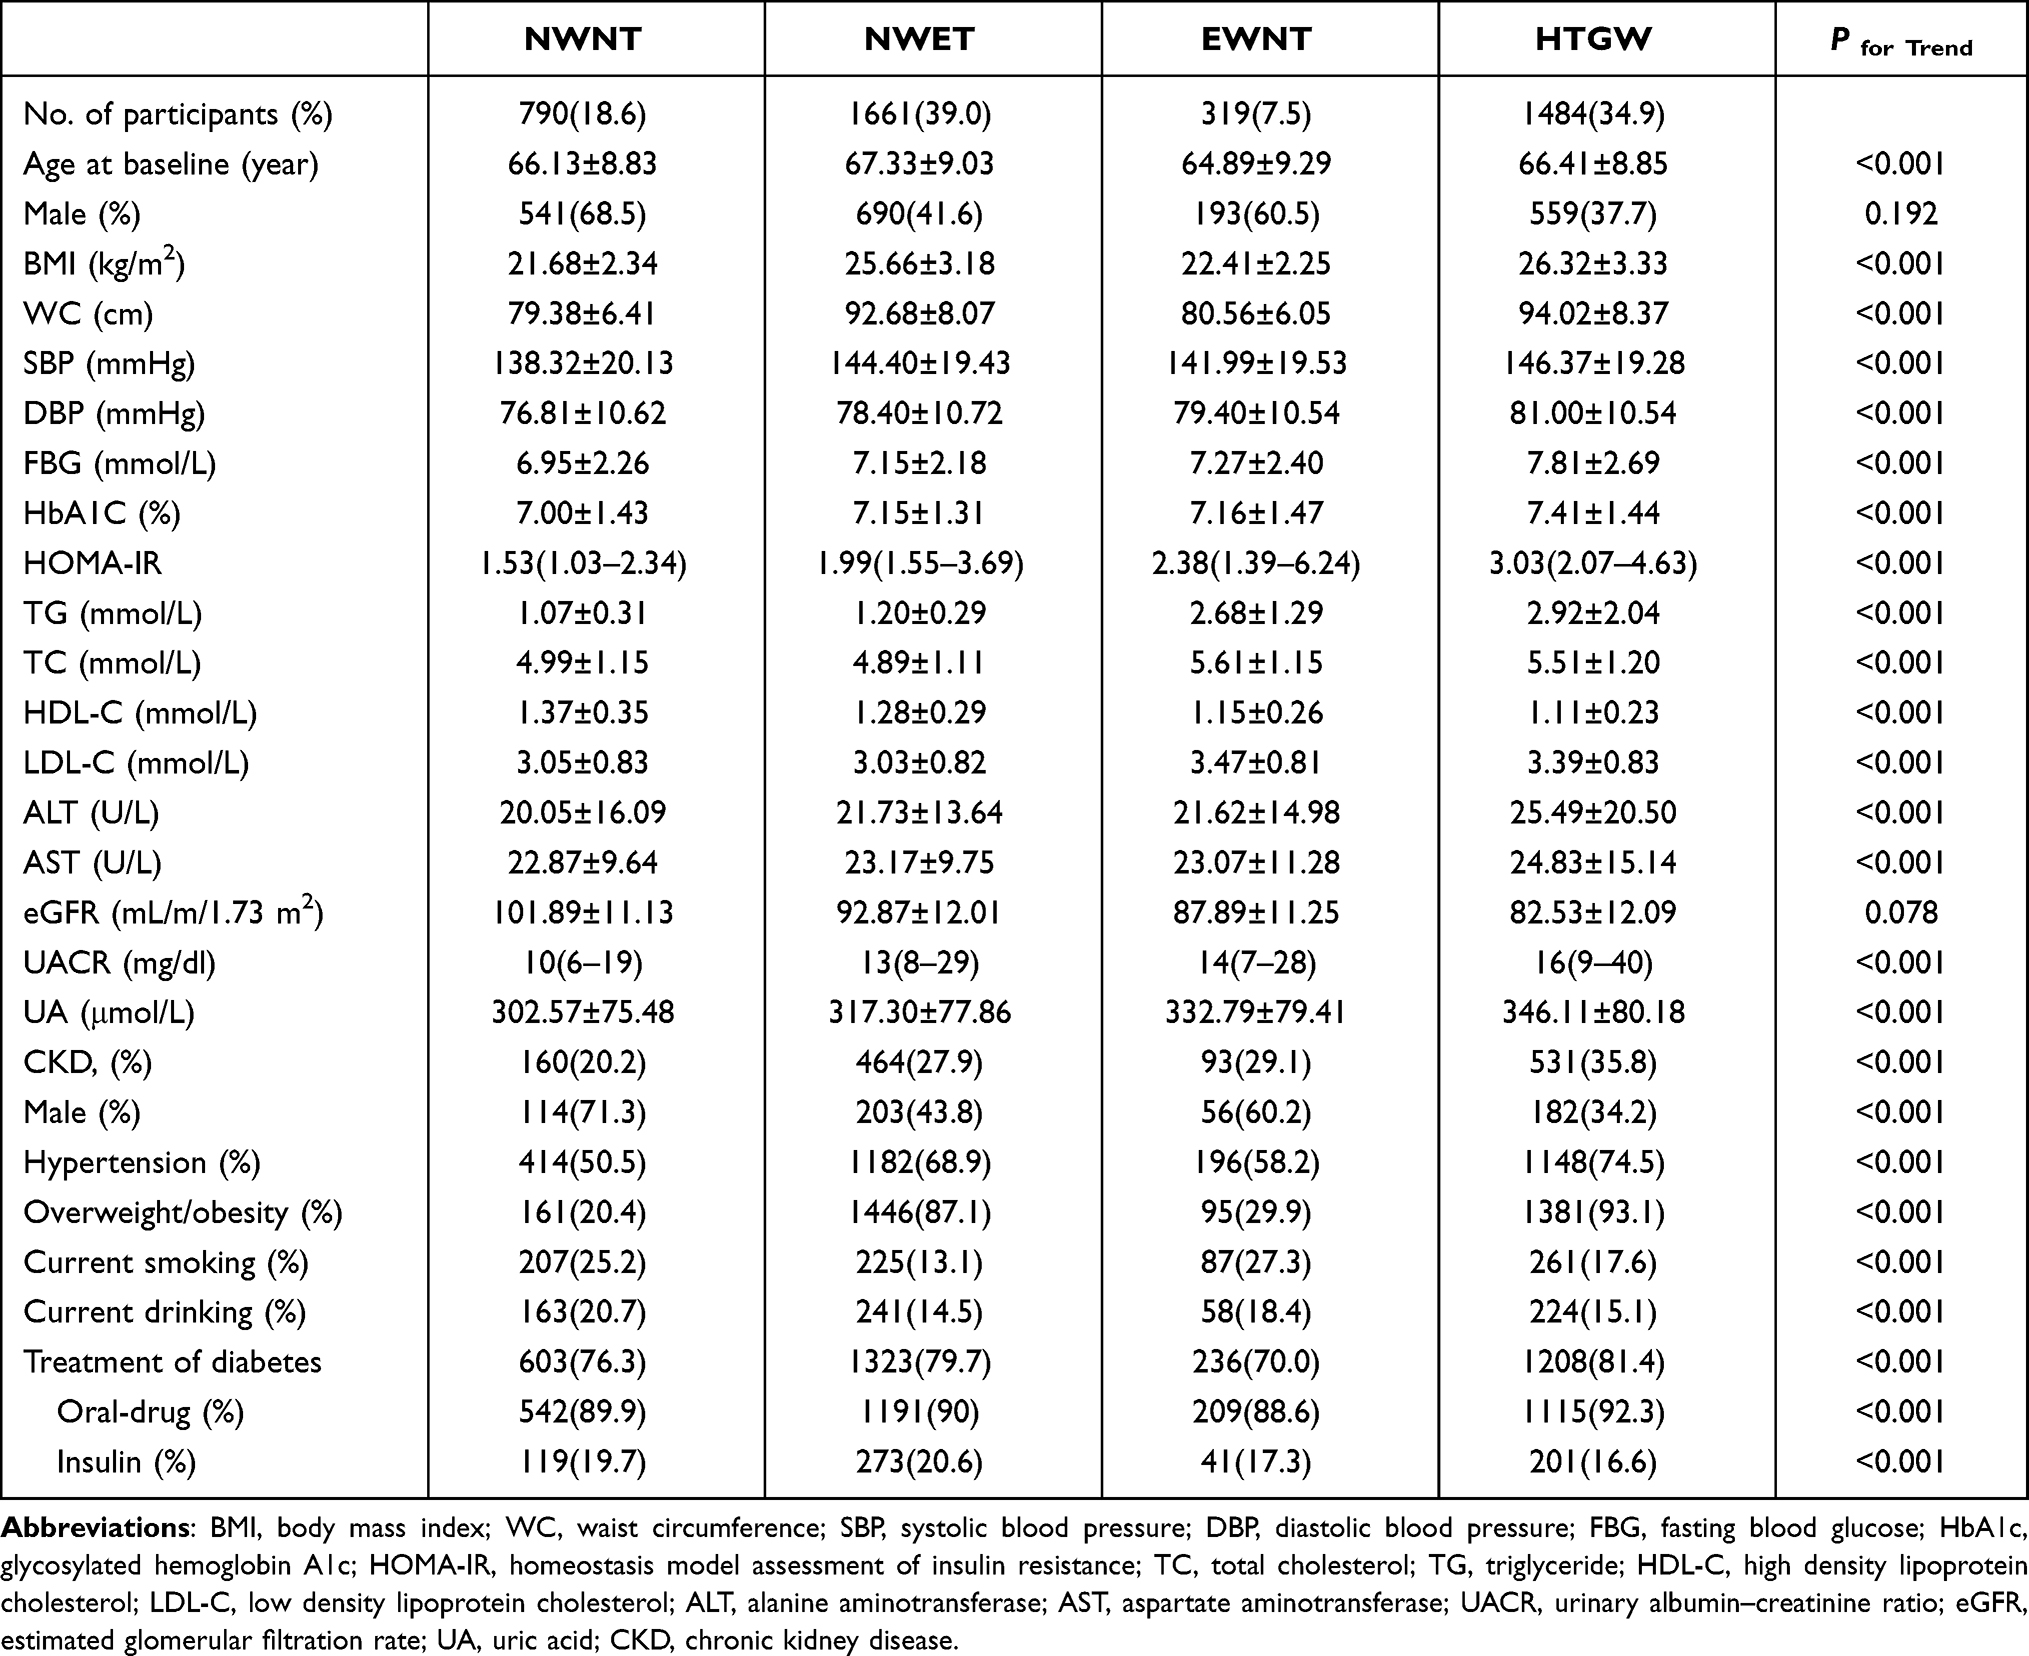 |
Table 1 Characteristics of the Participants in Each Phenotype Group (n = 4254) |
Under analysis by another cut-off value of high WC, the results did not significantly change (Supplementary Table 1).
Association Between HTGW Phenotypes and CKD
Table 2 shows that triglyceride waist phenotype was associated with CKD as well as decreased eGFR and elevated uACR. Compared with NWNT group, individuals with HTGW phenotype were associated with a higher risk of CKD (OR 1.47, 95% CI: 1.11, 1.95) after adjusting for age, sex, BMI, current smoking, current drinking, AST, ALT, TC, LDL, HbA1c, FBG, UA, SBP, DBP, anti-diabetes agents, hypertension and anti-hypertension agents.
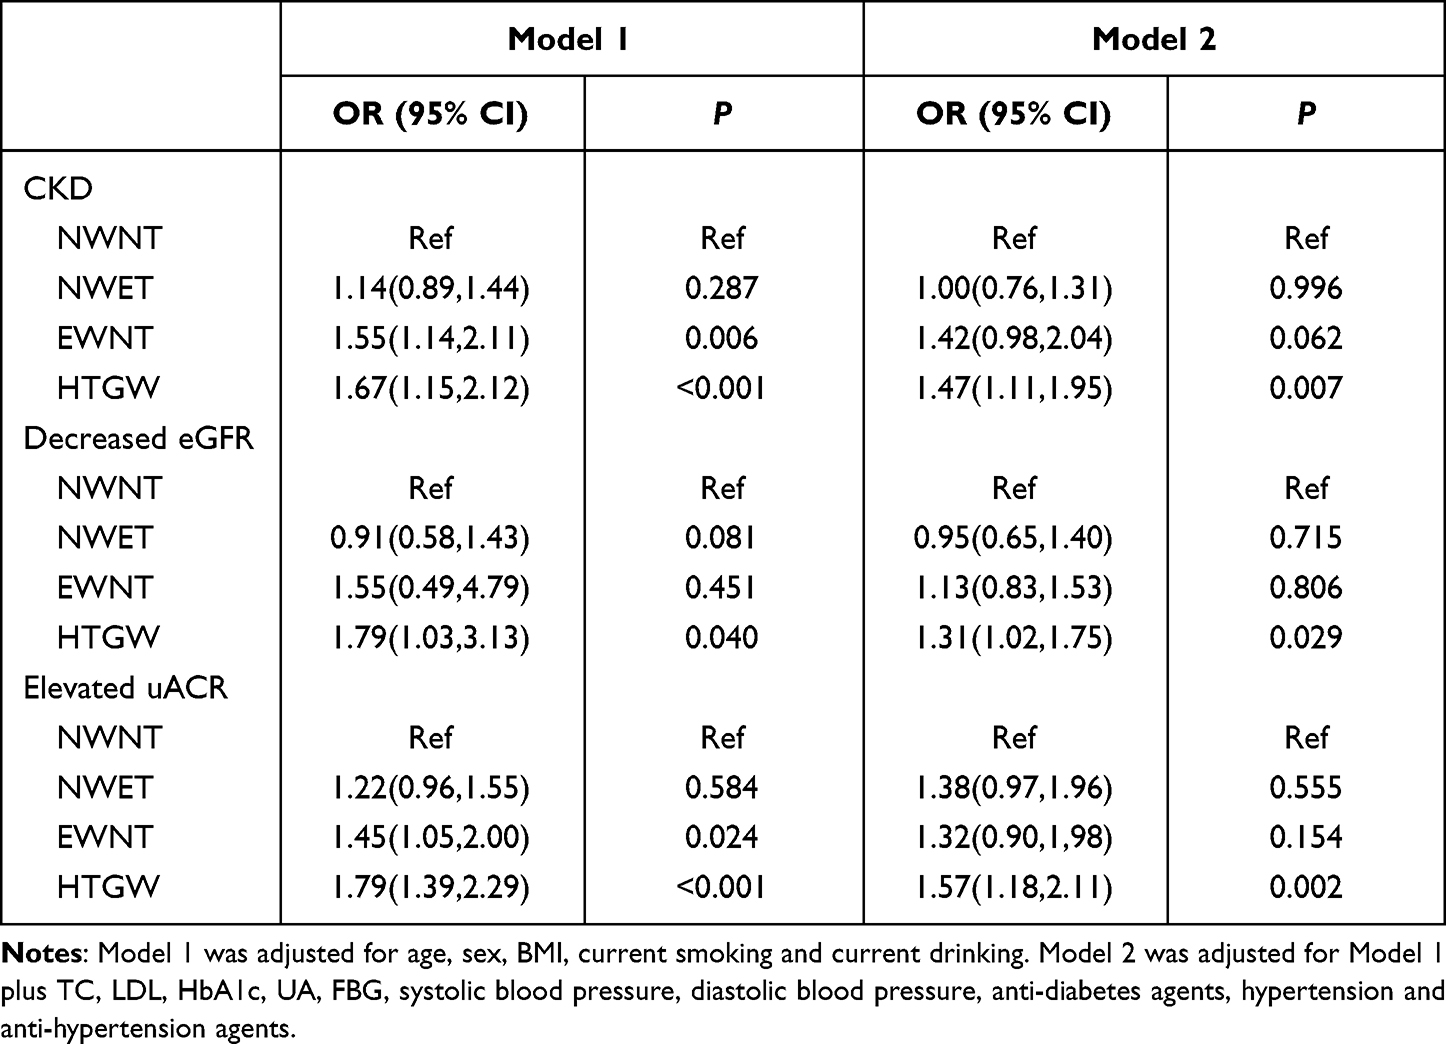 |
Table 2 Odds Ratios for CKD with Triglyceride Waist Phenotypes |
Furthermore, HTGW phenotype was associated with the risk of decreased eGFR (OR 1.31, 95% CI: 1.02, 1.75) and elevated uACR (OR 1.57, 95% CI: 1.18, 2.11), respectively. What’s more, further examined for another definition, there was no significant change in the results (Supplementary Table 2).
Association Between HTGW Phenotype and eGFR Level and uACR Level
In Table 3, compared with the NWNT group, HTGW phenotype was significantly correlated with eGFR level (β 0.07, 95% CI:-3.68, 1.39) and uACR level (β 0.07, 95% CI:0.09, 0.28) after adjusting for all confounders (all P <0.001). These associations were all consistent between men and women (all P <0.05). We further analyzed the association between the HTGW and CKD with the new definition in Supplementary Table 3 and did not significantly change the results.
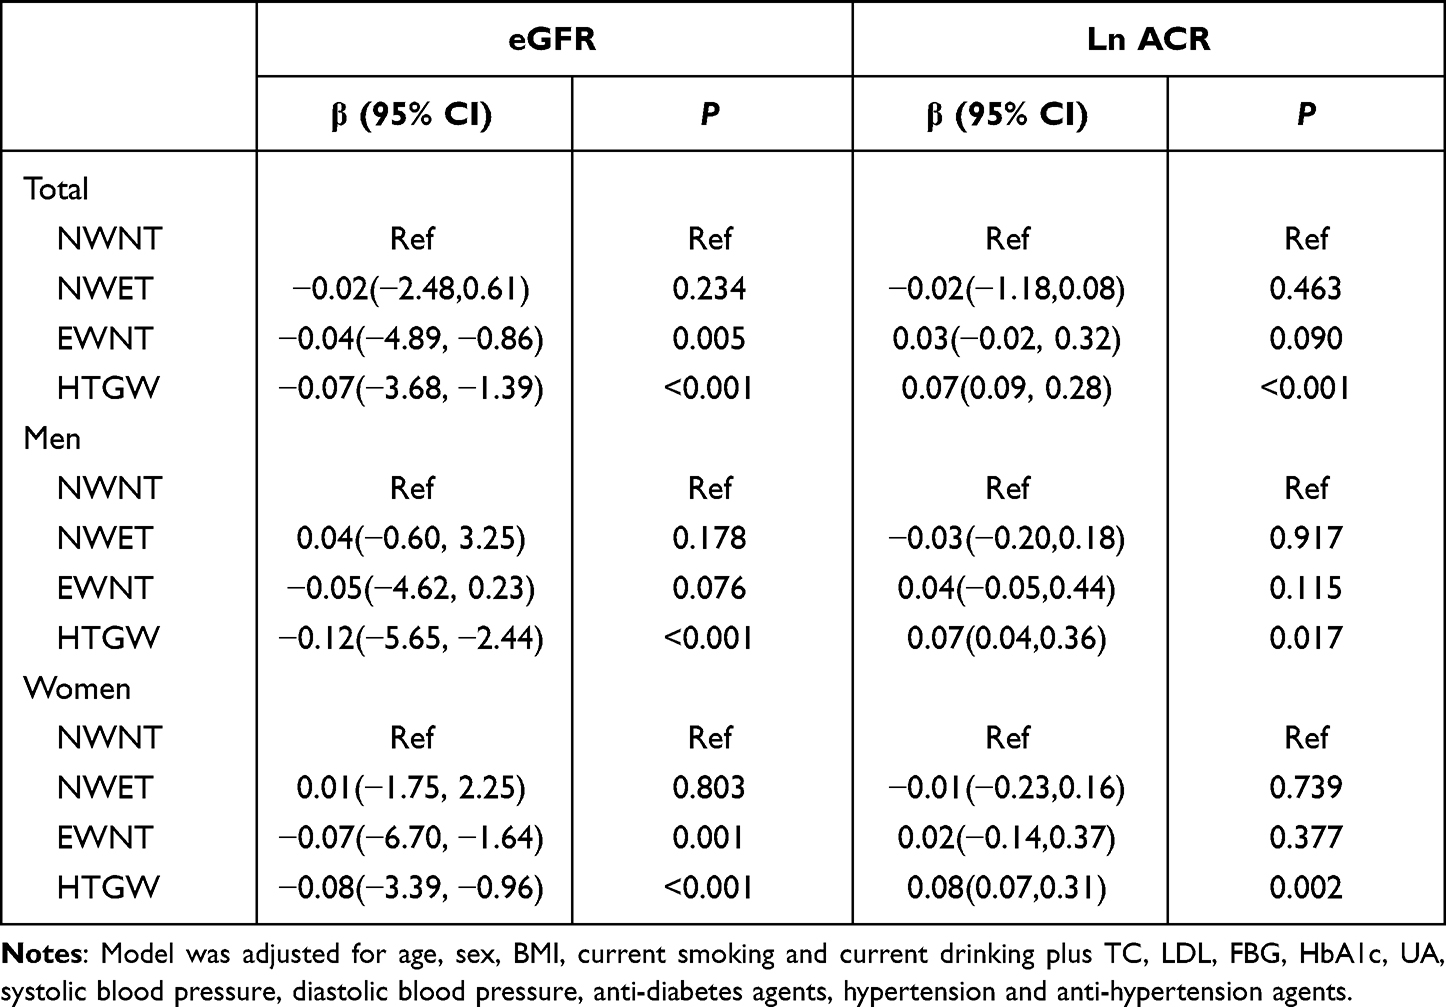 |
Table 3 Associations of Triglyceride Waist Phenotypes with ACR and eGFR |
Association Between HTGW Phenotypes and CKD in Different Subgroups
We further examined the association between triglyceride waist phenotypes and CKD in different subgroups of sex, age, BMI, HbA1c, and presence of hypertension in Table 4. The association between HTGW phenotype and the risk of CKD remained consistent across almost all subgroups excluding the HbA1c <7% subgroup. The strongest positive association between HTGW phenotype and CKD was shown in the subgroup of presence of hypertension (OR 3.46, 95% CI: 1.56, 7.69). No significant interaction effect was observed between the triglyceride waist phenotypes and all subgroup variables in CKD risk and there was no significant change in results with the new definition, as shown in Supplementary Table 4.
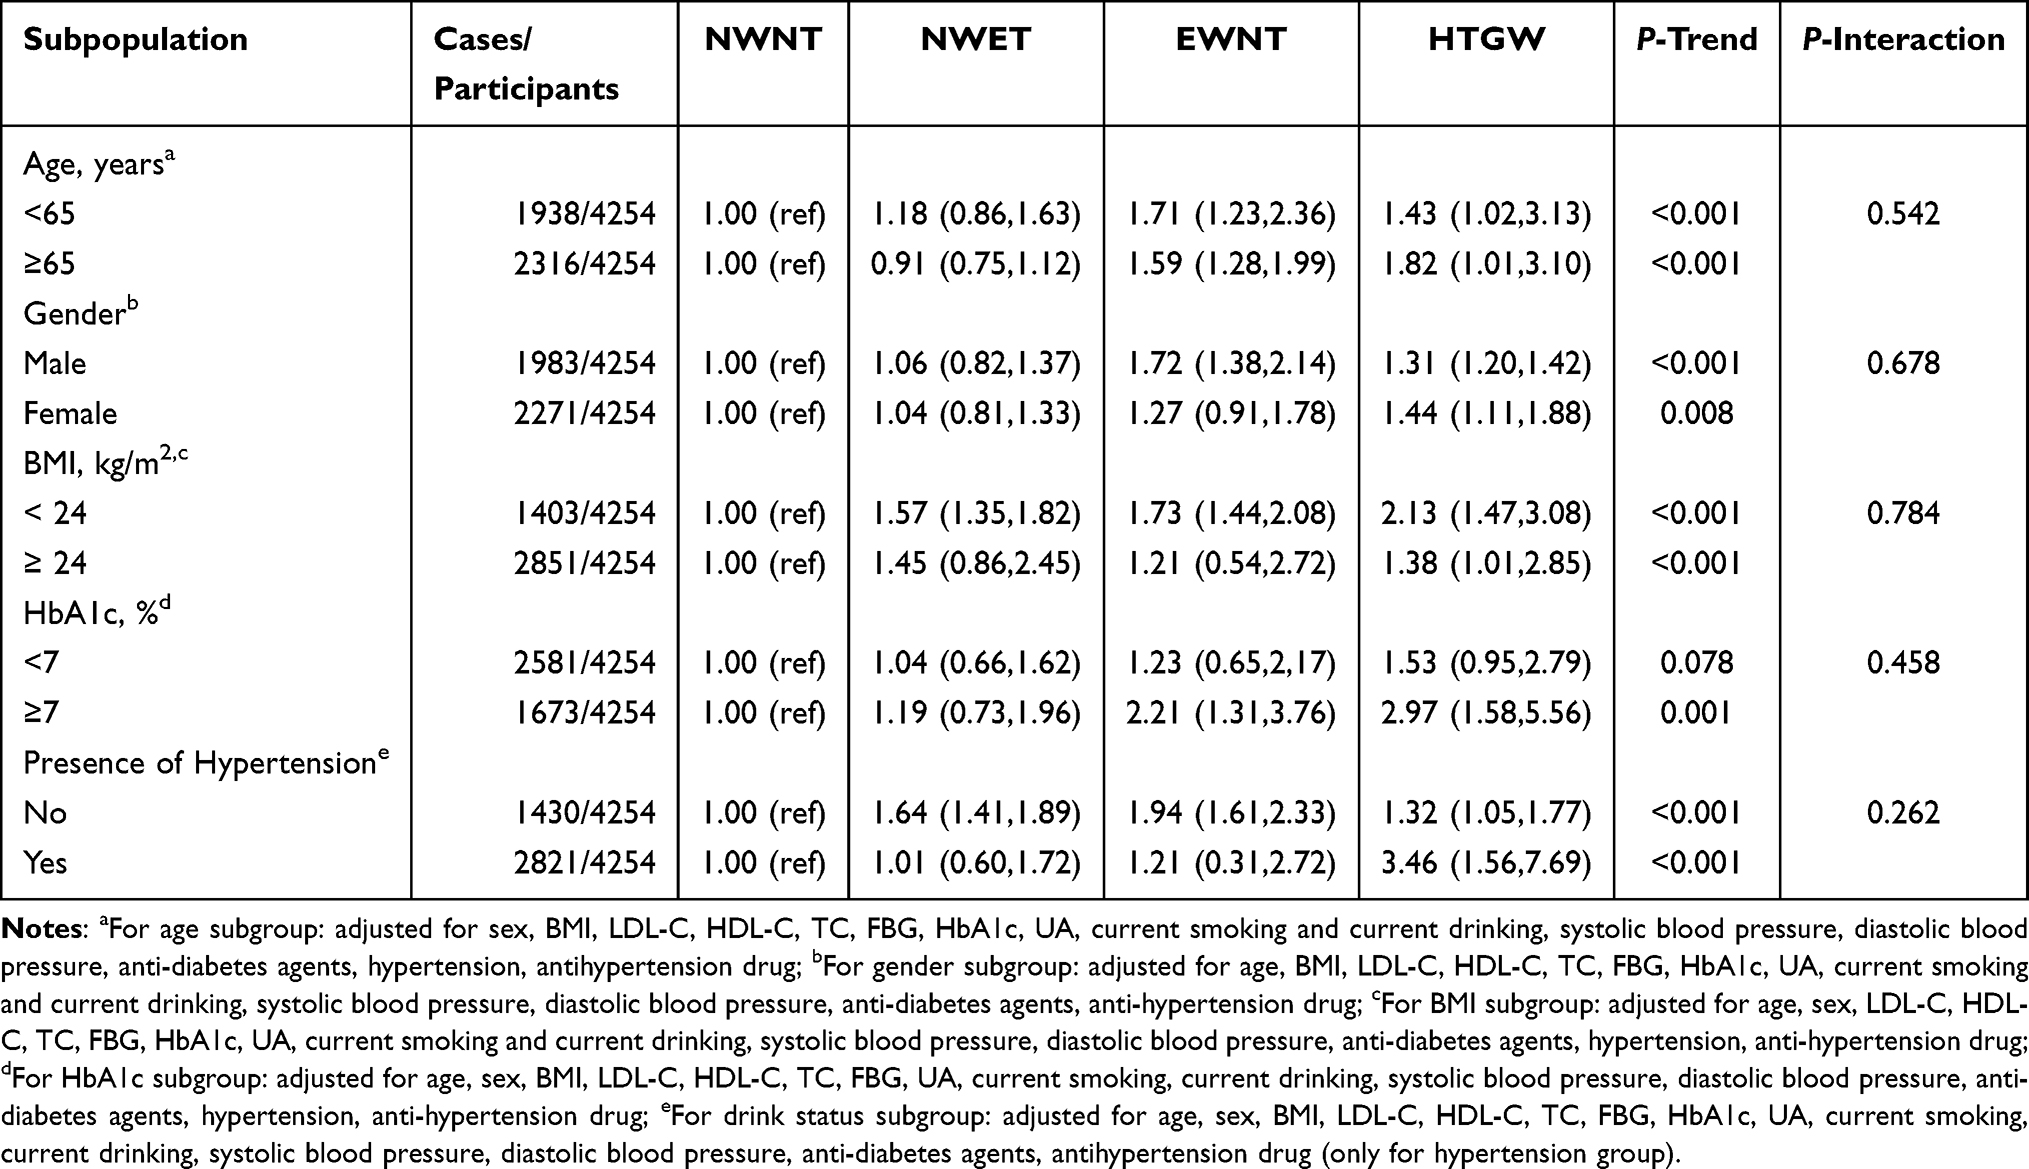 |
Table 4 Odds Ratios for CKD According to Triglyceride Waist Phenotypes by Various Subgroups |
Discussion
In this cross-sectional large population-based study, we explored the association between triglyceride waist phenotypes and the presence of CKD in a Chinese diabetes population. The major finding of the current study was that HTGW phenotype was a crucial risk factor of CKD presence compared with the other three phenotype groups for both sexes in the Chinese diabetes population. Subjects with HTGW phenotype were 1.67-fold more likely to have CKD than those in the NWNT group. The HTGW phenotype was correlated with decreased eGFR and elevated uACR . Furthermore, this positive relationship was independent of age, sex, BMI, history of hypertension, obesity, smoking status and drinking status.
Chronic kidney disease, asymptomatic in the early stage, carries a high risk of developing ESRD and has caused a huge medical burden all over the world. This is especially true in China due to swiftchanges in lifestyle and diabetes prevalence. Our study proves that the CKD prevalence in diabetes patients was 29.3%, with 51.2% in men and 48.8% in women, respectively, which is similar in previous studies.23,39 The prevalence of CKD in the four triglyceride waist phenotype groups were 20.2%, 27.9%, 29.1% and 35.8%, respectively. In diabetes patients, the number of deaths attributed to CKD with diabetes rose by 94%.40 Notably, most of the excess risk of CVD and all-cause mortality for patients with diabetes is related to the presence of CKD.41 In light of the huge social burden and strong correlation between CKD in T2DM patients and cardiovascular diseases, identifying high-risk asymptomatic individuals for CKD is of critical importance. Furthermore, our study explored that the distribution of triglyceride waist phenotype groups varied by gender. Women had a higher prevalence of HTGW and NWET phenotypes than men, probably due to the higher prevalence of central obesity and dyslipidemia in elderly women in China.42
The present study provides evidence that eGFR in the HTGW group was 19 mL/m/1.73 m2 lower than that in the NTNW group. The uACR level was nearly twice as high in the HTGW group compared with the NTNW group (16 mg/g vs 10 mg/g). The participants in the HTGW group were 1.47-fold as likely to have CKD as those with NWNT, independent of age, sex and other potentially confounding factors. Our study further indicated that HTGW phenotype was correlated linearly with high uACR (OR 1.57, 95% CI:1.18, 2.11) and decreased eGFR (OR 1.31, 95% CI: 1.02, 1.75). These findings were consistent with previous studies.22,43,44 In the latest cohort study of Chinese aged 45 years and above, both NTGW and HTGW phenotypes were linked to increasing risk of CKD compared with the NTNW phenotype regardless of different ages, sex, participants with normal weight, non-current drinkers, individuals without DM, and those without hypertension, whereas HTNW was not significantly associated with incident CKD over a 4-year follow-up period.45 The possible explanations for the inconsistency across relevant studies might be the different study designs. First, our study used a cross-sectional analysis, unlike a study that applied longitudinal data. Second, we used a cut-off of 80 cm to define central obesity in women unlike most previous studies,21,26,46 which used 85 cm for women. But we also used other cut-off of high central obesity (high WC was defined as ≥102.0 for males and ≥88.0 cm for females) to analyse the association of HTGW with CKD. The results (in Supplement Tables 1–4) were consistent with our previous outcomes. Indeed, the association of HTGW with CKD is still insufficient to draw an accurate conclusion.22,26 Populations with different races and conditions may explain partly the inconsistency and more studies are required to further explore this association. On the other hand, participants with the HTGW phenotype simultaneously had elevated glucose (FBG, 7.81 mmol/l vs 6.95 mmol/l) and poor glucose control (HBA1c, 7.41% vs 7%) compared with those in the NTNW group. We further found a higher prevalence of obesity and hypertension in the HTGW phenotype group than in the NTNW group (93.1% vs 20.4%, 74.5% vs 50.5%, respectively). According to these results, the insulin resistance is more serious in participants with the HTGW phenotype than those in the NTNW group (HOMA-IR, 3.03 vs 1.53). IR has been confirmed to be strongly associated with a failure of renal function.47 Although some potential mechanisms for the association between IR and CKD remain unclear, the potential mechanisms such as uremic toxin retention, glucose dysregulation, inflammation, acidosis, adiposity, abnormal mineral metabolism and hypertension have been implicated.48 Apart from that evidence has suggested that visceral adiposity, rather than subcutaneous adiposity, was more closely related to metabolic abnormalities, such as insulin resistance, hypertension, and dyslipidemia,49 which were all well-established risk factors of CKD.50 The other probable mechanism of this phenomenon was the association between obesity and fatty kidney disease. The term “fatty kidney”, first named in the literature in 1883,51 suggests that hyperlipidemia is the cause of renal lipid accumulation and nephrotoxicity.52 Obesity is correlated with initial hyperfiltration leading to elevated renal tubular sodium reabsorption and a subsequent gradual decline in the estimated glomerular filtration rate.53 Adipocytes are linked to secrete all components of the RAAS and are upregulated in obesity.53 Therefore, the kidney is not just a victim but rather an active co-conspirator in metabolic syndrome.
The HTGW phenotype has also been widely accepted in risk assessment or prediction of high visceral fat,14 metabolic syndrome,54 and fatty liver.55 All these results support that the HTGW phenotype is a cost-effective screening tool that can be used in clinical practice and an efficient and effective phenotype that can be used in health management.
We further used stratified analyses, the positive association between HTGW phenotype and CKD risk still persisted across almost all subgroups; The strongest association of HTGW phenotype with CKD risk was found in the subgroup of hypertension, indicating the predictive power of HTGW phenotype for CKD might be better for diabetes patients with hypertension. Consistent with other studies, hypertension was the obvious risk factor of CKD in diabetes patients.56
This study included several limitations that need to be considered. First, this is a study of cross-sectional design. It is unable to assess the temporal and causal relationship. Further prospective studies should be designed to test potential mechanisms and these results. Second, many confounding factors such as diet and family history of CKD still may exist, although multiple confounders were adjusted. Third, since the study is not nationally representative, the results obtained need to be carefully summarized. Further studies with a large number of general participants or randomized controlled trials are still required.
Conclusions
In conclusion, a significant positive association of HTGW phenotype with CKD was observed in a Chinese diabetes population. Individuals with T2DM with HTGW were at higher risk to face CKD than those with NWNT. In addition, more research should be carried out to focus on the waist circumference and TG level in clinical screening and intervention. Finally, further large-scale prospective studies for the other potential mechanisms are still essential to conduct.
Data Sharing Statement
The raw data used in the conclusions of this manuscript will be made available by the authors, without undue reservation, to any qualified researcher. Yingli Lu could be contacted to provide that data.
Informed Consent Statement
Informed consent was obtained from all subjects involved in the study.
Acknowledgments
The authors thank all team members and participants in the METAL study.
Author Contributions
All authors made a significant contribution to the work reported, whether that is in the conception, study design, execution, acquisition of data, analysis and interpretation, or in all these areas; took part in drafting, revising or critically reviewing the article; gave final approval of the version to be published; have agreed on the journal to which the article has been submitted; and agree to be accountable for all aspects of the work.
Funding
This study was supported by National Natural Science Foundation of China (91857117); Science and Technology Commission of Shanghai Municipality (18410722300, 19140902400, 20015800400, 20ZR1432500); the Major Science and Technology Innovation Program of Shanghai Municipal Education Commission (2018YFC1705103); Shanghai Municipal Human Resources and Social Security Bureau (2020074); Clinical Research Plan of SHDC (SHDC2020CR4006);Shanghai Municipal Huangpu District Commission (HLQ202004). The funders played no role in the design or conduct of the study, interpretation, analysis, collection, or management of data or in the review, preparation or approval of the article.
Disclosure
The authors in this study declare no conflicts of interest.
References
1. Bikbov B, Purcell CA, Levey AS; Collaboration GBDCKD. Global, regional, and national burden of chronic kidney disease, 1990–2017: a systematic analysis for the Global Burden of Disease Study 2017. Lancet. 2020;395(10225):709–733. doi:10.1016/S0140-6736(20)30045-3
2. Miyata Y, Obata Y, Mochizuki Y, et al. Periodontal disease in patients receiving dialysis. Int J Mol Sci. 2019;20(15):3805. doi:10.3390/ijms20153805
3. Matsushita K, Coresh J, Sang Y, et al. Estimated glomerular filtration rate and albuminuria for prediction of cardiovascular outcomes: a collaborative meta-analysis of individual participant data. Lancet Diabetes Endocrinol. 2015;3(7):514–525. doi:10.1016/S2213-8587(15)00040-6
4. Tonelli M, Wiebe N, Culleton B, et al. Chronic kidney disease and mortality risk: a systematic review. J Am Soc Nephrol. 2006;17(7):2034–2047. doi:10.1681/ASN.2005101085
5. Liyanage T, Ninomiya T, Jha V, et al. Worldwide access to treatment for end-stage kidney disease: a systematic review. Lancet. 2015;385(9981):1975–1982. doi:10.1016/S0140-6736(14)61601-9
6. Stenvinkel P, Zoccali C, Ikizler TA. Obesity in CKD–what should nephrologists know? J Am Soc Nephrol. 2013;24(11):1727–1736. doi:10.1681/ASN.2013040330
7. Yang C, Wang H, Zhao X, et al. CKD in china: evolving spectrum and public health implications. Am J Kidney Dis. 2020;76(2):258–264. doi:10.1053/j.ajkd.2019.05.032
8. Santos A, Magro DO, Evangelista-Poderoso R, Saad MJA. Diabetes, obesity, and insulin resistance in COVID-19: molecular interrelationship and therapeutic implications. Diabetol Metab Syndr. 2021;13(1):23. doi:10.1186/s13098-021-00639-2
9. Ali I. Syndemics at play: chronic kidney disease, diabetes and COVID-19 in Pakistan. Ann Med. 2021;53(1):581–586. doi:10.1080/07853890.2021.1910335
10. Garber AJ, Abrahamson MJ, Barzilay JI, et al. Consensus statement by the American Association of Clinical Endocrinologists and American College of Endocrinology on the comprehensive Type 2 diabetes management algorithm - 2018 executive summary. Endocr Pract. 2018;24(1):91–120. doi:10.4158/CS-2017-0153
11. Lemieux I, Pascot A, Couillard C, et al. Hypertriglyceridemic waist: a marker of the atherogenic metabolic triad (hyperinsulinemia; hyperapolipoprotein B; small, dense LDL) in men? Circulation. 2000;102(2):179–184. doi:10.1161/01.CIR.102.2.179
12. Madero M, Katz R, Murphy R, et al. Comparison between different measures of body fat with kidney function decline and incident CKD. Clin J Am Soc Nephrol. 2017;12(6):893–903. doi:10.2215/CJN.07010716
13. Zhang YB, Sheng LT, Wei W, et al. Association of blood lipid profile with incident chronic kidney disease: a Mendelian randomization study. Atherosclerosis. 2020;300:19–25. doi:10.1016/j.atherosclerosis.2020.03.020
14. Sam S, Haffner S, Davidson MH, et al. Hypertriglyceridemic waist phenotype predicts increased visceral fat in subjects with type 2 diabetes. Diabetes Care. 2009;32(10):1916–1920. doi:10.2337/dc09-0412
15. Lemieux I, Poirier P, Bergeron J, et al. Hypertriglyceridemic waist: a useful screening phenotype in preventive cardiology? Can J Cardiol. 2007;23(Suppl B):23B–31B. doi:10.1016/S0828-282X(07)71007-3
16. Janghorbani M, Salamat MR, Aminorroaya A, Amini M. Utility of the visceral adiposity index and hypertriglyceridemic waist phenotype for predicting incident hypertension. Endocrinol Metab. 2017;32(2):221–229. doi:10.3803/EnM.2017.32.2.221
17. Gomez-Huelgas R, Bernal-Lopez MR, Villalobos A, et al. Hypertriglyceridemic waist: an alternative to the metabolic syndrome? Results of the IMAP Study (multidisciplinary intervention in primary care). Int J Obes. 2011;35(2):292–299.
18. Zhao K, Yang SS, Wang HB, Chen K, Lu ZH, Mu YM. Association between the hypertriglyceridemic waist phenotype and prediabetes in Chinese adults aged 40 years and older. J Diabetes Res. 2018;2018:1031939. doi:10.1155/2018/1031939
19. Fernandez-Garcia JC, Munoz-Garach A, Martinez-Gonzalez MA, et al. Association between lifestyle and hypertriglyceridemic waist phenotype in the PREDIMED-plus study. Obesity. 2020;28(3):537–543. doi:10.1002/oby.22728
20. Xuan Y, Shen Y, Wang S, et al. The association of hypertriglyceridemic waist phenotype with hypertension: a cross-sectional study in a Chinese middle aged-old population. J Clin Hypertens. 2022;24(2):191–199. doi:10.1111/jch.14424
21. Chen S, Guo X, Dong S, et al. Association between the hypertriglyceridemic waist phenotype and hyperuricemia: a cross-sectional study. Clin Rheumatol. 2017;36(5):1111–1119. doi:10.1007/s10067-017-3559-z
22. Li Y, Zhou C, Shao X, et al. Hypertriglyceridemic waist phenotype and chronic kidney disease in a Chinese population aged 40 years and older. PLoS One. 2014;9(3):e92322. doi:10.1371/journal.pone.0092322
23. Zeng J, Liu M, Wu L, et al. The association of hypertriglyceridemic waist phenotype with chronic kidney disease and its sex difference: a cross-sectional study in an urban Chinese elderly population. Int J Environ Res Public Health. 2016;13(12):1233. doi:10.3390/ijerph13121233
24. Zhou C, Li Y, Shao X, Zou H. Identification of chronic kidney disease risk in relatively lean Southern Chinese: the hypertriglyceridemic waist phenotype vs. anthropometric indexes. Eat Weight Disord. 2018;23(6):885–892. doi:10.1007/s40519-017-0476-8
25. Ramezankhani A, Azizi F, Ghanbarian A, Parizadeh D, Hadaegh F. The hypertriglyceridemic waist and waist-to-height ratio phenotypes and chronic kidney disease: cross-sectional and prospective investigations. Obes Res Clin Pract. 2017;11(5):585–596. doi:10.1016/j.orcp.2016.11.003
26. Huang J, Zhou C, Li Y, et al. Visceral adiposity index, hypertriglyceridemic waist phenotype and chronic kidney disease in a southern Chinese population: a cross-sectional study. Int Urol Nephrol. 2015;47(8):1387–1396. doi:10.1007/s11255-015-1040-y
27. Wan H, Chen S, Cai Y, et al. Lead exposure and its association with cardiovascular disease and diabetic kidney disease in middle-aged and elderly diabetic patients. Int J Hyg Environ Health. 2021;231:113663. doi:10.1016/j.ijheh.2020.113663
28. Chen Y, Zhang W, Wang N, et al. Thyroid parameters and kidney disorder in Type 2 diabetes: results from the METAL study. J Diabetes Res. 2020;2020:4798947. doi:10.1155/2020/4798947
29. Wang N, Chen Y, Ning Z, et al. Exposure to famine in early life and nonalcoholic fatty liver disease in adulthood. J Clin Endocrinol Metab. 2016;101(5):2218–2225. doi:10.1210/jc.2016-1076
30. Chen Y, Chen Y, Xia F, et al. A higher ratio of estradiol to testosterone is associated with autoimmune thyroid disease in males. Thyroid. 2017;27(7):960–966. doi:10.1089/thy.2016.0661
31. Zhou BF; Cooperative Meta-Analysis Group of the Working Group on Obesity in C. Predictive values of body mass index and waist circumference for risk factors of certain related diseases in Chinese adults–study on optimal cut-off points of body mass index and waist circumference in Chinese adults. Biomed Environ Sci. 2002;15(1):83–96.
32. Matthews DR, Hosker JP, Rudenski AS, Naylor BA, Treacher DF, Turner RC. Homeostasis model assessment: insulin resistance and beta-cell function from fasting plasma glucose and insulin concentrations in man. Diabetologia. 1985;28(7):412–419. doi:10.1007/BF00280883
33. Ji H, Zhang H, Xiong J, et al. eGFRs from Asian-modified CKD-EPI and Chinese-modified CKD-EPI equations were associated better with hypertensive target organ damage in the community-dwelling elderly Chinese: the Northern Shanghai Study. Clin Interv Aging. 2017;12:1297–1308. doi:10.2147/CIA.S141102
34. Hashimoto Y, Tanaka M, Okada H, et al. Metabolically healthy obesity and risk of incident CKD. Clin J Am Soc Nephrol. 2015;10(4):578–583. doi:10.2215/CJN.08980914
35. Ko GT, Liu KH, So WY, et al. Cutoff values for central obesity in Chinese based on mesenteric fat thickness. Clin Nutr. 2009;28(6):679–683. doi:10.1016/j.clnu.2009.05.017
36. Zhu D; Society CD. Guideline for the prevention and treatment of type 2 diabetes mellitus in China (2020 edition); 2021.
37. Chen S, Guo X, Yu S, Sun G, Li Z, Sun Y. Association between the hypertriglyceridemic waist phenotype, prediabetes, and diabetes mellitus in rural Chinese population: a cross-sectional study. Int J Environ Res Public Health. 2016;13(4):368. doi:10.3390/ijerph13040368
38. Afonso C, Sousa-Santos AR, Santos A, et al. Frailty status is related to general and abdominal obesity in older adults. Nutr Res. 2021;85:21–30. doi:10.1016/j.nutres.2020.10.009
39. Valencia WM, Florez H. How to prevent the microvascular complications of type 2 diabetes beyond glucose control. BMJ. 2017;356:i6505. doi:10.1136/bmj.i6505
40. Navaneethan SD, Schold JD, Jolly SE, Arrigain S, Winkelmayer WC, Nally JV
41. Afkarian M, Sachs MC, Kestenbaum B, et al. Kidney disease and increased mortality risk in type 2 diabetes. J Am Soc Nephrol. 2013;24(2):302–308. doi:10.1681/ASN.2012070718
42. Du P, Zhang B, Wang HJ, et al. The prevalence and secular trends of abdominal obesity among Chinese adults, 1993–2011. Ann Epidemiol. 2015;25(10):797–799. doi:10.1016/j.annepidem.2015.06.082
43. Qiu Y, Zhao Q, Wang N, et al. Association of hypertriglyceridemic waist phenotype with renal function impairment: a cross-sectional study in a population of Chinese adults. Nutr Metab. 2020;17:63. doi:10.1186/s12986-020-00483-7
44. Su W, Wang J, Mu Y. Association between hypertriglyceridemic waist phenotype and increased urinary albumin-creatinine ratio in Chinese adults: the REACTION Study. Diabetes Metab Syndr Obes. 2020;13:2965–2974. doi:10.2147/DMSO.S257736
45. Chen D, Sun H, Lu C, Chen W, Guo VY. The association between hypertriglyceridemic-waist phenotype and chronic kidney disease: a cohort study and meta-analysis. Sci Rep. 2022;12(1):1935. doi:10.1038/s41598-022-05806-7
46. Cunha de Oliveira C, Carneiro Roriz AK, Eickemberg M, Barreto Medeiros JM, Barbosa Ramos L. Hypertriglyceridemic waist phenotype: association with metabolic disorders and visceral fat in adults. Nutr Hosp. 2014;30(1):25–31. doi:10.3305/nh.2014.30.1.7411
47. Kobayashi S, Maesato K, Moriya H, Ohtake T, Ikeda T. Insulin resistance in patients with chronic kidney disease. Am J Kidney Dis. 2005;45(2):275–280. doi:10.1053/j.ajkd.2004.09.034
48. Koppe L, Pelletier CC, Alix PM, et al. Insulin resistance in chronic kidney disease: new lessons from experimental models. Nephrol Dial Transpl. 2014;29(9):1666–1674. doi:10.1093/ndt/gft435
49. Fox CS, Massaro JM, Hoffmann U, et al. Abdominal visceral and subcutaneous adipose tissue compartments: association with metabolic risk factors in the Framingham Heart Study. Circulation. 2007;116(1):39–48. doi:10.1161/CIRCULATIONAHA.106.675355
50. Zhang X, Lerman LO. The metabolic syndrome and chronic kidney disease. Transl Res. 2017;183:14–25. doi:10.1016/j.trsl.2016.12.004
51. Mende C, Einhorn D. Fatty kidney disease: the importance of ectopic fat deposition and the potential value of imaging. J Diabetes. 2022;14(1):73–78. doi:10.1111/1753-0407.13232
52. Rickards E. Remarks on the fatty transformation of the kidney. Br Med J. 1883;2(1175):2–3. doi:10.1136/bmj.2.1175.2
53. Hall J, Juncos L, Wang Z, Hall M, Do Carmo J, da Silva A. Obesity, hypertension, and chronic kidney disease. Int J Nephrol Renovasc Dis. 2014;7:75–88. doi:10.2147/IJNRD.S39739
54. Liu PJ, Lou HP, Zhu YN. Screening for metabolic syndrome using an integrated continuous index consisting of waist circumference and triglyceride: a Preliminary Cross-sectional Study. Diabetes Metab Syndr Obes. 2020;13:2899–2907. doi:10.2147/DMSO.S259770
55. Zhou M, Li F, Tang H, et al. The hypertriglyceridemic waist phenotype is associated with fatty liver and glycometabolic profiles in overweight and obese adults: a cross-sectional study. Sci Rep. 2022;12(1):2410. doi:10.1038/s41598-021-00825-2
56. Anders HJ, Huber TB, Isermann B, Schiffer M. CKD in diabetes: diabetic kidney disease versus nondiabetic kidney disease. Nat Rev Nephrol. 2018;14(6):361–377. doi:10.1038/s41581-018-0001-y
 © 2022 The Author(s). This work is published and licensed by Dove Medical Press Limited. The full terms of this license are available at https://www.dovepress.com/terms.php and incorporate the Creative Commons Attribution - Non Commercial (unported, v3.0) License.
By accessing the work you hereby accept the Terms. Non-commercial uses of the work are permitted without any further permission from Dove Medical Press Limited, provided the work is properly attributed. For permission for commercial use of this work, please see paragraphs 4.2 and 5 of our Terms.
© 2022 The Author(s). This work is published and licensed by Dove Medical Press Limited. The full terms of this license are available at https://www.dovepress.com/terms.php and incorporate the Creative Commons Attribution - Non Commercial (unported, v3.0) License.
By accessing the work you hereby accept the Terms. Non-commercial uses of the work are permitted without any further permission from Dove Medical Press Limited, provided the work is properly attributed. For permission for commercial use of this work, please see paragraphs 4.2 and 5 of our Terms.