")
Back to Journals » Clinical Ophthalmology » Volume 12
The assessment of autofluorescence of the crystalline lens in diabetic patients and healthy controls: can it be used as a screening test?
Authors Pehlivanoğlu S , Acar N , Albayrak S, Karakaya M, Ofluoğlu A
Received 8 February 2018
Accepted for publication 17 April 2018
Published 27 June 2018 Volume 2018:12 Pages 1163—1170
DOI https://doi.org/10.2147/OPTH.S164960
Checked for plagiarism Yes
Review by Single anonymous peer review
Peer reviewer comments 2
Editor who approved publication: Dr Scott Fraser
Seren Pehlivanoğlu,1 Nur Acar,2 Sinan Albayrak,1 Muharrem Karakaya,1 Ali Ofluoğlu1
1Department of Ophthalmology, School of Medicine, Yeni Yüzyıl University, Istanbul, Turkey; 2Department of Ophthalmology, School of Medicine, Acibadem University, Istanbul, Turkey
Background: Our purpose was to demonstrate if measuring lens autofluorescence (AF) with a scanning confocal biomicroscope may be used to identify subjects with undiagnosed type II diabetes mellitus (DM), and hence, for it to be used as a marker for the severity of diabetic retinopathy in diabetic patients.
Patients and methods: In this cross-sectional, comparative study, lens AF was measured with scanning confocal lens fluorescence biomicroscope in diabetic and healthy groups. Full ophthalmological examination was performed. Blood tests of fasting plasma glucose, and glycosylated hemoglobin were also analyzed. The correlation between lens AF results and blood tests was evaluated in both groups. The cutoff value for the diagnosis of DM using lens AF was investigated.
Results: The study included 191 subjects with a mean age of 52.09±6.75 years. One hundred and seven (56.0%) subjects were female, and 84 (44.0%) were male. Eighty-two (42.9%) patients had type II DM, and 109 (57.1%) subjects self-reported as normal. The fluorescence ratio (FR) values ranged from 0.09 to 0.46 (0.23±0.06) in the total group. Mean FR measurements of diabetic subjects were significantly higher (0.27±0.06) than those without DM (0.20±0.05), (p=0.001). A statistically significant correlation was found between glycosylated hemoglobin, fasting plasma glucose, and FR. The cutoff point for the FR according to the presence of DM was found to be 0.24 and above (p=0.001), with a sensitivity of 71.95% and a specificity of 80.73%.
Conclusion: Measuring AF of human lens as an indirect evidence of increased advanced glycaton end products may helpful in detecting impaired glucose metabolism. Our results show highly significant correlation between possibility of DM and FR.
Keywords: lens autofluorescence, diabetes, diabetic retinopathy, HgA1c, fasting plasma glucose, screening
Introduction
Diabetes mellitus (DM) is a chronic disease that leads to blindness, kidney failure, stroke, lower limb amputation, and also increased risk of heart attacks, causing a significant deterioration in the quality of life. The World Health Organization predicts that 350 million people will be suffering from type II DM by 2030.1,2 Thus, improved quality of life and increase in life span may be possible by early detection of DM. Today’s most current screening test for DM is fasting plasma glucose (FPG) and glycosylated hemoglobin (HbA1c) measurement. When necessary, the 75 g oral glucose tolerance test is used.3,4
Recently, there is a new instrument for measuring the autofluorescence (AF) of the lens which may have a potential to be a noninvasive screening method of DM. AF is the natural emission of light by biological structures when they have absorbed light. There are a large number of ocular endogenous fluorophores in the cornea, the crystalline lens, and the retinal pigment epithelium. The fluorescence of the lens is increased with accumulation of advanced glycation end products (AGEs).5 AGEs occur as a result of nonenzymatic irreversible reaction of reducing sugars with free amino groups of proteins, and this formation is accelerated when there is increased concentration of circulating glucose, AGE precursors, and oxidative stress.6 AGE accumulation shows the severity and duration of dysglycemia in tissue. Measurement of lens AF by scanning confocal biomicroscope is a new fast and noninvasive technique. The instrument can report either green fluorescence intensity or the ratio of green fluorescence to scattered light via using lens AF. Increased lens AF may be one of the early indicators of diabetic involvement before any visible retinopathy occurs.
Our purpose in this study was to demonstrate if measuring lens AF with this new scanning confocal biomicroscope may be used to identify subjects with undiagnosed type II DM, and to assess if this could be used as a marker for the severity of diabetic retinopathy (DRP) in diabetic patients.
Patients and methods
Participants
This cross-sectional study included adult volunteers who were recruited between March and June 2017 from the Department of Ophthalmology, Yeni Yüzyil University, Istanbul, Turkey. A detailed history including data on demographics, systemic, and ocular history was noted for all patients. Patients with type I DM and other systemic diseases such as chronic kidney disease, hepatic disorders, and polycystic ovary syndrome which affected lens AF except type II DM were excluded. Type II DM and self-reported healthy subjects were included. All subjects’ lens AF was measured by scanning confocal biomicroscope, followed by a complete ophthalmological examination, including visual acuity testing, slit-lamp biomicroscopy, intraocular pressure measurement (Airpuff tonometer), and detailed fundus examination after pupil dilation with 1% topical tropicamide (Tropamid Fort 1%; Bilim Pharmaceuticals, Istanbul, Turkey). Patients who were pseudophakic and who had a fluorescence angiogram within 6 months were excluded. Patients who had dense cataractous changes and any nuclear opacities in the lens according to “Lens Opacities Classification System III” were also excluded since these findings may affect results of AF testing.7 Blood tests were performed for the measurement of FPG and HbA1c in every subject. Family history of DM was asked and noted in every subject in this study. Written informed consent was obtained from all subjects. The study was approved by the ethics committee of the Yeni Yüzyil University and followed the tenets of the Declaration of Helsinki.
Scanning confocal biomicroscope
The lens fluorescence biomicroscope optical system (ClearPathDS-120; Freedom Meditech, Inc, San Diego, CA, USA) consists of a blue (465 nm) LED excitation light with a 430–470 nm band-pass filter, source and collection focusing optics, motor-driven filter wheel with 25% neutral density (scatter), and long-pass (fluorescent emission 500–1,650 nm) filters and a silicone photomultiplier light detector. In addition, the system automatically aligns its optical axis before a measurement is taken. The system has 3 infrared LED lights to illuminate the eye, and a video camera. A fluorescence reference target is positioned in the optical path during the self-test procedure at start-up. The instrument can report either green fluorescence intensity or the ratio of green fluorescence to scattered light. The measurement of fluorescence ratio (FR) is given as a numerical value. A FR of 0.07–0.33 approximates the range of values that should be encountered in the population of 127 patients with an age range of 21–70 years, as seen in a previous study in which over 95% of test subjects generated a FR of 0.27 or below.8 Also, this measurement result was plotted as a fluorescence profile against the age of the patients ranging between 10 and 80 years, listed for every decade. The fluorescence profile is shown in three groups, as 50%, 80%, and 95% of predictive intervals. Each measurement of FR is marked in the profile, which can be in between the lines of these 3 predictive intervals (Figure 1).
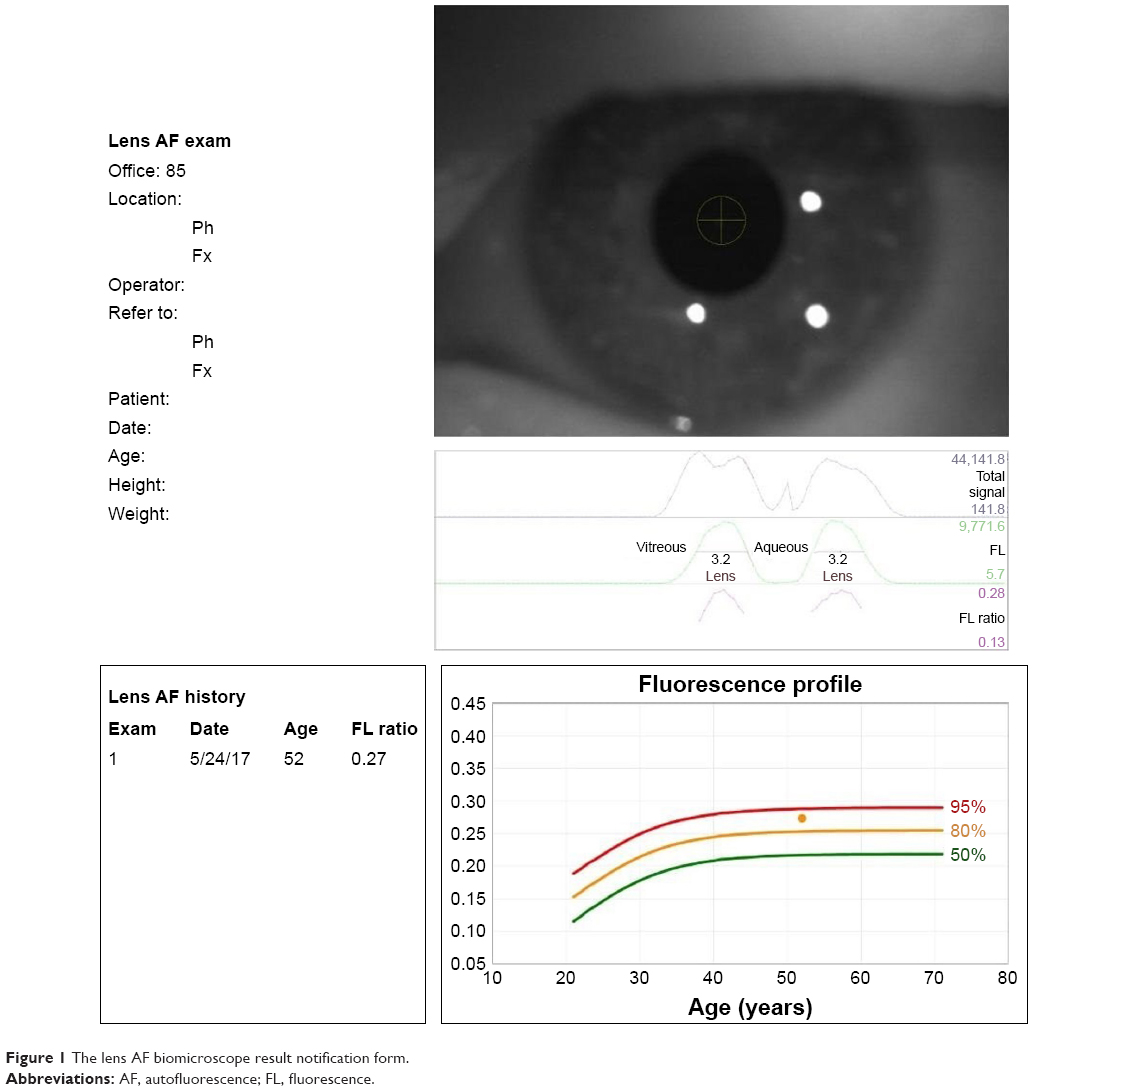 | Figure 1 The lens AF biomicroscope result notification form. |
According to the fluorescence profile of all subjects in the study, results were divided into 3 levels as determined below for comparisons between diabetic and healthy groups:
- Level I: results plotted under the 50% line.
- Level II: results plotted between the 50% and 80% (including 50% and 80%) lines.
- Level III: results plotted above 80% line.
Statistical analysis
Statistical Investigations NCSS 2007 (Kaysville, UT, USA) program was used for statistical analysis. Student’s t-test was used for 2 groups of descriptive statistical methods (mean, SD, median, frequency, rate, minimum, and maximum) as well as normal distribution of quantitative data. The Kruskal–Wallis test was used in the comparison of the groups with no normal distribution, and the Mann–Whitney U-test was used to determine the group which caused the difference. Pearson χ2 test was used for comparison of qualitative data. Pearson correlation and Spearman’s correlation analyses were used to evaluate intervariable relationships. Also, analysis of variance was used to determine impact of family history. Diagnostic screening tests (sensitivity, specificity, positive predictive value, negative predictive value) and receiver operating characteristic curve analyses were used to determine the cutoff for the FR. Significance was evaluated at p<0.01 and p<0.05 levels.
Sensitivity: probability that the test result will be positive when the disease is present (true positive rate, expressed as a percentage). Specificity: probability that the test result will be negative when the disease is not present (true negative rate, expressed as a percentage). Positive predictive value: probability that the disease is present when the test is positive (expressed as a percentage). Negative predictive value: probability that the disease is not present, when the test is negative (expressed as a percentage).
Results
The study included 191 subjects consisting of 107 (56.0%) females, and 84 (44.0%) males. Gender distribution of females and males in the diabetic and healthy groups was 51 (62.2%), 31 (37.8%) and 56 (51.4%), 53 (48.6%), respectively. The mean age in diabetic and healthy groups was 52.39±5.86 (41–70 years) and 52.40±7.78 (41–69 years), respectively. There was no significant difference in gender distribution and age (p=0.136, p=0.99 respectively). Eighty-two (42.9%) patients were physician-diagnosed diabetics. One hundred nine (57.1%) subjects self-reported as normal. In 82 diabetic patients, the mean duration of DM was 7.58±5.52 years. Thirty-four (41.4%) of the diabetic patients were using insulin, whereas the rest of the patients were using oral antidiabetic drugs. Fifty-seven (69.51%) diabetic patients had normal fundus findings, while 14 (17.07%) diabetic patients had background DRP (BDR) and 11 (13.41%) had proliferative DRP (PDR). Fundoscopic findings were normal in healthy group. All demographic data and mean HbA1c, FPG, and body mass index (BMI) of patients in both groups are listed in Table 1. The mean HbA1c, FPG, and BMI were found to be significantly higher in diabetic patients. Mean BMI of both groups together was 29.85±5.46 (19.1–49.9) kg/m2.
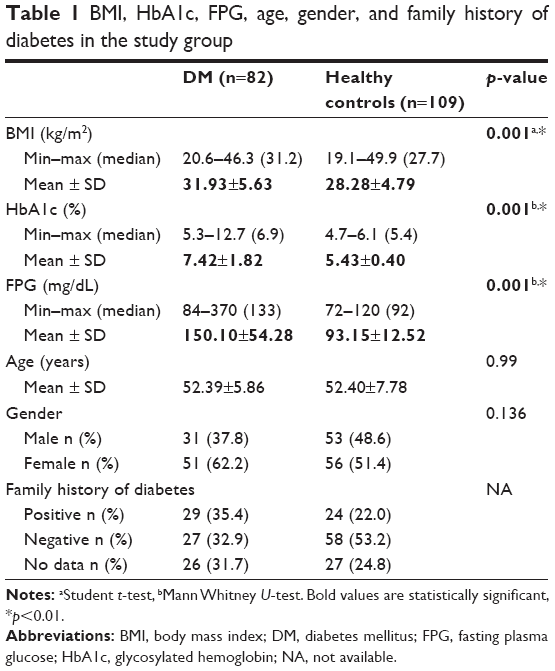 | Table 1 BMI, HbA1c, FPG, age, gender, and family history of diabetes in the study group |
The FR levels ranged from 0.09 to 0.46 (0.23±0.06) in the total group. FR level was I in 45.5% (n=87), II in 25.7% (n=49), and III in 28.8% (n=55) of subjects. Thus, more than half of the study participants showed higher prediction intervals with higher FR. Mean FR measurements of diabetic subjects were higher (0.27±0.06) than those without diabetes (0.20±0.05), which was statistically significant (p=0.001). Mean FR was found to be positively related with increasing age of subjects in both groups (r=0.205; p=0.004). Also, there was a positive correlation between the duration of diabetes and FR (r=0.469; p=0.001).
The correlation between BMI, HbA1c, FPG and FR was evaluated. No statistically significant correlation between BMI values of the subjects and FR measurements was found (p=0.110). Statistically significant correlations were found between HbA1c, FPG values, and FR (Table 2).
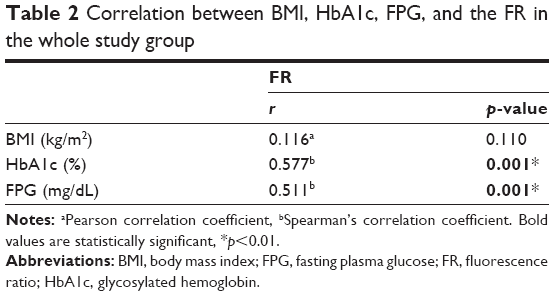 | Table 2 Correlation between BMI, HbA1c, FPG, and the FR in the whole study group |
In this study group, family history of DM was recorded in 138 patients (70.7% of whole group). Fifty-three (38.4%) subjects had positive family history of DM, and 29 (54.7%) of them were in DM group, while 24 (45.3%) were in the healthy group. The correlation between FR and positive family history in diabetic and healthy groups was analyzed with one-way analysis of variance (Table 3). Mean FR values were 0.27±0.06 in the diabetic group with positive family history and 0.24±0.06 in diabetic group without positive family history (p=0.676). In the healthy group, mean FR values were, 0.22±0.04 and 0.20±0.05 in subjects with and without positive family history, respectively (p=0.578). Although mean FR values tended to be higher in cases with positive family history compared to cases without positive family history both in diabetic and healthy groups, the differences were not statistically significant. Mean FR values with and without positive family history were significantly higher in diabetic groups compared with healthy groups (p=0.018, p=0.002, respectively) as expected. However, mean FR values in healthy cases with positive family history and in diabetic cases without positive family history were not statistically different (p=0.780).
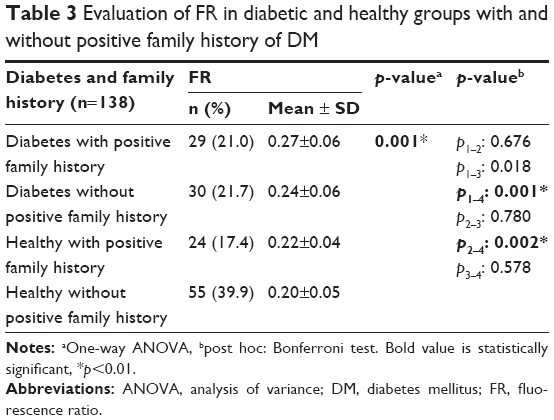 | Table 3 Evaluation of FR in diabetic and healthy groups with and without positive family history of DM |
Additionally, FR measurements were compared in the diabetic group according to the presence and severity of DRP. As a result of the binary comparisons, mean FR measurements of diabetic cases with BDR and PDR were significantly higher than those diabetic cases without any DRP (p<0.01 for both, Table 4). There was no statistically significant difference in mean FR measurements in cases with BDR and PDR (p=0.365, Table 4). The mean HbA1c value was 8.96%±1.87% in the cases with BDR, whereas it was 8.97%±1.61% in PDR. There was also no statistically significant difference in mean HbA1c measurements in cases with BDR and PDR (p=0.934).
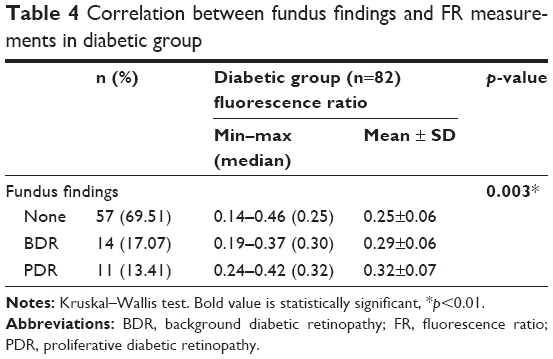 | Table 4 Correlation between fundus findings and FR measurements in diabetic group |
Determination of cutoff for FR according to the presence of diabetes
Mean FR measurements of diabetic subjects were higher (0.27±0.06) than in those without diabetes (0.20±0.05), which was statistically significant (p=0.001). From this point of view, the cutoff point for the FR to diagnose the presence of DM was evaluated, and a receiver operating characteristic curve analysis with diagnostic screening tests (FPG and HbA1c) was used to detect this value. The cutoff point for the FR according to the presence of DM was found to be 0.24 and above (p=0.001). Table 5 shows the sensitivity, the specificity, and the positive and the negative predictive values. In the obtained receiver operating characteristic curve, the standard error was 3.2% (Figure 2).
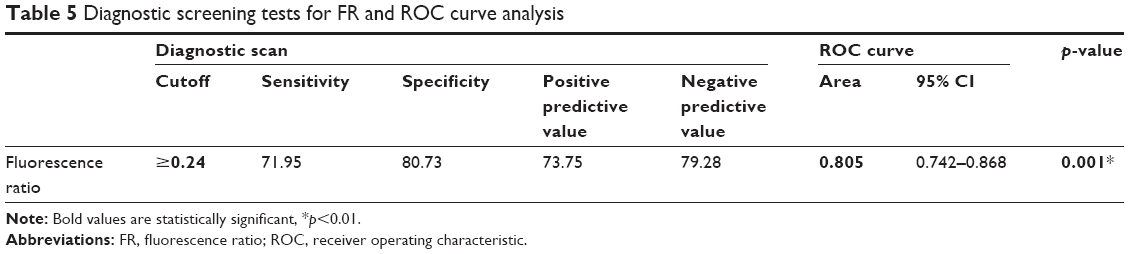 | Table 5 Diagnostic screening tests for FR and ROC curve analysis |
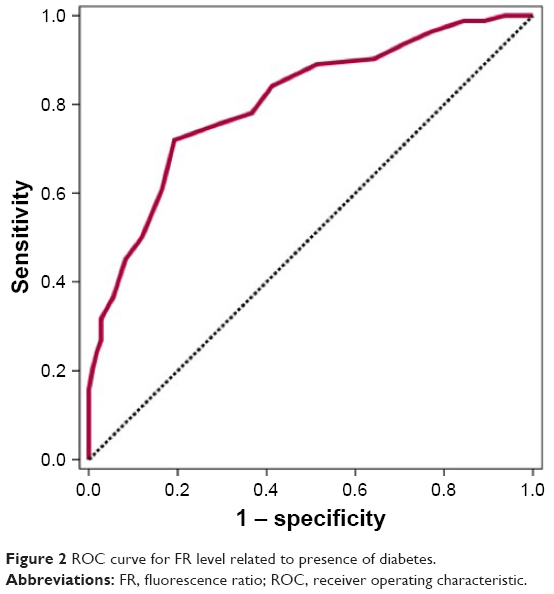 | Figure 2 ROC curve for FR level related to presence of diabetes. |
A statistically significant correlation was found between the presence of diabetes and the cutoff value of FR being ≥0.24 (p=0.001) (odds ratio: 10.74 [95% CI: 5.46–21.16]). In cases with an FR measurement of 0.24 or more, we can say that the risk of having DM is increased 10.74 fold (p=0.001).
Discussion
In hyperglycemia, excess glucose causes increased AGEs. These products lead to progressive damage to heart, eye, kidney, and nerves. The accumulation of AGEs leads to increased AF in the natural lens of the eye that can be measured, and so may serve as a method of early detection and help in the monitoring of diabetic patients.9,10
Measuring of the lens AF has been assessed in a couple of studies.11–13 The limitations of the measurement of lens AF were mainly technical difficulties. However, recently, a new confocal biomicroscope is available to measure lens AF in a fast, noninvasive, and reproducible manner.8,14 The range of FRs which are used in this instrument was reported to change between 0.07 and 0.33 in 127 healthy subjects aged between 21 and 70.7 Lens AF was found to increase with age.9–11,13 In our study, we also observed a significant positive correlation between lens AF and the age of subjects with and without DM, showing that lens AF is increased with aging. However, in our study group, subjects with or without DM were age-matched to avoid its possible effect on lens AF measurement results.
Lens AF is mainly related to AGE formation, and these glycation end product levels increase in hyperglycemia conditions. Thus, accelerated accumulation of AGEs enhances lens AF.6,12,14–16 Currently, FPG and HbA1c are principal tests for both diagnosis and screening of DM.15 In our study, both of these values were higher in diabetic patients compared to the healthy group. Kjer et al17 demonstrated the relation between lens AF and HbA1c measurements. We found that diagnostic tests of diabetes were correlated with lens AF levels significantly. Cahn et al14 have also reported this correlation, and suggested that lens AF was sufficient for discriminating subjects with DM and healthy group, comparing their AF results with sensitivity and specificity of HbA1c, FPG tests in literature. They did not perform any blood tests in their own group. The main difference of our study is that we performed FPG and HbA1c blood tests in all subjects with and without diabetes to compare the results with our FR measurements. Mean BMI values were found to be high in our study group; however, there was no statistically significant correlation between BMI and FR measurements. Normally, BMI is not an essential diagnostic parameter in DM and can be an indirect indicator of patients who are susceptible to DM due to obesity. Our finding of BMI not being correlated with FR levels in patients with and without DM, unlike DM screening blood tests, may suggest that lens AF ratio assays may show specificity for DM screening.
In our study, DM or healthy subjects with positive family history of DM tended to have higher mean FR values compared to those without positive family history. However, the differences were not statistically significant. On the other hand, mean FR values in healthy cases with positive family history were similar to mean FR values in diabetic cases without positive family history with no statistical difference. This finding may suggest that positive family history may be important as a risk factor in the development of DM. Also, the presence of a high FR value in a healthy case with a positive family history may point to the necessity to consult with an internal medicine specialist for screening of DM. Similarly, Theil et al18 reported that being a first-degree relative of a patient with type 2 DM was associated with higher lens fluorescence than having no relative with DM.
When all these results were evaluated, we investigated whether we were able to determine the probability of diagnosing type II DM in a subject using lens AF test. Our results showed highly significant correlation between DM and lens FRs. Particularly in subjects with FR of 0.24 or more, the risk of having DM was found to be 10.749 fold (odds ratio: 10.749 [95% CI: 5.461–21.161]). The sensitivity and the specificity were found to be 72% and 80%, respectively, for the detection of DM by measuring lens AF when the cutoff point was 0.24, or higher. Cutoff values of lens AF measurements were reported to be 0.27 by Burd et al.8 However, in their study, lens AF results were not compared with DM screening blood tests in subjects. Theil et al18 stated that prediction of DM with measuring lens AF had sensitivity of 79% and specificity of 100%. Also, Cahn et al14 reported their sensitivity and specificity ratios to be 67% and 94%, respectively. Our specificity ratio is lower than the previous reports. However, when we consider the sensitivity and the specificity of accepted diagnostic tests, which are FPG and HbA1c, being 58%, 77.4% and 77.4%, 63.8%, respectively,17 our FR results can be accepted to be comparable to them.
HbA1c is the best accepted measure of dysglycemia for the past 3 months.3 On the other hand, measurement of AGE accumulation by lens AF biomicroscope may reflect long-term dysglycemia, because AGEs are indicators of burden of dysglycemia for a long time, even after glycemic control has been achieved.5 Thus, even though the person has a period of dysglycemia throughout life (eg, pregnancy) without having DM, lens AF measurement may be high, and this should be kept in mind. However, considering the specificity and sensitivity of the lens AF test, DM screening can be recommended, particularly if the person has a relative with DM. Alternatively, lens AF levels may be a significant marker of long-term DM control, predicting future complication risks by using AGEs. Kessel et al,9 described that lens AF was correlated with the severity of DRP. Similarly, in our study FR measurements were significantly higher in diabetic patients who suffered from DRP than those without any DRP. On the other hand, there was no significant correlation between the severity of DRP and FR. This result can be related to the small number of diabetic patients in every subcategory. Increased lens AF may be one of the early indicators of diabetic involvement before any visible retinopathy occurs. Therefore, lens AF measurements may be used in the follow-up of disease progress, besides being used for screening purposes. Likewise, lens AF is reported to increase in the presence of diabetic nephropathy, and it is used noninvasively to follow the status of diabetic nephropathy, besides DRP.19
Previous studies emphasized the association between increased nuclear density and AF of lens.9,12 We did not observe this effect, as we already excluded any patient with cataractous changes in the lens in our study.
Conclusion
Lens AF measurement is a noninvasive and a rapid method that may be used easily in office conditions showing indirectly AGE accumulated in the natural lens of the eye, most commonly due to DM. Mean lens AF is increased with age. Mean FR is also increased in diabetic patients, which is found to be correlated with diagnostic blood tests of DM, namely FPG and HbA1c. Albeit statistically insignificant, lens AF levels tended to be higher in subjects with a family history of DM, both in diabetic patients and in healthy subjects. We found the cutoff value of FR for diagnosing DM to be 0.24 in our study. The sensitivity and the specificity of measuring FR for diagnosing DM in a patient were found to be 72% and 80%, respectively, which are comparable to the accepted diagnostic blood tests of DM. If supported by further comparative prospective large studies that lens AF measurements can be sufficiently used as a screening method, ie, it helps to identify DM in a preclinical stage, the measurement of FR may be an option for mass screening of people to help in the early diagnosis of DM in the general population in first-line clinics by a general practitioner. It may also be done in ophthalmology clinics as a routine practice, as well as by endocrinologists in the follow-up of diabetic patients to identify the risk of DRP. The effectiveness of lens AF measurement to detect diabetes in a preclinical state is yet to be determined. Further comparative studies with larger patients are warranted.
Disclosure
The authors report no conflicts of interest in this work.
References
WHO – World Health Organization. Screening for Type 2 Diabetes. Report of a World Health Organization and International Diabetes Federation Meeting. Geneva, Switzerland: WHO – World Health Organization; 2003. | ||
Hippisley-Cox J, Coupland C. Diabetes treatments and risk of amputation, blindness, severe kidney failure, hyperglycemia, and hypoglycemia: open cohort study in primary care. BMJ. 2016;352:i1450. | ||
Higgins T. HbA1c for screening and diagnosis of diabetes mellitus. Endocrine. 2013;43(2):266–273. | ||
Sacks DB, Bruns DE, Goldstein DE, Maclaren NK, McDonald JM, Parrott M. Guidelines and recommendations for laboratory analysis in the diagnosis and management of diabetes mellitus. Clin Chem. 2002;48(3):436–472. | ||
Abiko T, Abiko A, Ishiko S, Takeda M, Horiuchi S, Yoshida A. Relationship between autofluorescence and advanced glycation end products in diabetic lenses. Exp Eye Res. 1999;68(3):361–366. | ||
Karumanchi DK, Gaillard ER, Dillon J. Early diagnosis of diabetes through the eye. Photochem Photobiol. 2015;91(6):1497–1504. | ||
Chylack LT Jr, Wolfe JK, Singer D, et al. The lens opacities classification system III. The longitudinal study of cataract study group. Arch Ophthalmol. 1993;111(6):831–836. | ||
Burd J, Lum S, Cahn F, Ignotz K. Simultaneous noninvasive clinical measurement of lens autofluorescence and rayleigh scattering using a fluorescence biomicroscope. J Diabetes Sci Technol. 2012;6(6):1251–1259. | ||
Kessel L, Sander B, Dalgaard P, Larsen M. Lens fluorescence and metabolic control in type 1 diabetic patients: a 14 year follow up study. Br J Ophthalmol. 2004;88(9):1169–1172. | ||
Basta G, Schmidt AM, De Caterina R. Advanced glycation end products and vascular inflammation: implications for accelerated atherosclerosis in diabetes. Cardiovasc Res. 2004;63(4):582–592. | ||
Siik S, Airaksinen PJ, Tuulonen A, Alanko HI, Nieminen H. Lens autofluorescence in healthy individuals. Acta Ophthalmol. 1991;69(2):187–192. | ||
Sparrow JM, Bron AJ, Brown NA, Neil HA. Autofluorescence of the crystalline lens in early and late onset diabetes. Br J Ophthalmol. 1992;76(1):25–31. | ||
Van Best JA, Van Delft JL, Keunen JE. Long term follow-up of lenticular autofluorescence and transmittance in healthy volunteers. Exp Eye Res. 1998;66(1):117–123. | ||
Cahn F, Burd J, Ignotz K, Mishra S. Measurement of lens autofluorescence can distinguish subjects with diabetes from those without. J Diabetes Sci Technol. 2014;8(1):43–49. | ||
Calvo-Maroto AM, Perez-Cambrodi RJ, Garcia-Lazaro S, Ferrer-Blasco T, Cerviño A. Ocular autofluorescence in diabetes mellitus. A review. J Diabetes. 2016;8(5):619–628. | ||
Munch IC, Larsen M, Borch-Johnsen K, Glümer C, Lund-Andersen H, Kessel L. Cumulative glycaemia as measured by lens fluorometry: association with retinopathy in type 2 diabetes. Diabetologia. 2011;54(4):757–761. | ||
Kjer B, Larsen M, Bendtson I, Binder C, Dalgaard P, Lund-Andersen H. Lens autofluorescence in diabetes compared with the level of glycosylated hemoglobin A1c. Acta Ophthalmol Suppl. 1987;182:100–102. | ||
Theil PK, Kessel L, Hansen T, Lund-Andersen H, Pedersen O, Larsen M. Lens fluorescence in relation to glucose tolerance and genetic predisposition to type 2 diabetes mellitus in a population-based study. Curr Eye Res. 2006;31(9):733–738. | ||
Larsen M, Kjer B, Bendtson I, Dalgaard P, Lund-Andersen H. Lens fluorescence in relation to nephropathy in insulin-dependent diabetes mellitus. Graefes Arch Clin Exp Ophthalmol. 1992;230(1):6–10. |
 © 2018 The Author(s). This work is published and licensed by Dove Medical Press Limited. The full terms of this license are available at https://www.dovepress.com/terms.php and incorporate the Creative Commons Attribution - Non Commercial (unported, v3.0) License.
By accessing the work you hereby accept the Terms. Non-commercial uses of the work are permitted without any further permission from Dove Medical Press Limited, provided the work is properly attributed. For permission for commercial use of this work, please see paragraphs 4.2 and 5 of our Terms.
© 2018 The Author(s). This work is published and licensed by Dove Medical Press Limited. The full terms of this license are available at https://www.dovepress.com/terms.php and incorporate the Creative Commons Attribution - Non Commercial (unported, v3.0) License.
By accessing the work you hereby accept the Terms. Non-commercial uses of the work are permitted without any further permission from Dove Medical Press Limited, provided the work is properly attributed. For permission for commercial use of this work, please see paragraphs 4.2 and 5 of our Terms.