")
Back to Journals » Clinical Ophthalmology » Volume 14
The Appropriateness of Digital Diabetic Retinopathy Screening Images for a Computer-Aided Glaucoma Screening System
Authors Almazroa AA , Woodward MA , Newman-Casey PA , Shah MM, Elam AR, Kamat SS, Karvonen-Gutierrez CA, Wood SD, Kumar N, Moroi SE
Received 28 July 2020
Accepted for publication 2 October 2020
Published 16 November 2020 Volume 2020:14 Pages 3881—3890
DOI https://doi.org/10.2147/OPTH.S273659
Checked for plagiarism Yes
Review by Single anonymous peer review
Peer reviewer comments 2
Editor who approved publication: Dr Scott Fraser
Ahmed A Almazroa,1– 3 Maria A Woodward,1,4 Paula Anne Newman-Casey,1,4 Manjool M Shah,1 Angela R Elam,1 Shivani S Kamat,1 Carrie A Karvonen-Gutierrez,5 Sarah D Wood,1 Navasuja Kumar,1 Sayoko E Moroi1,4
1Department of Ophthalmology and Visual Sciences, W. K. Kellogg Eye Center, University of Michigan Medical School, Ann Arbor, MI, USA; 2Medical Imaging, King Abdullah International Medical Research Center, Riyadh, Saudi Arabia; 3Medical Imaging, King Saud Bin Abdulaziz University for Health Sciences, Riyadh, Saudi Arabia; 4Institute for Healthcare Policy & Innovation, University of Michigan, Ann Arbor, MI, USA; 5Department of Epidemiology, University of Michigan School of Public Health, Ann Arbor, MI, USA
Correspondence: Ahmed A Almazroa
King Abdullah International Medical Research Center, P.O. Box 3660, Riyadh 11481, Saudi Arabia
Tel +966 (11)4294324
Email [email protected]
Purpose: The purpose of this study was to evaluate the ability to screen for glaucoma using a Food Drug Administration (FDA) Class II diagnostic digital fundus photography system used for diabetic retinopathy screening (DRS).
Methods: All research participants underwent a comprehensive eye examination as well as non-mydriatic 45°single photograph retinal imaging centered on the macula. Optic nerve images within the 45° non-mydriatic and non-stereo DRS image were evaluated by two methods: 1) grading by three glaucoma specialists, and 2) a computer-aided automated segmentation system to determine the vertical cup-to-disc ratio (VCDR). Using VCDR from clinical assessment as gold standard, VCDR results from two methods were compared to that from clinical assessment. Inter-grader agreement was assessed by computing intraclass correlation coefficient (ICC). In addition, sensitivity and specificity were calculated.
Results: Among 245 fundus photos, 166 images met quality specifications for analysis. Fifty images were not processed by the automated system due to the poor quality of the optic disc, and 29 images did not include the optic nerve head due to the patient movement during the photo acquisition. The ICC value for the VCDR between the gold standard clinical exam and the automated system was 0.41, indicating fair agreement. The ICC value between the three ophthalmologists and the gold standard was 0.51, 0.56, and 0.69, respectively, indicating fair to moderate agreement.
Discussion: Assessing the VCDR on non-mydriatic and non-stereo DRS fundus photographs by either the computer-aided automated segmentation system or by glaucoma specialists showed similar fair to moderate agreement. In summary, optic nerve assessment for glaucoma from these 45° non-mydriatic and non-stereo DRS images is not yet suitable for tele-glaucoma screening.
Keywords: telemedicine, tele-glaucoma, automated screening system, diabetic retinopathy screening, glaucoma screening
Introduction
Diabetic retinopathy screening (DRS) has advanced with non-mydriatic digital imaging that is centered on the macula.1 The English National Health System (NHS) Diabetic Retinopathy Screening (DRS) program, which uses two-field mydriatic digital photography, started in 2003 and reached population coverage in 2008. In 2008, of the 2.59 million diabetics in England, 2.14 (83%) were screened. This system, alongside appropriate systems for ensuring proper follow-up care, was responsible for moving diabetic retinopathy out of the title of the leading cause of certifiable blindness in the working age group.2 Given this strong evidence of success for DRS as a public health program even using a digital screening system that depended on dilated image acquisition, newer DRS systems have been developed with improvements in ease of use. The newer systems do not require mydriasis, and algorithms have been developed and validated for automated analysis of the digital retina images in a commercial platform.3 The FDA has recently approved a software program that uses artificial intelligence to detect more than mild diabetic retinopathy in patients with diabetes who were not already treated for diabetic retinopathy.4
In general, these DRS digital images are centered on the macula and include the optic nerve. It remains to be determined if these optic nerve images are suitable for glaucoma screening. In the United States, the prevalence of glaucoma is expected to grow from the current 2.7 million to 4.2 million by 2030.5 Researchers estimate that 50% of people remain undiagnosed,6,7 so 2.1 million US citizens will remain undiagnosed in 2030 with current screening methods. In the world, the number of people (aged 40–80 years) with glaucoma was estimated to be 64.3 million in 2013, which is projected to increase to 76.0 million in 2020 and 111.8 million in 2040.8 Given the public health services momentum for DRS programs with digital imaging platforms and targeted DRS population health success in England,2 the purpose of this study was to determine the ability to screen for glaucoma on the IRIS™ (Pensacola, Florida) digital fundus photography used for DRS (FDA Class II diagnostic screening system for diabetic retinopathy).
Materials and Methods
Study Participants
This study was conducted in accordance with the Declaration of Helsinki. Approval from the University of Michigan Institutional Review Board Committee for a clinical research examination was obtained as part of an ongoing research study, and informed written consent was obtained from all participants. All participants underwent a comprehensive ophthalmic examination by a glaucoma fellowship trained and board-certified ophthalmologist (SEM) or board-certified optometrist (SDW). Using a 78D or 90D lens, the clinical vertical cup-to-disc ratio (VCDR) measurements obtained by clinical biomicroscopy, and was considered the gold standard (the study flowchart is shown in Figure 1). Based on this clinical research examination, participants were categorized as either no glaucoma, glaucoma suspect, or definite glaucoma (Confirmed by OCT).
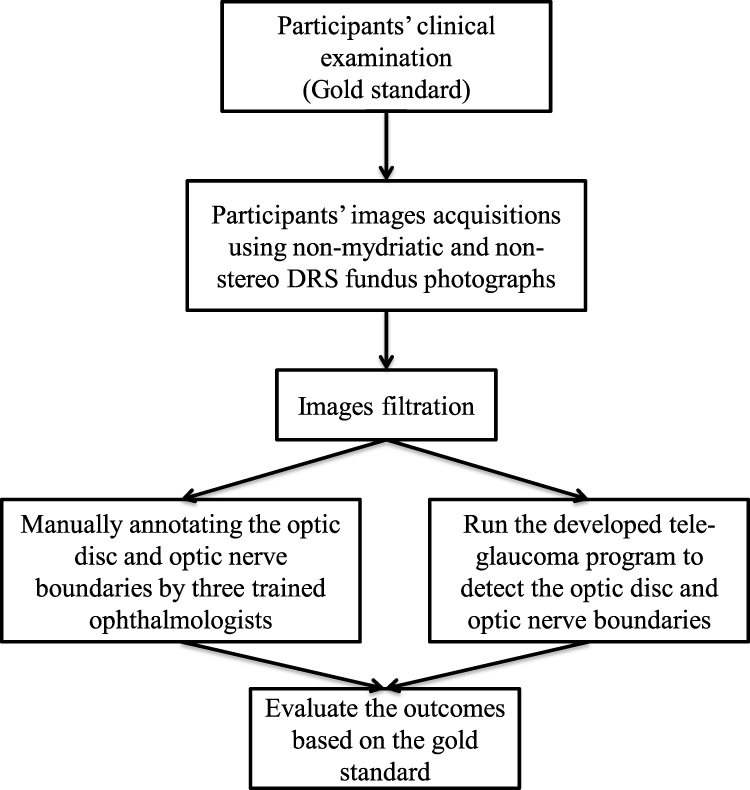 |
Figure 1 The study flowchart. |
Photograph Imaging
The DRS system used for this study was a non-mydriatic automated camera system (Centervue DRS, Fremont, CA). The DRS images were captured and stored on the Intelligent Retinal Imaging Systems platform (IRIS™, Pensacola, Florida) for remote grading by ophthalmologists. The IRIS system is an FDA Class II diagnostic digital fundus photography system as it gives immediate diagnostic feedback to patients about the presence or absence of diabetic retinopathy. The digital fundus images were acquired by three trained assistants. This camera has a sensor size of 5M pixel (2592x1944). The photographers took the standard 45° photograph of the posterior pole centered on the macula. A single image was taken of each eye. There are no standardized quality parameters for these images. These de-identified macula-centered digital photos have been described.9
Optic Nerve Assessment
Four grading methods (Table 1) were used for the VCDR. The first method was VCDR measurement using a 78D or 90D lens on biomicroscopy during clinical assessment and was considered to be the gold standard (ie, grading 1). The remaining grading 2, 3 and 4 of the optic disc images were based upon processed digital images of only the optic nerve. The computer tablet was a Microsoft Surface Pro 3 with 12-inch screen size and 2160X1440 pixel resolution. In brief, during the processing of these optic nerve images contained within the DRS centered macula image, a standardized approach was used to avoid introducing artifact to the image size by maximizing it at a fixed percentage number for grading 2 and 3.
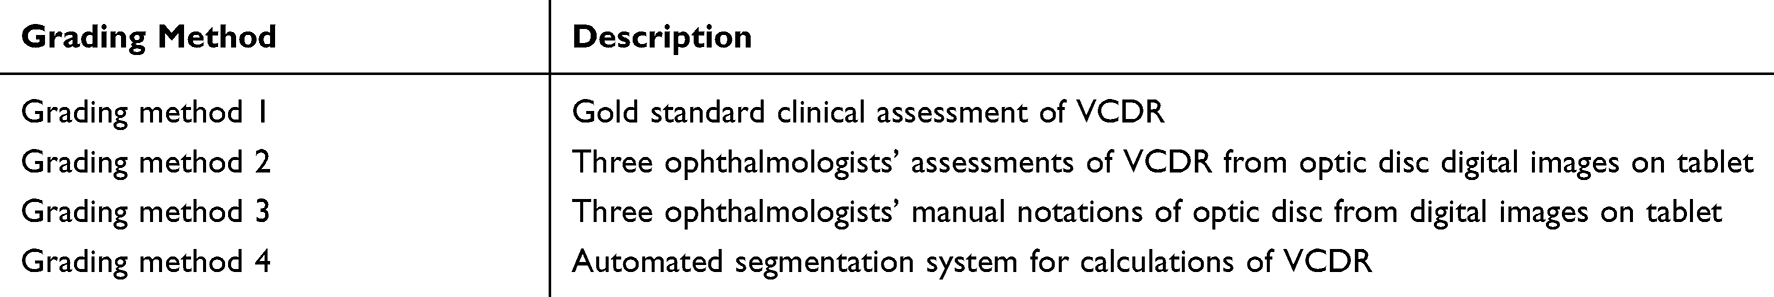 |
Table 1 Summary of the Optic Disc Grading Methods |
Based upon the optic disc images from the DRS images, the second method (ie, grading 2) was performed by three glaucoma fellowship trained ophthalmologists, who graded the VCDR by visual assessment of non-stereo optic disc images presented on a tablet. The third method (ie, grading 3) was manual annotation by the same three ophthalmologists, who drew the disc and cup boundaries on the optic disc images on the tablet (Figure 1). The fourth method (ie, grading 4) was the automated segmentation system that calculated the VCDR by detecting and segmenting the optic disc and optic cup boundaries.
The automated optic nerve head segmentation system10–14 was developed from 550 digital optic disc images that are part of the Retinal fundus Images for Glaucoma Analysis (RIGA) dataset.15 In brief, this automated system was developed and tested based on six experienced ophthalmologists, who established manual markings of the disc and cup boundaries drawn on digital optic disc photos on a computer tablet as shown in Figure 2. This automated system was developed based on: (i) pre-processing step of localizing the region of interest, (ii) processing step that included the optic disc and optic cup segmentation techniques, and (iii) post-processing step of calculating the horizontal cup-to-disc ratio (HCDR) and VCDR. Minor adjustment was conducted, particularly on the pre-processing step, ie, change the dimension of the localized region of interest to make it appropriate for the size of the optic nerve head as well as to minimize distortion of the image. This project focuses on the VCDR.
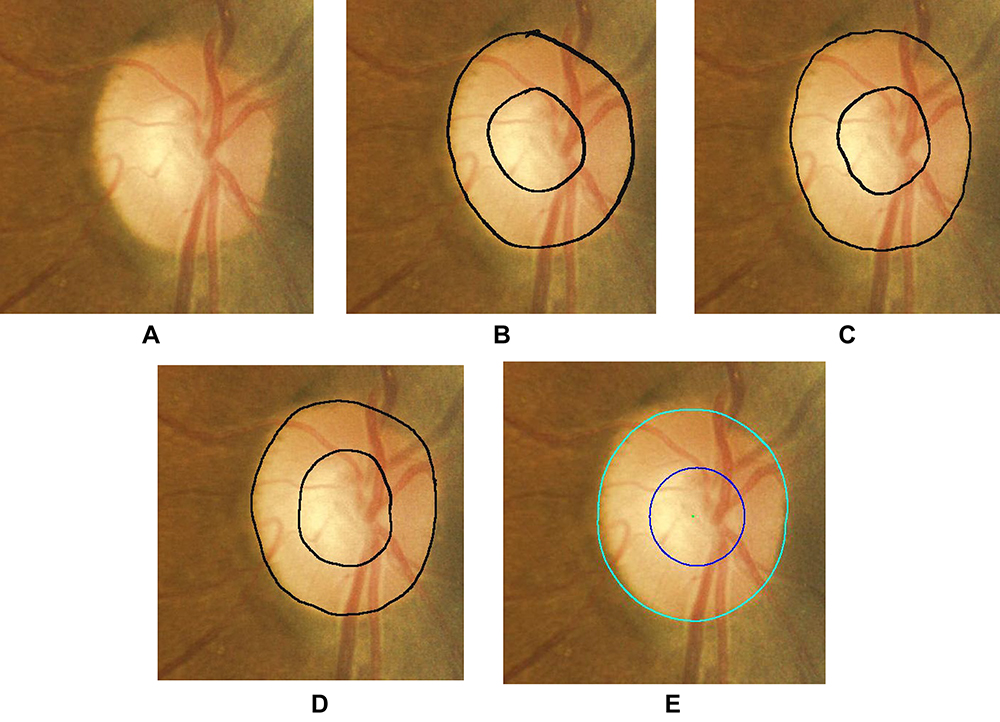 |
Figure 2 Representative digital, non-stereo optic disc image shown on computer tablet. The left image (A) is the non-stereo optic disc image from a macula-centered DRS photography. The three middle images (B–D) are the same optic disc image that show the manual annotations by the three ophthalmologists as grading 3 method described in “Materials and Methods, optic nerve assessment”. The right image (E) is the automated segmentation of the optic disc and optic cup margins, grading 4. Overall the optic disc and optic cup margins showed small variations among the three ophthalmologists’ manual markings (grading 3) and the computer automated margins (grading 4). |
Statistical Analysis
Statistical analysis was performed using IBM SPSS version 24 (IBM, Armonk, NY). The VCDR measurements for grading methods 2, 3, and 4 (Table 1) were compared with gold standard grading method 1 using interclass correlation coefficient (ICC). The ICC for the gold standard grading 1 was determined for each ophthalmologist’s grading 2 visual assessment, and for each ophthalmologist’s grading 3 manual markings independently (Table 2). Similarly, the ICC was calculated for the gold standard grading method 1 and to the automated system grading 4. The ICC for grading 1 was also compared with the average of the three ophthalmologists for both grading 2 and 3 independently (Table 3).
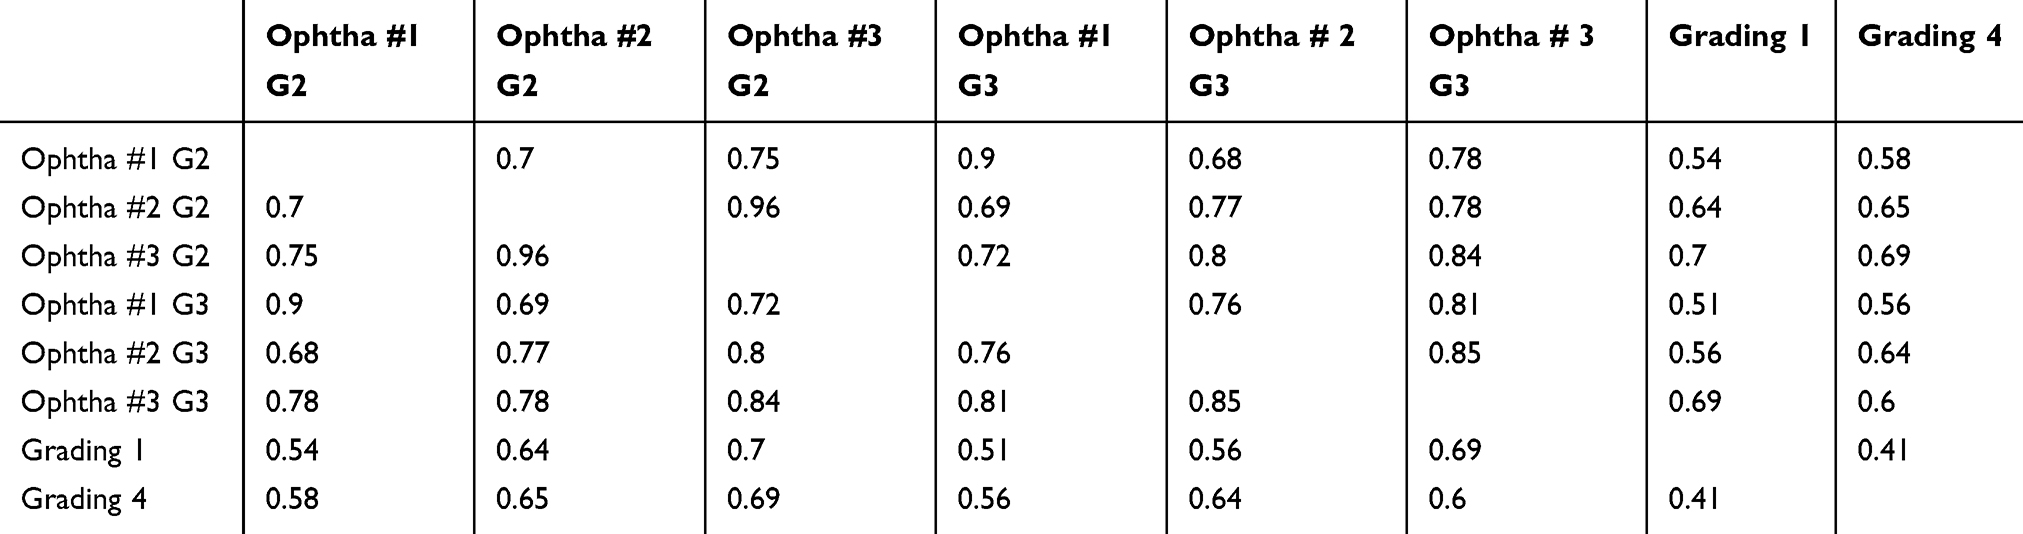 |
Table 2 Summary of Relative Agreement Between VCDR Grading Methods 1–4 by ICC. The Three Colors Represented as White = “Excellent”, Light Gray = “Good”, Medium Gray = “Fair” Match with the Cichetti Relative Meaning |
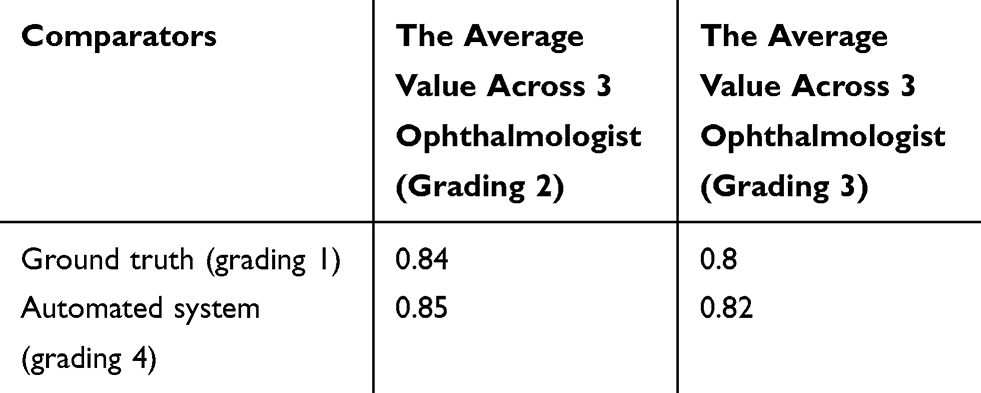 |
Table 3 Table Showing ICC Values |
In addition, the degree of agreement between the different grading methods of the optic disc grading was assessed using Bland-Altman plots.13,14 The sensitivity and specificity to detect VDCR of 0.5, 0.6 and 0.7 were calculated for grading 2, 3 and 4 with reference to the gold standard, grading method 1.
Results
There were 123 women who participated with an average age of 65.9 ± and the standard deviation is 2.77years (range 61 and 72 years). Participants were 60% African American and 40% White. Among the total of 245 digital fundus photos, 79 images (32%) were excluded because the optic disc was not present on the digital fundus photo. The reasons for poor centering on the macula were due to the participant’s inability to fixate during the image acquisition. Fifty images of the optic disc were of poor quality due to the bad acquisition, so could not be processed for the automated system grading 4, ie, the poor image quality of the optic nerve head, such as underexposure with poor color intensity of the neuro-retinal rim, limits the evaluation of the optic disc. There were a total of 166 digital images that were used for grading assessments 2, 3 and 4 (described in methods above).
The distribution of the four grading methods of the nine VCDR categorical bins “0.1–0.2 to 0.9–1” is shown in Figure 3. For each categorical bin, there are eight potential histogram columns. For example the first categorical bin “0.1–0.2”, VCDR categorical range, there are eight VCDR grading, ie, the 1st horizontal columns for each categorical bin represents grading 1’s VCDR, columns 2 represents ophthalmologist 1 grading 2, columns 3 represents ophthalmologist 1 grading 3, columns 4 represents ophthalmologist 2 grading 2, columns 5 represents ophthalmologist 2 grading 3, columns 6 represents ophthalmologist 3 grading 2, columns 7 represents ophthalmologist 3 grading 3, and finally the 8th columns representing grading 4. In the extreme “0.1–0.2” and “0.9–1.0”, there were some zero values for individual grading categories.
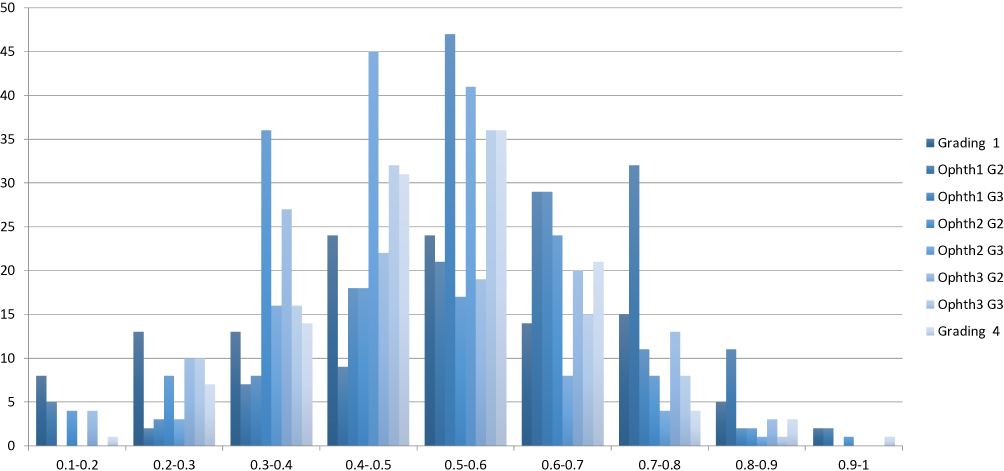 |
Figure 3 Histogram distribution of VCDR values from four grading assessments on the 166 optic nerve images. Within each categorical VCDR range, the order from left to right is ground truth clinical exam, three ophthalmologists graded digital photos, the same three ophthalmologists did manual annotations, and automated segmentation. The X-axis represents the VCDRs, the Y-axis represents the number of images in that category. |
The relative agreement between the eight VCDR grading assessed by ICC (Table 2). A guideline by Cicchetti,16 was used for the reliability context – when the reliability coefficient is below 40, the level of clinical significance is poor; between 40 and 59, the level is fair; between 60 and 74, the level is good; and when it is between 75 and 100, the level is excellent. The highest ICC value among the three ophthalmologists was 0.96 (95% CI = 0.94–0.97) indicated “excellent” reliability between ophthalmologist 3 who had visually estimated the VCDR closely to ophthalmologist 2. In contrast, the lowest ICC value was 0.68 (95% CI = 0.4–0.8) indicating “good” reliability between ophthalmologist 2 who had manually notated the optic disc and optic cup boundaries (grading 3) and ophthalmologist 1 who had visually estimated the VCDR (grading 2). The highest ICC value with the ground truth grading 1 was 0.7 (95% CI = 0.55–0.79) with ophthalmologist 3 who had visually estimated the VCDR (grading 2) indicating “good” reliability. The highest ICC value for automated grading 4 was 0.69 (95% CI = 0.55–0.79) with ophthalmologist 3 who had visually estimated the VCDR (grading 2) indicating “good” reliability. The ICC value between the ground truth grading 1 and automated grading 4 was 0.4 (95% CI = 0.2–0.56) indicating “fair” reliability. In general, there was fair agreement among the graders for VCDR visual estimation.
After calculating the average of the three ophthalmologists’ VCDR estimations (grading 2) and manual annotations (grading 3), the reliability was compared by ICC with the ground truth (grading 1) and the automated system (grading 4) (Table 2). The ICC value for the automated system (grading 4) with the average ophthalmologists’ manual notations (grading 3) was 0.82 (95% CI = 0.77–0.87), and was 0.85 (95% CI = 0.75–0.91) with estimated CDR (grading 2). These ICC values indicate “excellent” reliability. The ICC between the ground truth (grading 1) and the average ophthalmologists’ manual notations (grading 3) was 0.8 (95% CI = 0.73–0.85), and estimated VCDR (grading 2) was 0.84 (95% CI = 0.75–0.89), both ICC values indicating “excellent” reliability. In general, the results for the automated system (grading 4) with the 3 ophthalmologists’ estimation (grading 2) tended to be larger than the automated system with the 3 ophthalmologists’ manual notation (grading 3). Similarly, with the ground truth grading 1, the 3 ophthalmologists’ estimation (grading 2) tended to be larger than with 3 ophthalmologists’ manual notation (grading 3).
The Bland-Altman analysis for the VCDR are shown (Figure 4) to compare the ground truth (grading 1) against the three ophthalmologists’ VCDR manual notation (grading 3) as well as grading 1 with the automated system (grading 4). The limits of agreement (LoA) represented by VCDR values and defined as the mean difference ± 1.96 standard deviation of differences. The LoAs for ophthalmologist 1 are between 0.3 and −0.48 and between 0.4 and −0.43 for ophthalmologists 2 and 3 as well as the automated system. In addition, the mean differences almost close to the zero for all the four graders. Overall these Bland-Altman plots revealed that the mean differences largely lie within the limits of agreement.
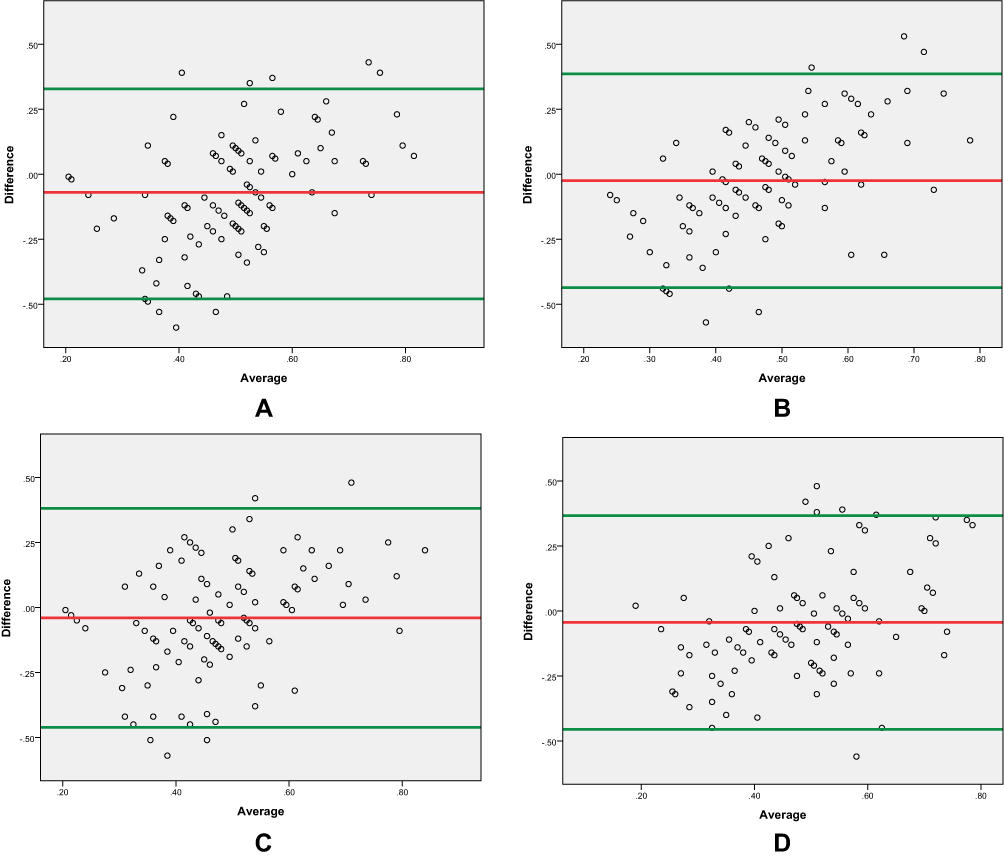 |
Figure 4 Bland-Altman plots to compare the ground truth (grading 1) VCDR with the estimated VCDR (grading 2) of the three ophthalmologists (A) (ophthalmologist 1), (B) (ophthalmologist 2), (C) (ophthalmologist 3) and the automated VCDR (grading 4) (D). The X-axis represents the average between the two measures ie the average VCDR between grading method 1and the specified grader, the Y-axis represents the difference between the ground truth and the specified grader. The mean difference is represented by the middle line (red line). Green lines indicate the upper and lower limits of agreement. |
Based on the ground truth examination (grading 1) of “glaucoma suspect” and “not glaucoma suspect”, the sensitivity and specificity (Table 4) were calculated for different VCDRs (0.5, 0.6, 0.7) among the three VCDR grading systems with grading 2, grading 3 and the grading 4. The sensitivity and specificity among the three ophthalmologists were ophthalmologist 3 with estimated VCDR (grading 2) providing 72% sensitivity and 82% specificity, and manual notations (grading 3) with 82% sensitivity and 66% specificity. There were sensitivity and specificity differences between the ophthalmologists comparing the estimation (grading 2) with manual notation (grading 3).
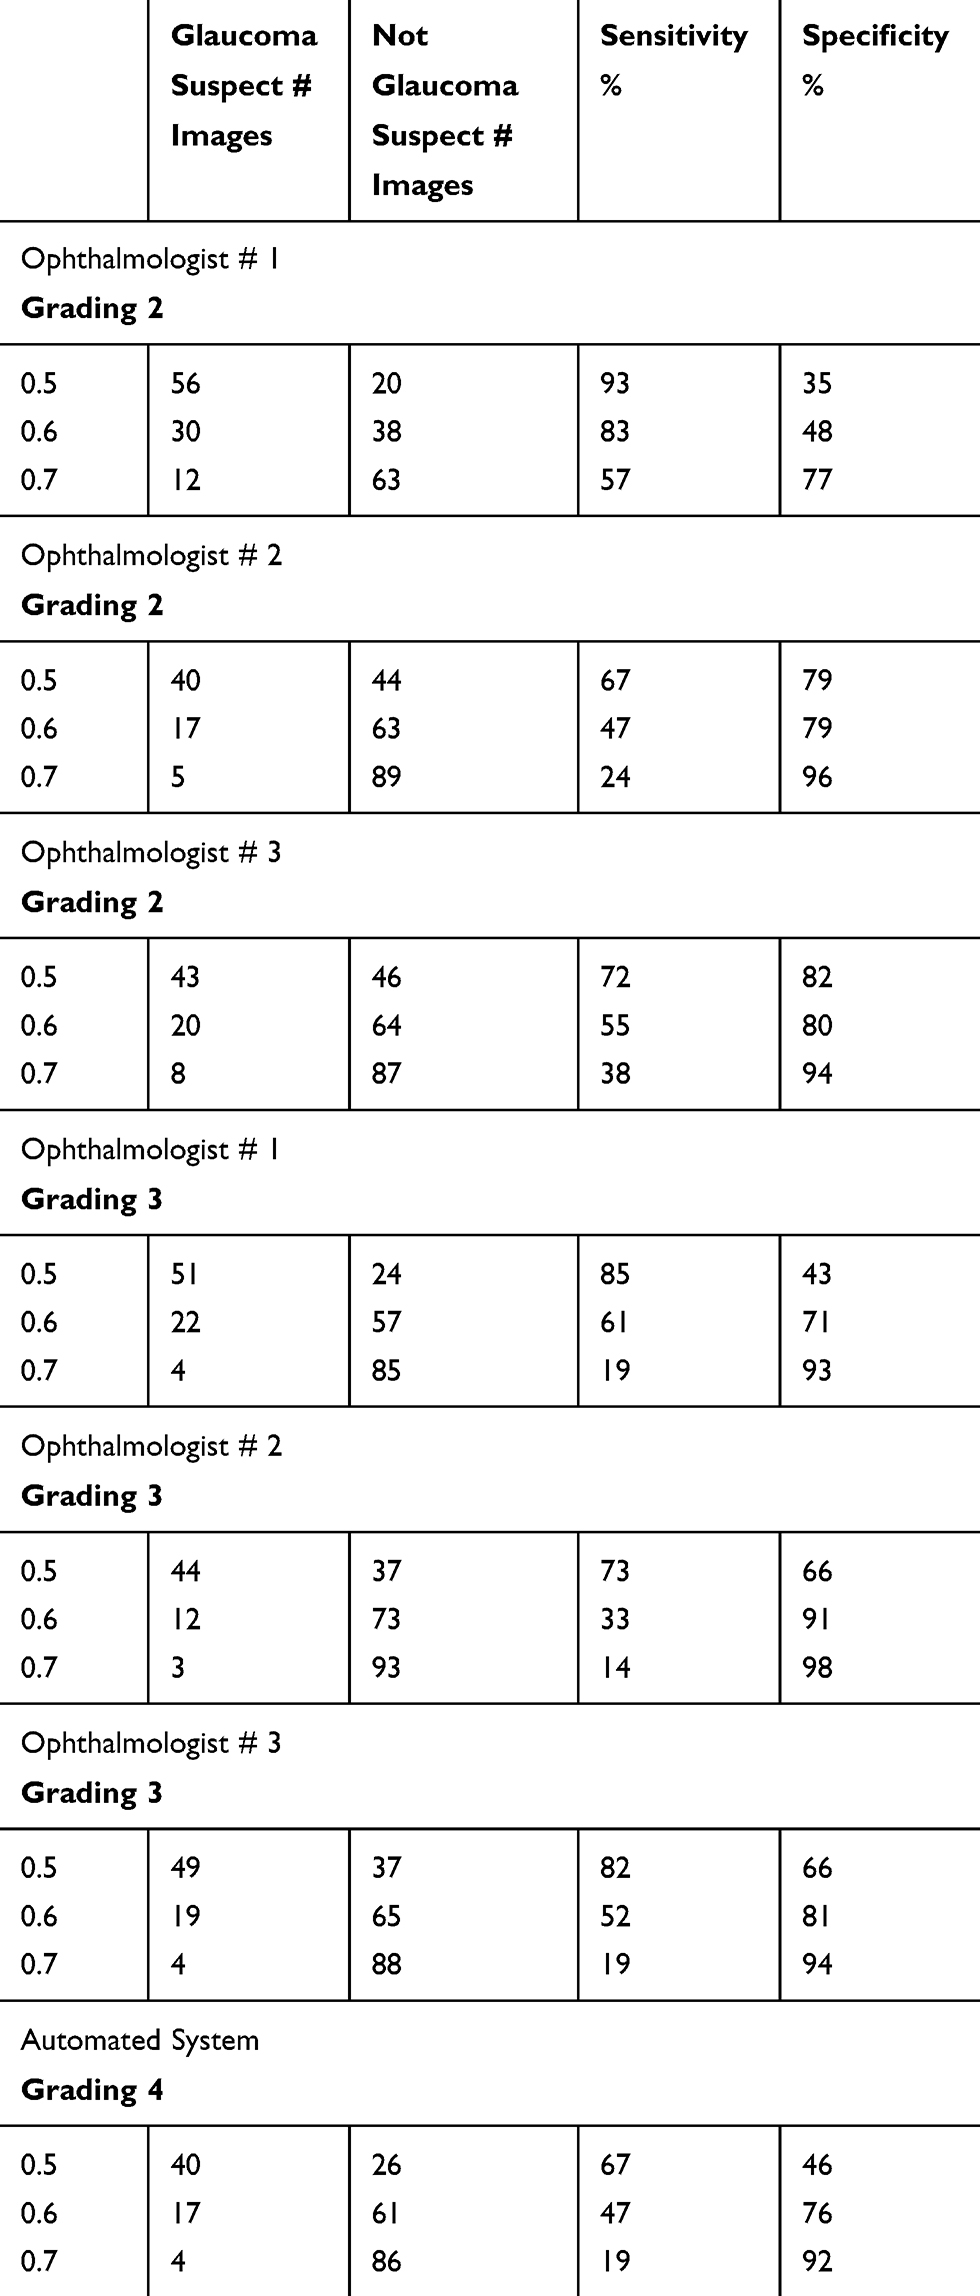 |
Table 4 Sensitivity and Specificity Comparing Ground Truth (Grading 1) of “Glaucoma Suspect” and “Not Glaucoma Suspect” Based on VCDR |
Discussion
Given the implementation of DRS, our goal was to determine the suitability of opportunistic glaucoma screening of optic disc images obtained through DRS using an automated grading system. Here, we established 166 non-stereo optic disc images from DRS digital fundus images centered on the macula. In general, our inter-rater agreement measures comparing the four VCDR grading systems showed variability in agreement between the ground truth (grading 1) and the other VCDR grading systems.
Limitations of our study, which can be considered as advantages to the grading 4 (The computer aided diagnosis system) to evaluate its performance and reliability includes only a single image taken of the macula, no stereo photos and no dilation. Another limitation of our study is the small population with few actual cases of glaucoma suspect or glaucoma in this population. Two main process are suggested to improve the performance of using the non-mydriatic and non-stereo DRS images for teleglaucoma programs, 1) include the optic nerve head in the DRS images as an essential part in the image, and 2) improve the developed teleglaucoma program functions to overcome the low-quality image issues.
A prior study tested the ability to screen for glaucoma using images obtained for DRS using the Veterans Affairs image capture protocol which includes three images: the macula, the nasal arcades and the superotemporal arcades. In a Veterans Affairs ambulatory clinic population with diabetes (N=1644), Pasquale et al,17 conducted a retrospective analysis of glaucoma screening using a nonmydriatic digital DRS images using the Topcon TRC NW5S. The DRS protocol took stereoscopic pairs of 45-degree images of the optic nerve-centered macula, superior temporal and nasal fields.17 Although there was 96% specificity, the sensitivity was 59% indicating that this DRS was not suitable to include glaucoma screening.
In the United Kingdom population with diabetes, 11,565 patients underwent DRS using dilated retinal imaging with the Topcon TRC NW5S and a Nikon D70 camera with OptoMize iP software. In this study, the imaging protocol consisted of dilated 45-degree images. There were 216 glaucoma suspects based on the DRS images, and on follow-up examinations, 113 were diagnosed with glaucoma. These authors calculated a 78.8% predictive value for glaucoma in this population of patients with diabetes.18
In a hospital-based screening infrastructure in Dublin, Ireland, Treacy et al,19 analyzed non-stereo digital fundus camera (Zeiss Visucam Pro NM) images in 3697 patients with diabetes. After dilation, two-field retinal images were taken with a 50-degree centered on the macula including the optic nerve and a 30-degree centered on the optic nerve. Among the 3697 patients, 91 glaucoma suspects were identified and referred for follow-up glaucoma evaluation. Among these 91 suspects, 63 presented for glaucoma evaluation with 13 diagnosed with glaucoma (21%), 36 remained as glaucoma suspects (57%), and 14 were classified as no glaucoma (12%). This successful glaucoma screening based on DRS photos had the advantage of dilation with a 30-degree image centered on the optic disc.
Overall, glaucoma screening remains a challenge due to the insidious onset and lack of evidence for technology-based screening for glaucomatous optic neuropathy in adults.20 Given the overall open-angle glaucoma prevalence of 4%, it is not cost-effective to conduct general population screening. However, targeted screening in regions of higher-risk individuals shows promise as these screenings take place in communities where health-care disparities exist.21
Although the feasibility of glaucoma screening from DRS images has been demonstrated in some studies, it is apparent that there is wide variation in DRS camera systems and imaging protocols that include high-quality optic nerve photos. Most DRS take non-stereo macula-centered images and without mydriasis due to the nature of the DRS location in a primary care or even a community setting. From our dataset, a limitation is the nonmydriatic image and a single image taken. Although our sample size was small, a major strength of our study was the prospective comprehensive clinical examination and ascertainment of either glaucoma suspect, or not glaucoma suspect.
Grading optic discs is fundamental to identify glaucoma suspects during screening. Given the well-known inter-observer variability and intra-observer variability, an automated algorithm was developed to calculate the CDR from 550 digital photos established. In the current study, the automated system took 50–60 seconds to grade this dataset, compared to 20–30 seconds to grade the original RIGA dataset. With continual improvements toward higher quality cameras in the portable fundus cameras and smartphones, the automated grading system may have an advantage over remote trained graders for glaucoma screening. The application of such mobile technology may have applications that combine glaucoma screening among patients with diabetes who are having photography for DRS. Such a combined screening system may be a cost-effective tool to improve access to high-quality subspecialty care as well as to overcome the high rate undiagnosed glaucoma worldwide.
In conclusions, Tele-glaucoma that targets high-risk populations show promise to help provide a solution for individuals who have access to primary eye care and do not to ophthalmology sub-specialty care. This approach could help close the gap for the undiagnosed glaucoma assessment. Various automated optic disc and optic cup boundary segmentation techniques using fundus photography have been introduced. Our findings using non-mydriatic 45° macula-centered DRS photographs supports that tele-glaucoma screening depends upon high-quality imaging that includes the optic disc. Hence, the current IRIS™ DRS platform, optic nerve assessment for glaucoma from these digital DRS images is not yet appropriate for tele-glaucoma screening.
Abbreviations
CI, confidence interval; DRS, diabetic retinopathy screening; FDA, Food and Drug Administration; VCDR, vertical cup to disc ratio; ICC, intraclass correlation coefficient; IRIS, Intelligent Retinal Imaging Systems; NHS, National Health Service; SDW, author Sarah D. Wood; SEM, author Sayoko E. Moroi; RIGA, Retinal fundus Images for Glaucoma Analysis.
Funding
Mcubed 2.0, University of Michigan (Shivani S. Kamat, Carrie A. Karvonen-Gutierrez, Sayoko E. Moroi); King Abdullah International Medical Research Center (Ahmed A. Almazroa).
Disclosure
Maria A Woodward reports grants from National Eye Institute, during the conduct of the study. Paula Anne Newman-Casey reports grants from the National Eye Institute, Career Development Award from Research to Prevent Blindness, during the conduct of the study. Dr Manjool M Shah reports personal fees from Allergan, nothing from Glaukos, nothing from Katena, outside the submitted work. Sayoko E Moroi reports grants from University of Michigan, during the conduct of the study; grants from NIH, nothing from Allergan, Royalties unrelated to this manuscript from Wolters Kluwer, outside the submitted work. The authors declare that they have no other actual or potential conflict of interests relevant to the content of this project.
References
1. Goh JK, Cheung CY, Sim SS, Tan PC, Tan GS, Wong TY. Retinal imaging techniques for diabetic retinopathy screening. J Diabetes Sci Technol. 2016;10(2):282–294.
2. Scanlon PH. The english national screening programme for diabetic retinopathy 2003–2016. Acta Diabetol. 2017;54(6):515–525. doi:10.1007/s00592-017-0974-1
3. Gulshan V, Peng L, Coram M, et al. Development and validation of a deep learning algorithm for detection of diabetic retinopathy in retinal fundus photographs. J Am Med Assoc. 2016;316(22):2402–2410. doi:10.1001/jama.2016.17216
4. FDA permits marketing of artificial intelligence-based device to detect certain diabetes-related eye problems. Food and drug administration. 2018. Available from: https://www.fda.gov/newsevents/newsroom/pressannouncements/ucm604357.htm.
5. Open-angle Glaucoma defined. National eye institute. 2018. Available from: https://nei.nih.gov/eyedata/glaucoma#5.
6. Quigley HA, West SK, Rodriguez J, Munoz B, Klein R, Snyder R. The prevalence of glaucoma in a population-based study of hispanic subjects: proyecto VER. Arch Ophthalmol. 2001;119(12):1819–1826. doi:10.1001/archopht.119.12.1819
7. Eye Diseases Prevalence Research Group. Prevalence of open-angle glaucoma among adults in the United States. Arch Ophthalmol. 2004;122(4):532. doi:10.1001/archopht.122.4.532
8. Tham YC, Li X, Wong TY, Quigley HA, Aung T, Cheng CY. Global prevalence of glaucoma and projections of glaucoma burden through 2040: a systematic review and meta-analysis. Ophthalmology. 2014;121(11):2081–2090.
9. Almazroa AA, Moroi SE Expanding the initial retinal fundus images for glaucoma analysis: the RIGA2 dataset.
10. Almazroa A, Alodhayb S, Raahemifar K, Lakshminarayanan V. An automatic image processing system for glaucoma screening. Int J Biomed Imaging. 2017;2017:1–19. doi:10.1155/2017/4826385
11. Almazroa A, Sun W, Alodhayb S, Raahemifar K, Lakshminarayanan V. Optic disc segmentation for glaucoma screening system using fundus images. Clin Ophthalmol. 2017;11:2017–2029. doi:10.2147/OPTH.S140061
12. Almazroa A, Sun W, Alodhayb S, Raahemifar K, Lakshminarayanan V Optic disc segmentation: level set methods and blood vessels inpainting.
13. Almazroa A, Alodhayb S, Raahemifar K, Lakshminarayanan V. Optic cup segmentation: type-II fuzzy thresholding approach and blood vessel extraction. Clin Ophthalmol. 2017;11:841–854. doi:10.2147/OPTH.S117157
14. Almazroa A, Alodhayb S, Burman R, Sun W, Raahemifar K, Lakshminarayanan V Optic cup segmentation based on extracting blood vessel kinks and cup thresholding using Type-II fuzzy approach.
15. Almazroa A, Alodhayb S, Osman E, et al. Retinal fundus images for glaucoma analysis: the RIGA dataset.
16. Cicchetti DV. Guidelines, criteria, and rules of thumb for evaluating normed and standardized assessment instruments in psychology. Psychol Assess. 1994;6(4):284–290.
17. Pasquale LR, Asefzadeh B, Dunphy RW, Fisch BM, Conlin PR, Team OT. Detection of glaucoma-like optic discs in a diabetes teleretinal program. J Am Optom Assoc. 2007;78(12):657–663. doi:10.1016/j.optm.2007.04.101
18. Ong HS, Levin S, Vafidis G. Glaucoma detection using optic disc images from the english national screening programme for diabetic retinopathy. J Glaucoma. 2013;22(6):496–500. doi:10.1097/IJG.0b013e3182447d58
19. Treacy MP, O’Neill EC, Murphy M, et al. Opportunistic detection of glaucomatous optic discs within a diabetic retinopathy screening service. Eur J Ophthalmol. 2016;26(4):315–320. doi:10.5301/ejo.5000722
20. Moyer VA. Screening for glaucoma: US preventive services task force recommendation statement. Ann Intern Med. 2013;159(7):484–489.
21. Hark L, Waisbourd M, Myers JS, et al. Improving access to eye care among persons at high-risk of glaucoma in Philadelphia—design and methodology: the Philadelphia glaucoma detection and treatment project. Ophthalmic Epidemiol. 2016;23(2):122–130. doi:10.3109/09286586.2015.1099683
 © 2020 The Author(s). This work is published and licensed by Dove Medical Press Limited. The full terms of this license are available at https://www.dovepress.com/terms.php and incorporate the Creative Commons Attribution - Non Commercial (unported, v3.0) License.
By accessing the work you hereby accept the Terms. Non-commercial uses of the work are permitted without any further permission from Dove Medical Press Limited, provided the work is properly attributed. For permission for commercial use of this work, please see paragraphs 4.2 and 5 of our Terms.
© 2020 The Author(s). This work is published and licensed by Dove Medical Press Limited. The full terms of this license are available at https://www.dovepress.com/terms.php and incorporate the Creative Commons Attribution - Non Commercial (unported, v3.0) License.
By accessing the work you hereby accept the Terms. Non-commercial uses of the work are permitted without any further permission from Dove Medical Press Limited, provided the work is properly attributed. For permission for commercial use of this work, please see paragraphs 4.2 and 5 of our Terms.