")
Back to Journals » Cancer Management and Research » Volume 12
The Application of Three-Dimensional Visualization in Preoperative Evaluation of Portal Vein Invasion in Hilar Cholangiocarcinoma
Authors Zhang J , Guo X, Wang H, Zhang J, Liu P, Qiao Q, Wang X
Received 28 June 2020
Accepted for publication 9 September 2020
Published 29 September 2020 Volume 2020:12 Pages 9297—9302
DOI https://doi.org/10.2147/CMAR.S264479
Checked for plagiarism Yes
Review by Single anonymous peer review
Peer reviewer comments 2
Editor who approved publication: Dr Sanjeev K. Srivastava
Jun Zhang,1,* Xiaochao Guo,2,* He Wang,2 Jixin Zhang,3 Ping Liu,3 Qilu Qiao,1 Xin Wang1
1Department of General Surgery, Peking University First Hospital, Beijing 100034, People’s Republic of China; 2Department of Imaging, Peking University First Hospital, Beijing 100034, People’s Republic of China; 3Department of Pathology, Peking University First Hospital, Beijing 100034, People’s Republic of China
*These authors contributed equally to this work
Correspondence: Jun Zhang
Department of General Surgery, Peking University First Hospital, No. 8 of Xishiku Street, Xicheng District, Beijing 100034, People’s Republic of China
Tel +86 10 83572771
Fax +86 10 66551033
Email [email protected]
Objective: This study aimed to investigate the use of three-dimensional visualization for preoperative evaluation of portal vein invasion in hilar cholangiocarcinoma (HCCA).
Methods: This recombination study for preoperative computerized tomography images was completed in 42 patients undergoing radical resection of HCCA combined with hepatectomy. Portal vein invasion with postoperative pathology was used as a gold standard to decide if the diagnosis was correct or not. We compared the sensitivity, specificity, positive predictive value, negative predictive value, and total correctness of radiologists and a three-dimensional (3D) visualization model for the assessment of tumor-caused portal vein invasion.
Results: The findings for the estimation of portal vein invasion by radiologists based on CT images were as follows: sensitivity = 90.9%; specificity = 83.8%; positive predictive value = 66.7%; negative predictive value = 96.3%; and overall accuracy = 85.7%. The findings for estimation by the 3D visualization model were as follows: sensitivity = 90.9%; specificity = 96.8%; positive predictive value = 90.9%; negative predictive value = 96.8%; and overall accuracy = 90.5%.
Conclusion: The positive predictive value of 3D visualization technology in the diagnosis of portal vein invasion is notably superior to that of subjective assessment by radiologists. This technique can thus play a significant role in preventing unnecessary resectioning of non-invaded portal veins and hepatectomy.
Keywords: hilar cholangiocarcinoma, three-dimensional visualization technology, portal vein, neoplasm invasion, positive predictive value
Introduction
Hilar cholangiocarcinoma (HCCA) refers to an epithelial carcinoma of the bile duct mucosa that occurs in the common hepatic duct, in the left or right hepatic ducts, or at their confluence. The global prevalence is currently 1/100,000, and the incidence rate is showing an upward tendency.1 Radical surgery is the only means for increasing long-term survival chances or providing a cure for HCCA patients.2 Due to the narrowness of the hilar space and the complex vascular anatomy, the probability of variation is high; therefore, this region is easily invaded by tumors.3 Whether the hepatic portal vein is invaded is one of the most important indexes in examining the resectability and excision range of HCCA. The occurrence of portal vein invasion increases the difficulty of the operation and the risk of postoperative complications for both simple angiectomy and revascularization surgeries and procedures combined with a hepatectomy.4–6 Therefore, accurate preoperative evaluation of portal vein invasion is a requirement for improving the surgical resection rate and reducing the surgical mortality of HCCA by avoiding radical tumor resection failure or unnecessary surgical enlargement.
Transarterial portal vein computerized tomography (CT) imaging can be used to examine the portal vein. With the development of spiral CT technology, spiral CT portal angiography has become the gold standard for the diagnosis of portal vein lesions.7 Existing studies have shown that the sensitivity and specificity of the subjective determination of portal vein invasion by radiologists utilizing this imaging method are 89% and 92%, respectively, while the sensitivity and specificity of hepatic artery invasion detection are 83% and 93%, respectively.8–10 There seldom literature report on the positive and negative predictive values for hepatic portal vein invasion. Moreover, there are still some errors in radiologists’ subjective assessments, which may lead to unnecessary enlargement of operations due to intraoperative misjudgment or may increase postoperative tumor recurrence rates as a consequence of undetected and untreated portal vein invasion.
Recently, three-dimensional (3D) visualization technology has come to be applied clinically. Owing to its advantages in terms of stereoscopy and intuition, it has shown a high clinical value and good application prospects for the preoperative evaluation of HCCA.11,12 Particularly given the complexity and variability of liver vessels, the use of 3D visualization technology can provide a clearer and more accurate view of liver lesion sites, which is beneficial for surgery.13 However, the existing literature on 3D visualization technology in the preoperative determination of HCCA-induced hepatic portal vein invasion lacks in-depth analysis.
Methods
General Information
A total of 42 patients who underwent radical HCCA resection combined with hepatectomy from September 2014 to September 2019 were included in this study. A multi-phase abdominal enhanced CT scan was completed for all patients within three weeks before their operation, with an average interval of 15.3 days (range: 5–21 days). The sample included 20 males and 22 females, and the age range was 56–72 years (mean: 62.5 years). The surgical details are shown in Table 1. The study was conducted in accordance with the Declaration of Helsinki (as was revised in 2013). The study was approved by Ethics Committee of Peking University First Hospital (No.2018–15) and informed consent was taken from all the patients.
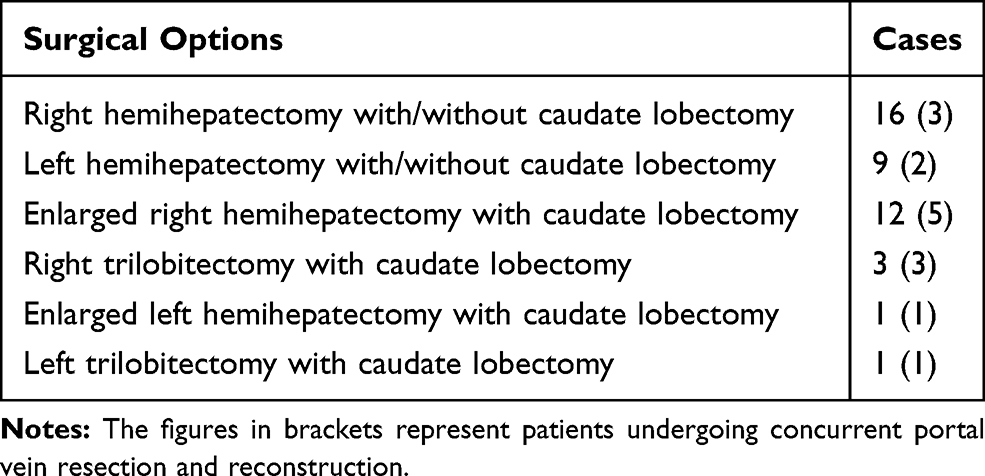 |
Table 1 Surgical Options in 42 Patients |
In this study, we investigated the role of 3D visualization technology in the preoperative evaluation of HCCA by establishing a new evaluation standard for HCCA-induced portal vein invasion. We retrospectively examined the clinical data of 42 patients who underwent HCCA surgery from September 2014 to September 2019 in the General Surgery department of XXX Hospital to investigate the value of 3D visualization technology in the preoperative evaluation of HCCA-induced portal vein invasion.
CT
All patients were preoperatively arranged in the same way for the multi-phase epigastric enhanced CT scan. The patient was placed in a supine position in a head–foot direction. The scan range was from the diaphragmatic dome leveling to the umbilical and included the whole liver, and the scan parameter tube voltage was 120 kV. The automatic tube current modulation technique (120–300 mAs) was used with a ball tube speed of 0.5 s/rot, a pitch of 0.984, a layer thickness of 5mm, a scan field of 50cm, and a matrix of 512 × 512. A Siemens SOMATOM Definition Flash (manufactured in Erlangen, Germany) was used. The patient was injected with 80–90 mL of an iodine contrast agent (Iopamiro 300 mg/mL) through the elbow vein by a 20-mL trocar using a double-syringe power injector at a speed of 4 mL after plain scanning. After the injection, the tube was flushed with 20 mL of saline. The scan delay time was 20–25 s in the arterial phase and 55–60 s in the venous phase. At the end of the examination, the images of each phase were reconstructed into 1-mm layer thickness and 1-mm inter-slice spacing. Then, the image workstation was uploaded and the layer thickness was cut to 1 mm. All original CT data were saved in the DICOM file format.
3D Reconstruction Method
A hepatic multi-phase enhanced CT scan (layer thickness: 1 mm) was completed on all patients before their operations. The scan images were stored in DICOM format and imported into the abdominal 3D visualization system developed by Yorktal Digital Medical Imaging Technology Company Ltd. (Shenzhen, China) for 3D visualization. Programmed image segmentation and registration were completed for the original data of all the CT phases. Display objects included the liver, the hepatic arterial and venous system, the portal vein system, and the tumor. The liver was segmented by the Couinaud eight-segment method, and the volumes of all liver segments were calculated. The synthetic 3D model was used for the preoperative evaluation. The 3D reconstruction and homogenization treatment, quality control standard, and 3D visualization model were established in accordance with the Guidelines for the Precise Diagnosis and Treatment of Complex Liver Tumors by 3D Visualization (2019).14
Image Analysis
The preoperative CT images of the 42 patients were assessed by two associate chief physicians in the Imaging Department. The final diagnostic report for each patient was issued after both physicians had reached a consensus. The following diagnostic criteria were applied for tumor-induced portal vein invasion: when a fat layer was present in the space between the tumor and portal vein, it was considered that the tumor had invaded the portal vein; and when the fat layer disappeared in the space between the tumor and the portal vein, it was considered that the tumor had invaded the portal vein (Figure 1).
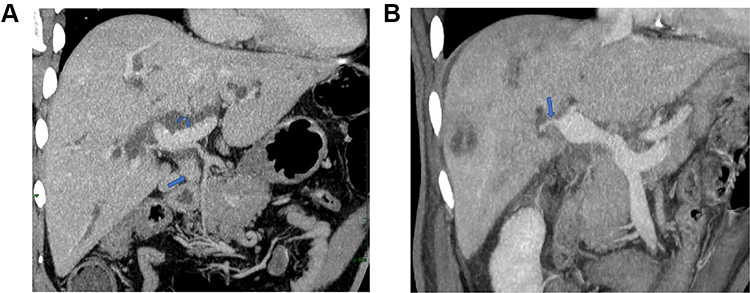 |
Figure 1 CT assessment of the tumor and portal vein invasion. (A) CT assessment of tumor and no portal vein invasion. According to the enhanced CT images of the portal vein phase, the tumor is located at the porta hepatis (straight arrow) and the adjacent portal vein (curved arrow). The wide gap between the two is clear, with no tumor wrapping, portal vein stenosis, or deformation. In this case, the radiologists evaluated that the tumor has not invaded the portal vein. (B) CT assessment of tumor and portal vein invasion. According to the enhanced CT images of the portal vein phase, the tumor is located in the hepatic portal region around the right branch of the portal vein, and the lumen has significantly irregular stenosis (straight arrow). In this case, the radiologists evaluated that the tumor has invaded the portal vein. |
Pathological Analysis
The surgical specimens were fixed with 10% formalin for several days and assessed by hematoxylin and eosin staining under a microscope. Each pathological specimen was then rechecked by two associate chief physicians in the Pathology Department. The tumor-induced portal vein invasion determination was performed using a microscope. The final diagnostic report was issued after both parties had reached a consensus (Figure 2).
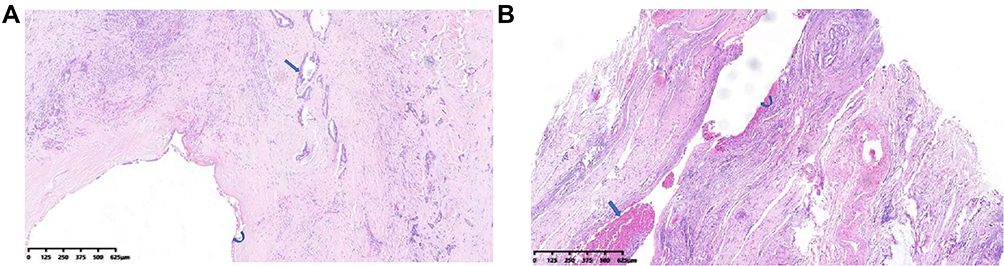 |
Figure 2 Pathological assessment of tumor and portal vein invasion. (A) Pathological estimation of tumor and no portal vein invasion. The tumor is located next to the portal vein and does not invade the portal vein lumen (straight arrow) and portal vein (curved arrow). In this case, the pathologists evaluated that the tumor has not invaded the portal vein. (B) Pathological estimation of tumor and portal vein invasion. The tumor has invaded the vein (straight arrow) and the portal vein (curved arrow). In this case, the pathologists evaluated that the tumor has invaded the portal vein. |
3D Visualization
The ratio of the contact area between the tumor and portal vein to the circumferential area of the portal vein in this segment was analyzed using 3D visualization technology to establish the optimal value range for assessing whether the tumor had invaded the portal vein (Figure 3). The 3D visualization technology results and CT image analysis were compared to determine the sensitivity, specificity, positive predictive value, and negative predictive value for portal vein invasion. Receiver operating characteristic (ROC) analysis and a McNemar test were conducted using statistical analysis methods. A P-value of <0.05 was considered significantly different.
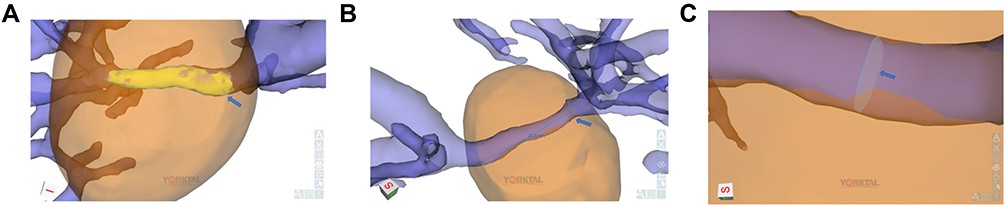 |
Figure 3 Analysis of 3D visualization technology images. (A) Calculating the overlapping area of the tumor and portal vein using 3D visualization technology images. The yellow region (straight arrow) is the overlapping area between the tumor and portal vein in the figure, and the area’s size can be calculated. (B) Calculating the diameter of the blood vessels at the site where the tumor overlaps with the portal vein using 3D visualization technology images. The length of the blood vessel at the site where the tumor overlaps with the portal vein (straight arrow) can be calculated. (C) Calculating the vessel diameter at the overlapping sites of the tumor and portal vein using 3D visualization technology images. By measuring the diameter and the length of the blood vessels at the overlapping site (straight arrow) of the tumor and portal vein, the circumferential area of the portal vein can be measured. |
Results
Radiologists’ Analysis Results
Among the 42 patients, 15 had a portal vein invasion according to the subjective judgment of the radiologists, while 10 had a portal vein invasion according to the postoperative pathology (Table 2). The tumor-induced portal vein invasion findings from the subjective assessment of the radiologists had the following characteristics: sensitivity = 90.9%; specificity = 83.8%; positive predictive value = 66.7%; negative predictive value = 96.3%; and overall accuracy = 85.7%.
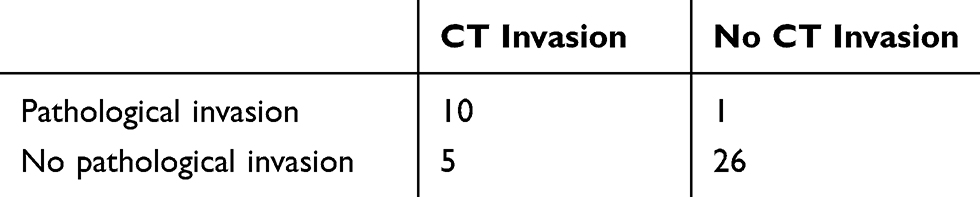 |
Table 2 CT Diagnosis and Pathological Diagnosis Were Used to Determine the Number of Cases of Portal Vein Invasion in 42 Patients |
Receiving Operator Characteristic Test Results
Using the ROC, the diagnostic criteria of the 3D visualization system for evaluating tumor-induced vascular invasion were as follows: when the contact area between the tumor and the blood vessels was <32% of the circumferential area of the portal vein in this segment, it was concluded that the tumor had not invaded the blood vessels; and when the contact area between the tumor and the blood vessels was ≥32% of the circumferential area of the portal vein in this segment, it was concluded that the tumor had invaded the blood vessels (Figure 4).
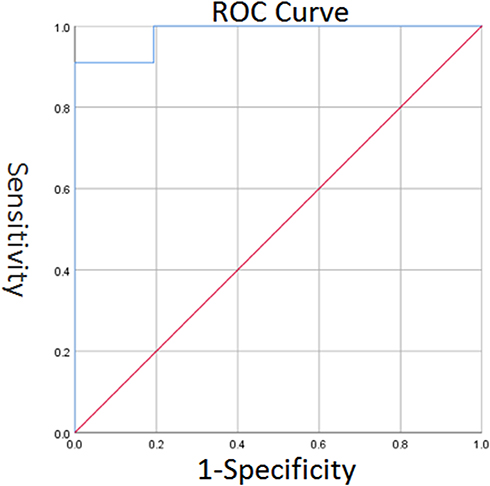 |
Figure 4 ROC curve: The optimal cut-off point is calculated at 32%. |
3D Visualization
Among the 42 patients, 11 had a portal vein invasion according to the 3D visualization technology, while 10 had a portal vein invasion according to the postoperative pathology (Table 3). The assessment of the 3D visualization technology findings regarding tumor-induced portal vein invasion was as follows: sensitivity = 90.9%; specificity = 96.8%; positive predictive value = 90.9%; negative predictive value: = 96.8%; and overall accuracy = 90.5%.
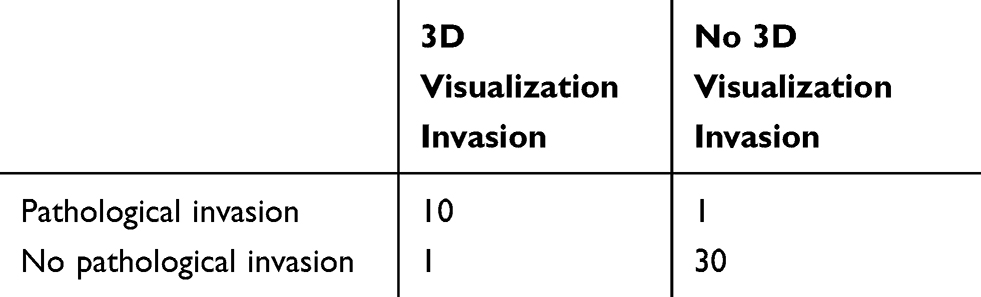 |
Table 3 3D Visualization Technology and Pathological Diagnosis Were Used to Determine the Number of Cases of Portal Vein Invasion in 42 Patients |
Among the 15 patients with portal vein invasion according to the radiologists’ subjective assessment, 11 were determined to have portal vein invasion by the 3D visualization technology. Both the radiologists and the 3D visualization system concluded that 27 of the patients had no portal vein invasion. A P-value of >0.05 in the McNemar test of the two methods’ findings indicated that the difference was not significant (Table 4).
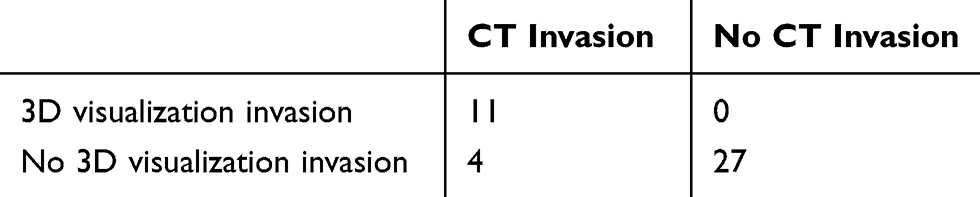 |
Table 4 The Number of Cases of Portal Vein Invasion Was Judged by 3D Visualization Technology Diagnosis and CT Diagnosis |
Discussion
The HCCA grows in the narrow space centered on the bifurcation of the hepatic duct. The hilar bile duct is closely adjacent to the portal vein; the distance between them is only 1–2 mm.15,16 Whether the portal vein is invaded is one of the main indicators for determining whether the operation can be completed and what approach should be taken. If the portal vein is invaded, a simple vascular resection and reconstruction or combined hepatectomy may increase the difficulty and complications of the operation. Unnecessary enlargement or radical changes due to intraoperative miscalculation can often occur because it is difficult to judge whether the close relationship between the hepatic portal vein and the tumor is caused by tumor invasion, or if it is only the tumor that causes the surrounding tissue to harden or leads to fibrosis resulting in benign adhesion to the portal vein. In cases where the portal vein is invaded and cannot be removed, the postoperative recurrence rate greatly increases.17 If the portal vein is removed without invasion, postoperative complications increase notably as a result of unnecessary surgical enlargement.18 Therefore, an accurate evaluation of hepatic portal vein invasion is a significant element of the preoperative evaluation of HCCA.
Multi-detector CT (MDCT), which is currently a commonly used technique, can effectively assess tumor-induced portal vein invasion. Moreover, spiral CT arteriography has become the gold standard for the diagnosis of portal vein lesions.19 However, there is no literature report on the positive and negative predictive value of the hepatic portal vein invasion thus far. The results of the present study show that, while there was no significant difference between the specificity and sensitivity of 3D visualization technology and CT techniques in assessing portal vein invasion, the positive predictive value of hepatic portal vein invasion estimated by radiologists via CT images was only 66.7%, whereas the corresponding value for 3D visualization technology was 90.9%. Furthermore, the negative predictive value of 3D visualization technology was 96.8%, and the overall accuracy was 90.5%, which were both more accurate than the radiologists’ assessment based on CT images. Among the 15 patients with portal vein invasion estimated by the CT method, 5 were not found to have portal vein invasion by postoperative pathology. All 5 of these patients underwent a radical hepatectomy to study intraoperative portal vein invasion, which undoubtedly increased the incidence of postoperative complications. When assessing lesions via CT, radiologists can only judge the positioning of the lesions and their spatial relationship with the surrounding tissues by observing 2D images, which may also cause errors. In contrast, 3D visualization technology can show the lesion site on the stereoscopic level; therefore, it can greatly reduce the subjective errors made by radiologists. Through analyzing 3D visualization images, radiologists can calculate the ratio of the contact area between the tumor and portal vein to the circumferential area of the portal vein in this segment more accurately with a positive predictive value of up to 90.9% to examine whether the tumor has invaded the portal vein. This method has been shown to be much more accurate than the CT-based technique; therefore, it can play a significant role in preventing unnecessary surgery enlargement. Of course, this article summarizes the small number of patient cases, and more cases are needed to study the results in depth.
Conclusions
The positive predictive value of 3D visualization technology in assessing whether the hepatic portal vein has been invaded is significantly higher than that of subjective assessments by radiologists based on CT scans. Therefore, quantitative measurement of the tumor–portal vein contact area by 3D visualization technology has guiding significance for preoperative determination of the resection range and surgery options for HCCA.
Acknowledgments
We are particularly grateful to all the people who have given us help on our article.
Funding
There is no funding to report.
Disclosure
The authors declare that they have no competing interests for this work.
References
1. Anderson B, Doyle MBM. Surgical considerations of hilar cholangiocarcinoma. Surg Oncol Clin N Am. 2019;28:601–617. doi:10.1016/j.soc.2019.06.003
2. Chinese anti-cancer association of China. Guideline for the diagnosis and therapy of hilar cholangiocarcinoma. Chin J Hepatob Surg. 2015;21:505–511.
3. Gaignard E, Bergeat D, Stock N, et al. Portal vein leiomyosarcoma: a rare case of hepatic hilar tumor with review of the literature. Indian J Cancer. 2019;56:83–85. doi:10.4103/ijc.IJC_199_18
4. Mansour JC, Aloia TA, Crane CH, et al. Hilar cholangiocarcinoma: expert consensus statement. HPB (Oxford). 2015;17:691–699. doi:10.1111/hpb.12450
5. Khan AS, Dageforde LA. Cholangiocarcinoma. Surg Clin North Am. 2019;99:315–335. doi:10.1016/j.suc.2018.12.004
6. Miyazaki M, Yoshitomi H, Miyakawa S, et al. Clinical practice guidelines for the management of biliary tract cancers 2015: the 2ndEnglish edition. J Hepatobiliary Pancreat Sci. 2015;22:249–273.
7. Ogawa C, Minami Y, Morita M, et al. Prediction of embolization area after conventional transcatheter arterial chemoembolization for hepatocellular carcinoma using SYNAPSE VINCENT. Dig Dis. 2016;34:696–701. doi:10.1159/000448859
8. Hosokawa S, Kawai N, Sato M, et al. Comparison of air kerma between C-arm CT and 64-multidetector-row CT using a phantom. Jpn J Radiol. 2014;32:302–307. doi:10.1007/s11604-014-0297-x
9. Hui TC, Pua U. Arterial portography during transarterial chemoembolization: still a necessity in the age of contrast-enhanced cross-sectional imaging? J Vasc Interv Radiol. 2014;25:41–46. doi:10.1016/j.jvir.2013.10.014
10. Kumano S, Uemura M, Haraikawa T, et al. Efficacy of double arterial phase dynamic magnetic resonance imaging with the sensitivity encoding technique versus dynamic multidetector-row helical computed tomography for detecting hypervascular hepatocellular carcinoma. Jpn J Radiol. 2009;27:229–236. doi:10.1007/s11604-009-0327-2
11. Zeng N, Fang CH, Fan YF, et al. The construction of three-dimensional visualization platform and its application in diagnosis and treatment for hilar cholangiocarcinoma. Chin J Surg. 2016;54:680–685.
12. Chinese Society of Digital Medicine. Complex three-dimensional visualization of liver cancer expert consensus. Chin J Pract Surg. 2017;37:53–59.
13. Miura F, Okazumi S, Takayama W, et al. Evaluation of CT during arterial portography for preoperative diagnosis of intrahepatic cholangiocarcinoma. Hepatogastroenterology. 2006;53:435–437.
14. Digital medicine branch of Chinese medical association, Liver cancer professional committee of Chinese medical doctors association, Professional committee of clinical precision medicine of Chinese medical doctors association, Professional committee of clinical precision medicine of Chinese medical doctors association, et al. Guidelines for accurate diagnosis and treatment of complex liver tumors with three-dimensional visualization. Chin J Pract Surg. 2019;39:766–774.
15. Köseoğlu K, Taşkin F, Ozsunar Y, Cildağ B, Karaman C. Transient hepatic attenuation differences at biphasic spiral CT examinations. Diagn Interv Radiol. 2005;11:96–101.
16. Nagakawa T, Kitagawa H, Kayahara M. Spreading patterns of hilar bile duct cancer. Nippon Geka Gakkai Zasshi. 2000;101:399–403.
17. Jonas S, Steinmuller T, Neuhaus P. Surgical therapy of liver hilustumors. Chirurg. 2001;72:775–783. doi:10.1007/s001040170105
18. Nagino M, Kamiya J, Uesaka K, et al. Complications of hepatectomy for hilar cholangiocarcinoma. World J Surg. 2001;25:1277–1283. doi:10.1007/s00268-001-0110-8
19. Ruys AT, Van Beem BE, Engelbrecht MR, et al. Radiological staging in patients with hilar cholangiocarcinoma: a systematic review and metaanalysis. Br J Radiol. 2012;85:1255–1262. doi:10.1259/bjr/88405305
 © 2020 The Author(s). This work is published and licensed by Dove Medical Press Limited. The full terms of this license are available at https://www.dovepress.com/terms.php and incorporate the Creative Commons Attribution - Non Commercial (unported, v3.0) License.
By accessing the work you hereby accept the Terms. Non-commercial uses of the work are permitted without any further permission from Dove Medical Press Limited, provided the work is properly attributed. For permission for commercial use of this work, please see paragraphs 4.2 and 5 of our Terms.
© 2020 The Author(s). This work is published and licensed by Dove Medical Press Limited. The full terms of this license are available at https://www.dovepress.com/terms.php and incorporate the Creative Commons Attribution - Non Commercial (unported, v3.0) License.
By accessing the work you hereby accept the Terms. Non-commercial uses of the work are permitted without any further permission from Dove Medical Press Limited, provided the work is properly attributed. For permission for commercial use of this work, please see paragraphs 4.2 and 5 of our Terms.