")
Back to Journals » Diabetes, Metabolic Syndrome and Obesity » Volume 16
The Application of the Insulin to C-Peptide Molar Ratio (ICPR) in Primary Screening for Insulin Antibodies in Type 2 Diabetes Mellitus Patients: A Further Quantitative Study on the Relationship Between ICPR and Insulin Antibodies
Authors Hua KF , Jing BY , Wu YH
Received 20 January 2023
Accepted for publication 15 April 2023
Published 22 April 2023 Volume 2023:16 Pages 1121—1132
DOI https://doi.org/10.2147/DMSO.S404222
Checked for plagiarism Yes
Review by Single anonymous peer review
Peer reviewer comments 2
Editor who approved publication: Dr Konstantinos Tziomalos
Kai-Fang Hua,1,2 Bo-Yang Jing,3 Yan-Hui Wu1,4
1Department of Endocrinology, Xiang’an Hospital of Xiamen University, Xiamen, Fujian, People’s Republic of China; 2School of Medicine, Xiamen University, Xiamen, Fujian, People’s Republic of China; 3Hai Yuan College, Kunming Medical University, Kunming, Yunnan, People’s Republic of China; 4National Metabolic Management Center, Xiang’an Hospital of Xiamen University, Xiamen, Fujian, People’s Republic of China
Correspondence: Yan-Hui Wu, Department of Endocrinology, Xiang’an Hospital of Xiamen University, 2000 Xiang’ an East Road, Xiamen, Fujian, 361102, People’s Republic of China, Tel +8613089998806, Email [email protected]
Purpose: This study aimed to further quantify the relationship between insulin antibodies (IAs) and the 2-hour insulin to C-peptide molar ratio (2h-ICPR) using a multiple linear regression model in T2DM patients.
Methods: A total of 274 T2DM patients from April 2019 to December 2022 in Xiang’an Hospital of Xiamen University were included in this study. Multiple Linear Model Fitting was conducted on the candidate independent variables (age, BMI, HbA1c, and 2h-ICPR) for the multiple linear regression. The linear relationship between insulin antibodies (IAs) and the significant independent variables was presented by making multiple linear regression equations.
Results: The total demographic characteristics of the included patients were as follows: age (51.92± 13.10 years), BMI (24.94± 3.99 kg/m2), HbA1c (9.70± 2.39%), 2h-ICPR (0.12± 0.11), and IAs (0.37± 1.12COI). Linear relationships of independent variables: age (r=0.163, p=0.007), 2h-ICPR (r=0.259, p=0.001), BMI (r=0.007, p=0.907) and 2h-ICPR (r=0.092, p=0.129). Multiple linear regression: age (unstandardized β=0.014, 95% CI: 0.004– 0.024, p=0.004), 2h-ICPR (unstandardized β=2.758, 95% CI: 1.555– 3.962, p≤ 0.001). The regression equation: .
Conclusion: The quantitative relationship between 2h-ICPR and insulin antibodies was . 2h-ICPR can be a preliminary screening indicator for insulin antibody testing in patients with type 2 diabetes.
Keywords: insulin, insulin antibodies, C-peptide, multiple linear regression model
Plain Language Summary
The original research article aimed to find out how much insulin antibodies (IAs) are present in type 2 diabetes mellitus (T2DM) patients by studying their 2-hour insulin to C-peptide molar ratio (2h-ICPR) after an oral glucose tolerance test (OGTT). T2DM is a disease where the body has high blood glucose levels, and insulin is a medication used to lower blood glucose levels. However, insulin is not a natural substance in the body and can cause the immune system to produce antibodies that stop it from working properly. The previous study found a link between insulin antibodies (IAs) and the 2h-ICPR in T2DM patients but did not know how strong the link was. So, this research studied 274 T2DM patients and used a mathematical model to show how IAs were related to the patient’s age and 2h-ICPR. The formula this study came up with was  . This formula will help doctors predict how much insulin antibodies a T2DM patient has by looking at their 2h-ICPR, which is useful in primary hospitals that do not have the equipment to test for insulin antibodies.
Introduction
Diabetes mellitus (DM) is the third most prevalent chronic non-communicable disease in the world, and according to the International Diabetes Federation, it is predicted that the number of people with diabetes will reach 143 million in 2035, ranking first in the world.1 Type 2 diabetes mellitus (T2DM) is a group of metabolic diseases characterized by elevated plasma glucose levels, caused by insufficient insulin secretion or impaired insulin action. Insulin therapy is one of the most important treatments for diabetic patients and plays an important role in the treatment of diabetes mellitus, and it is one of the most used clinical drugs to control blood glucose.2
Exogenous insulin preparations are widely used in the clinical hypoglycemic treatment of patients with T2DM.3 However, multiple investigations have demonstrated that since the introduction of insulin therapy, various insulin preparations or analogs as exogenous proteins frequently cause insulin antibodies (IAs) in T2DM patients.4–6 IAs can appear in the body of patients after a period ranging from several weeks to several months of insulin application.7 While receiving treatment, these antibodies frequently cause glycemic swings and insulin resistance because they irreversibly bind or release insulin in unpredictable ways.8,9
In short, the existence of IAs reduces the effectiveness of exogenous insulin preparations at lowering blood glucose, creating a condition akin to insulin resistance.10 Patients who experience the phenomena of alternating blood glucose frequently experience daytime hyperglycemia and overnight hypoglycemia,11,12 and their blood glucose swings substantially and is challenging to control.13 The combination of the above characteristics manifests as exogenous insulin antibody syndrome (EIAS).14 For the clinical diagnosis of EIAS, the positive serum insulin antibody test is the main diagnostic standard for exogenous insulin antibody syndrome. However, the cost of the detecting apparatus and equipment prevents most primary hospitals from having the necessary testing conditions at present.10
According to existing studies, the elevated insulin and C-peptide changes in IA-positive patients show a disproportionate phenomenon,15,16 and the insulin to C-peptide molar ratio (ICPR) has been recommended by some scholars as a method to diagnose insulin antibodies,17 and also helps to diagnose hypoglycemia caused by exogenous insulin antibodies.18 ICPR is a measure of the endocrine function of the pancreas islets,15 its association with IAs is not fully supported by clinical evidence, Chinese domestic case populations have received less research, and there is no agreed-upon diagnostic consensus. To quantitative analyze the relationship between ICPR and IAs, our preliminary study19 used the positive and negative of IA as a dichotomous index, and the diagnostic receiver operating characteristic curve (ROC curve) was used to analyze the predictive value of the ICPR for IA, and the results showed that the area under the ROC curve for 2-hour ICPR (2h-ICPR) prediction of IA in the oral glucose tolerance test (OGTT) was 0.735, (Se=0.760, Sp=0.635, the optimal cut-off point was 0.11), indicating that 2h-ICPR has a good predictive ability for the presence of IAs. When 2h-ICPR>0.11, it indicates that IA is likely to exist in patients, and the higher the value, the higher the possibility of IA positivity in T2DM patients.
However, because of the constraints of objective conditions in the pre-experimental period, we only qualitatively rather than quantitatively examined the association between 2-hour ICPR and IAs, and the sample size was small, which may have had an impact on the accuracy and reliability of the results. Therefore, based on the previous study, we further analyze the relevant factors affecting IAs in T2DM patients by multiple linear regression (MLR) model in the current study to verify the quantitative relationship between 2-hour ICPR and IAs.
Materials and Methods
Study Design
This retrospective study is in accordance with the Declaration of Helsinki,20 and the ethics of this study has been reviewed and approved by the Medical Research Ethics Committee of Xiang’an Hospital of Xiamen University, and all enrolled patients agreed to participate in this study, and signed the informed consent form.
Patients from April 2019 to December 2022 who were hospitalized in the Department of Endocrinology at the National Standardized Metabolic Disease Management Center, Xiang’an Hospital of Xiamen University, and diagnosed with T2DM were selected.
Inclusion criteria: (1) Meet the 2017 edition of the Chinese Guidelines for the Prevention and Treatment of T2DM or the diagnostic criteria for T2DM established by the World Health Organization (WHO),21 and patients may present with or without typical diabetes symptoms of irritable thirst, polyuria, polyphagia, and unexplained weight loss, along with abnormal blood glucose values. The WHO diagnostic criteria for T2DM are as follows:
Fasting plasma glucose (FPG) level of 7.0 mmol/L (126 mg/dL) or higher. Fasting is defined as no caloric intake for at least 8 hours and 2-hour plasma glucose (2-h PG) level of 11.1 mmol/L (200 mg/dL) or higher during OGTT. The test should be performed using a glucose load containing the equivalent of 75 g anhydrous glucose dissolved in water; A random plasma glucose (RPG) level of 11.1 mmol/L (200 mg/dL) or higher, in the presence of symptoms such as polyuria, polydipsia, and unexplained weight loss; In addition, individuals with a HbA1c (glycated hemoglobin A1c) level of 6.5% or higher are also considered to have diabetes. (1) Patients with asymptomatic and abnormal blood glucose need to be examined again. (2) Patients with definite use of exogenous insulin preparations who have been on insulin therapy for more than 3 months, with or without oral anti-diabetic medications. (3) All patients were between 15 and 80 years of age. (4) BMI (body mass index) between 18 and 35 kg/m2. (5) HbA1c ≥6.5% (6) The results of an insulin antibody titer test must be available, along with other data. (7) At least one OGTT was performed during hospitalization.
Exclusion criteria: anyone with one of the following conditions was excluded from the study.(1) patients without insulin antibody titer test; (2) patients with acute complications of combined diabetes; (3) patients with clear diagnosis of type 1 diabetes or other types of diabetes such as positive glutamic acid decarboxylase antibody (GADA) and positive islet cell autoantibody (ICA); (4) patients with combined malignant tumor and infectious diseases; (4) patients with combined cardiovascular, cerebrovascular and other serious chronic diseases; (5) patients with autoimmune diseases such as systemic lupus erythematosus, rheumatoid arthritis, systemic vasculitis, thyroid autoimmune disease, scleroderma, etc; (6) patients with other serious diseases of the digestive, respiratory and hematological systems; (7) patients during pregnancy, lactation or long-term use of contraceptives; (8) patients with severe hepatic and renal insufficiency; (9) patients with long-term use of immunosuppressive drugs; (9) patients with recent application of drugs affecting uric acid metabolism such as furosemide; (10) recent application of drugs affecting uric acid metabolisms such as furosemide, and hydrochlorothiazide; (11) patients with recent trauma, infection, surgery, and other stressful events.
It should be noted that for the confounding factors of this retrospective study, we restricted the enrolled patients mainly by their conditions, such as age, BMI, duration of insulin administration, and first OGTT data during hospitalization. Both inclusion and exclusion criteria were lost to eliminate confounding factors as much as possible.
Data Collection
We routinely perform an OGTT and an IA test on all patients admitted to the hospital prior to treatment on the one hand and subsequent treatment planning on the other. This is also the source of our data for this study, and the focus of our data collection and screening efforts, to exclude as much as possible the effects of insulin therapy and glucose-lowering drugs on blood glucose and insulin levels.
After the patient was admitted to the hospital, the supervising physician completed all physical examinations and related basic data for this study. All laboratory tests were completed at the Department of Laboratory Medicine, Xiang’an Hospital of Xiamen University. The procedure for the OGTT was as follows:22 all patients were asked to maintain a normal diet and avoid fatty foods for 3 days prior to the OGTT and to suspend all glucose-lowering therapy for 1 day prior to the OGTT. Patients were fasted (fasted for 8 hours) prior to the OGTT, kept quiet, and received 75 g of anhydrous glucose orally. Venous blood was collected on a fast (0 hours), 0.5 hours, 1 hour, and 2 hours after glucose loading, and blood glucose was measured at each time point. Blood glucose was measured by the hexokinase method. To evaluate basic glucose regulation and the impact of insulin therapy, the majority of the oral glucose tolerance tests for our inpatients were chosen from inpatients receiving insulin therapy. If a patient underwent multiple OGTTs during different hospitalizations, we selected the earliest test results based on the medical record system.
We measured height and weight and calculated BMI (weight [kg]/height2 [m2]), and measured HbA1c levels by high-performance liquid chromatography using an automated analyzer (D-10, Bole, USA). Serum insulin and C-peptide concentrations were measured by electrochemiluminescence immunoassay using an automated analyzer (Cobas e801, Roche, Germany). Serum glucose levels were measured by hexokinase assay using an automated analyzer (Cobas e702, Roche, Germany). Serum insulin antibodies were measured by radioimmunoassay (Zhongke Zhongjia GC-1500 reagent: Northern Institute of Biotechnology, Beijing, China).
American Medtronic insulin pump (type 712) is used mostly for inpatient insulin preparations. The titer of the IA was quantified, and the instrument determined an IA-positive status when the titer of the insulin antibody exceeded 1.1 COI. ICPR was calculated as insulin (pmol/L)/C-peptide (nmol/L) × 1000.
Statistical Analysis
Original data storage and collation were performed in Microsoft Excel. SPSS (version 22.0, Chicago, IL, USA) was used for descriptive statistics and MLR analysis of the data. RStudio software (version 1.4.1717) was used for data visualization. Most of the data were continuous variables, including age, BMI, HbA1c, serum glucose, insulin, C-peptide, and IAs. Unstandardized coefficients are used in the equations of the multiple linear regression model. Normally distributed data were expressed as mean ± standard deviation while non-normally distributed variables were expressed as the median (interquartile range), and bilateral truncated p < 0.05 were deemed statistically significant for use in statistical analysis.
Multiple Linear Regression Analysis Steps
MLR model was to describe the linear relationship between a dependent variable and multiple independent variables by making multiple linear regression equations.23 We performed multiple linear regression analysis as follows:
Determination of Dependent and Independent Variables
Based on our previous study,19 we found that 2h-ICPR in OGTT has a high predictive value for IAs in T2DM patients. What’s more, it is well known that people with high BMI have a significantly increased risk of developing diabetes and that obesity increases the risk of developing type 2 diabetes with a much greater effect than even genetics.24 Age is also a risk factor for diabetes.25 Studies also suggest HbA1c is associated with diabetic autoimmunity.11,26,27 Considering the above possible factors associated with IA production, we primarily examined the relationship between insulin antibody titers and age, BMI, HbA1c, and 2h-ICPR to analyze the relationship between insulin antibody titers and the above-mentioned relevant factors in T2DM patients while considering the differences in the fundamental characteristics of each patient.
Screening of the Candidate Independent Variables for the MLR
We conducted univariate linear regression analysis for screening the four candidate independent variables for MLR. We performed Pearson coefficient analysis for each independent variable (explanatory variable) with IA (dependent variable) one by one.
Multiple Linear Model Fitting
Multiple linear regression analysis was conducted using SPSS (version 22.0, Chicago, IL, USA). The parameters are set as follows: Method: Enter, Confidence intervals:95%, Predicted Values: Unstandardized. Residual fit plots are used to interpret whether the linear relationship is satisfied, while normal Q-Q plots are used for normality testing. We analyzed the model fit by R-squared values, and we could analyze the variance inflation factor (VIF) values to determine whether the model had multiple collinearities. Further, we analyzed the results of different independent variables (age, BMI, HbA1c, 2h-ICPR) by SPSS software. The significance of the effect of different independent variables on IA titers was analyzed by SPSS results, as well as analyzed in step (2). There was a significant relationship on IA if it showed significance (p-value <0.05), and then the direction of the influence relationship was specifically analyzed.
Interpreting Multiple Linear Model Results
The interpretation of the model results includes three parts: judging the degree of fit of the linear regression model, the interpretation of the regression coefficients, and the predicted dependent variables (IA). We will predict IA titers from the results of the MLR model initially by the equation derived from 2h-ICPR as well as other independent variables.
Results
Baseline Characteristics of Patients with T2DM
A total of 673 patients who were hospitalized and diagnosed with T2DM at the Department of Endocrinology, National Standardized Metabolic Disease Management Center, Xiang’an Hospital of Xiamen University from April 2019 to December 2022 were systematically retrospectively screened in this study, among which a total of 317 patients underwent OGTT, of which 43 patients were excluded due to the lack of quantitative IA test. A total of 274 patients with T2DM who met the study criteria were included from the retrospective study. The study process was illustrated in the flow chart (Figure 1). The hospital side standardized an insulin antibody titer >1.1 COI as the cut-off value for a positive insulin antibody test, so there were 19 insulin antibody-positive patients among the 274 included patients and the clinical baseline information of the patients in the 255 negative and 19 positive groups was characterized as Table 1 and Table 2. Baseline characteristics of all enrolled patients were as follows: age (51.92±13.10 years), BMI (24.94±3.99 kg/m2), HbA1c (9.70±2.39%), 2h-ICPR (0.12±0.11), and IAs (0.37±1.12COI).
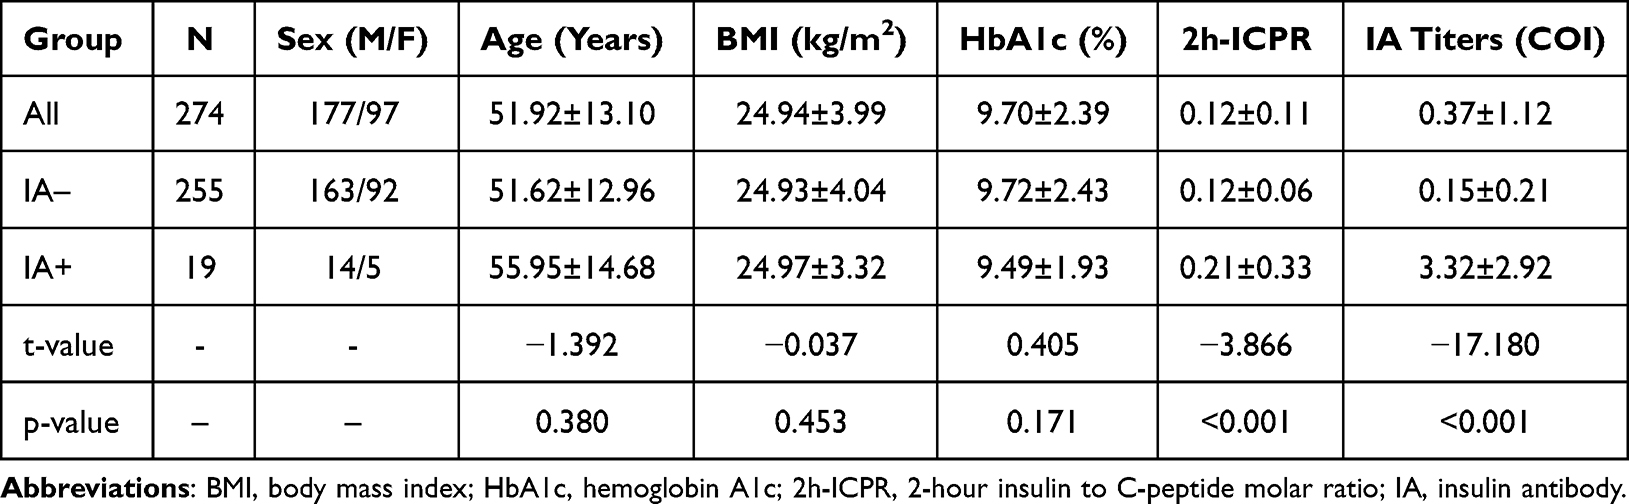 |
Table 1 Baseline Characteristics of the Included T2DM Patients ( |

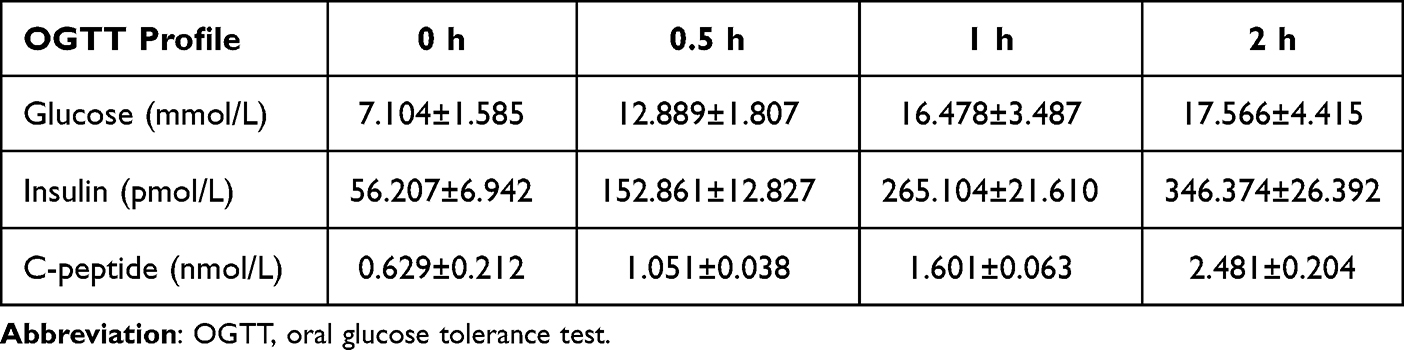 |
Table 2 OGTT Characteristics of All Included T2DM Patients ( |

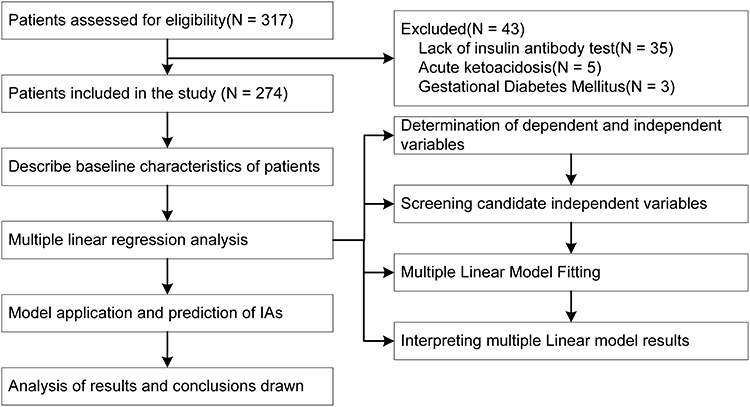 |
Figure 1 Flowchart for the study. |
The baseline characteristics of the included patients described in Table 1 show that there was no significant difference in age, BMI, and HbA1c between the two groups, but the 2h-ICPR in the OGTT was significantly higher in T2DM patients with IAs than in the negative group (P < 0.001), which further validates our previous finding that there is a relationship between 2h-ICPR and IA in patients with T2DM.
Variables Related to Insulin Antibody
As described in the Materials and Methods section, firstly by analyzing the Pearson coefficient of each variable individually (Figure 2), we can initially visualize that insulin antibodies are more associated with age (corr = 0.163) and 2h-ICPR (corr = 0.259), and less with HbA1c (corr = −0.092) and BMI (corr = −0.007). This is also similar to our results in Table 1 for the comparison of the two groups. Pearson coefficient analysis was conducted with insulin antibody as the dependent variable and age, BMI, HbA1c, and 2h-ICPR as the independent variables in included patients. Table 3 shows that in the univariate linear regression analysis, BMI and HbA1c were not statistically significant (p=0.907, p=0.129) and should be removed from the MLR model while age and 2h-ICPR were statistically significant (p=0.007, p=0.001).
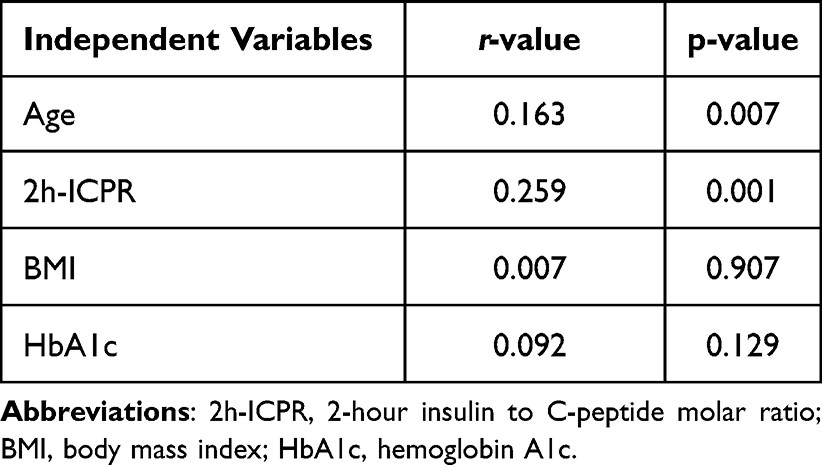 |
Table 3 Univariate Linear Regression Analysis Between IAs with Age, 2h-ICPR, BMI and HbA1c by Karl Pearson’s Coefficient |
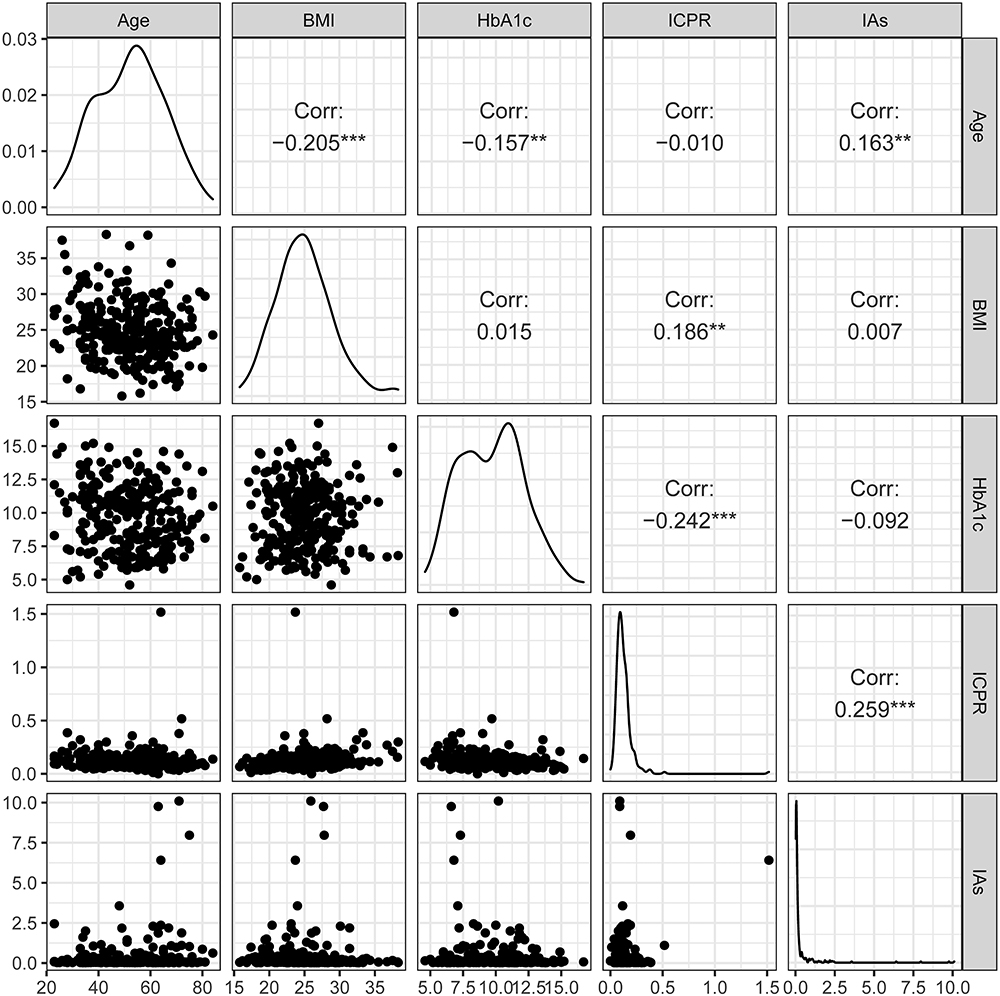 |
Figure 2 Univariate linear regression analysis between IAs with Age, 2h-ICPR, BMI and HbA1c. Abbreviations: 2h-ICPR, 2-hour insulin to C-peptide molar ratio; BMI, body mass index; HbA1c, hemoglobin A1c. Notes: **p<0.01;***p<0.001. |
Combining the results of candidate variable screening in Figure 2 and Table 3, we excluded BMI and HbA1c from the next step of the multiple linear regression model. Therefore, we conducted the MLR model of IA titers with age and 2-h ICPR.
Results of MLR of IA Titer with Age and 2h-ICPR
Multicollinearity Test
When performing linear regression analysis, the independent variables are prone to be correlated with each other, and we call this phenomenon multicollinearity. First, in the results of regression coefficients (Table 4), we diagnosed multicollinearity by VIF, and when the VIF ≤10, we considered that the data were consistent with the assumption of multiple linear analysis. In this study, the VIF corresponding to age and 2h-ICPR were both less than 10, allowing for multiple linear regression. Whether the normal distribution has a small impact on the results of multiple linear regression, generally we think that if the residual is the approximately normal distribution. Therefore, through the residual distribution diagram in Figure 3, we can consider that the data meet the assumptions of the MLR model.
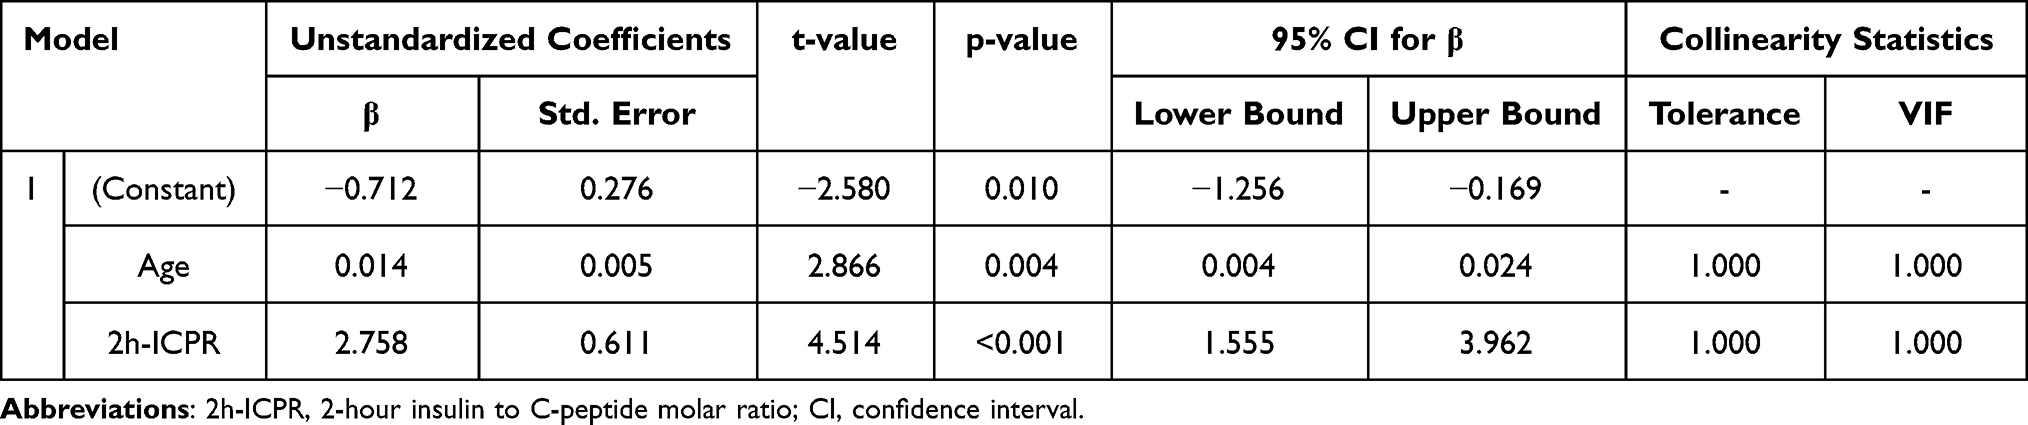 |
Table 4 Coefficients of the Multiple Linear Regression Analysis of IA Titers by 2h-ICPR and Age |
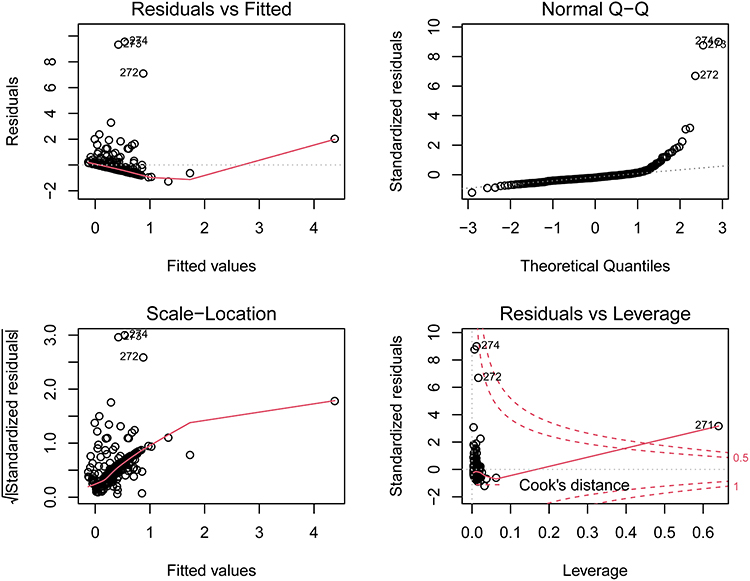 |
Figure 3 Hypothesis testing of multiple linear regression of IAs by 2h-ICPR and age. |
Statistical Tests of Models
Analysis of variance was performed on the model (Table 5), and the F-test revealed that the model passed the F-test (F=14.165, p<0.001), which means that at least one of age and 2h-ICPR would have a significant relationship with insulin antibodies.
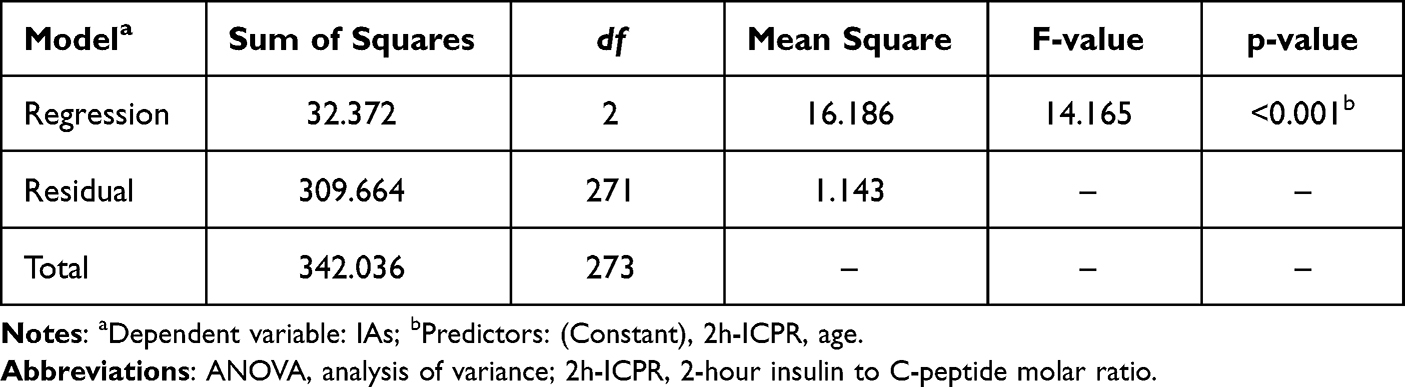 |
Table 5 ANOVA of Multiple Linear Regression Model Between IAs with Age and 2h-ICPR |
The Fit of the Linear Regression Model
The above results tentatively demonstrated the relationship between age, 2h-ICPR, and insulin antibodies. The model summary illustrated that the model R-squared value was 0.308, implying that age and 2h-ICPR can explain 30.8% of the variation in insulin antibodies.
Interpretation of Regression Coefficients
The regression equation of this study can be expressed as IAs = β0 + β1 × age + β2 × 2h-ICPR. β0 is the intercept, β1 and β2 represent the slope of the independent variable age and 2h-ICPR, respectively. The significance test for age and 2-h ICPR in the current study was both less than 0.05, β0=−0.712 (95% CI: −1.256–0.169, p=0.010), β1=0.014 (95% CI: 0.004–0.024, p=0.004), β2=2.758 (95% CI: 1.555–3.962, p≤0.001). So, the regression model was as follows:  (Table 4). From the model estimates (Figure 4) we can conclude that both age and 2h-ICPR positively affect insulin antibody titer (β1=0.014 and β2=2.758), implying that the older the age, the higher the 2h-ICPR and the higher the IA titers, and the effect of 2h-ICPR on IA titers is much greater than that of age.
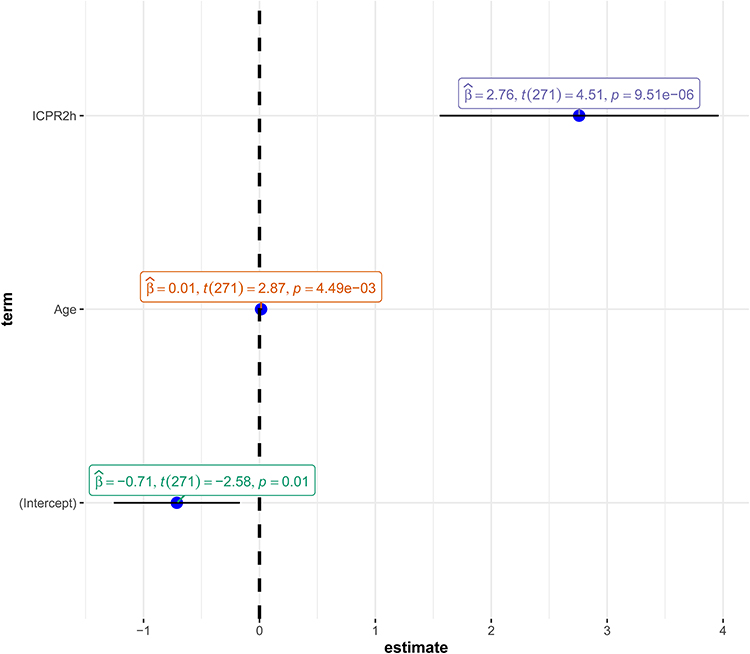 |
Figure 4 Estimates of multiple linear regression analysis of IAs by 2h-ICPR and age. Abbreviation: ICPR2h, 2-hour insulin to C-peptide molar ratio (2h-ICPR). |

Predicting the Dependent Variable
One of the main purposes of MLR analysis is to predict the dependent variable through the independent variables. In this study, the reason why we developed regression models for IA quantification with age and 2-h ICPR was to initially predict patients’ insulin antibody titers from these independent variables as an alternative to expensive and complex assays. We can calculate the predicted value of insulin antibodies based on the regression equation. For example, the 2h-ICPR in the OGTT of a 60-year-old patient with T2DM who has been receiving insulin therapy for a long time is 250 pmol/L and 2.00 nmol/L, respectively, so the 2h-ICPR is 0.125, and the IA titers can be initially predicted to be 0.472 COI by substituting into the formula model. Again, the predicted values and 95% confidence intervals can be calculated by SPSS software, and it is necessary to note that the 95% CI mentioned here is the 95% CI of the mean, and not the 95% CI of the individual values.
Discussion
The current study further elaborated on the quantitative relationship between IA titers and the disproportionality of serum insulin and C-peptide in T2DM patients, to theoretically quantify the presence of insulin antibody interference by 2-h ICPR quantitative analysis.
Analysis of Results
In the current quantitative study, the regression equation was as follows:  . The slope β of 2h-ICPR was 2.758 (95% CI: 1.555–3.962, p≤0.001), indicating that for every 1 increase in 2h-ICPR, the IA titers increased by 2.758 COI. From another perspective, the results of this study are consistent with the theoretical analysis that an increase in 2h-ICPR tends to suggest the production of IAs. It is also important to note that this relationship between the change in IA titers and 2h-ICPR was calculated by controlling for several other independent variables. In addition, we can also perform some operations on the slope. For example, we wish to calculate the change in IAs in T2DM for every twofold increase in 2h-ICPR by simply taking the slope 2.758*2. That is, every twofold increase in 2h-ICPR suggests an increase in IA titers of 5.516 COI. In addition, as age increases, the function of pancreatic islet cells gradually declines, which means that the probability of developing type 2 diabetes increases significantly.28 As for age, the longer type 2 diabetes has existed, the more exogenous insulin preparations have been used for longer periods, which increases the likelihood of inducing IAs in the immune system.29 Given the aforementioned factors, age may be indirectly associated with insulin antibody titers by relating to the length of T2DM courses in patients with IAs.
IA is linked to several variables,30 and some research has revealed that the likelihood of IA positivity in T2DM patients receiving insulin rises with longer diabetes duration, higher cholesterol levels,31 and lower HDL levels. The theoretical relationship between the 2-hour ICPR and variations in insulin antibody titers is valid. This may be related to the time of insulin action under glucose stimulation. In IA-positive T2DM patients, the binding of insulin antibodies to endogenous insulin takes some time, which makes the serum insulin and C-peptide levels appear inconsistently elevated to a certain extent only after a certain period. 2h-ICPR shows more relationship with IAs in OGTT. This is also consistent with the fact that patients with IAs rarely experience short-term dramatic glucose fluctuations, and most of them tend to have nighttime hypoglycemia and daytime hyperglycemia.32
On the one hand, exogenous insulin-induced production of IA binds to exogenous and endogenous insulin and diminishes insulin action, As a result, postprandial blood glucose levels are elevated, and effective glycemic control is challenging, leading to severe hyperglycemia, resistance to high-dose insulin therapy, and unexpected hypoglycemic events.33 On the other hand, insulin-antibody complexes can be regarded as the “reserve pool” of insulin.34 The normal or decreasing level of free insulin allows the body to continuously synthesize and release insulin, resulting in an increase in the total amount of insulin in the body. These complexes are released irregularly at night due to pH changes in the body, resulting in large fluctuations in free insulin levels and thus large fluctuations in blood glucose.35
This study focused on patients with IA positivity induced by the use of exogenous insulin, while more research is still required to investigate IA-positive cases linked to the use of sulfur-containing medications,36 induction of viral infections and various autoimmune diseases.37 Fasting insulin levels have also been used as a marker to screen for insulin antibodies since people with positive IAs frequently have hyperinsulinemia.38 It has also been proposed that exogenous IA levels are inversely proportional to C-peptide levels, indicating that C-peptide levels are protective factors for positive IAs.39 Since C peptide does not cross-react with insulin antibodies and is not interfered with by IAs, and exogenous insulin does not contain C peptide, the determination of ICPR may not only be used for the prediction of insulin antibodies but also be important for the clinical diagnosis of insulin autoimmune syndrome in the future,40 as well as help to identify insulin resistance.41
Advantages and Limitations
The results of previous studies have innovatively confirmed the relationship between the 2h-ICPR and IAs in OGTT, while this study using linear regression analysis further clarifies the quantitative relationship between IAs and 2h-ICPR. Currently, many primary care units lack the requisite testing facilities because of the high costs of laboratory equipment, hardware requirements, and technicians needed for IA determination. If the determination of 2h-ICPR in OGTT can be promoted as a primary screening indicator for IAs in T2DM patients, it will help physicians using 2h-ICPR to predict the presence of IAs more easily and accurately. For patients receiving insulin therapy, it is crucial to perform an OGTT for a preliminary evaluation of the presence of IAs by estimated 2h-ICPR as well as other indicators when the treatment impact is subpar and blood glucose is difficult to manage as the symptoms such as EIAS.
This study has certain limitations as well. To get more precise IA assessment criteria, the study’s sample size needs to be increased to collect multi-center patient data, particularly the positive data of T2DM patients. Furthermore, more non-insulin antibody-positive T2DM patients using insulin preparations are being enrolled to determine a relatively normal reference interval for 2h-ICPR.
Conclusions
In our current study of quantitative analysis of insulin antibodies and 2h-ICPR with a multiple linear regression model, the quantitative relationship between 2h-ICPR and insulin antibodies was  . 2h-ICPR can be a preliminary screening indicator for insulin antibody testing in T2DM patients.
Abbreviations
DM, diabetes mellitus; T2DM, type 2 diabetes mellitus; IA, insulin antibody; EIAS, exogenous insulin antibody syndrome; ICPR, insulin to C-peptide molar ratio; ROC curve, receiver operating characteristic curve; 2h-ICPR, 2-hour insulin to C-peptide molar ratio; OGTT, oral glucose tolerance test; Se, sensitivity; Sp, specificity; MLR, multiple linear regression; WHO, World Health Organization; FPG, fasting plasma glucose; RPG, random plasma glucose; HbA1c, glycated hemoglobin A1c; BMI, body mass index; VIF, variance inflation factor.
Acknowledgments
The authors would like to thank all the patients who participated in this study gratefully.
The work was supported by the Special Fund for Introducing High-level Health Talents in Xiamen (code number PM202204140001), the 2021 Xiamen Health Care Guideline Project (code number 3502Z20214ZD1137), and the XMU Training Program of Innovation and Entrepreneurship for Undergraduates (grant number S202210384849).
Author Contributions
All authors made a significant contribution to the work reported, whether that is in the conception, study design, execution, acquisition of data, analysis, and interpretation, or in all these areas; took part in drafting, revising or critically reviewing the article; gave final approval of the version to be published; have agreed on the journal to which the article has been submitted; and agree to be accountable for all aspects of the work.
Disclosure
The authors report no conflicts of interest in this work.
References
1. Tomic D, Shaw JE, Magliano DJ. The burden and risks of emerging complications of diabetes mellitus. Nat Rev Endocrinol. 2022;18(9):525–539. doi:10.1038/s41574-022-00690-7
2. Wilson LM, Castle JR. Recent advances in insulin therapy. Diabetes Technol Ther. 2020;22(12):929–936. doi:10.1089/dia.2020.0065
3. Fineberg SE, Kawabata TT, Finco-Kent D, Fountaine RJ, Finch GL, Krasner AS. Immunological responses to exogenous insulin. Endocr Rev. 2007;28(6):625–652. doi:10.1210/er.2007-0002
4. Shen Y, Song X, Ren Y. Insulin autoimmune syndrome induced by exogenous insulin injection: a four-case series. BMC Endocr Disord. 2019;19(1):148. doi:10.1186/s12902-019-0482-0
5. Oak S, Phan T-HT, Gilliam LK, Hirsch IB, Hampe CS. Animal insulin therapy induces a biased insulin antibody response that persists for years after introduction of human insulin. Acta Diabetol. 2010;47(2):131–135. doi:10.1007/s00592-009-0135-2
6. Lee YY, Lin CW, Chen IW. Exogenous insulin injection-induced stiff-person syndrome in a patient with latent autoimmune diabetes: a case report and literature review. Front Endocrinol. 2020;11:594. doi:10.3389/fendo.2020.00594
7. Xiao Y, Li X, Chao C, et al. Severe insulin resistance due to insulin antibodies. J Diabetes. 2018;10(7):611–613. doi:10.1111/1753-0407.12657
8. Kalant N, Gomberg C, Schucher R. The effect of insulin-binding antibodies on insulin sensitivity. Lancet. 1958;2(7047):614–617. doi:10.1016/s0140-6736(58)90337-4
9. Barnett AH, Lange P, Dreyer M, Serdarevic-Pehar M. Long-term tolerability of inhaled human insulin (Exubera) in patients with poorly controlled type 2 diabetes. Int J Clin Pract. 2007;61(10):1614–1625. doi:10.1111/j.1742-1241.2007.01522.x
10. Gordis E. Detection of insulin-binding antibodies and separation of free and antibody-bound insulin by rapid chemical procedure. Proc Soc Exp Biol Med. 1960;103(3):542–544. doi:10.3181/00379727-103-25589
11. Elias D, Cohen IR, Schechter Y, Spirer Z, Golander A. Antibodies to insulin receptor followed by anti-idiotype. Antibodies to insulin in child with hypoglycemia. Diabetes. 1987;36(3):348–354. doi:10.2337/diabetes.36.3.348
12. Rosenstock J, Zinman B, Murphy LJ, et al. Inhaled insulin improves glycemic control when substituted for or added to oral combination therapy in type 2 diabetes: a randomized, controlled trial. Ann Intern Med. 2005;143(8):549–558. doi:10.7326/0003-4819-143-8-200510180-00005
13. Ishizuka T, Ogawa S, Mori T, et al. Characteristics of the antibodies of two patients who developed daytime hyperglycemia and morning hypoglycemia because of insulin antibodies. Diabetes Res Clin Pract. 2009;84(2):e21–e23. doi:10.1016/j.diabres.2009.02.007
14. Hu X, Chen F. Exogenous insulin antibody syndrome (EIAS): a clinical syndrome associated with insulin antibodies induced by exogenous insulin in diabetic patients. Endocr Connect. 2018;7(1):R47–R55. doi:10.1530/EC-17-0309
15. Censi S, Mian C, Betterle C. Insulin autoimmune syndrome: from diagnosis to clinical management. Ann Transl Med. 2018;6(17):335. doi:10.21037/atm.2018.07.32
16. Barnett AH, Dreyer M, Lange P, Serdarevic-Pehar M. An open, randomized, parallel-group study to compare the efficacy and safety profile of inhaled human insulin (Exubera) with glibenclamide as adjunctive therapy in patients with type 2 diabetes poorly controlled on metformin. Diabetes Care. 2006;29(8):1818–1825. doi:10.2337/dc05-1880
17. Lebowitz MR, Blumenthal SA. The molar ratio of insulin to C-peptide. An aid to the diagnosis of hypoglycemia due to surreptitious (or inadvertent) insulin administration. Arch Intern Med. 1993;153(5):650–655. doi:10.1001/archinte.1993.00410050082011
18. Quan H, Tan H, Li Q, Li J, Li S. Immunological hypoglycemia associated with insulin antibodies induced by exogenous insulin in 11 Chinese patients with diabetes. J Diabetes Res. 2015;2015:746271. doi:10.1155/2015/746271
19. Hua KF, Zhang MY, Zhang Y, Ren BJ, Wu YH. Characteristics of OGTT and correlation between the insulin to C-peptide molar ratio, HOMA-IR, and insulin antibodies in T2DM patients. Diabetes Metab Syndr Obes. 2022;15:2417–2425. doi:10.2147/DMSO.S373475
20. World Medical A. World medical association declaration of Helsinki: ethical principles for medical research involving human subjects. JAMA. 2013;310(20):2191–2194. doi:10.1001/jama.2013.281053
21. Colagiuri S, Falavigna M, Agarwal MM, et al. Strategies for implementing the WHO diagnostic criteria and classification of hyperglycaemia first detected in pregnancy. Diabetes Res Clin Pract. 2014;103(3):364–372. doi:10.1016/j.diabres.2014.02.012
22. Bartoli E, Fra GP, Carnevale Schianca GP. The oral glucose tolerance test (OGTT) revisited. Eur J Intern Med. 2011;22(1):8–12. doi:10.1016/j.ejim.2010.07.008
23. Kicsiny R. Improved multiple linear regression based models for solar collectors. Renew Energy. 2016;91:224–232. doi:10.1016/j.renene.2016.01.056
24. Schnurr TM, Jakupovic H, Carrasquilla GD, et al. Obesity, unfavourable lifestyle and genetic risk of type 2 diabetes: a case-cohort study. Diabetologia. 2020;63(7):1324–1332. doi:10.1007/s00125-020-05140-5
25. Bellary S, Kyrou I, Brown JE, Bailey CJ. Type 2 diabetes mellitus in older adults: clinical considerations and management. Nat Rev Endocrinol. 2021;17(9):534–548. doi:10.1038/s41574-021-00512-2
26. Jansson AK, Chan LX, Lubans DR, Duncan MJ, Plotnikoff RC. Effect of resistance training on HbA1c in adults with type 2 diabetes mellitus and the moderating effect of changes in muscular strength: a systematic review and meta-analysis. BMJ Open Diabetes Res Care. 2022;10(2):e002595. doi:10.1136/bmjdrc-2021-002595
27. Zhu J, Yuan L, Ni WJ, Luo Y, Ma JH. Association of higher circulating insulin antibody with increased mean amplitude glycemic excursion in patients with type 2 diabetes mellitus: a cross-sectional, retrospective case-control study. J Diabetes Res. 2019;2019:7304140. doi:10.1155/2019/7304140
28. Liu LH, Xu LJ, Ke WJ, et al. Time-in-range during short-term intensive insulin therapy is associated with clinical outcomes in patients with newly diagnosed type 2 diabetes. Diabetes. 2020;69:2. doi:10.2337/db20-1032-P
29. Chen P, Ma X, Chen H, Wang K, Zhou L. Delays in insulin initiation among patients with type 2 diabetes mellitus in southeast china: a retrospective, real-world study. Diabetes Metab Syndr Obes. 2020;13:3059–3068. doi:10.2147/DMSO.S256381
30. Wong SL, Priestman A, Holmes DT. Recurrent hypoglycemia from insulin autoimmune syndrome. J Gen Intern Med. 2014;29(1):250–254. doi:10.1007/s11606-013-2588-9
31. Krysiak R, Kowalcze K, Okopien B. The impact of exogenous vitamin D on thyroid autoimmunity in euthyroid men with autoimmune thyroiditis and early-onset androgenic alopecia. Pharmacol Rep. 2021;73(5):1439–1447. doi:10.1007/s43440-021-00295-3
32. Zhao TY, Li F, Xiong ZY. Frequent reoccurrence of hypoglycemia in a type 2 diabetic patient with insulin antibodies. Mol Diagn Ther. 2010;14(4):237–241. doi:10.1007/bf03256379
33. Stumvoll M, Mitrakou A, Pimenta W, et al. Use of the oral glucose tolerance test to assess insulin release and insulin sensitivity. Diabetes Care. 2000;23(3):295–301. doi:10.2337/diacare.23.3.295
34. Boyko EJ, Keane EM, Marshall JA, Hamman RF. Higher insulin and C-peptide concentrations in Hispanic population at high risk for NIDDM. San Luis valley diabetes study. Diabetes. 1991;40(4):509–515. doi:10.2337/diab.40.4.509
35. Goldman J, Baldwin D, Rubenstein AH, et al. Characterization of circulating insulin and proinsulin-binding antibodies in autoimmune hypoglycemia. J Clin Invest. 1979;63(5):1050–1059. doi:10.1172/JCI109374
36. Ionescu-Tîrgovişte C, Mincu I, Simionescu L, et al. Disappearance rate of insulin antibodies after discontinuing insulin treatment in 42 type 2 (non-insulin-dependent) diabetic patients. Diabetologia. 1984;27(6):592–595. doi:10.1007/bf00276974
37. Hirai H, Ogata E, Kikuchi N, et al. The effects of liraglutide on both hypereosinophilic insulin allergy and the characteristics of anti-insulin antibodies in type 2 diabetes mellitus: a case report. J Med Case Rep. 2016;10:202. doi:10.1186/s13256-016-0994-4
38. Yuan T, Li J, Li M, et al. Insulin autoimmune syndrome diagnosis and therapy in a single Chinese center. Clin Ther. 2019;41(5):920–928. doi:10.1016/j.clinthera.2019.03.009
39. Jones AG, Hattersley AT. The clinical utility of C-peptide measurement in the care of patients with diabetes. Diabet Med. 2013;30(7):803–817. doi:10.1111/dme.12159
40. Iwase H, Kobayashi M, Nakajima M, Takatori T. The ratio of insulin to C-peptide can be used to make a forensic diagnosis of exogenous insulin overdosage. Forensic Sci Int. 2001;115(1–2):123–127. doi:10.1016/s0379-0738(00)00298-x
41. Kahleova H, Hlozkova A, Fleeman R, Fletcher K, Holubkov R, Barnard ND. Fat quantity and quality, as part of a low-fat, vegan diet, are associated with changes in body composition, insulin resistance, and insulin secretion. A 16-week randomized controlled trial. Nutrients. 2019;11(3):615. doi:10.3390/nu11030615
 © 2023 The Author(s). This work is published and licensed by Dove Medical Press Limited. The full terms of this license are available at https://www.dovepress.com/terms.php and incorporate the Creative Commons Attribution - Non Commercial (unported, v3.0) License.
By accessing the work you hereby accept the Terms. Non-commercial uses of the work are permitted without any further permission from Dove Medical Press Limited, provided the work is properly attributed. For permission for commercial use of this work, please see paragraphs 4.2 and 5 of our Terms.
© 2023 The Author(s). This work is published and licensed by Dove Medical Press Limited. The full terms of this license are available at https://www.dovepress.com/terms.php and incorporate the Creative Commons Attribution - Non Commercial (unported, v3.0) License.
By accessing the work you hereby accept the Terms. Non-commercial uses of the work are permitted without any further permission from Dove Medical Press Limited, provided the work is properly attributed. For permission for commercial use of this work, please see paragraphs 4.2 and 5 of our Terms.