")
Back to Journals » International Journal of Nanomedicine » Volume 14
The Application of Methylprednisolone Nanoscale Zirconium-Porphyrin Metal-Organic Framework (MPS-NPMOF) in the Treatment of Photoreceptor Degeneration
Authors Wang Y, Liu W , Yuan B, Yin X, Li Y, Li Z , Cui J, Yuan X, Li Y
Received 5 August 2019
Accepted for publication 13 November 2019
Published 10 December 2019 Volume 2019:14 Pages 9763—9776
DOI https://doi.org/10.2147/IJN.S225992
Checked for plagiarism Yes
Review by Single anonymous peer review
Peer reviewer comments 3
Editor who approved publication: Professor Lei Yang
Yajie Wang,1,2,* Wei Liu,3,4,* Bo Yuan,1,2 Xuebo Yin,3 Yiming Li,1 Zongjin Li,1 Jianlin Cui,1 Xiaoyong Yuan,2 Yuhao Li1,5
1Tianjin Key Laboratory of Tumor Microenvironment and Neurovascular Regulation, Nankai University School of Medicine, Tianjin 300071, People’s Republic of China; 2Tianjin Eye Hospital, Tianjin Key Laboratory of Ophthalmology and Visual Science, Nankai University Eye Hospital, Tianjin 300020, People’s Republic of China; 3State Key Laboratory of Medicinal Chemical Biology, Tianjin Key Laboratory of Biosensing and Molecular Recognition, Nankai University College of Chemistry, Tianjin 300071, People’s Republic of China; 4Tianjin University School of Science, Tianjin 300072, People’s Republic of China; 5Tianjin Key Laboratory of Radiation Medicine and Molecular Nuclear Medicine, Tianjin 300192, People’s Republic of China
*These authors contributed equally to this work
Correspondence: Yuhao Li
Tianjin Key Laboratory of Tumor Microenvironment and Neurovascular Regulation, Nankai University School of Medicine, 94 Weijin Road, Tianjin 300071, People’s Republic of China
Tel +86 22 2350 2554
Email [email protected]
Xiaoyong Yuan
Tianjin Eye Hospital, Tianjin Key Laboratory of Ophthalmology and Visual Science, 4 Gansu Road, Tianjin 300020, People’s Republic of China
Tel +86 22 2731 3336
Email [email protected]
Background: Photoreceptor degeneration is one of the most refractory oculopathy in the world, leading to vision loss in severe cases. Methyprednisolone is one of the most commonly prescribed medications for the treatment of retinal degenerative diseases, either by oral administration or repeated intraocular injections. However, the efficacy was unsatisfactory due to its systemic or local side effects and short retention time within the retina.
Methods: Nanoscale zirconium-porphyrin metal-organic framework (NPMOF) was synthesized and characterized. The biotoxicity and imaging capability of NPMOF were evaluated using zebrafish embryos and larvae. NPMOF was then used as a skeleton and loaded with methylprednisolone (MPS) to prepare a novel kind of nanoparticle, MPS-NPMOF. Photoreceptor degeneration was induced by high-intensity light exposure in adult zebrafish. MPS-NPMOF was delivered to the injured retina by intraocular injection. The photoreceptor regeneration and its underlying mechanism were explored by immunohistochemistry, quantitative real-time polymerase chain reaction and behavioral test.
Results: NPMOF not only had low biotoxicity but also emitted bright fluorescence. Following a single MPS-NPMOF intraocular injection, the injured retina exhibited the faster photoreceptor regeneration with better visual function by promoting the cell proliferation.
Conclusion: NPMOF is an ideal carrier and could be applied in tracking and delivering medications. By intraocular injection, the novel drug delivery system, MPS-NPMOF, accomplishes the sustained release of drug and plays a therapeutic role in photoreceptor degeneration.
Keywords: nanoscale zirconium-porphyrin metal-organic framework, photoreceptor, degeneration, methylprednisolone, drug delivery
Introduction
Retinal degeneration is one of the leading causes of progressive blindness. In many human ocular diseases, such as retinitis pigmentosa and age-related macular degeneration, the death of photoreceptor cells was the principal event lacking curative treatment.1 Zebrafish is an excellent model of visual diseases, especially those involving dysfunction of photoreceptors, because their gene expression patterns, structure and function are remarkably similar to those of the human retina.2 The zebrafish model not only broadens our understanding of the genetics and signaling pathways underlying human ocular diseases but also provides novel insights for developing diagnostic and therapeutic approaches.
Glucocorticoids are among the most commonly prescribed drugs for the treatment of retinal diseases because of their anti-inflammatory, immunosuppressive and vasoconstrictive effects by systemic administration or intravitreous injection.3–5 Unfortunately, the use of glucocorticoids is limited by their undesirable effects.6,7 Therefore, there is an urgent need to optimize medication delivery. In the intraocular system, some nanoparticles can protect their cargo from rapid degradation, sustain the release period and penetrate physiological barriers, thus delivering the loaded drugs to specific tissues and cells by either passive or active targeting mechanisms.8,9 Porphyrin metal-organic frameworks (MOFs) are a class of porous materials composed of metal ions and organic ligands. On the one hand, these frameworks possess a large surface area, tunable porosity and robust stability. Their ultra-large channels can carry polycyclic drugs.10 On the other hand, they retain the photophysical properties of porphyrin and emit bright red fluorescence, which offers an approach to monitor and track the particles.11 Until now, little was known about the application of MOFs as intraocular carriers.
In this study, a nanoscale zirconium-porphyrin metal-organic framework (NPMOF) was synthesized and used as a skeleton. Methyprednisolone (MPS), a glucocorticoid medication, was then loaded to prepare a novel nanoparticle, MPS-NPMOF. Specifically, the following properties were determined: 1) physical and chemical characteristics of NPMOF; 2) in vivo biotoxicity and biodistribution of NPMOF; 3) uptake-release properties of MPS-NPMOF; and 4) the degeneration-regeneration of photoreceptors and functional changes following intraocular injection of MPS-NPMOF. To our knowledge, the present study is the first report on an NPMOF-based intraocular delivery system and creates an avenue to develop a new therapeutic approach for photoreceptor degeneration.
Materials and Methods
Synthesis and Characterization of NPMOF
NPMOF was synthesized by a slightly modified solvent-thermal method.11 Briefly, 10 mg of 5,10,15,20-tetrakis(4-carboxyl)-21H,23H-porphine (TCPP; TCI Shanghai Chemical Industry, China), 30 mg of zirconium chloride (ZrCl4; Alfa-Asia, Tianjin, China), 200 mg of benzoic acid (BA, 98.5%; Guangfu Fine Chemical Research Institute, Tianjin, China), 100 mg of cetyltrimethylammonium bromide (CTAB; Fuchen Reagent, Tianjin, China), 200 mg of polyethylene glycol M.W. 6000 (PEG-6000; Fuchen Reagent), and 10 mL of dimethylformamide (DMF; Concord Reagent, Tianjin, China) were mixed and dissolved by ultrasonication for 10 mins. The dark purple suspension was heated at 120 °C for 24 hrs in a 30-mL Teflon-lined steel-autoclave and subsequently cooled to room temperature. NPMOF was purified by centrifugation, washed with DMF, 100% ethanol, and ddH2O twice each and then dried by lyophilization. To obtain a 1 mg/mL NPMOF solution, NPMOF was re-suspended in 0.1 M phosphate buffered saline (PBS, pH 7.4; Sangon Biotech, China).
The morphology of NPMOF was observed using transmission electron microscopy (TEM, accelerating voltage=200 kV; Tecnai G2 F20, FEI, Hillsboro, USA) and scanning electron microscopy (SEM; JSM-7500F, JEOL, Tokyo, Japan). The structure of NPMOF was characterized by X-ray diffraction (XRD), N2 adsorption-desorption and pore-size distribution. XRD patterns were obtained by a D/max-2500 diffractometer (Rigaku, Tokyo, Japan) using Cu-Kα radiation (λ=1.5418 Å). N2 adsorption-desorption isotherms and the pore size distribution were tested with a Tristar 3000 at 77 K. The pore-size distribution was calculated by the Barrett, Joyner and Halenda (BJH) method according to the density functional theory (DFT) program. The composition of NPMOF was examined by thermogravimetric analysis (TGA), differential scanning calorimetry (DSC) and Fourier transform infrared (FTIR) spectroscopy (400–4000 cm−1). TGA was performed on a PTC-10ATG-DTA analyzer (Thermo plus EVO2 TG8121, Rigaku) heated from 20°C at a ramp rate of 10°C/min under air, and infrared spectra were obtained via a Bruker TENSOR 27 Fourier transform infrared spectrometer. The optical properties of NPMOF were revealed using a UV-2450-visible spectrophotometer (Shimadzu, Japan) and FL-4600 Fluorescence Spectrometer (Hitachi, Japan) equipped with a quartz cell (1 cm×1 cm).
Preparation of MPS-NPMOF
To prepare loaded nanoparticles, 10 mg of methylprednisolone (MPS; Adamas, China) was mixed with 5 mg of NPMOF in a 10 mL DMF solution under stirring for three days. After 2, 4, 8, 12, 24, 48, and 72 hrs of agitation, 0.5 mL of solution was centrifuged, and the supernatant was diluted and analyzed by UV-Vis spectrophotometry at 266 nm. The loading efficiency (LE) was calculated with the following equation:
(1)
where D indicates the drug. WD is the mass of MPS loaded in the NPMOF, and WMOF is the original mass of NPMOF. WD was calculated from the adsorption value at 266 nm.
After 72 h, the remaining mixture was centrifuged, dried and re-suspended in 0.1 M PBS to a concentration of 2 mg/mL MPS-NPMOF.
MPS release experiments were conducted by incubating 5 mg of MPS-NPMOF in 5 mL of 5% hyaluronic acid solution for three days to simulate the environment of the vitreous body. The amounts of released MPS in the supernatant were measured by fluorescence spectrophotometry at 430 nm after 4, 8, 12, 24, 48, and 72 hrs of agitation. The release efficiency (RE) was calculated with the following equation:
(2)
where WRE represents the mass of MPS released from MPS-NPMOF. WD means the mass of MPS loaded into NPMOF.
Experimental Animals
Wild-type zebrafish (AB strain) and transgenic zebrafish Tg (lysC:EGFP) (a gift from Dr. Yao) were used in this study. The animals were maintained in a fish facility under standard conditions, with a 10/14 hr dark/light cycle at 28.5°C.12 Protocols for all animal procedures were approved by the Nankai University Animal Care and Use Committee and complied with National Institutes of Health (NIH) guidelines.
Aqueous Exposure
At 48 hrs post fertilization (hpf), wild-type and Tg (lysC:EGFP) embryos were placed in a 6-well plate (30 embryos per well) and exposed continuously to NPMOF-Holt buffer (60 mmol/L NaCl, 0.67 mmol/L KCl, 0.3 mmol/L NaHCO3, 0.9 mmol/L CaCl2, pH 7.2) at a concentration of 100 mg/L and 50 mg/L, respectively, until 120 hpf. Thirty embryos were raised in Holt buffer as the control group. The experiment described above was repeated three times.
Light Lesion and Intravitreous Injection
To induce selective photoreceptor death, adult wild-type fish were exposed to high-intensity light from a mercury arc lamp (>180,000 lux, BH2-RFL-T3-W, Olympus, Japan) for 45 mins.13 Thirty minutes after light lesioning, the fish were anesthetized with 0.1% 3-aminobenzoic acid ethyl ester methanesulfonate (MS-222; Sigma, St. Louis, MO, USA). An incision was made in the corneal limbus using a microblade. In all experiments except behavioral test, only the left eye was injected while the right eye was used as the uninjected control. A microsyringe (Hamilton, 1701RN; Reno, Nevada, USA) was used to operate injection, 0.8 μL of either control (0.1 M PBS, pH 7.4) or 0.1 M PBS containing 1 mg/mL MPS, 1 mg/mL NPMOF, or 2 mg/mL MPS-NPMOF into the vitreous chamber. Following injection, the fish were revived in fish water, returned to the system and raised regularly. Thirty fish were injected in each group.
Histology and Immunofluorescence
NPMOF-exposed larvae at 120 hpf or injected adult fish were anesthetized in 0.1% MS-222 and euthanized immediately. In adult fish, eye cups were harvested at 1, 2, 3, 4, 5, 6 and 7 days post lesion (dpl). Larvae or eye cups were fixed in 4% paraformaldehyde (PFA). Hematoxylin and eosin (HE) staining and immunohistochemistry were performed using standard procedures.14,15 The primary antibodies were Zpr1 (1:200; Zebrafish International Resource Center (ZIRC), Eugene, OR, USA), Zpr3 (1:200; ZIRC), Zn12 (1:200; ZIRC) and anti-proliferating cell nuclear antigen (PCNA, 1:1000; clone PC-10, Sigma). For PCNA immunolabelling, slides were first incubated in 0.01 M sodium citrate buffer (pH 6.0) with 0.05% Tween-20 at 95-98°C for 20 min prior to retrieving the antigen.16 The secondary antibody was Alexa Fluor 488 (1:1000; ab150113, Abcam, Cambridge, MA) or fluorescent-labelled Cy3 (1:500; Millipore, Billerica, MA). The sections were counterstained with a 1:1000 dilution of 4ʹ,6-diamidino-2-phenylindole (DAPI, Sigma) to label the nuclei.
In situ Hybridization
Embryos were raised in 0.003% 1-phenyl-2-thiourea (PTU, Sigma) until 24 hpf to prevent pigmentation until 120 hpf. Larvae were anesthetized with 0.1% MS-222, euthanized immediately and fixed in 4% PFA at 120 hpf. Hepatocytes were specifically labeled by ceruloplasmin (cp, GenBank NM_131802) mRNA probe. The primer sequences for the amplification of cp were forward 5′-TGGAACGCTCTACCACAA-3′ and reverse 5′-TACGGTTCTGTGGAATAGTG-3′. The cDNA was linearized with Sac I, and the digoxigenin-labeled RNA probe was synthesized with T7 polymerase. Whole-mount in situ hybridization was performed using a standard protocol.17 The concentration of cp probe was 2 ng/μL. Six individuals were processed in each group.
Quantitative Real-Time Polymerase Chain Reaction (qRT-PCR)
Total RNA was extracted from larval zebrafish at 120 hpf or eye cups using TRIzol reagent according to the manufacturer’s protocol (Life Technologies, Carlsbad, California, USA) and was reverse-transcribed using TransScript First-Strand cDNA Synthesis SuperMix (TransGen Biotech, Beijing, China). qRT-PCR was assembled using TransStart Top Green qPCR SuperMix (TransGen). Reaction procedures were as follows: 5 mins at 95°C, followed by 40 cycles of 15 seconds at 95°C, 20 seconds at 55°C, and 30 seconds at 72°C. Primer sequences are listed in Supplementary Table 1. The comparative 2−∆∆Ct method was used for data analysis. The qRT-PCR experiment described above was repeated 3 times.
Behavioral Test
Optomotor response (OMR) tests were performed on adult zebrafish from the normal (unlesioned and uninjected), 0.1 M PBS, 1 mg/mL MPS and 2 mg/mL MPS-NPMOF groups at 7 dpl. The injection was operated biocularly as described previously. The injectants were same in both eyes. The normal group was used to determine the baseline of parameters. All behavioral tests were performed between 14:00 and 18:00 to avoid the influence of circadian rhythms on locomotor activity and visual sensitivity.18,19 The stimulus of the OMR apparatus was a rotating, radial, black and white grating, modified from a classic OMR stimulus.20,21 The spatial and temporal frequencies were set at 0.03 cycles per degree (c/deg) and 30 rotations per minute (rpm), respectively. After a 15 min acclimatization, the movement was tracked using a camera (CX240, Sony, Japan) positioned above the apparatus. The grating was presented to the fish in four 60-second trials, with the first two trials serving as adaptation and the last two trials used for data collection. For each pair of trials, the gratings rotated once clockwise and once counterclockwise. All digital tracks were analyzed by Ethovision XT software (version 11.5, Noldus Information Technology, Wageningen, the Netherlands). The positive response was defined as swimming following the grating direction. OMR performance was quantified by the positive proportion of distance (distance of positive response/total distance) and positive proportion of time (time of positive response/total time). Eight fish were tested in each group.
Photography and Image Analysis
Images of immunofluorescence were captured with an LSM710 confocal microscope (Carl Zeiss, Jena, Germany). Images of HE staining, in situ hybridization, NPMOF distribution and neutrophil aggregation were photographed with a BX51 microscope (Olympus Corporation, Tokyo, Japan). ImageJ software (1.49X, NIH, http://rsb.info.nih.gov/ij/) was used to convert images to 8-bit grayscale prior to thresholding; subsequently count GFP-expressing and retinal cells; calculate the positive areas of Zpr1, Zpr3 and Zn12 immunostaining; and measure the defect length of retinas following light lesioning.
Statistical Analysis
Statistical analysis was performed with SPSS software (version 20.0, IBM, New York, USA) and GraphPad software (version 5.0, GraphPad Software, La Jolla, USA). Statistical analysis of differences among groups was determined by using one-way analysis of variance (ANOVA) with the exception of the survival rate (with the Log rank test). The significance level was set at p-value ˂ 0.05.
Results and Discussion
Characterization of NPMOF
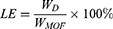
In the present study, we prepared a novel NPMOF and used it as a loading skeleton. The design strategy for NPMOF was as follows: BA and CTAB were used as subsidiary ligand blockers and surfactants to regulate the size. Zirconium was selected as the metal ion of NPMOF because of its high biocompatibility. The dispersibility and hydrophilicity of NPMOF were improved using PEG-6000. Porphyrin was used as the imaging unit because it can provide powerful red fluorescence. Figure 1A shows the schematic illustration of NPMOF. There were two main channels that could carry the drug. Zr6O16 clusters (green polyhedron) were linked through the planar TCPP to form a Kagome-type topology. TEM and SEM images revealed that NPMOF had a spherical structure approximately 270 nm in diameter (Figure 1B and C), so the water-soluble NPMOF could easily enter into the zebrafish.11 The XRD study showed that the main diffraction peaks of NPMOF emerged at 2θ values of 4.7°, 5.4°, 7.1°, 9.4°, 10.8°, 11.8° and 14.3° (Figure 1D). These sharp and narrow peaks indicated that NPMOF was highly crystalline and finely porous. N2 adsorption-desorption isotherms of NPMOF were classified as type II according to International Union of Pure and Applied Chemistry (IUPAC) nomenclature (Figure 1E; see22), indicating the presence of mesopores. The Brunauer-Emmett-Teller (BET) surface area of NPMOF was 111.4 m2 g−1, and the main pore size was 3.5 nm (Figure 1F). The FTIR image showed a peak at 656 cm−1 that was assigned to the Zr-O vibration of the Zr cluster (Figure 1G, arrow). The composition and stability of NPMOF were detected by TGA. DSC curves showed that NPMOF was stable until 426.4°C, and the calculated molecular formula was Zr3O8(OH)3TCPP (Figure 1H). For UV-Vis adsorption, NPMOF exhibited a strong absorption peak at 421 nm for the Soret band and four peaks at 522, 560, 590, and 650 nm for the Q band, while fluorescence was observed at an emission peak at 689 nm (Figure 1I). Compared to the spectrum of the precursor porphyrin (TCPP), most peaks were still present, although slightly red-shifted (Figure 1I), which was attributed to the enlarged conjugate area of porphyrin after NPMOF formation.23
 |
Figure 1 The morphology, composition and optical properties of NPMOF. (A) Schematic illustration of NPMOF. (B) TEM and (C) SEM images of NPMOF show an average size of 270 nm. (D) XRD pattern, (E) adsorption and desorption isotherm, (F) pore size distribution, (G) FTIR curve and (H) TGA and DSC analysis of NPMOF. (I) UV−Vis and fluorescence spectra of TCPP (red, in pH 10 NaOH aqueous solution, 25°C; λex = 514 nm) and NPMOF (black, in water, 25°C; λex = 530 nm). Note that compared to TCPP, the UV-Vis absorbance and fluorescence of NPMOF revealed a slight red-shift. Scale bar in (B) and (C): 200 nm. |
Biological Distribution and Phenotypes Following NPMOF Exposure
To observe the in vivo distribution of NPMOF, embryos were exposed to NPMOF until 120 hpf. Phenotypes were assessed on exposed larvae at 96 and 120 hpf. Compared to the control group, no obvious malformation was observed in embryos in the exposed groups at any time point (Figure 2A–D). From 96 hpf, bright red fluorescence was detected, mainly in the gastrointestinal tract, in both the 50 mg/L and 100 mg/L exposed groups, and it intensified with longer exposure time (Figure 2B and D, arrowheads). The NPMOF distribution in the gastrointestinal tract was attributed to swallowing and digestion.24 To explore whether NPMOFs can enter into the retina, we performed cryosections of embryos at 120 hpf. Compared to the control retina, scattered fluorescent signals were detected in the inner plexiform layer (IPL) and optic nerve (ON) in the exposed groups (Figure 2E). The residence in eyeballs can be explained by nanoscale size and nutrient requirement of NPMOFs. Nanoparticles can penetrate across conjunctiva or skin and reach the retina.25 Moreover, porphyrin is one of the key components for many enzymes and proteins such as hemoglobin and P450.26 Porphyrin is essential for biosynthesizing hemoglobin and is thus involved in erythropoiesis, oxygen carrying and the homeostatic balance of systems, including the nervous system.27–29 We then analyzed the survival rate, malformation rate, heart rate, body length and area and perimeter of the eye to further evaluate the biotoxicity (Figure 2F–K). There was no significant difference among the control, 50 mg/L and 100 mg/L exposed groups (Figure 2F–K; Log rank test & ANOVA, p>0.05). The above data suggest that exposure to NPMOF does not lead to abnormal development.
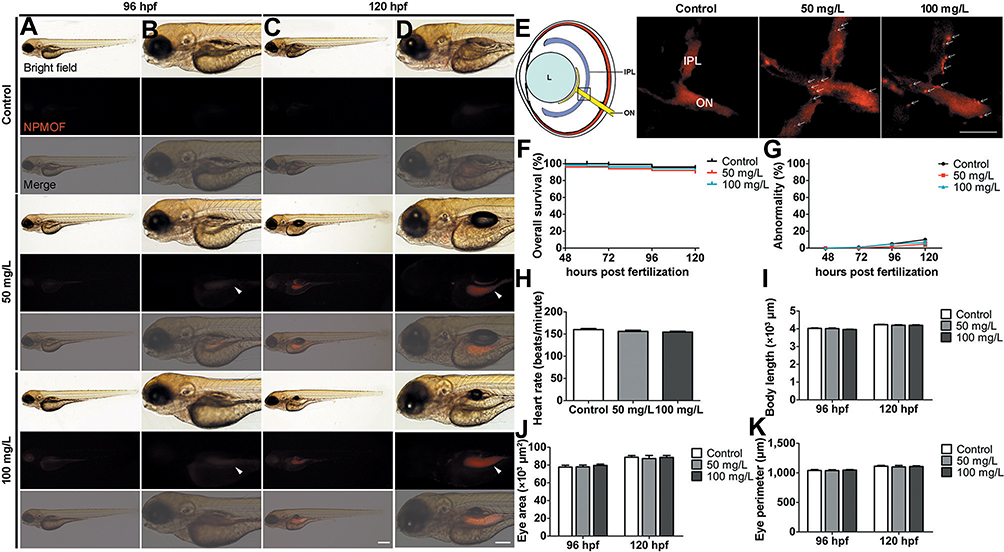 |
Figure 2 Phenotypes and tissue distribution of larval zebrafish following NPMOF exposure. Bright field and fluorescence images of larval zebrafish at (A and B) 96 and (C and D) 120 hpf. Columns (B) and (D) are magnified images of columns (A) and (C), respectively. Note that NPMOF gathers mainly in the gastrointestinal tract (arrowheads). (E) The NPMOF localization in sections taken from retinas in the control, 50 mg/L and 100 mg/L exposed groups at 120 hpf. Note that NPMOF localizes predominantly in the IPL and ON (arrows). The location of the image is shown by the square in the cartoon. (F) Statistical analysis of the survival rate. No significant difference was found among the control, 50 mg/L and 100 mg/L exposed groups (Log rank test, p>0.05). (G) Statistical analysis of the malformation rate, (H) heart rate at 120 hpf, (I) body length, (J) area and (K) perimeter of the eye ball at 96 hpf and 120 hpf. No significant difference was found among the three groups (ANOVA, p>0.05). (A-D) Dorsal is up, and rostral is left. Scale bar in (A) and (C): 200 μm; (B) and (D): 100 μm; (E): 10 μm. Abbreviations: L, lens; IPL, inner plexiform layer; ON, optic nerve. |
Retinal Neural Differentiation and Liver Development Following NPMOF Exposure
To investigate whether NPMOF is neurotoxic, retinal histology and neural differentiation were assessed at 120 hpf. Similar to the control group, retinas from the 50 mg/L and 100 mg/L exposed groups did not show abnormal structural or cellular morphology (Figure 3A). For neural differentiation, three antibodies, namely, Zpr1, Zpr3 and Zn12, were used to label cones, rods and ganglion cells, respectively. Zpr1-positive and Zpr3-positive cells were strongly detected in the outer nuclear layer (ONL), while Zn12-positive cells were found in the ganglion cell layer in all three groups (Figure 3B). To quantify this finding, we analyzed the fluorescence areas of the positive cells. There was no significant difference among groups (Figure 3C; ANOVA, p>0.05). To evaluate the hepatotoxicity of NPMOF, liver development was examined by HE staining and whole-mount in situ hybridization using the hepatocyte-specific mRNA probe ceruloplasmin (cp) at 120 hpf. Images of HE staining showed that the liver was formed by well-delineated polygonal cells with abundant cytoplasm and a prominent nucleus in larvae from either the control or NPMOF-exposed groups (Figure 3D). The results of in situ hybridization showed that cp-expressing cells were located posterior to the heart and lateral to the intestine (Figure 3E, arrowheads); meanwhile, the size of the livers was very similar in larvae from all three groups (Figure 3F; ANOVA, p>0.05). We also examined the expression level of cp by qRT-PCR. There was no significant difference among the three groups (Figure 3G; ANOVA, p>0.05). These data indicate that exposure to NPMOF had little impact on neural differentiation and liver development.
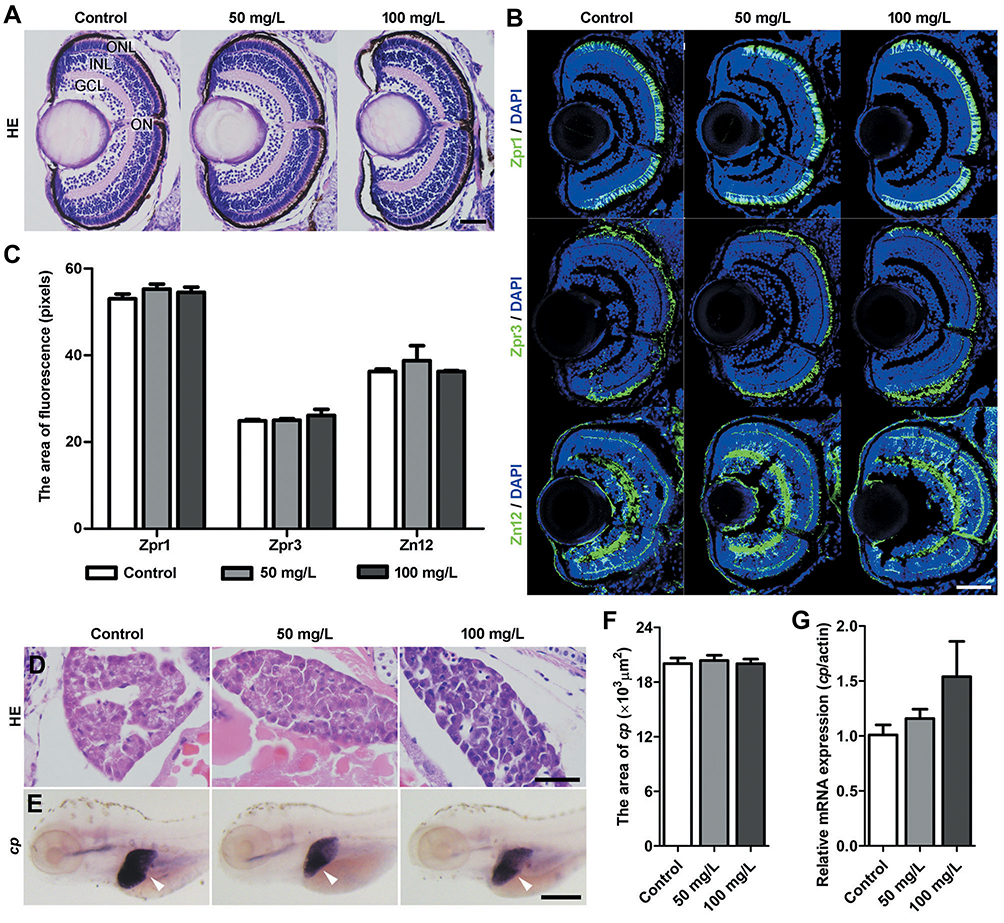 |
Figure 3 The histology of the retina and liver following NPMOF exposure. (A and B) Sections taken from the retina at 120 hpf. (A) HE staining; (B) Zpr1, Zpr3 and Zn12 staining. (C) Statistical analysis of Zpr1-positive, Zpr3-positive and Zn12-positive areas among the control, 50 mg/L and 100 mg/L exposed groups (ANOVA, p>0.05). (D) HE staining of the liver in the control, 50 mg/L and 100 mg/L groups. (E) Images of in situ hybridization. The expression of riboprobe ceruloplasmin (cp) mRNA is shown with arrowheads. (F) Statistical analysis of the liver size among the three groups (ANOVA, p>0.05). (G) The expression of cp. Dorsal is up and rostral is left in (E). Scale bar in (A) 20 μm; (B): 50 μm; (D): 20 μm; (E): 200 μm. Abbreviations: ONL, outer nuclear layer; INL, inner nuclear layer; GCL, ganglion cell layer; ON, optic nerve. |
Evaluation of the Inflammatory Response Following NPMOF Exposure
To verify whether NPMOF exposure could trigger an inflammatory response and reactive oxygen species (ROS), transgenic zebrafish Tg (lysC:EGFP)were also exposed to the same NPMOF solution as the AB larvae. lysC expression was reported to specifically label the neutrophils.30 In the process of the inflammatory response, neutrophils were recruited to the inflammatory site.31 At 96 hpf and 120 hpf, the number of neutrophils in the ocular (Figure 4A, circle) and hepatic regions (Figure 4C, square) was counted, and no significant difference was found among the three groups (Figure 4B and D; ANOVA, p>0.05). Tumor necrosis factor-alpha (tnfα) is a pleiotropic inflammatory cytokine, and superoxide dismutase 1 (sod1) is an oxidoreductase that limits the detrimental effects of ROS.32,33 The expression of tnfα and sod1 was quantified by qRT-PCR at 120 hpf. The results showed that the expression was non-significant among the three groups (Figure 4E and F; ANOVA, p>0.05). The negative results demonstrated that NPMOF did not trigger an inflammatory response. Hence, the larvae were in normal phenotypes with well-developed livers and fully differentiated retinas. As a drug carrier, the nano-scale size and low biotoxicity of NPMOF ensured its bioavailability and biocompatibility.
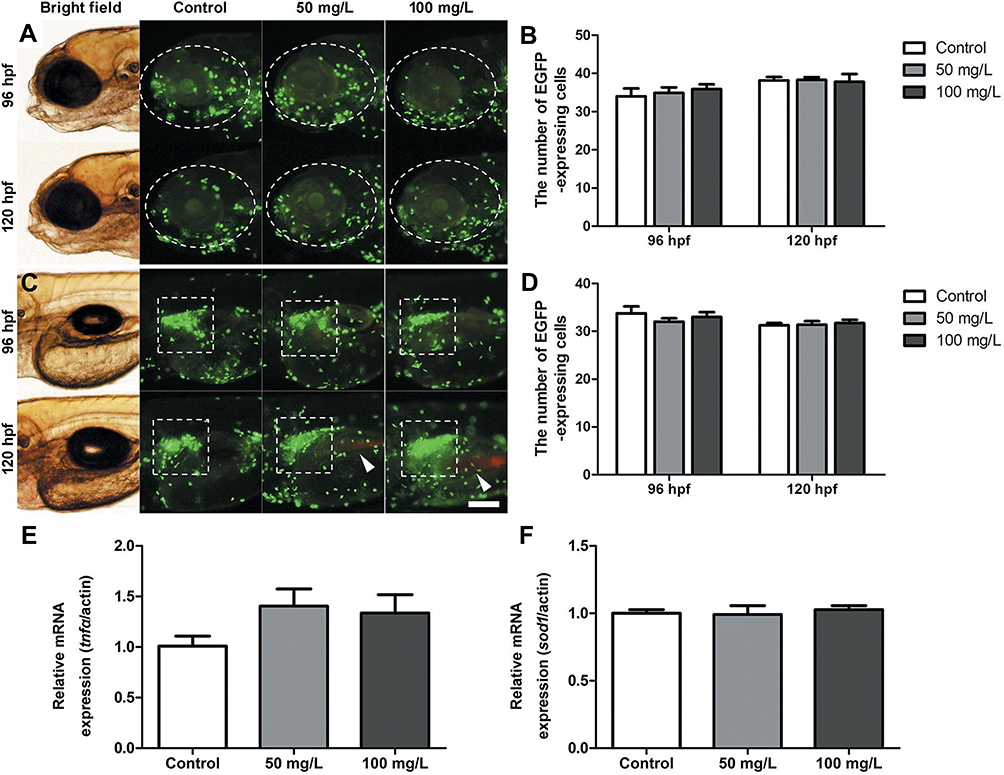 |
Figure 4 Inflammatory response following NPMOF exposure. (A and C) The distribution of neutrophils in the (A) ocular region and (C) hepatic region. (B and D) Statistical analysis of the number of neutrophils in the ocular (A, circle) and hepatic regions (C, square), respectively. The red fluorescence is emitted by NPMOF in the gastrointestinal tract (C, arrowheads). (E and F) The expression of tnfα and sod1. Dorsal is up and rostral is left in (A) and (C). Scale bar in (A): 100 μm. |
NPMOF Retention in the Retina and Uptake-Release Properties of MPS-NPMOF
Intense light exposure to adult zebrafish specifically led the apoptosis of rods and cones and served as an excellent model to study photoreceptor regeneration.34 In this study, we used this model to investigate the distribution and retention time of NPMOF in retinas and therapeutic effect of the NPMOF loading systems. Following intravitreous injection of NPMOF, cryosections from 1 dpl to 7 dpl were performed. Time-lapse red fluorescence signals were found in the ON, choroid layer (CL) and retina, particularly in the ONL, photoreceptor layer (PL) and retinal pigment epithelium (RPE) layers (Figure 5A, arrowheads; Supplementary Figure 1a), suggesting that NPMOF diffused rapidly through the vitreous body, reached the photoreceptor and RPE layers along with the optic nerve and passed into the choroid layer to be cleaned (Figure 5A). To identify the amount of NPMOF around the lesioned site (Figure 5A, dotted rectangles), the area of red fluorescence was measured at each time point. It increased sharply and reached its peak at 2 dpl, before decreasing gradually until 7 dpl (Figure 5B). In particular, the amount of NPMOF at 2 dpl was significantly higher than that at 1, 4, 5, 6 and 7 dpl, and the amount of NPMOF at 3 dpl was also above that at 1, 5, 6 and 7 dpl (Figure 5B; ANOVA, *p<0.05). Statistics of the amount of NPMOF in different layers was shown in Supplementary Figure 1b. Within two days, more fluorescent signals were found in RPE and PL (Supplementary Figure 1b, grey columns; ANOVA, *p<0.05). At 3 days post lesion, the amount reached the peak in CL (Supplementary Figure 1b, white columns; ANOVA, *p<0.05). These data suggest that NPMOF can be retained in the retina for 7 days and that the concentration is enriched at 2 and 3 dpl.
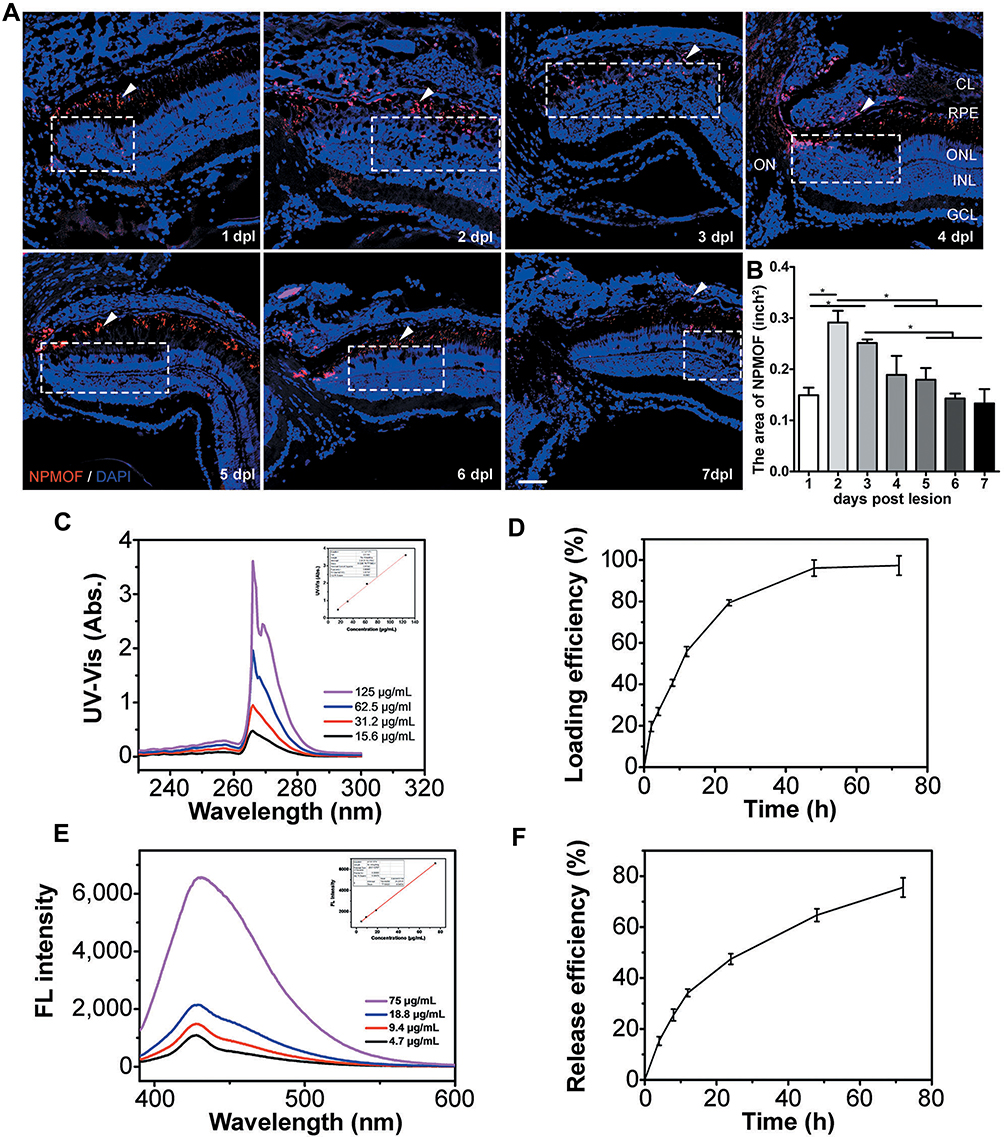 |
Figure 5 Distribution of NPMOF in the retina from 1 to 7 days post lesion and the loading efficiency and release efficiency for MPS in NPMOF. (A) The distribution of NPMOF (arrowheads) around the lesioned area (dotted rectangles) in the retina from 1 to 7 dpl. (B) The statistical analysis of NPMOF in the retina (ANOVA, *p<0.05). (C and D) The UV-Vis absorbance (insert, standard curve) of MPS in DMF and its loading performance. (E and F) The fluorescence (insert, standard curve) of MPS in 5% hyaluronic acid and its release performance. Scale bar in (A): 50 μm. Abbreviations: CL, choroid layer; RPE, retinal pigment epithelium; ONL, outer nuclear layer; INL, inner nuclear layer; GCL, ganglion cell layer; ON, optic nerve. |
Figure 5C show the loading property of MPS. The loading efficiency was 97.3% (w/w) at 72 h (Figure 5D). The high loading efficiency of MPS was attributed to the interconnected 3D pore geometry and large channel size of NPMOF. 5% hyaluronic acid was used to imitate vitreous body. The releasing property of MPS in 5% hyaluronic acid is given in Figure 5E. MPS in NPMOF was released at a moderate rate in 5% hyaluronic acid (75.6% at 72 h; Figure 5F). Currently, intravitreous injection is the most common procedure in the treatment of vitreoretinal diseases.7 Compared to systemic administration, intravitreous injection can minimize the potential systemic adverse effects. However, the repetitive injections may lead to unfavorable outcomes, including subconjunctival hemorrhage, intraocular pressure rise, floaters and infection.7,35 Therefore, the long-standing drug delivery system is an ideal approach. After intravitreous injection, NPMOF distributed throughout the retina quickly and remained in the retina for 7 days. In vitro experiments also showed that MPS-NPMOF released moderately in 5% hyaluronic acid. Both of the above results ensured the sustained effect.
Photoreceptor Regeneration and Recovery of Visual Function
To explore whether the injection of MPS-NPMOF had any impact at the lesioned site, the morphology of retinas from the PBS, MPS and MPS-NPMOF groups was evaluated at 1 dpl, 3 dpl and 7 dpl. At 1 dpl, nuclear debris appeared in the outer segment layer (OSL), which suggested that photoreceptors were exfoliated from the ONL to the OSL (Supplementary Figure 2a, dotted rectangles). At 3 dpl, the nuclear layer structure of the retina was disrupted, and cells in the cone outer nuclear layer (cONL) were completely interrupted (Supplementary Figure 2a, arrowheads). Interestingly, the MPS-NPMOF group had a tighter arrangement and shorter defect range of retinal cells compared to the other groups (Supplementary Figure 2b and c; ANOVA, *p<0.05). Moreover, long spindle-shaped cells appeared in the nuclear layer at 3 dpl (Supplementary Figure 2a, arrows). At 7 dpl, the lesioned site was filled with cells in all three groups (Supplementary Figure 2a).
Based on the results of HE staining, retinas from PBS, MPS and MPS-NPMOF groups were immunolabeled by Zpr1 and Zpr3 antibodies at 3 dpl and 7 dpl to further investigate the degeneration and regeneration of cones and rods, respectively. In the PBS and MPS groups at 3 dpl, the Zpr1-positive cells were absent or disorganized in the lesioned retina, and the ONL of the lesion site was thinner than that in the unlesioned region (Figure 6A). In the MPS-NPMOF group, the arrangement of Zpr1-positive cells was also completely interrupted at 3 dpl, whereas the shorter defect range meant that more cones were present than in the PBS and MPS groups per 300 microns (Figure 6A and C; ANOVA, *p<0.05). Zpr3-positive cells had a similar performance, showing massive exfoliation in the PBS group, partial exfoliation in the MPS group and slight disorganization in the MPS-NPMOF group (Figure 6A). The MPS-NPMOF group had more residual rods in the lesioned site (Figure 6D; ANOVA, *p<0.05). These data indicate that only minor ablation of cones and rods were observed in the MPS-NPMOF group at 3 dpl. In the PBS and MPS groups at 7 dpl, Zpr1-positive cells filled in the OSL of the lesioned site with a loose pattern, while Zpr1 was strongly and continuously expressed in the MPS-NPMOF group (Figure 6B). Zpr3 was strongly expressed in all three groups at 7 dpl (Figure 6B), indicating that rods were well regenerated. At this time point, no significant difference was found in the numbers of Zpr1-positive or Zpr3-positive cells among the three groups (Figure 6E and F; ANOVA, p>0.05). To determine the corresponding visual function, optomotor response (OMR) analysis was performed. Both the positive proportion of distance and positive proportion of time in the MPS-NPMOF group were close to those in the normal group, while the PBS and MPS groups showed significant decreases (Figure 6G and H; ANOVA, *p<0.05). These data suggest that retinas in the MPS-NPMOF group gained better differentiated cones and visual function at 7 dpl. MPS had the ability to protect the retina from damage.5 We administrated MPS-NPMOF via intravitreous injection. It avoided the lower efficiency and adverse effects caused by systemic administration and prolonged the retention time of the drug.36,37 That’s why retinas revealed smaller scale of lesioned site, milder injury and faster recovery following MPS-NPMOF injection. The NPMOF-related drug delivery system was demonstrated to be effective.
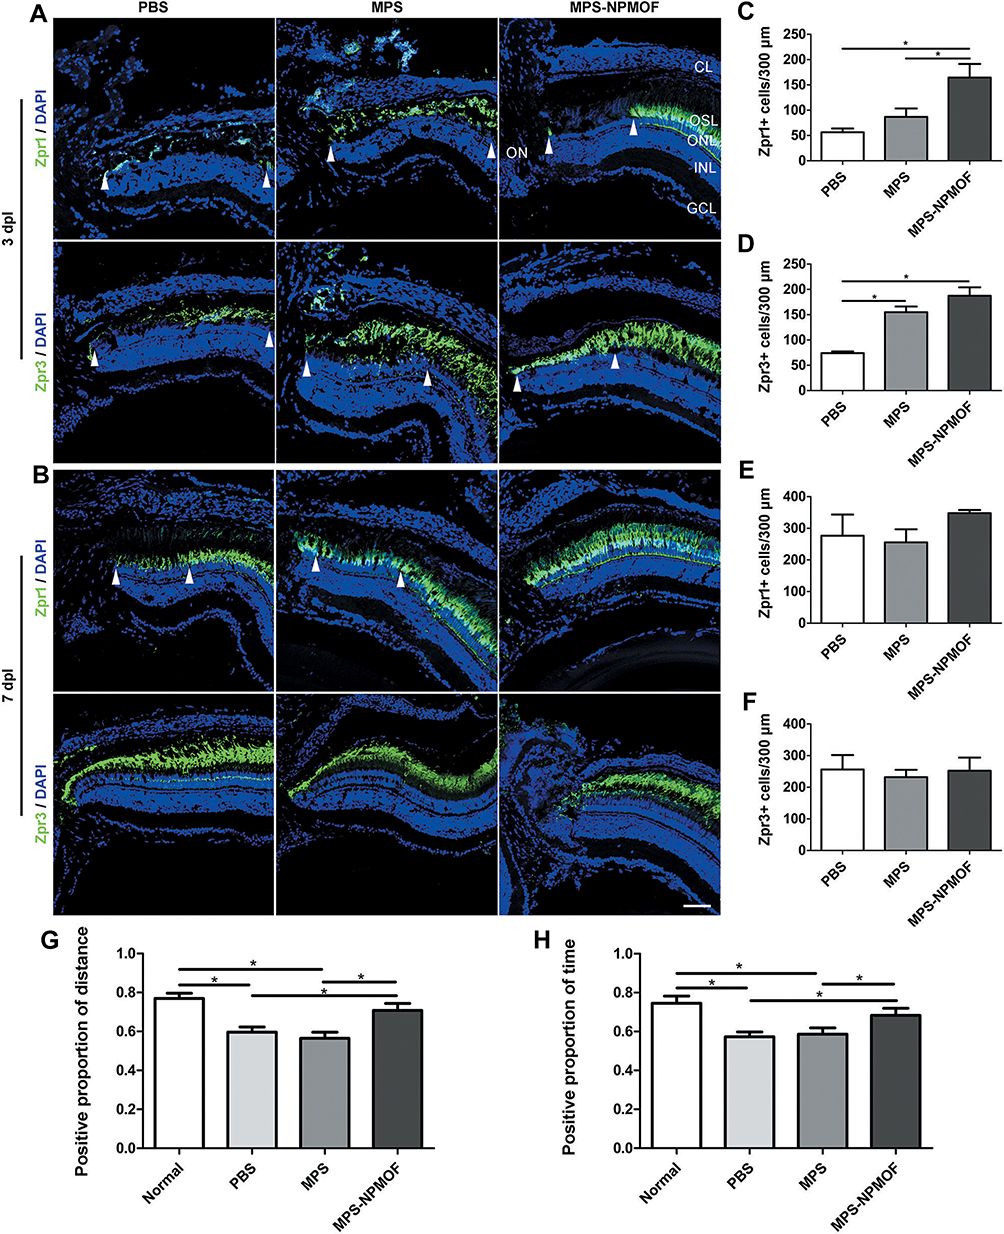 |
Figure 6 Degeneration-regeneration of photoreceptors and changes in visual function following treatment with MPS-NPMOF. (A and B) Zpr1 and Zpr3 staining in sections taken from retinas in the PBS, MPS and MPS-NPMOF groups at 3 and 7 dpl. Note that retinas in the PBS and MPS groups have a loose arrangement of Zpr1-positive cells at lesioned sites (arrowheads) at 7 dpl. (C and D) Quantification of the number of cones and rods per 300 microns in the lesioned retina at 3 dpl. More photoreceptors remained in the MPS-NPMOF group compared to the PBS and MPS groups (ANOVA, *p<0.05). (E and F) Quantification of the number of cones and rods per 300 microns at 7 dpl. There are no significant differences among the three groups (ANOVA, p>0.05). (G and H) The statistical analyses of the positive proportion of distance and positive proportion of time at 7 dpl. Note that the significant decrease in the PBS and MPS groups (ANOVA, *p<0.05). Scale bar in (A) and (B): 50 μm. Abbreviations: CL, choroid layer; OSL, outer segment layer; ONL, outer nuclear layer; INL, inner nuclear layer; GCL, ganglion cell layer; ON, optic nerve. |
Cell Proliferation at the Lesion Site
During the regeneration process of retina, the proliferating cells were derived from Müller glia and recognized by PCNA.38 To investigate the underlying mechanisms of NPMOF-MPS promoting recovery, the anti-PCNA antibody was used to identify precursor cells and evaluate cell proliferation, while the expression of ascl1a and sox2 was examined. At 1 dpl, scattered PCNA-positive cells gathered in clusters in the INL in retinas from the PBS, MPS and MPS-NPMOF groups (Figure 7A). At 2 dpl, the increasing PCNA-positive cells were found to have a long spindle shape, extending from the INL to the ONL (Figure 7A). At 3 dpl, the compact proliferating cells in the PBS and MPS groups had almost finished their migration to the ONL. However, the proliferating cells in the MPS-NPMOF group not only clustered in the ONL but also distributed in the INL (Figure 7A). At 4 dpl, the number of proliferating cells decreased in all three groups (Figure 7A). We then scored the percentage of PCNA-positive cells (the area of PCNA-positive cells/the total area from GCL to ONL) to quantify these findings. At 3 dpl, there was a significantly higher percentage of PCNA-positive cells in the retinas of the MPS-NPMOF group than those from the PBS and MPS groups (Figure 7B; ANOVA, *p<0.05). Since ascl1a and sox2 genes were required for the Müller glia’s reprogramming and proliferation,15,39 we performed qRT-PCR to examine their expression. Compared with the PBS and MPS groups, the MPS-NPMOF group showed an increased expression of ascl1a from 36 hrs post lesion (hpl) (Figure 7C; ANOVA, *p<0.05), while a statistically higher expression of sox2 appeared from 48 hpl (Figure 7D; ANOVA, *p<0.05). The above results indicate that MPS-NPMOF promotes Müller glia proliferation and retinal regeneration.
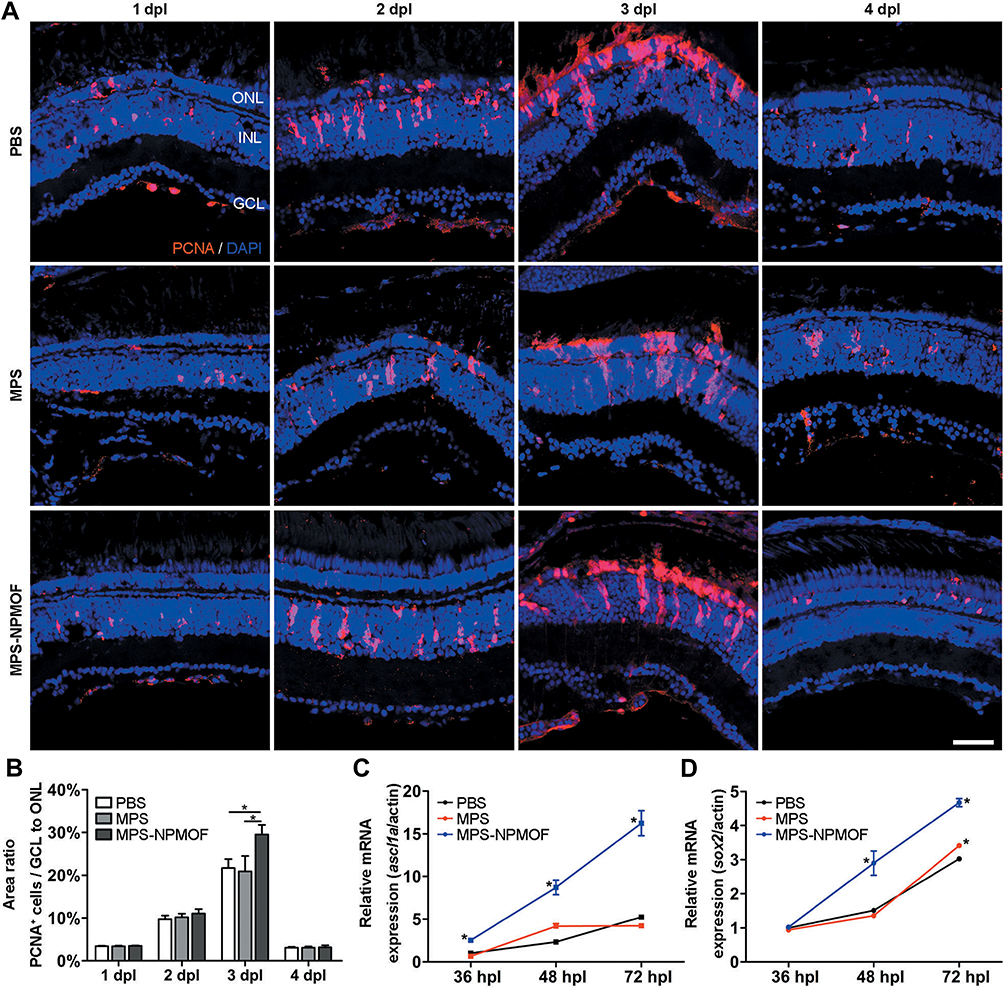 |
Figure 7 Cell proliferation of light-lesioned retina following injection of MPS-NPMOF. (A) PCNA staining in sections taken from retinas at 1, 2, 3 and 4 dpl. (B) Statistical analysis of the percentage of PCNA-positive cells from GCL to ONL. There was a significantly higher percentage in the MPS-NPMOF group than in the PBS and MPS groups at 3 dpl (ANOVA, *p<0.05). (C and D) The expression of ascl1a and sox2 mRNA. Note that ascl1a was increased in the MPS-NPMOF group at 36, 48 and 72 hpl, while sox2 was increased at 48 and 72 hpl (ANOVA, *p<0.05). Scale bar in (A): 20 μm. Abbreviations: ONL, outer nuclear layer; INL, inner nuclear layer; GCL, ganglion cell layer. |
Conclusion
In summary, the novel synthesized nanoparticle, NPMOF, has excellent in vivo biocompatibility and low biotoxicity, making it an ideal skeleton to prepare drug delivery systems. By intraocular injection, MPS-NPMOF releases at the lesion site continuously and exerts the therapeutic effects of MPS, including defending the stress-induced apoptosis of retina after light injury and promoting photoreceptor regeneration. Intraocular injection of the loaded-NPMOF delivery system provides a promising approach to treat ocular posterior segment diseases, such as solar retinopathy, diabetic retinopathy and age-related macular degeneration.
Acknowledgments
This work was supported by Chinese National Natural Science Foundation (No. 81671179 and 81971739), the National Key R&D Program of China (No. 2017YFA0103201), Tianjin Talent Innovation Group of 131, Bureau of Personnel, CAMS Innovation Fund for Medical Sciences (No. 2016-I2M-1-017 & 2017-I2M-B&R-13), and the Fundamental Research Funds for the Central Universities (Nankai University No. 63191154). The authors thank Dr. Shaohua Yao (State Key Laboratory of Biotherapy and Cancer Center, West China Hospital, Sichuan University) for providing transgenic zebrafish Tg (lysC:EGFP).
Disclosure
The authors report no conflicts of interest in this work.
References
1. Contin MA, Benedetto MM, Quinteros-Quintana ML, Guido ME. Light pollution: the possible consequences of excessive illumination on retina. Eye. 2016;30(2):255–263. doi:10.1038/eye.2015.221
2. Blanco-Sanchez B, Clement A, Phillips JB, Westerfield M. Zebrafish models of human eye and inner ear diseases. Methods Cell Biol. 2017;138:415–467. doi:10.1016/bs.mcb.2016.10.006
3. Behar-Cohen F, Zhao M. Corticosteroids and the retina: a role for the mineralocorticoid receptor. Curr Opin Neurol. 2016;29(1):49–54. doi:10.1097/WCO.0000000000000284
4. Zhao M, Bousquet E, Valamanesh F, et al. Differential regulations of AQP4 and Kir4.1 by triamcinolone acetonide and dexamethasone in the healthy and inflamed retina. Invest Ophthalmol Vis Sci. 2011;52(9):6340–6347. doi:10.1167/iovs.11-7675
5. Sulaiman RS, Kadmiel M, Cidlowski JA. Glucocorticoid receptor signaling in the eye. Steroids. 2018;133:60–66. doi:10.1016/j.steroids.2017.11.002
6. Fini ME, Schwartz SG, Gao X, et al. Steroid-induced ocular hypertension/glaucoma: focus on pharmacogenomics and implications for precision medicine. Prog Retin Eye Res. 2017;56:58–83. doi:10.1016/j.preteyeres.2016.09.003
7. Gupta A, Sun JK, Silva PS. Complications of intravitreous injections in patients with diabetes. Semin Ophthalmol. 2018;33(1):42–50. doi:10.1080/08820538.2017.1353811
8. Huang D, Chen YS, Green CR, Rupenthal ID. Hyaluronic acid coated albumin nanoparticles for targeted peptide delivery in the treatment of retinal ischaemia. Biomaterials. 2018;168:10–23. doi:10.1016/j.biomaterials.2018.03.034
9. Sahoo SK, Dilnawaz F, Krishnakumar S. Nanotechnology in ocular drug delivery. Drug Discov Today. 2008;13(3–4):144–151. doi:10.1016/j.drudis.2007.10.021
10. Zheng H, Zhang Y, Liu L, et al. One-pot synthesis of metal-organic frameworks with encapsulated target molecules and their applications for controlled drug delivery. J Am Chem Soc. 2016;138(3):962–968. doi:10.1021/jacs.5b11720
11. Liu W, Wang YM, Li YH, et al. Fluorescent imaging-guided chemotherapy-and-photodynamic dual therapy with nanoscale porphyrin metal-organic framework. Small. 2017;13(17):1603459. doi:10.1002/Smll.201603459
12. Westerfield M. The Zebrafish Book: A Guide for the Laboratory Use of zebrafish (Brachydanio Rerio). Eugene (OR): University of Oregon Press: M. Westerfield; 2007.
13. Wang YJ, Cai SJ, Cui JL, Chen Y, Tang X, Li YH. Correlation between photoreceptor injury-regeneration and behavior in a zebrafish model. Neural Regen Res. 2017;12(5):795–803. doi:10.4103/1673-5374.206651
14. Rosch S, Johnen S, Muller F, Pfarrer C, Walter P. Correlations between ERG, OCT, and anatomical findings in the rd10 mouse. J Ophthalmol. 2014;2014:874751. doi:10.1155/2014/874751
15. Gorsuch RA, Lahne M, Yarka CE, Petravick ME, Li J, Hyde DR. Sox2 regulates Muller glia reprogramming and proliferation in the regenerating zebrafish retina via Lin28 and Ascl1a. Exp Eye Res. 2017;161:174–192. doi:10.1016/j.exer.2017.05.012
16. Nelson CM, Ackerman KM, O’Hayer P, Bailey TJ, Gorsuch RA, Hyde DR. Tumor necrosis factor-alpha is produced by dying retinal neurons and is required for Muller glia proliferation during zebrafish retinal regeneration. J Neurosci. 2013;33(15):6524–6539. doi:10.1523/JNEUROSCI.3838-12.2013
17. Thisse C, Thisse B. High-resolution in situ hybridization to whole-mount zebrafish embryos. Nat Protoc. 2008;3(1):59–69. doi:10.1038/nprot.2007.514
18. Li J, Liu QT, Chen Y, et al. Involvement of 5-HT1A receptors in the anxiolytic-like effects of quercitrin and evidence of the involvement of the monoaminergic system. Evid Based Complement Alternat Med. 2016;2016:6530364. doi:10.1155/2016/5040528
19. Kopp R, Legler J, Legradi J. Alterations in locomotor activity of feeding zebrafish larvae as a consequence of exposure to different environmental factors. Environ Sci Pollut Res Int. 2018;25(5):4085–4093. doi:10.1007/s11356-016-6704-3
20. Maaswinkel H, Li L. Spatio-temporal frequency characteristics of the optomotor response in zebrafish. Vision Res. 2003;43(1):21–30. doi:10.1016/S0042-6989(02)00395-4
21. Gould CJ, Wiegand JL, Connaughton VP. Acute developmental exposure to 4-hydroxyandrostenedione has a long-term effect on visually-guided behaviors. Neurotoxicol Teratol. 2017;64:45–49. doi:10.1016/j.ntt.2017.10.003
22. Dutta A, Mondal J, Patra AK, Bhaumik A. Synthesis and temperature-induced morphological control in a hybrid porous iron-phosphonate nanomaterial and its excellent catalytic activity in the synthesis of benzimidazoles. Chemistry. 2012;18(42):13372–13378. doi:10.1002/chem.v18.42
23. Liu D, Huxford RC, Lin W. Phosphorescent nanoscale coordination polymers as contrast agents for optical imaging. Angew Chem Int Ed Engl. 2011;50(16):3696–3700. doi:10.1002/anie.v50.16
24. Minchin JE, Williams VC, Hinits Y, et al. Oesophageal and sternohyal muscle fibres are novel Pax3-dependent migratory somite derivatives essential for ingestion. Development. 2013;140(14):2972–2984. doi:10.1242/dev.090050
25. Conte C, Costabile G, d’Angelo I, et al. Skin transport of PEGylated poly(epsilon-caprolactone) nanoparticles assisted by (2-hydroxypropyl)-beta-cyclodextrin. J Colloid Interface Sci. 2015;454:112–120. doi:10.1016/j.jcis.2015.05.010
26. Gell DA. Structure and function of haemoglobins. Blood Cells Mol Dis. 2018;70:13–42. doi:10.1016/j.bcmd.2017.10.006
27. Liang R, Ghaffari S. Advances in understanding the mechanisms of erythropoiesis in homeostasis and disease. Br J Haematol. 2016;174(5):661–673. doi:10.1111/bjh.2016.174.issue-5
28. Hutchinson SA, Tooke-Locke E, Wang J, Tsai S, Katz T, Trede NS. Tbl3 regulates cell cycle length during zebrafish development. Dev Biol. 2012;368(2):261–272. doi:10.1016/j.ydbio.2012.05.024
29. Fernandez-Murray JP, Prykhozhij SV, Dufay JN, et al. Glycine and Folate Ameliorate Models of Congenital Sideroblastic Anemia. PLoS Genet. 2016;12(1):e1005783. doi:10.1371/journal.pgen.1005783
30. Barros-Becker F, Lam PY, Fisher R, Huttenlocher A. Live imaging reveals distinct modes of neutrophil and macrophage migration within interstitial tissues. J Cell Sci. 2017;130(22):3801–3808. doi:10.1242/jcs.206128
31. Robertson AL, Holmes GR, Bojarczuk AN, et al. A zebrafish compound screen reveals modulation of neutrophil reverse migration as an anti-inflammatory mechanism. Sci Transl Med. 2014;6(225):225ra229. doi:10.1126/scitranslmed.3007672
32. Felix LM, Vidal AM, Serafim C, et al. Ketamine induction of p53-dependent apoptosis and oxidative stress in zebrafish (Danio rerio) embryos. Chemosphere. 2018;201:730–739. doi:10.1016/j.chemosphere.2018.03.049
33. Lei XD, Sun Y, Cai SJ, Fang YW, Cui JL, Li YH. Role of tumor necrosis factor-alpha in zebrafish retinal neurogenesis and myelination. Int J Ophthalmol. 2016;9(6):831–837. doi:10.18240/ijo.2016.06.07
34. Rajaram K, Summerbell ER, Patton JG. Technical brief: constant intense light exposure to lesion and initiate regeneration in normally pigmented zebrafish. Mol Vis. 2014;20:1075–1084.
35. Writing Committee for the Multicenter Uveitis Steroid Treatment T, Follow-up Study Research G, Kempen JH, et al. Association between long-lasting intravitreous fluocinolone acetonide implant vs systemic anti-inflammatory therapy and visual acuity at 7 years among patients with intermediate, posterior, or panuveitis. JAMA. 2017;317(19):1993–2005. doi:10.1001/jama.2017.5103
36. Jacob S, Nair AB. An updated overview with simple and practical approach for developing in vitro-in vivo correlation. Drug Dev Res. 2018;79(3):97–110. doi:10.1002/ddr.21427
37. Liu S, Liu X, Chen S, Xiao Y, Zhuang W. Oral versus intravenous methylprednisolone for the treatment of multiple sclerosis relapses: a meta-analysis of randomized controlled trials. PLoS One. 2017;12(11):e0188644. doi:10.1371/journal.pone.0188644
38. Wan J, Goldman D. Retina regeneration in zebrafish. Curr Opin Genet Dev. 2016;40:41–47. doi:10.1016/j.gde.2016.05.009
39. Goldman D. Muller glial cell reprogramming and retina regeneration. Nat Rev Neurosci. 2014;15(7):431–442. doi:10.1038/nrn3723
 © 2019 The Author(s). This work is published and licensed by Dove Medical Press Limited. The full terms of this license are available at https://www.dovepress.com/terms.php and incorporate the Creative Commons Attribution - Non Commercial (unported, v3.0) License.
By accessing the work you hereby accept the Terms. Non-commercial uses of the work are permitted without any further permission from Dove Medical Press Limited, provided the work is properly attributed. For permission for commercial use of this work, please see paragraphs 4.2 and 5 of our Terms.
© 2019 The Author(s). This work is published and licensed by Dove Medical Press Limited. The full terms of this license are available at https://www.dovepress.com/terms.php and incorporate the Creative Commons Attribution - Non Commercial (unported, v3.0) License.
By accessing the work you hereby accept the Terms. Non-commercial uses of the work are permitted without any further permission from Dove Medical Press Limited, provided the work is properly attributed. For permission for commercial use of this work, please see paragraphs 4.2 and 5 of our Terms.