")
Back to Journals » Cancer Management and Research » Volume 11
The antitumor properties of metformin and phenformin reflect their ability to inhibit the actions of differentiated embryo chondrocyte 1
Authors Kuo CL, Hsieh Li SM, Liang SY, Liu ST, Huang LC, Wang WM , Yen LC, Huang SM
Received 1 April 2019
Accepted for publication 20 June 2019
Published 15 July 2019 Volume 2019:11 Pages 6567—6579
DOI https://doi.org/10.2147/CMAR.S210637
Checked for plagiarism Yes
Review by Single anonymous peer review
Peer reviewer comments 2
Editor who approved publication: Dr Antonella D'Anneo
Chun-Lin Kuo,1 Shu-Man Hsieh Li,*,2 Shu-Yi Liang,*,2 Shu-Ting Liu,2 Li-Chun Huang,2 Wei-Ming Wang,3 Li-Chen Yen,2,4 Shih-Ming Huang2
1Department of Orthopaedic Surgery, Tri-Service General Hospital, National Defense Medical Center, Taiwan, Republic of China; 2Department of Biochemistry, National Defense Medical Center, Taiwan, Republic of China; 3Department of Dermatology, Tri-Service General Hospital, National Defense Medical Center, Taiwan, Republic of China; 4Department of Microbiology and Immunology, National Defense Medical Center, Taiwan, Republic of China
*These authors contributed equally to this work
Background: Differentiated embryo chondrocyte 1 (DEC1) is a helix-loop-helix transcription factor that directly binds to the class B E-box in target genes. DEC1 exerts both pro-survival and pro-apoptotic effects in a cell- and tissue-dependent manner. Its actions play role the progression of cancer remains unclear.
Methods: We first examined the functional roles of DEC1 using the transient promoter reporter assay. Then, the knockdown of DEC1 expression was performed with the short hairpin RNA strategy in HeLa and A2058 cancer cell lines to check the cell cycle and mitochondrial function profile using the flow cytometry and Seahorse assays. We later clarified the role of DEC1 in the tumorigenesis using the colony formation, anchorage-independent growth assay, and cellular proliferation analysis.
Results: In the present study, we tested two guanide-containing drugs, metformin and phenformin, and found that both exhibit cytotoxicity against HeLa cervical carcinoma and A2058 melanoma cells. This effect was mediated, at least in part, through activation of the AMPK pathway; degradation of important cellular proteins, such as DEC1 and p53; and suppression of mitochondrial function, colony formation, and anchorage-independent cell proliferation. Our results further suggest that the cytotoxicity of metformin and phenformin reflect the impact of the repressive actions of DEC1 on gene expression, including DEC1 itself. This in turn suppresses both anchorage-independent growth and cell proliferation.
Conclusion: These findings provide several lines of evidence suggesting that DEC1 activity contributes to tumorigenicity and that the antitumor properties of biguanides reflect their ability to inhibit DEC1 functions.
Keywords: differentiated embryo chondrocyte 1, p53, metformin, phenformin, tumorigenesis
Introduction
Differentiated embryo chondrocyte 1 (DEC1) is a helix-loop-helix transcription factor that acts in two ways: by directly binding to class B E-boxes through interaction with several basal transcription machinery components, including TBP, TFIIB, and TFIID;1–4 and by recruiting histone deacetylase (HDAC) corepressor complexes.5–7 DEC1 functions in various cellular processes, including the circadian clock, apoptosis, cell cycle regulation, and differentiation induced by extracellular stimuli such as hypoxia, retinoic acid, and serum starvation.8–10 DEC1 is also a downstream effector of p53, which may be involved in G1 arrest and premature senescence.11,12
The biguanide metformin is an oral antihyperglycemic agent widely used for the treatment of type II diabetes mellitus. Two other biguanides, buformin and phenformin, are associated with increased cardiac mortality and risk of lactic acidosis, which led to their withdrawal in the early 1970s.13–16 Biguanides increase the cellular AMP (and ADP)-to-ATP ratio through activation of AMP-activated protein kinase (AMPK). In addition to their antihyperglycemic effect, biguanides exert protective effects against age-related pathologies such as cancer and inflammation.13,14,17–19 Notably, results from several studies suggest that both metformin and phenformin could be repurposed for cancer therapy, as they exhibit significant antitumor activities in various mouse models.18–20 Moreover, our group recently revealed that metformin-induced HeLa cell death is associated with reduced p53 stability, which leads to decreases in DEC1 and induction of apoptosis.21 However, details of the mechanism underlying the effect of biguanides on DEC1 levels remain to be further investigated.
In the present study, we examined the effects of metformin and phenformin on DEC1 expression in human cervical carcinoma and melanoma cells. We further explored the mechanisms governing DEC1 expression mediated by p53 and other transcription factors. Our findings provide several lines of evidence suggesting that DEC1 activity contributes to tumorigenicity and that the antitumor properties of biguanides reflect their ability inhibit DEC1 functions.
Methods and materials
Cell culture and chemicals
HeLa cervical carcinoma (ID 60005) and A2058 melanoma (ID 60240) cells were purchased from the Bioresource Collection and Research Center, Taiwan, Republic of China. HeLa and A2058 cells were cultured in Dulbecco’s modified Eagle’s medium (DMEM) supplemented with 10% fetal bovine serum (FBS) and 1% penicillin-streptomycin (Invitrogen, USA). Cycloheximide (CHX), metformin, MG132, phenformin, propidium iodide (PI), and trichostatin A (TSA) were purchased from Sigma Aldrich (MO, USA).
Western blot analysis
HeLa and A2058 cells were lysed in RIPA buffer (100 mM Tris-HCl pH 8.0, 150 mM NaCl, 0.1% SDS, and 1% Triton 100) at 4 °C. The protein concentration was measured using a DC Protein Assay Kit (Bio-Rad Laboratories, USA). Proteins in the resultant lysate were separated by SDS-PAGE and then electrotransferred to PVDF membranes (Immobilon-P; Millipore, Bedford, MA, USA) using a Bio-Rad Semi-dry Transfer Cell. The blots were then incubated with primary antibodies against α-actinin (ACTN), Ac-H3 (acetylated form of histone H3 at lysine 9/14), fatty acid synthase (FASN), p21, p53, proliferating cell nuclear antigen (PCNA) (Santa Cruz Biotechnology, USA), acetyl-CoA carboxylase (ACC), p-ACC (phosphorylation at Ser 79), AMPK, p-AMPK (phosphorylated at Thr 172), cleaved poly-ADP-ribose polymerase (cPARP) (Cell Signaling, USA), and DEC1 (Bethyl Laboratory, USA). Thereafter, the blots were incubated with horseradish peroxidase-conjugated secondary antibody (Santa Cruz Biotechnology). The immunoreactive proteins were then detected using ECLTM Western Blotting Detection Reagents and Amersham HyperfilmTM ECL (GE Healthcare, USA).
Plasmids, transient transfection, and measurement of relative luciferase activity
DEC1 was constructed by inserting its full-length PCR (polymerase chain reaction) fragment into the pCMV.Flag vector via the SalI-EcoRI restriction site. pGL3. DEC1 (−940/+42)-LUC was constructed by inserting the PCR fragment into the pGL3 basic vector via the KpnI-XhoI restriction site. The expression vectors pSG5.HA.p53 fragments, pSG5.HA.mZac1, pSG5.HA.HDAC1 (wt and H141A), SV40-LT, pSG5.HA.SIRT1, and pEGFP. DEC1 were all described previously.21–25 HeLa cells were plated in 24-well plates and transfected using jetPEI (Polyplus Transfection Inc., New York, NY) following the manufacturer’s protocol (Promega luciferase assay kit and DLR2 model). The total DNA was adjusted to 1.0 μg using empty vector. Cells were harvested for luciferase reporter assays using a Promega Luciferase Assay Kit as described previously.23 Luciferase activities in extracts from the transfected cells are presented in terms of relative light units (RLU) and expressed as the mean and standard deviation of three transfected cultures. Because the expression of several control vectors used to monitor transfection efficiency may be enhanced by Zac1,23 internal controls were not used. Instead, the reproducibility of observed effects was determined through multiple independent transfection experiments.
Reverse transcription-polymerase chain reaction (RT-PCR)
Total RNAs were isolated from HeLa and A2058 cells using TRIzol reagent (Invitrogen). Reverse transcription for first strand cDNA synthesis was carried out using MMLV reverse transcriptase (Epicentre Biotechnologies, USA) with 1 μg of total RNA for 60 min at 37 °C. The PCR reactions were run on a Veriti Thermal Cycler (Applied Biosystems, USA). PCR primers are listed in Table 1.
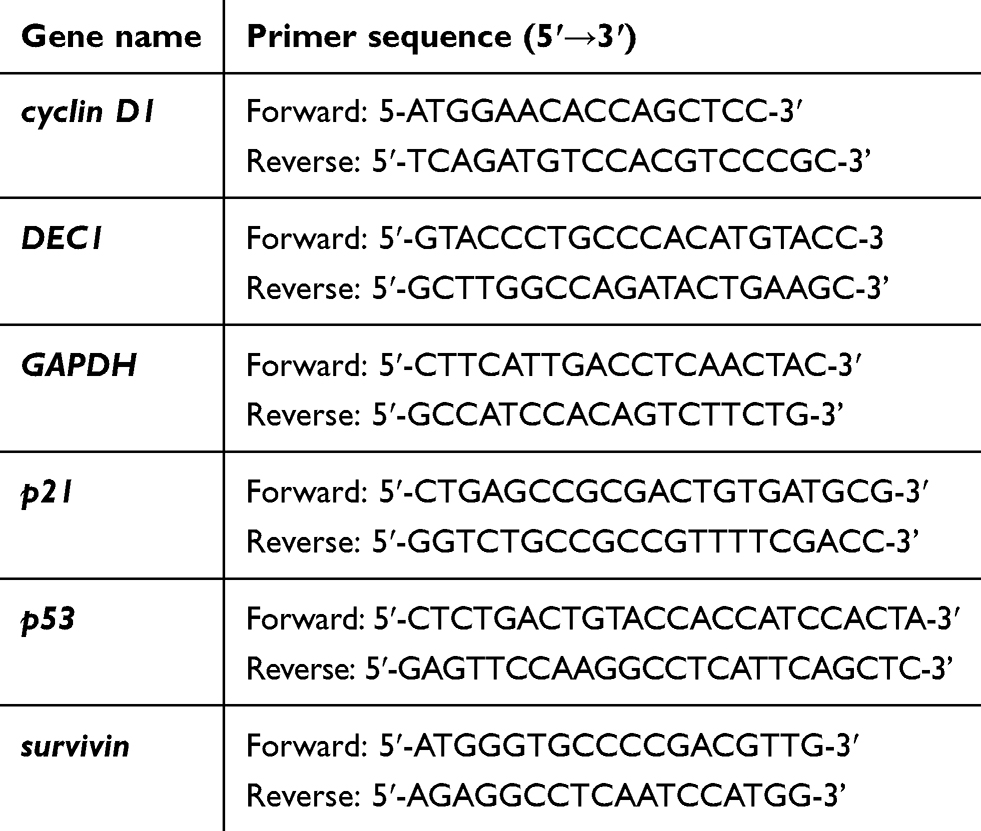 |
Table 1 PCR primers used in this study |
DEC-1 mRNA interference
Lentiviral vectors containing DEC1 and LUC-shRNA were purchased from the National RNAi Core Facility (Academia Sinica, Taiwan, ROC). HeLa and A2058 cells were infected with the indicated retroviruses or lentiviruses in selection medium containing 2 μg/ml polybrene. Forty-eight hours after infection, the cells were treated with 8 μg/ml puromycin to select for a pool of puromycin-resistant clones. Procedural details were as previously described.21,26 The silencing efficacy was verified with Western blot assays.
Fluorescence-activated cell sorting (FACS), cell cycle profile and proliferation analysis
Cells were fixed in 70% ice-cold ethanol and stored at −30 °C overnight, after which they were washed twice with ice-cold phosphate buffered saline (PBS) supplemented with 1% FBS and stained with PI solution (5 μg/mL PI in PBS, 0.5% Triton x-100, and 0.5 μg/mL RNase A) for 30 min at 37 °C in the dark. The cell cycle distribution was then evaluated based on cellular DNA content using FACS. For proliferation analysis, the cells were treated and processed with FITC-BrdU (5-bromo-2-deoxyuridine) Flow Kits according to the manufacturer’s instructions (BD Biosciences). All samples were analyzed using the FACSCalibur flow cytometer (BD Biosciences). Data were analyzed using Cell Quest Pro software (BD Biosciences).
Oxygen consumption rate (OCR) measurement
The cellular OCR was detected using an XF24 bioenergetic assay according to the manufacturer’s protocol (Seahorse Bioscience, Billerica, MA, USA). In brief, A2058 cells were seeded onto an XF24 microplate in DMEM supplemented with 5% FBS. They were then incubated for 2 days, after which the medium was replaced with sodium bicarbonate-free DMEM supplemented with 1% FBS. The OCR was measured at a steady state, after which the machine sequentially added the following standardization samples to the wells to obtain the maximal and non-mitochondrial respiration rates: 0.5 μM and 1 μM), oligomycin (1 μM), carbonyl cyanide 4-[trifluoromethoxy] phenylhydrazone (FCCP; 1 μM), and a mixture of rotenone (1 μM) and myxothiazol (1 μM).
Colony formation and anchorage-independent growth assay
For colony formation analysis, A2058 cells were plated in 6-well plates at a density of 500 cells/well and cultured for 10 days. The colonies were then fixed with methanol and stained with 0.5% crystal violet. Colonies were measured using ImageJ software (National Institutes of Health, Bethesda, MD, USA), and those larger than 0.1 mm in diameter were counted. For anchorage-independent growth assay, A2058 cells (2×10³) were seeded into six-well plates in medium containing 0.35% SeaPlaque Agarose (Lonza Rockland, Inc.) on top of a base medium containing 0.5% agarose. After incubation for 20 days, the colonies were stained with crystal violet, and colonies greater than 50 μm in diameter were counted using ImageJ software.
Statistical analysis
Values are expressed as the means ± SD of at least three independent experiments. All comparisons between groups were performed using the Student’s t-tests. Statistical significance was set at p<0.05.
Results
Metformin activates AMPK to decrease DEC1 levels via a Ubiquitin-dependent pathway in HeLa cells
Biguanides reportedly activates AMPK to decrease adiposity and increase insulin sensitivity.14,16 Here, we confirmed that metformin activates AMPK (increases the p-AMPK/total AMPK ratio) and decreases adiposity (increases the p-ACC/total ACC ratio or decreases FASN) in HeLa cells (Figure 1A). Our laboratory previously showed that metformin may also destabilize p53 and decrease DEC1 levels, thereby increasing apoptosis.21 In the present study, we confirmed that DEC1 levels are decreased by metformin. In addition, using the proteasome inhibitor MG132, we verified that DEC1 is degraded via the Ubiquitin-dependent 26S proteasome pathway (Figure 1B). MG132 failed to suppress metformin-induced DEC1 degradation. Like p53, DEC1 is a short-lived protein (Figure 1C). We transiently transfected HeLa cells with a DEC1 expression vector and found that levels of both exogenous DEC1 and the endogenous protein were decreased when the cells were treated with metformin (Figure 1D), which suggests metformin may work at the translational stage. Our results further showed that metformin increases levels of cleaved PARP, an apoptosis marker, in association with lower levels of survivin (Figure 1D). We thus reconfirmed that metformin strongly activates AMPK in HeLa cells and further showed that MG132 fails to suppress metformin-induced degradation of DEC1 as well as p53, which we also demonstrated in an earlier work.21
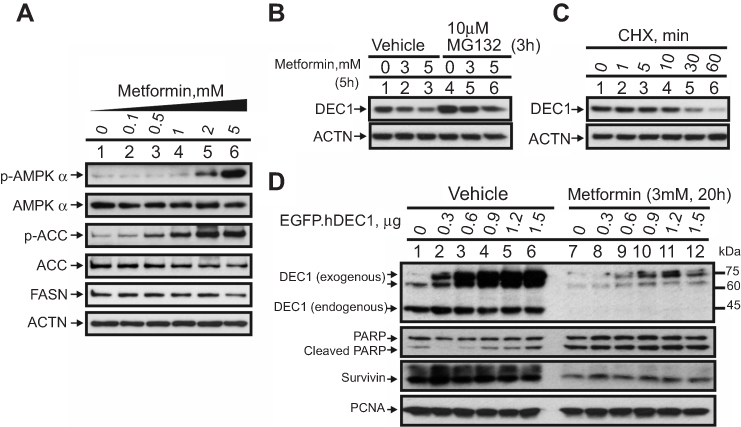 |
Figure 1 Negative effect of metformin on DEC1 expression in HeLa cells. HeLa cells were treated with (A) the indicated concentrations of metformin for 16 h; with (B) the indicated concentrations of metformin for 5 h plus 10 μM MG132 for 3 h; or with (C) 50 μg/mL CHX for indicated times. Cell lysates were subject to Western blot analysis using antibodies against AMPKα, p-AMPKα, ACC, p-ACC, FASN and DEC-1; ACTN served as the loading control. (D) HeLa cells were transiently transfected with the indicated amounts of pEGFP.DEC1 or 1 μg of empty pEGFP vector (control) and treated with 3 mM metformin for 20 h. Cell lysates were subjected to Western blot analysis using antibodies against DEC1, PARP and survivin; PCNA was the loading control. The results are representative of two independent experiments. |
P53 transcriptionally represses DEC1 and activates p21 in HeLa cells
Because the relationship between p53 and DEC1 is unclear, we compared the effect of p53 on the expression of DEC1 and p21, a known p53-responsive gene,24 in HeLa cells. The results summarized in Figure 2A and B suggest that at a lower dose, p53 represses DEC1 promoter activity but enhances p21 promoter activity (compare open columns). Cell responses to a p53 coactivator, mZac1 (a mouse zinc-finger protein which regulates apoptosis and cell cycle arrest 1), showed that the HeLa cells were well cultured and functional (Figure 2A and B, closed columns), and responded in a manner consistent with our earlier studies on p21 promoter activities.22,24 We further examined the repression domain of p53 using several p53 constructs, including N-truncated, C-truncated, and N-terminal and C-terminal fragments. We found that the N-terminal region of p53 (residues 1–94) likely plays the primary role in repressing DEC1 promoter activity (Figure 2C, compare histogram 2 with 4 and 5). Using a dominant negative p53 mutant (R175H) to verify the specificity of p53’s action at the DEC1 promoter, we found that p53, itself, acts directly to repress DEC1 promoter activity in the absence or presence of mZac1 (Figure 2D).
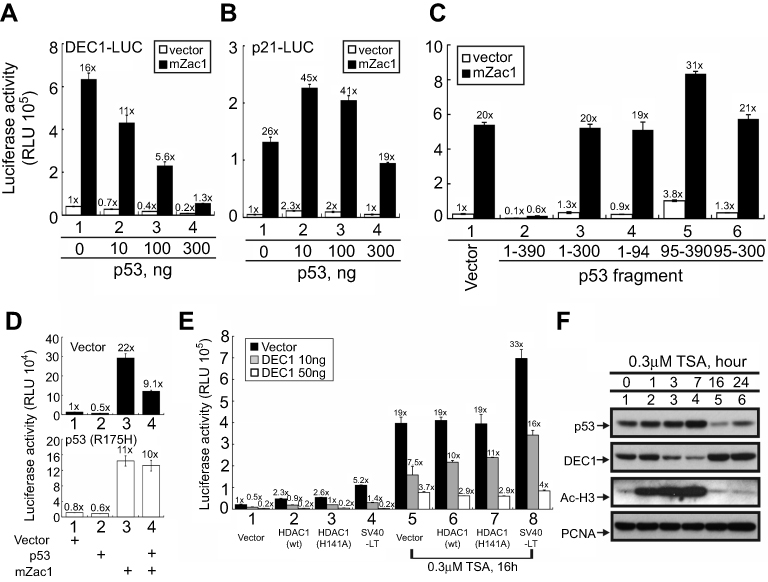 |
Figure 2 Factors modulating DEC1 expression in HeLa cells. HeLa cells were transiently transfected with 0.5 μg of (A) DEC1 promoter or (B) p21 promoter and the indicated amounts of p53 plus 0.5 μg mZac1 vector. (C–E) HeLa cells were transiently transfected for 16 h with 0.5 μg of DEC1 promoter and: (C) 0.25 μg of the indicated p53 fragment; (D) p53 (R175H) plus 0.5 μg of mZac1; or (E) wild-type (wt) HDAC1, enzyme-dead (H141A) HDAC1, or SV40-LT, with or without 0.3 μM TSA. Cells were then cultured for 36 h and harvested for luciferase reporter assays. Data are averages of three experiments (mean ± SD; n=3). (F) HeLa cells were treated with 0.3 μM TSA for 16 h, after which cell lysates were subjected to Western blot analysis using antibodies against p53, DEC1, and acetylated histone H3; PCNA was the loading control. The results are representative of three independent experiments. |
A previous study showed that trichostatin A (TSA), a histone deacetylase (HDAC) inhibitor, abrogates DEC1-mediated repression of its own promoter, leading to induction of DEC1 expression.7 We therefore used TSA to examine the involvement of HDAC1 in the regulation of DEC1 expression in HeLa cells. We found that wild-type and enzyme-dead HDAC1 as well as SV40 large T antigen (SV40-LT), a well-known repressor for p53 transactivation activity,27 all increase DEC1 promoter activity, and that these effects were dose-dependently suppressed by exogenous DEC1 via protein-protein interactions (Figure 2E, compare histograms 1–4). TSA also increased DEC1 promoter activity by itself and inhibited the repressive effect of DEC1 on its own promoter activity (Figure 2E, compare histograms 5–8). Evaluation of the time-course of TSA’s effects in HeLa cells using Western blotting analysis showed that TSA suppression of histone H3 acetylation occurred within 1–7 h (Figure 2F, compare lanes 1–4). During the same period, p53 increased while DEC1 decreased. By the 16 and 24 h time points, however, DEC1 levels had dramatically increased while p53 levels had decreased, and the level of acetylated histone H3 had returned to baseline (Figure 2F, compare lanes 1, 5, and 6). Our findings suggest that the effect of p53 on DEC1 expression was dependent on the epigenetic status and amount of endogenous p53 protein.
DEC1 primarily regulates its own transcription in HeLa cells
DEC1 is a well-known transcription factor.2,7,9 Less clear is its functional effect on cell cycle-related proteins in HeLa cells. When we transiently transfected DEC1 into HeLa cells, we found that it dose-dependently increased p53, p21, and cyclin D1 proteins (Figure 3A), but had no apparent effect their mRNA expression (Figure 3B). Moreover, silencing DEC1 expression using shDEC1 had no effect on transcription of p53, p21, or cyclin D1 (Figure 3C). On the other hand, we observed that DEC1 exerted suppressive effects on pGL3 and DEC1 promoter reporter activities (Figure 3D and E), but that at a very low dose DEC1 activated its own promoter (Figure 3F). We also found that both SIRT1 and HDAC1 activated the DEC1 promoter (Figure 2E), but that SIRT1 could have a positive or negative effect depending on the dose (Figure 3G). These findings suggest that expression of DEC1 is finely tuned by a regulatory network composed of its interacting proteins, including p53, HDAC1, and SirT1, in our study.
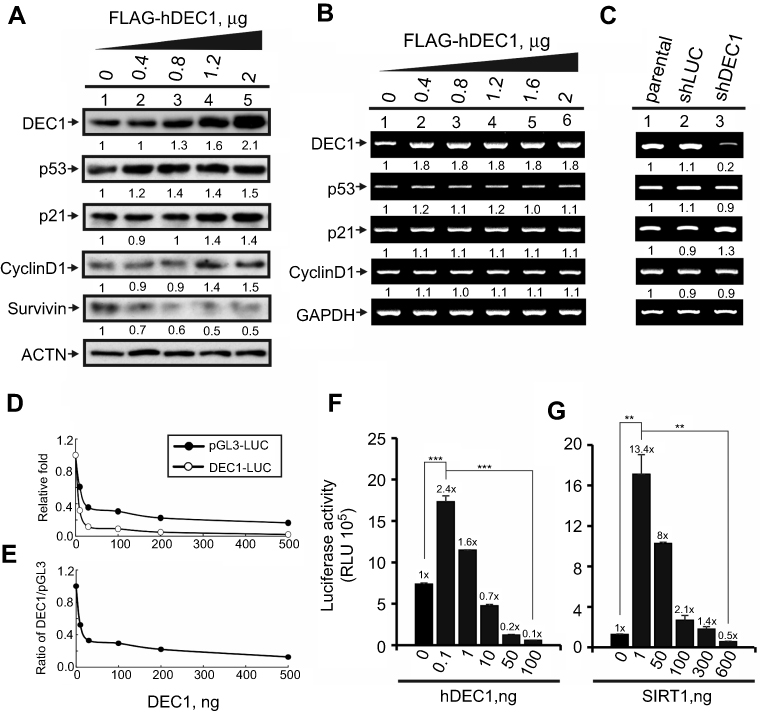 |
Figure 3 The functions DEC1 in transcriptional regulation. (A and B) HeLa cells were transiently transfected with the indicated amount of pFlag.DEC1. Cell lysates were then subjected to (A) Western blot analysis using antibodies against DEC1, p53, p21, cyclin D1, and survivin; or (B) RT-PCR analysis of DEC1, p53, p21, and cyclin D1. ACTN was the protein loading control, and GAPDH was the mRNA loading control. (C) DEC1 was knocked down (shDEC1) in HeLa cells, after which the cells were subjected to RT-PCR analysis of DEC1, p53, p21, and cyclin D1. Protein and PCR bands (A-C) were quantified through pixel density scanning and evaluated using ImageJ, version 1.44a (http://imagej.nih.gov/ij/). The fold was normalized to the internal control for the protein or gene. (D and E) HeLa cells were transiently transfected with 0.5 μg of DEC1 promoter, pGL3 reporter, and the indicated amount of p53. Plotted are the concentration-dependent effects of DEC-1 on (D) the relative level of reporter activity and (E) the DEC1-to-pGL3 reporter activity ratio. (F and G) HeLa cells were transiently transfected with 0.5 μg DEC1 promoter and indicated amounts of (F) DEC1 or (G) SIRT1. Cells were cultured for 36 h and harvested for luciferase reporter assays. Data are averages of three experiments (mean ± SD; n=3). **p<0.01, and ***p<0.005 (Student’s t-test). |
Phenformin and metformin downregulate p53 and DEC1 genes and proteins in HeLa and A2058 cells
Earlier studies showed that metformin’s cytotoxicity makes it a potential antitumor drug.19,21,28,29 Our previous study identified metformin as a promising antitumor drug in HeLa cells.21 Here, we sought to assess the cytotoxic effects of another biguanide, phenformin, and to determine whether DEC1 plays important roles in phenformin-induced cytotoxicity in HeLa and A2058 melanoma cells. We chose the A2058 cell line based on the suppression of AMPK functions in most melanoma cancer cells. We first observed that phenformin decreased levels of p53, DEC1, p21, and survivin mRNA (Figure 4A) and protein (Figure 4B) in HeLa cells. DEC1 mRNAi efficiently silenced DEC1 expression in both HeLa and A2058 cells (Figure 4C and D, compare lanes 5 and 9). Knocking down DEC1 in A2058 cells led to decreased levels of survivin (Figure 4C, compare lanes 8 and 12) but increased levels of cyclin D1 (Figure 4D, compare lanes 5 and 6 with 9 and 10). In summary, our data suggest that metformin and phenformin have similar antitumor activities in HeLa and A2058 cells.
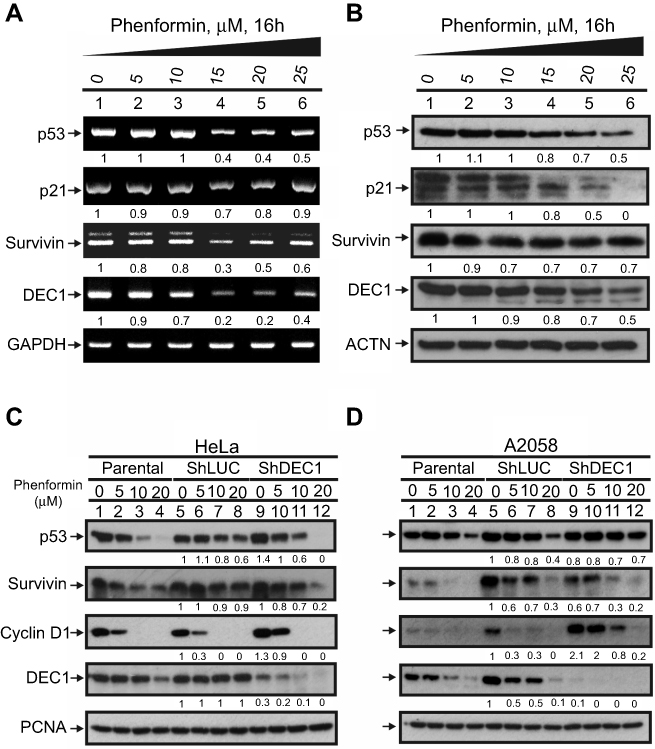 |
Figure 4 Cross-talk between phenformin and DEC1 in HeLa and A2058 cells. (A and B) HeLa cells were treated for 16 h with the indicated concentration of phenformin. Cell lysates were then subjected to (A) RT-PCR or (B) Western blot analysis of p53, p21, DEC1, and survivin. GAPDH was the mRNA loading control, while ACTN was the protein loading control. PCR and protein bands (A and B) were quantified through pixel density scanning and evaluated using ImageJ. The fold was normalized to the control for the gene or protein. (C and D) DEC1 was knocked down in (C) HeLa and (D) A2058 cells, which were then treated for 16 h with the indicated concentration of phenformin. Cell lysates were subjected to Western blot analysis using antibodies against p53, survivin, cyclin D1, and DEC1. PCNA was the protein loading control. Protein bands (C and D) were quantified through pixel density scanning and evaluated using ImageJ. The fold was compared with shLUC, normalized to the internal control protein PCNA. The results are representative of three independent experiments. |
DEC1 partially suppresses the phenformin-induced subG1 population by downregulating the S phase population in HeLa and A2058 cells
Based on earlier work and the effects of metformin and phenformin on cyclin D1 and p21 summarized in Figures 3 and 4, we further examined the effect of phenformin on the cell cycle profiles of HeLa and A2058 cells.21 Examination of their cell cycle profiles showed that phenformin increased the subG1 population while decreasing the G1 population in HeLa cells, and decreased the G1 and G2/M populations in A2058 cells (Figure 5A and B). DEC1 knockdown increased the G2/M population in both cell lines, increased the subG1 population in HeLa cells, and selectively decreased the G1 and S populations in A2058 cells (Figure 5A and B). Here, metformin and phenformin displayed diffent effects on the cell cycle profiles, though they both induced subG1 populations in HeLa and A2058 cells. The functional impacts of DEC1 on the apoptotic index and subG1 populations in these two cell lines also differed.
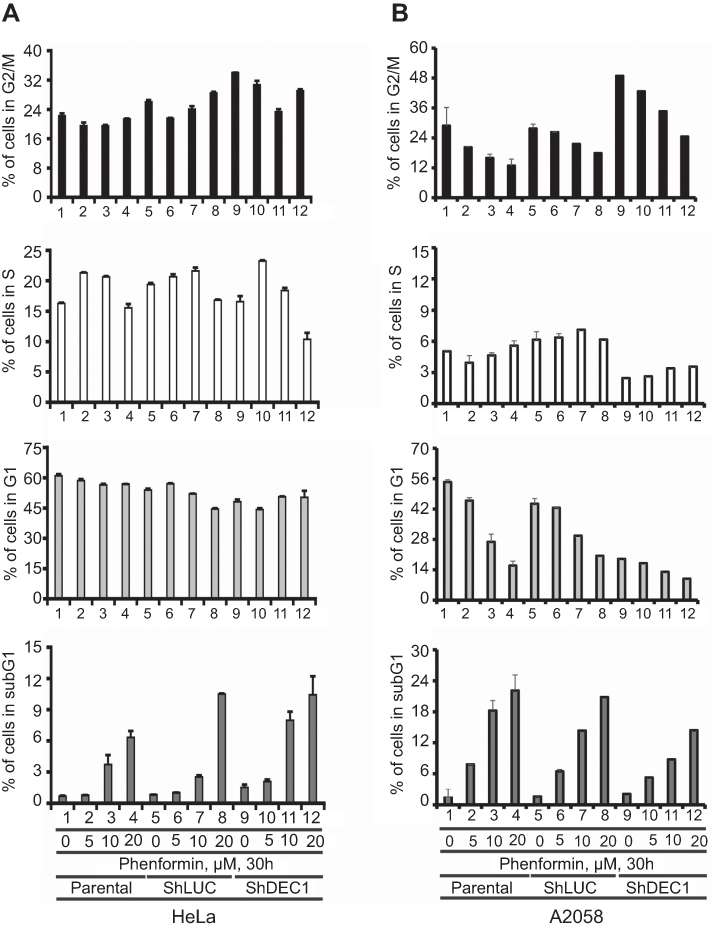 |
Figure 5 Effects of phenformin and DEC1 on the cell cycle profile of HeLa and A2058 cells. DEC1 was knocked down in (A) HeLa and (B) A2058 cells, which were then treated for 30 h with the indicated concentration of phenformin. Cell lysates were subjected to cell cycle profiling using flow cytometry. The results are representative of two independent experiments. |
Phenformin suppresses mitochondrial function, anchorage-independent growth, and cell invasiveness and proliferation in A2058 cells
Guanide-containing drugs exert their cytotoxic effects in part through disruption of mitochondrial function, mediated through mitochondrial complex I.14,28 We previously found that the effects of metformin on mitochondrial function led to decreases in the OCR in HeLa cells.21 Here, we observed that phenformin or DEC1 knockdown reduced OCR in A2058 cells (Figure 6A and B), and that phenformin had a more dramatic effect. Phenformin strongly suppressed several mitochondrial functions, including basal and maximal respiration, spare respiration capacity, non-mitochondrial respiration, and ATP production. (Figure 6B and C). These data suggest that DEC1 plays an important role in the aforementioned mitochondrial functions.
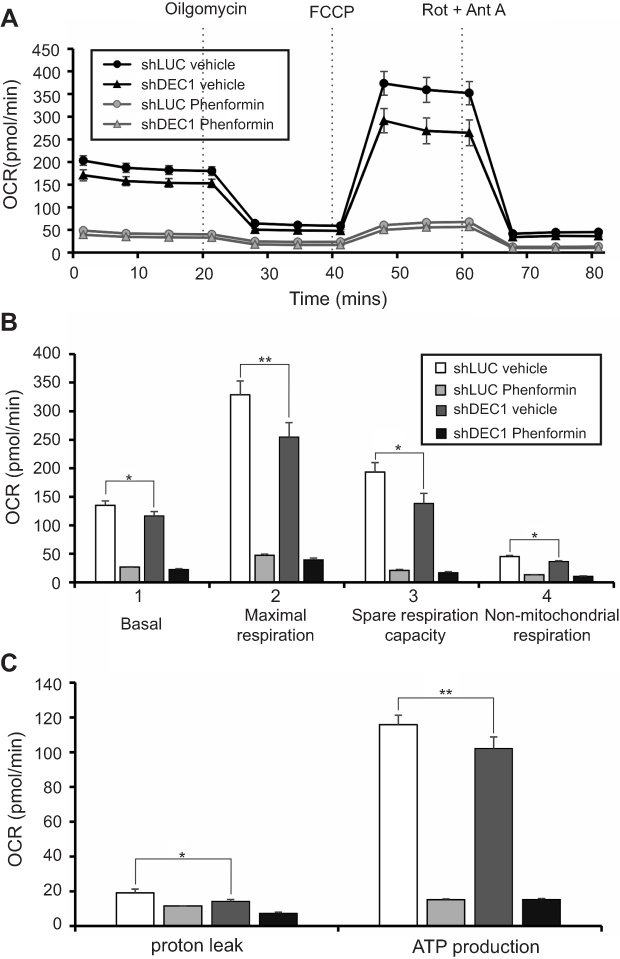 |
Figure 6 Effects of phenformin and DEC1 on the OCR in A2058 cells. DEC1 was knocked down in A2058 cells, which were then treated for 16 h with 10 μM phenformin. The cellular OCR was measured using an XF24 bio-energetic assay. The results are representative of three independent experiments. *p<0.05 and **p<0.01 (Student’s t-test). |
Many studies have shown that metformin inhibits aspects of tumorigenesis, including cell proliferation, migration, and invasion, and induces apoptosis mediated through highly variable genes and/or pathways.30 To further explore its potential antitumor effects, we assessed the effects of phenformin on colony formation and anchorage-independent growth by A2058 cells. We found that phenformin suppressed both the colony formation (Figure 7A and B) and anchorage-independent growth (Figure 7C and D) of A2058 cells. On the other hand, DEC1 knockdown increased both basal activity of colony formation and anchorage-independent growth.
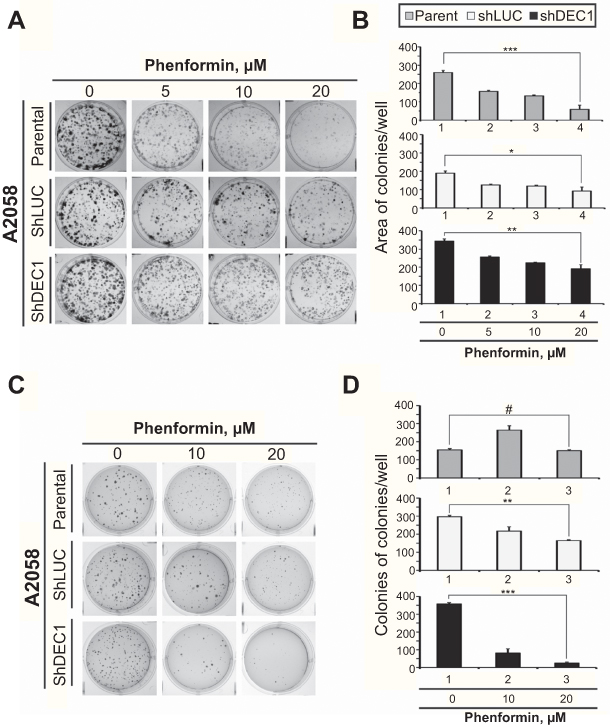 |
Figure 7 Effects of phenformin and DEC1 on colony formation and anchorage-independent growth of A2058 cells. DEC1 was knocked down in A2058 cells, which were then treated with indicated concentration of phenformin for (A) 10 days (the colony formation) or (B) 20 days (the anchorage-independent growth). The results are representative of two independent experiments. #p>0.05, *p<0.05, **p<0.01, and ***p<0.005 (Student’s t-test). |
Finally, we sought to examine the effects of phenformin and DEC1 on cellular proliferation. BrdU incorporation assays showed that phenformin suppressed cellular proliferation, but DEC1 knockdown reversed that effect (Figure 8). These findings suggest DEC1 is a strong repressor of cellular proliferation. Hence, the downregulation of DEC1 expression by guanide-containing drugs may enhance the colony formation, anchorage-independent growth, and proliferation of A2058 cells, revealing the complex role played by DEC1 activity in tumorigenicity.
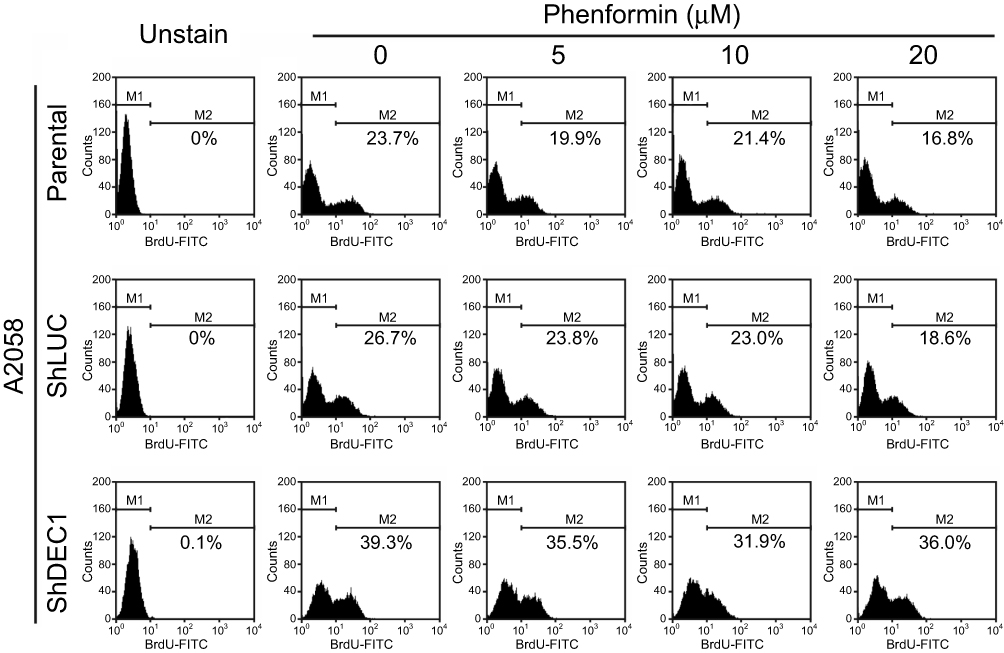 |
Figure 8 Effects of phenformin and DEC1 on proliferation of A2058 cells. DEC1 was knocked down in A2058 cells, which were then treated for 16 h with the indicated concentration of phenformin. Cell proliferation measured was measured based on BrdU incorporation using flow cytometry. The results are representative of three independent experiments. |
Discussion
In this study, we examined two guanide-containing drugs, metformin and phenformin, and found that both exhibit cytotoxicity against human cervical carcinoma and melanoma cell lines. That effect was mediated in part through activation of AMPK and degradation of cellular proteins, such as DEC1 and p53. In addition, these drugs suppressed various cellular processes, including mitochondrial function, anchorage-independent growth, and cellular proliferation. These effects appear to reflect, at least in part, the positive actions of DEC1 in tumorigenesis. However, the details of the finely tuned gene network regulated by DEC1 remain to be investigated in the future.
DEC1 is a well-known transcriptional repressor that exhibits negative autoregulation suppressing its own gene expression.3,31 However, we demonstrated that, at very low doses, DEC1 may enhance its own promoter activity, which suggests that degradation of DEC1 induced by metformin or phenformin could have positive or negative effects on tumorigenesis. DEC1 is also reportedly involved in tumorigenesis, hypoxia responses, and immunological reactions.2,5,8,12 These actions of DEC1 are mediated by its direct binding to E-box elements in target genes or by protein-protein interactions with the transcription factors HIF-1α, p53, myogenin, and STAT1.11,12,32–35 Several studies have reported that DEC1 induces apoptosis, epithelial-mesenchymal transition, and senescence in tumor cells.8,11,28,32 From our results, we cannot yet say whether DEC1 has an important effect on tumor progression. Nonetheless, taking into consideration the effects of DEC1 summarized above, it could be used as a target gene to test for potentially effective antitumor agents.
The primary target of guanide-containing drugs is mitochondrial complex I and reduced ATP generation. In diabetics, activation of AMPK initiates a signaling cascade to reduce gluconeogenesis and, consequently, to lower circulating levels of glucose and insulin. In addition, guanide-containing drugs downregulate p53 and DEC1 expression, and the AMPK pathway may also be a target in HeLa and A2058 cells. In both the present study and our earlier work, we observed that metformin and phenformin may disrupt electron transport and ATP production and induce apoptosis. However, details of the signaling pathways involved in the transcriptional and posttranslational regulation of p53 and DEC1 remain to be clarified, as does the impact of physical and functional interaction between DEC1 and p53 on cellular functions, including apoptosis, senescence, proliferation, and anchorage-independent growth.
Its low risk and beneficial characteristics have made metformin one of the most popular medications in the world. However, the idea of repositioning guanide-containing for cancer therapy or prevention is also applicable to buformin and phenformin, both of which exhibit antitumor effects similar to those of metformin. Although biguanides exhibit antidiabetic effects at lower doses, higher doses may exert direct antitumor effects. There is thus a range of doses within which biguanides could be used in the treatment of type II diabetes mellitus or cancer.28 Moreover, a recent “phospho-switch” study showed that metformin protects AMPK-mediated phosphorylation of serine 99 of ten-eleven translocation 2 (TET 2), thereby increasing TET 2 stability and 5-hydroxymethylcytosine (5hmC) levels, which connects diabetes to cancer.36 This suggests the in vivo antitumor effects of metformin may operate through an AMPK–TET2–5hmC axis. Hence, biguanides, including metformin, may directly reprogram the epigenome towards an anti-oncogenic state, offering a potential strategy for cancer prevention and treatment.
Conclusions
In this study, we found metformin and phenformin exhibit cytotoxicity mediated, at least in part, through activation of the AMPK pathway; degradation of cellular proteins such as DEC1 and p53; and suppression of mitochondrial function, anchorage-independent growth and cellular invasiveness and proliferation in human cervical carcinoma and melanoma cell lines. Moreover, the repressive actions of DEC1 may contribute to those effects through its ability to induce apoptosis and suppress anchorage-independent cell growth and proliferation. Hence, our findings provide several lines of evidence suggesting that DEC1 activity contributes to tumorigenicity and that the antitumor properties of biguanides reflect their ability inhibit DEC1 functions.
Abbreviation list
ACC, acetyl-CoA carboxylase; Ac-H3, acetylated form of histone H3 at lysine 9/14; ACTN, α-actinin; AMPK, AMP-activated protein kinase; CHX, cycloheximide; DEC1, Differentiated Embryo Chondrocyte 1; DMEM, Dulbecco’s modified Eagle’s medium; FACS, fluorescence- activated cell sorting; FBS, fetal bovine serum; FASN, fatty acid synthase; FCCP, carbonyl cyanide 4-[trifluoromethoxy] phenylhydrazone; FITC, fluorescein isothiocyanate; HDAC, histone deacetylase; OCR, oxygen consumption rate; cPARP, cleaved poly-ADP-ribose polymerase; PBS, phosphate buffered saline; PCNA, proliferating cell nuclear antigen; PI, propidium iodide; RLU, relative light units; RT-PCR, reverse transcription-polymerase chain reaction; TSA, trichostatin A.
Acknowledgments
This work was supported by grants from the Ministry of National Defense-Medical Affairs Bureau [MAB–107–006 and –010 to S-M HUANG], the Ministry of Science and Technology [MOST 107-2314–B–016–026-MY3 to W-M Wang], Taiwan, ROC.
Author contributions
All authors contributed to data analysis, drafting or revising the article, gave final approval of the version to be published, and agree to be accountable for all aspects of the work.
Disclosure
The authors declare that they have no competing interests in this work.
References
1. Massari ME, Murre C. Helix-loop-helix proteins: regulators of transcription in eucaryotic organisms. Mol Cell Biol. 2000;20(2):429–440. doi:10.1128/mcb.20.2.429-440.2000
2. Honma S, Kawamoto T, Takagi Y, et al. Dec1 and Dec2 are regulators of the mammalian molecular clock. Nature. 2002;419(6909):841–844. doi:10.1038/nature01123
3. Li Y, Xie M, Song X, et al. DEC1 negatively regulates the expression of DEC2 through binding to the E-box in the proximal promoter. J Biol Chem. 2003;278(19):16899–16907. doi:10.1074/jbc.M300596200
4. St-Pierre B, Flock G, Zacksenhaus E, Egan SE. Stra13 homodimers repress transcription through class B E-box elements. J Biol Chem. 2002;277(48):46544–46551. doi:10.1074/jbc.M111652200
5. Park YK, Park H. Differentiated embryo chondrocyte 1 (DEC1) represses PPARgamma2 gene through interacting with CCAAT/enhancer binding protein beta (C/EBPbeta). Mol Cells. 2012;33(6):575–581. doi:10.1007/s10059-012-0002-9
6. Qian Y, Zhang J, Jung YS, Chen X. DEC1 coordinates with HDAC8 to differentially regulate TAp73 and DeltaNp73 expression. PLoS One. 2014;9(1):e84015. doi:10.1371/journal.pone.0084015
7. Sun H, Taneja R. Stra13 expression is associated with growth arrest and represses transcription through histone deacetylase (HDAC)-dependent and HDAC-independent mechanisms. Proc Natl Acad Sci U S A. 2000;97(8):4058–4063. doi:10.1073/pnas.070526297
8. Nakamura H, Bono H, Hiyama K, et al. Differentiated embryo chondrocyte plays a crucial role in DNA damage response via transcriptional regulation under hypoxic conditions. PLoS One. 2018;13(2):e0192136. doi:10.1371/journal.pone.0192136
9. Cho Y, Noshiro M, Choi M, et al. The basic helix-loop-helix proteins differentiated embryo chondrocyte (DEC) 1 and DEC2 function as corepressors of retinoid X receptors. Mol Pharmacol. 2009;76(6):1360–1369. doi:10.1124/mol.109.057000
10. Bi H, Li S, Qu X, et al. DEC1 regulates breast cancer cell proliferation by stabilizing cyclin E protein and delays the progression of cell cycle S phase. Cell Death Dis. 2015;6:e1891. doi:10.1038/cddis.2015.247
11. Qian Y, Zhang J, Yan B, Chen X. DEC1, a basic helix-loop-helix transcription factor and a novel target gene of the p53 family, mediates p53-dependent premature senescence. J Biol Chem. 2008;283(5):2896–2905. doi:10.1074/jbc.M708624200
12. Qian Y, Jung YS, Chen X. Differentiated embryo-chondrocyte expressed gene 1 regulates p53-dependent cell survival versus cell death through macrophage inhibitory cytokine-1. Proc Natl Acad Sci U S A. 2012;109(28):11300–11305. doi:10.1073/pnas.1203185109
13. Foretz M, Guigas B, Bertrand L, Pollak M, Viollet B. Metformin: from mechanisms of action to therapies. Cell Metab. 2014;20(6):953–966. doi:10.1016/j.cmet.2014.09.018
14. Scheen AJ, Esser N, Paquot N. Antidiabetic agents: potential anti-inflammatory activity beyond glucose control. Diabetes Metab. 2015;41(3):183–194. doi:10.1016/j.diabet.2015.02.003
15. American Diabetes Association. Standards of medical care in diabetes–2014. Diabetes Care. 2014;37 Suppl 1:S14–S80. doi:10.2337/dc14-S014
16. Viollet B, Guigas B, Sanz Garcia N, Leclerc J, Foretz M, Andreelli F. Cellular and molecular mechanisms of metformin: an overview. Clin Sci (Lond). 2012;122(6):253–270. doi:10.1042/CS20110386
17. Novelle MG, Ali A, Dieguez C, Bernier M, de Cabo R. Metformin: a hopeful promise in aging research. Cold Spring Harb Perspect Med. 2016;6(3):a025932. doi:10.1101/cshperspect.a025932
18. Kasznicki J, Sliwinska A, Drzewoski J. Metformin in cancer prevention and therapy. Ann Transl Med. 2014;2(6):57.
19. Rizos CV, Elisaf MS. Metformin and cancer. Eur J Pharmacol. 2013;705(1–3):96–108. doi:10.1016/j.ejphar.2013.02.038
20. Quinn BJ, Kitagawa H, Memmott RM, Gills JJ, Dennis PA. Repositioning metformin for cancer prevention and treatment. Trends Endocrinol Metab. 2013;24(9):469–480. doi:10.1016/j.tem.2013.05.004
21. Li SM H, Liu ST, Chang YL, Ho CL, Huang SM. Metformin causes cancer cell death through downregulation of p53-dependent differentiated embryo chondrocyte 1. J Biomed Sci. 2018;25(1):81. doi:10.1186/s12929-018-0408-6
22. Huang SM, Schonthal AH, Stallcup MR. Enhancement of p53-dependent gene activation by the transcriptional coactivator Zac1. Oncogene. 2001;20(17):2134–2143. doi:10.1038/sj.onc.1204298
23. Huang SM, Stallcup MR. Mouse Zac1, a transcriptional coactivator and repressor for nuclear receptors. Mol Cell Biol. 2000;20(5):1855–1867. doi:10.1128/mcb.20.5.1855-1867.2000
24. Liu PY, Chan JY, Lin HC, et al. Modulation of the cyclin-dependent kinase inhibitor p21(WAF1/Cip1) gene by Zac1 through the antagonistic regulators p53 and histone deacetylase 1 in HeLa Cells. Mol Cancer Res. 2008;6(7):1204–1214. doi:10.1158/1541-7786.MCR-08-0123
25. Chan JY-H, Chen Y-C, Liu S-T, Chou W-Y, Ho C-L, Huang S-M. Characterization of a new mouse p53 variant: loss-of-function and gain-of-function. J Biomed Sci. 2014;21:40. doi:10.1186/1423-0127-21-40
26. Chen YC, Chan JY, Chiu YL, et al. Grail as a molecular determinant for the functions of the tumor suppressor p53 in tumorigenesis. Cell Death Differ. 2013;20(5):732–743. doi:10.1038/cdd.2013.1
27. Pipas JM, Levine AJ. Role of T antigen interactions with p53 in tumorigenesis. Semin Cancer Biol. 2001;11(1):23–30. doi:10.1006/scbi.2000.0343
28. Menendez JA, Quirantes-Pine R, Rodriguez-Gallego E, et al. Oncobiguanides: paracelsus’ law and nonconventional routes for administering diabetobiguanides for cancer treatment. Oncotarget. 2014;5(9):2344–2348. doi:10.18632/oncotarget.1965
29. Del Barco S, Vazquez-Martin A, Cufi S, et al. Metformin: multi-faceted protection against cancer. Oncotarget. 2011;2(12):896–917. doi:10.18632/oncotarget.387
30. Safe S, Nair V, Karki K. Metformin-induced anticancer activities: recent insights. Biol Chem. 2018;399(4):321–335. doi:10.1515/hsz-2017-0271
31. Fujita Y, Makishima M, Bhawal UK. Differentiated embryo chondrocyte 1 (DEC1) is a novel negative regulator of hepatic fibroblast growth factor 21 (FGF21) in aging mice. Biochem Biophys Res Commun. 2016;469(3):477–482. doi:10.1016/j.bbrc.2015.12.045
32. Murakami K, Wu Y, Imaizumi T, et al. DEC1 promotes hypoxia-induced epithelial-mesenchymal transition (EMT) in human hepatocellular carcinoma cells. Biomed Res. 2017;38(4):221–227. doi:10.2220/biomedres.38.221
33. Ma W, Shi X, Lu S, Wu L, Wang Y. Hypoxia-induced overexpression of DEC1 is regulated by HIF-1alpha in hepatocellular carcinoma. Oncol Rep. 2013;30(6):2957–2962. doi:10.3892/or.2013.2774
34. Huang Y, Lai X, Hu L, et al. Over-expression of DEC1 inhibits myogenic differentiation by modulating MyoG activity in bovine satellite cell. J Cell Physiol. 2018;233(12):9365–9374. doi:10.1002/jcp.26471
35. Ivanov SV, Salnikow K, Ivanova AV, Bai L, Lerman MI. Hypoxic repression of STAT1 and its downstream genes by a pVHL/HIF-1 target DEC1/STRA13. Oncogene. 2007;26(6):802–812. doi:10.1038/sj.onc.1209842
36. Wu D, Hu D, Chen H, et al. Glucose-regulated phosphorylation of TET2 by AMPK reveals a pathway linking diabetes to cancer. Nature. 2018;559(7715):637–641. doi:10.1038/s41586-018-0350-5
 © 2019 The Author(s). This work is published and licensed by Dove Medical Press Limited. The full terms of this license are available at https://www.dovepress.com/terms.php and incorporate the Creative Commons Attribution - Non Commercial (unported, v3.0) License.
By accessing the work you hereby accept the Terms. Non-commercial uses of the work are permitted without any further permission from Dove Medical Press Limited, provided the work is properly attributed. For permission for commercial use of this work, please see paragraphs 4.2 and 5 of our Terms.
© 2019 The Author(s). This work is published and licensed by Dove Medical Press Limited. The full terms of this license are available at https://www.dovepress.com/terms.php and incorporate the Creative Commons Attribution - Non Commercial (unported, v3.0) License.
By accessing the work you hereby accept the Terms. Non-commercial uses of the work are permitted without any further permission from Dove Medical Press Limited, provided the work is properly attributed. For permission for commercial use of this work, please see paragraphs 4.2 and 5 of our Terms.