")
Back to Journals » International Journal of Nanomedicine » Volume 14
The antitoxic effects of quercetin and quercetin-conjugated iron oxide nanoparticles (QNPs) against H2O2-induced toxicity in PC12 cells
Authors Yarjanli Z, Ghaedi K , Esmaeili A , Zarrabi A , Rahgozar S
Received 17 April 2019
Accepted for publication 27 June 2019
Published 26 August 2019 Volume 2019:14 Pages 6813—6830
DOI https://doi.org/10.2147/IJN.S212582
Checked for plagiarism Yes
Review by Single anonymous peer review
Peer reviewer comments 2
Editor who approved publication: Prof. Dr. Anderson Oliveira Lobo
Zahra Yarjanli,1 Kamran Ghaedi,1 Abolghasem Esmaeili,1 Ali Zarrabi,2,3 Soheila Rahgozar1
1Department of Biology, Faculty of Sciences, University of Isfahan, Isfahan, Iran; 2Department of Biotechnology, Faculty of Advanced Sciences and Technologies, University of Isfahan, Isfahan, Iran; 3Sabanci University Nanotechnology Research and Application Center (SUNUM), Istanbul, Turkey
Correspondence: Kamran Ghaedi
Department of Biology, Faculty of Sciences, University of Isfahan, Hezar Jerib Ave., Azadi Square, 81746 Isfahan, Iran
Tel +98 313 793 2479
Fax +98 313 793 2456
Email [email protected]
Background: We recently showed that quercetin-conjugated iron oxide nanoparticles (QNPs) promoted the bioavailability of quercetin (Qu) in the brain of rats and improved the learning and memory of diabetic rats. In this study, we characterized the modifications in the antitoxic effects of Qu after conjugation.
Materials and methods: We conjugated Qu to dextran-coated iron oxide nanoparticles (DNPs) and characterized DNPs and QNPs using FTIR, XRD, DLS, Fe-SEM, and EDX analyzes. The antiradical properties of Qu, DNPs, and QNPs were compared by 2, 2-diphenyl-1-picrylhydrazyl (DPPH) scavenging activity assay. Catalase-like activities of DNPs and QNPs were estimated using catalase activity assay kit, and the antitoxic effects of Qu and QNPs were evaluated with spectrophotometry, MTT assay, flow cytometry, and real-time q-PCR.
Results: Qu had a stronger anti-radical activity than DNPs and its activity decreased after being conjugated to DNPs. The catalase-like activity of DNPs remained intact after conjugation. DNPs had less toxicity on PC12 cells viabilities as compared to free Qu, and the conjugation of Qu with DNPs attenuated its cytotoxicity. Furthermore, MTT assay results indicated 24 h pretreatment with Qu had more protective effects than QNPs against H2O2-induced cytotoxicity, while Qu and QNPs had the same effects for 48 and 72 h incubation. Although the total antioxidant capacity of Qu was attenuated after conjugation, the results of flow cytometry and real-time q-PCR confirmed that 24 h pretreatment with the low concentrations of Qu and QNPs had the similar antioxidant, anti-inflammatory, and anti-apoptotic effects against the cytotoxicity of H2O2.
Conclusion: Qu and QNPs showed the similar protective activities against H2O2-induced toxicity in PC12 cells. Given the fact that QNPs have magnetic properties, they may serve as suitable carriers to be used in neural research and treatment.
Keywords: antitoxic effect, iron oxide nanoparticles, quercetin, PC12 cells
Introduction
Quercetin (Qu) (C15H10O7), 3, 3ʹ, 4ʹ, 5, 7-pentahydroxyflavone,1 is one of the polyphenolic compounds belonging to flavonol subclass of flavonoids,2 which has been widely studied for its antioxidant,3–5 anti-inflammatory,6–8 anti-apoptotic,9 and anti-cancer10 properties. Despite the useful properties of Qu, it cannot act as a drug due to low bioavailability, low solubility in water, rapid clearance from the body, fast metabolism, and degradation by enzymes.11 Therefore, for applying as a drug, Qu needs to undergo some manipulations.
Magnetic NPs, especially Fe3O4, have attracted a lot of attention in therapeutic applications such as MRI, drug delivery, cell tracking, hyperthermia, tissue engineering, magnetic separation, and biological separation.12 Hence we decided that applied these NPs as a candidate carrier for delivering Qu. Kumar and colleagues (2014) conjugated Qu to dextran- coated iron oxide nanoparticles (DNPs) to improve the anti-cancer properties of Qu on breast cancer cells (MCF-7).10 Our group also prepared Qu-conjugated DNPs (QNPs) (with some manipulation) and achieved interesting results in our previous studies.13,14
PC12 cells derived from rat adrenal phaeochromocytoma showed the sympatic neurons properties when were treated with nerve growth factor (NGF). These cells which are able to produce the neurotransmitters dopamine and norepinephrine,15 have used as a suitable cellular model in several studies.3,16,17 Given our previous study demonstrated the protective effects of QNPs on learning and memory in diabetes-model rats,14 it seems necessary to assay the protective effects of QNPs in a cellular model.
Hydrogen peroxide (H2O2) is one of the natural products of oxygen metabolism in cells which can react with cellular macromolecules and create a situation termed as oxidative stress which is related to a wide range of disorders including aging, stroke, atherosclerosis, cancer, diabetes, heart failure, and Parkinson disease.18 Hence, our group considered H2O2 as an oxidant agent to induce toxicity in PC12 cells and investigated the antitoxic properties of Qu against H2O2 before and after being conjugated to DNPs.
Materials and methods
Chemicals
All chemical material required for QNPs synthesis including Qu (≥95% purity, Q4951, molecular weight: 302.2 g.mol−1), dextran (molecular weight: 10,000 Da), Iron (III) chloride (FeCl3), and iron (II) chloride (FeCl2) were obtained from Sigma-Aldrich Co. (St Louis, MO, USA) or EMD Millipore Co. (Billerica, MA, USA). The materials required for cell culture including phosphate buffer saline (PBS), RPMI 1640, and others were purchased from Bioidea Co. (Tehran, Iran).
Synthesis of DNPs and QNPs
DNPs were prepared using chemical co-precipitation method (Figure 1), as reported in our previous study.13 1.135 g FeCl2, 0.695 g FeCl3 anhydrous, and 0.45 g dextran were dissolved in DI water using a magnetic stirrer. Then, the pH of the solution was increased to 9 by adding ammonia solution. The temperature of the solution was kept at 90 °C for 2 h, along with stirring. Then, the solution was cooled down to room temperature. Using a strong magnetic field, DNPs were precipitated and collected. After washing with DI water and alcohol, DNPs were dried in a freeze dryer apparatus (Zirbus, Vaco5, Germany) and used for characterization.
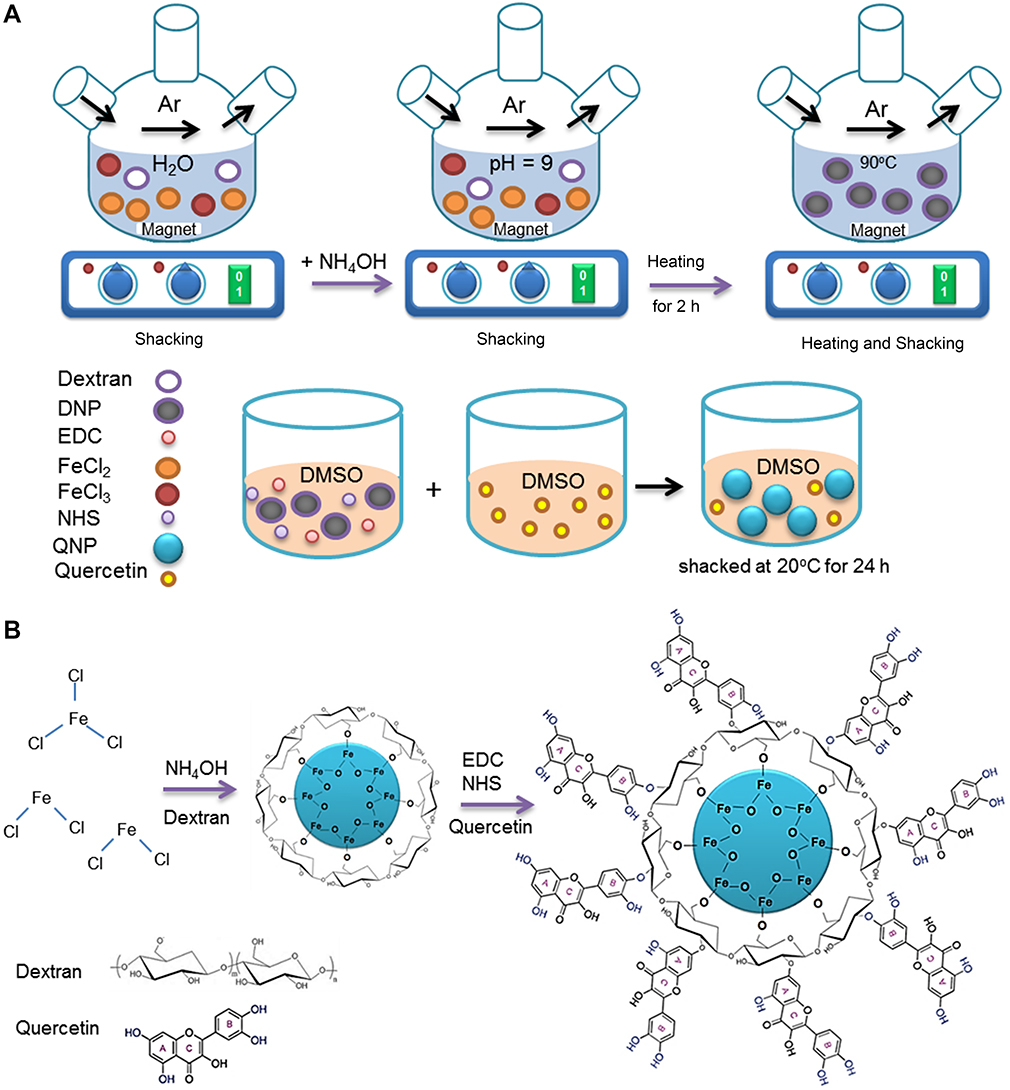 |
Figure 1 The steps of QNPs synthesis. (A) The schematic picture of DNPs and QNPs synthesis; DNPs were prepared using chemical co-precipitation method and in the presence of dextran; and Qu was conjugated to DNPs with helping EDC and NHS as linkers. (B) The chemical pathway of DNPs and QNPs synthesis. |
QNPs were synthesized in accordance with our previous study.13 Briefly, 10 mg DNPs was dissolved in dimethyl sulfoxide (DMSO) and a required amount of N-hydroxysuccinimide (NHS) and 1-ethyl-3-(3-dimethylaminopropyl) carbodiimide (EDC) were added to this mixture. The mixture was exposed to ultra-sonication for 30 min and then 10 mg Qu -dissolved in DMSO- was added to this mixture. The mixture was kept in a shaker incubator at 20 °C for 24 h. Using a strong magnet, resulted QNPs were collected and then dried in a freeze drier and used for further studies.
Characterization of DNPs and QNPs
To primarily compare solubility between Qu and QNPs, 1 mg of each sample was dissolved in 2 mL PBS inside a test tube. After 5 min observation, the results were reported as photos. 2 mg QNPs was dissolved in 2 mL PBS inside a test tube and then using a magnet, the magnetic property of QNPs was preliminary studied.
In order to evaluate the chemical interactions between Qu and DNPs, Fourier transform infrared (FTIR) spectrometry of free Qu, DNPs, and QNPs was conducted using a FT-IR spectrometer (JASCO FT/IR-6300, Japan) in the range of 350–7800 cm−1 by KBr pellet method. To study the crystalline structure of DNPs and QNPs, the X-ray diffraction (XRD) patterns were taken by X-ray diffractometer (BRUKER, D8 ADVANCE, Germany) at room temperature.
In order to investigate the size and shape of QNPs, dynamic light scattering (DLS) and field emission–scanning electron microscope (FE-SEM) investigations were implemented by VASCO FlexTM Particle Size Analyzer NanoQ V2.5.4.0 (USA) DLS and Hitachi S–4700 FE–SEM (Japan) respectively. The FE-SEM was equipped with an –energy dispersive X-ray analysis (EDX) detector for confirming the identities of iron oxide nanoparticles (IONPs).
Drug loading
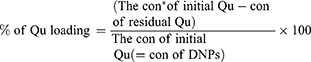
First, a calibration curve was drawn from the absorption value of Qu in DMSO. Using the absorption equation of Qu in DMSO (1), the concentration of residual (unloaded) Qu was calculated and then, the percentage of Qu loading on QNPs was estimated using equation (2).
(1)
*(Y: the absorption of Qu in DMSO and X: Qu concentration)
(2)
*concentration
Drug release study
In order to assess the Qu release from QNPs, a calibration curve was drawn from the absorption value of Qu in PBS and the absorption equation of Qu in PBS was calculated by Excel (3). Then, 1 mg QNPs was suspended in 1 mL of phosphate buffer saline (PBS, pH: 7.4) and poured into cellulose dialysis bags (with a molecular weight cut-off size 12,000 Da). Then, the dialysis bag was placed in 50 mL of PBS (pH: 7.4 or pH: 4.8). The dialysis was performed with constant shaking at 200 rpm at 37 °C ±0.5 °C. 1 mL of each sample was withdrawn and its absorption was taken at 260 nm wavelength by spectrophotometer (SHIMADZU, UV-1280, Japan) every 24 h. Then, the sample was returned to its dish. The percentage of Qu release was estimated using equation (4).
(3)
*(Y: the absorption of Qu in PBS and X: Qu concentration)
(4)
The catalase-like activity of DNPs and QNPs
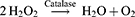
To determine the catalase-like activity of DNPs and QNPs, 1 mg DNPs or QNPs was added to 3 mL of H2O2 (10 M). The production of O2 gas, observable as bulbs in the soluble, considered a preliminary sign for the catalase-like activity of the NPs. In order to verify the catalase-like activity, a catalase activity (CAT) assay kit (ZellBio GmbH, Germany) was used. The 100 and 1000 µg.mL−1 doses of DNPs and QNPs were prepared; the catalase-like activities of samples were calculated according to the kit instruction with some alterations; and the results indicated as a graph.
(5)
The total antioxidant capacity evaluation of Qu and QNPs
For quantitative assay of the total antioxidant capacity (TAC), the 100 and 1000 µg.mL−1 doses of QNPs and its equivalent of Qu (42 and 420 µg.mL−1) were prepared; the TACs of samples were calculated according to the instruction of TAC assay kit (ZellBio GmbH, Germany) with some alterations; and the results reported as a graph.
Free radical scavenging activity of Qu, DNPs, and QNPs
In order to compare the free radical scavenging activity of Qu, DNPs, and QNPs, 2, 2-diphenyl-1-picrylhydrazyl (DPPH) radicle (Sigma-Aldrich, Darmstadt, Germany) was used according to kit protocol with some manipulations. In a typical procedure, 3 mg Qu, DNPs, and QNPs were weighted and then 10, 100, and 1000 µg.mL−1 concentrations of Qu, DNPs, and QNPs in methanol were prepared. The solutions with ratio 1 mL DPPH (0.5 mM in methanol) to 3 mL of methanol (as control) or sample were prepared. The absorption of the solution was taken in 517 nm wavelength with a spectrophotometer (SHIMADZU, UV-1280, Japan) after 0.5, 3, 6, 9, and 12 h. The percentage of inhibition was calculated for each sample using equation (6).
(6)
Cell culture and MTT assay
PC12 cells were purchased from Pasteur Institute of Iran (Tehran, Iran) and cultured in RPMI 1640 media containing 10% fetal bovine serum (FBS), 1% L-glutamine, and 1% penicillin/streptomycin (pen/strep), and incubated in 95% humidity and 5% CO2 at 37°C. To carry out cellular assays in this study, RPMI medium containing 5% FBS and 1% (pen/strep) was used.
To determine cell viability, PC12 cells were seeded on 96-well plates, at a density of 2×10⁴ cells.100 µL−1 medium in a well, and the cell viability was determined using 3-(4,5-dimethylthiazol-2-yl)-2,5-diphenyl tetrazolium bromide (MTT) reduction assay. Twenty four hours after seeding, the cells were incubated with the different concentrations of Qu (in medium containing 0.01% DMSO), DNPs, QNPs or H2O2 for 24, 48 or 72 h.
Then, the cells were washed with PBS and incubated with 0.25 mg MTT.mL−1 (final concentration) for 2–4 h at 37 °C. To dissolve the resulted formazan crystals, the medium was removed and 100 µL DMSO was added to each well. The absorbance of the wells was determined using an ELISA microplate reader (Awareness STAT FAX 2100,USA). Cell viabilities percentages were calculated using equation (7).
(7)
The entrance of QNPs into PC12 cells
In order to estimate the entrance of QNPs into PC12 cells, 5×10⁵ cells/15,000 µL medium (RPMI containing 5% FBS and 1% pen/strep) were seeded in each well of 6-well plate. After 24 h, the cells were incubated with 0, 5, 10, 25, 50, and 100 µg.mL−1 concentrations of QNPs for 24 h. After washing with PBS, unwashed QNPs were removed with the assistance of an external magnetic field. Then, the cells were trypsinized and counted. An equal number of the cells was picked up from each concentration of QNPs and exposed to 1 mL HCl 37% overnight. The resultant mixtures were filtered and diluted with 3 mL of PBS. Finally, the intracellular iron concentration was measured by inductively coupled plasma-optical emission spectrometer (ICP-OES) (Analytic Jena, PQ 9000, Germany) and reported as a graph.
In addition to ICP-OES, Prussian blue staining was performed to confirm QNPs entry to the cells. After incubating the cells with different concentrations of QNPs including 0, 25, 50, and 100 µg.mL−1 for 24 h, the cells were fixed with 4% paraformaldehyde and stained with 4% potassium ferrocyanide trihydrate/4% hydrochloric acid mixture (1:1, v/v) for 20 min at room temperature,19 and subsequently counterstained with neutral red solution (0.5%, w/v) for 5 min.
Investigating the antitoxic effects of Qu and QNPs against H2O2-induced toxicity on PC12 cells
To primary study the antitoxic effects of Qu and QNPs against toxicity of H2O2 in PC12 cells, MTT assay was done. In the following, to confirm the protective effects of Qu and QNPs and determine the mechanism involved in the protection, flow cytometry and real-time q-PCR techniques were carried out.
MTT cell viability assay
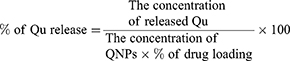
Different doses of QNPs including 0, 1, 2.5, 5, 10, 25, 50, and 100 µg.mL−1 were selected and then, given the percentage of drug loading, equivalent concentrations of conjugated Qu were calculated 0, 0.42, 1.05, 2.1, 4.2, 10.5, 21, and 42 µg.mL−1 (Equation 8), respectively. The cells were seeded on 96 well-plates, pretreated with the prepared doses of QNPs and Qu (in RPMI with 5% FBS and 0.01% DMSO) for 24, 48, and 72 h and after washing with PBS, treated with 1.5 mM H2O2 for 2 h. Finally, the percentage of PC12 cell viability was determined as explained before (Equation 7).
(8)
Flow cytometry technique
After pretreating PC12 cells with Qu or QNPs (in medium containing 0.01% DMSO), washing with PBS, and treating with H2O2, the cells were washed with PBS, trypsinized, and centrifuged. Then, the cells were exposed to 2′,7′-dichlorofluorescein diacetate (DCFDA, sigma, USA) 20 µM in PBS, cellular ROS detection assay kit, for 45 min at 37 °C and the fluorescence was measured on a flow cytometer (BD FACSCalibur, Germany) with an excitation wavelength of 485 nm and an emission wavelength of 530 nm.
Real-time q-PCR technique
In this study cytotoxicity was considered as a collection of processes including oxidative stress, inflammation, and apoptosis. As mentioned above, oxidative stress was evaluated by DCFDA ROS assay kit. Then, the expression levels of genes including inducible nitric oxide synthase (iNOS) and tumor necrosis factor-alpha (TNF-α) as indicator genes of inflammation and Bcl-2-associated X (Bax) as a regulator gene of apoptosis were investigated using real time q-PCR. As explained before, the PC12 cells were treated and washed. In the following, to extract total RNA from the cells, Trizol reagent (Invitrogen, USA) was applied according to the manufacturer’s instructions. Excess DNA was removed using treating the total RNA with 1 U RNAase-free DNase (Thermo Fisher Scientific Inc, USA), and then, cDNAs was synthesized from DNase-free RNAs using PrimeScript™ RT reagent Kit (Takara, Japan) according to the kit instruction. The forward (F) and reverse (R) primers for the specific amplification of the genes designed using Allele ID primer design software version 7.5 (Premier Biosoft, USA). The primer pairs for Gapdh (as a house keeping gene) were F: 5ʹ TGCCGCCTGGAGAAACC 3ʹ and R: 5ʹ TGAAGTCGCAGGAGACAACC 3ʹ; for iNOS were F: 5ʹ AAGAGACGCACAGGCAGAG 3ʹ and R: 5ʹ CAGGCACACGCAATGATGG 3ʹ; for TNF-α were F: 5ʹ GTGTTCATCCGTTCTCTAC 3ʹ and R: 5ʹ CCACAATTCCCTTTCTAAGT 3ʹ; and for Bax were F: 5ʹ TTTGCTACAGGGTTTCATC 3ʹ and R: 5ʹ ATGTTGTTGTCCAGTTCAT 3ʹ (Macrogen, South Korea). The expression levels of genes were compared using SYBR green (Ampliqon, Denmark); monitored on a Bio-Rad detection system (USA); and calculated based on 2−ΔΔCT method.
Statistical analysis
Data were sorted in Excel and analyzed using the Graph Pad Prism 6 software. All data were reported as mean ± SEM of results obtained from at least independent triplicate experiments. The one-way or two-ways ANOVA followed by a post-hoc Tukey’s, Dunnett’s or Sidak’s multiple comparison tests were used to estimate the difference as multiple comparison tests. p-value <0.05 was considered as significant.
Results
Physicochemical characterization of DNPs and QNPs
The observation of Qu and QNPs deposition, as soon as dissolved in PBS and three minutes after dissolution, showed that conjugation of Qu to DNPs couldn’t increase the solubility of Qu (Figure S1A and B). The absorption of QNPs towards the magnet indicated that QNPs had magnetic properties (Figure 2C). The appearance of vibration peaks in the range of 3300, 2900, and 1100 cm−1 attributed to O-H, C-H, and C-O-C bonds, respectively in the FTIR results of DNPs (Figure 2A) indicated the polymerization of dextran on the surface of IONPs. Increased O-H, C-H, and C-O-C peaks and the presence of vibration peak in the range of 1640 cm−1, related to C=C group in the Qu structure, in the FTIR results of QNPs (Figure 2A), confirmed conjugation of Qu to DNPs. The higher O-H peak in the FTIR results of QNPs, when compared to the DNPs results, proposed an increase in the solubility of QNPs.20
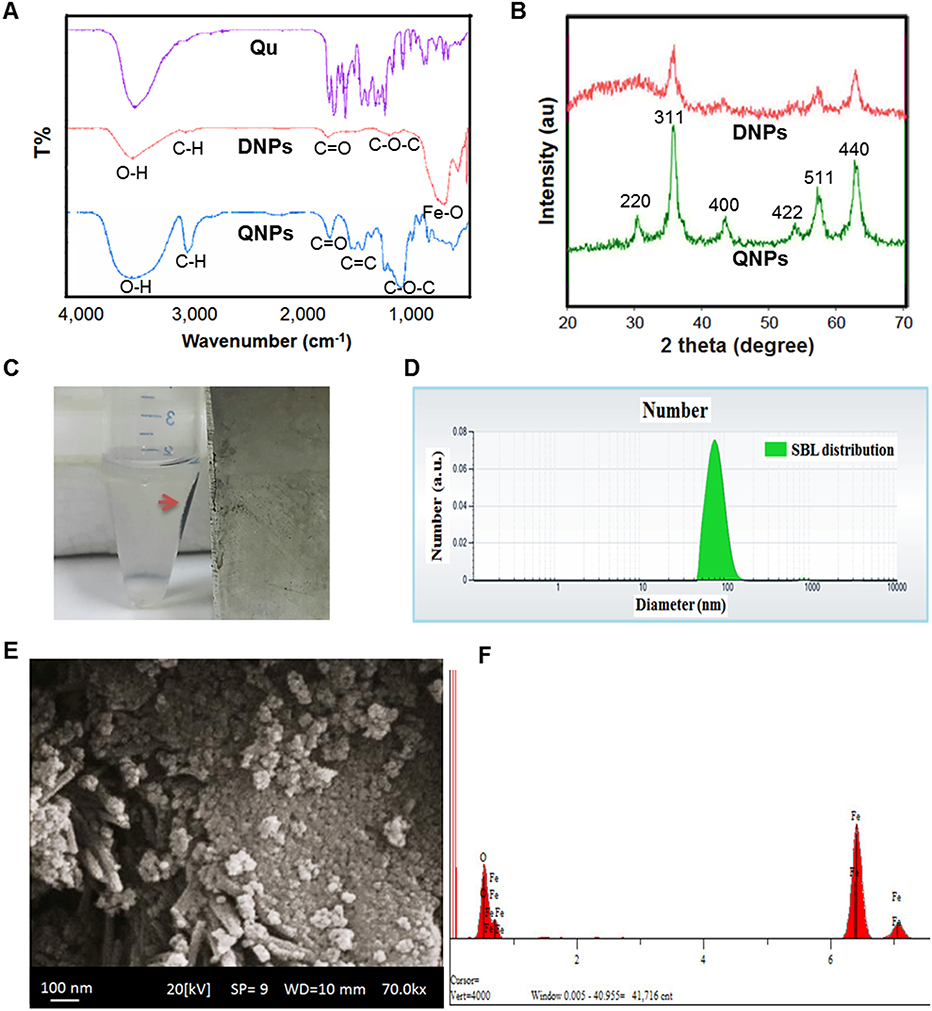 |
Figure 2 Physicochemical characterization of DNPs and QNPs. (A) The results of FTIR confirmed that the polymerization of dextran on and conjugation of Qu to the surface of IONPs was correctly performed. (B) The XRD image showed that DNPs and QNPs were in pure crystal phase and verified Fe3O4 identity. (C) The magnetic properties of QNPs (red arrow shows QNPs aggregate). The DLS results (D) and the SEM pictures (E) of QNPs confirmed the size of the NPs was in the nanometer range. (F) The EDX spectroscopy verified the identity of the IONPs. |
In order to study the crystalline structure of DNPs and QNPs, XRD analysis was done. The observation of the diffraction peaks including 220, 311, 400, 422, 511, and 440° (Figure 2B), related to Fe3O4, approved the crystalline structures of DNPs and QNPs; and absence of extra peaks in the XRD pictures confirmed the purity of DNPs and QNPs.
The size of QNPs was determined by two techniques including DLS and SEM. The DLS results (Figure 2D) estimated that the mean size of QNPs was approximately 72.9 nm. Along with the DLS results, QNPs in the SEM pictures (Figure 2E) was observed smaller than 100 nm. Furthermore, the identity of the IONPs was confirmed by two certain peaks of iron and oxygen in the EDX spectroscopy (Figure 2F).
Given to above contents, DNPs and QNPs prepared in a perfect procedure and coating and conjugation processes were performed correctly. However, the solubility of QNPs was less than Qu, the identity, nano-size, purity, and magnetic properties of QNPs were confirmed.
Drug loading and release study
The drug loading amount was measured around 42% (Equation 2). The drug release assay was performed for ten days and its data (Figure 3) indicated no noticeable difference between neutral (pH: 7.4) and acidic (pH: 4.8) media on the first day. The accumulative release on the third day was 24.7±2.9% in pH: 7.4 and reduction of pH until 4.8 increased the accumulative release value to 58.3±4.3%. Maximum release in neutral pH happened on the fourth day which was 20.4% while maximum release in acidic pH was observed on the second day which was accounted 25.7%, approximately. After a week, the accumulative release in neutral medium (pH: 7.4) reached to 72.6±1.4% and stopped while the accumulative release in acidic medium (pH: 4.8) reached to 84.6±2.9% after five days and then stopped. Overall, reduction of pH caused a significant increase in rate and speed of release.
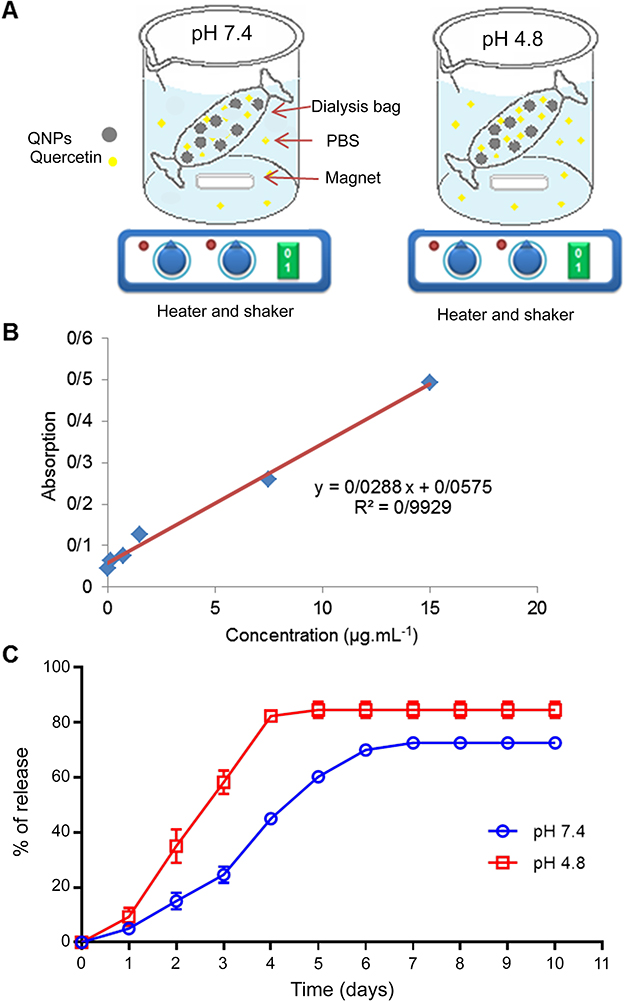 |
Figure 3 Drug release from QNPs. (A) Schematic picture of dialysis; (B) the standard curve of Qu absorption in PBS; (C) drug release graph shows that there isn’t a significant difference between two pH during first 24 h, while the difference was increased at the next days (n=3, mean ± SEM). |
Catalase-like activities of DNPs and QNPs
Magnetite NPs have catalase-like activity and are able to decompose H2O2 to H2O and O2 (Equation 5).21 The observation of gas bulbs in both solutions containing DNPs and QNPs primarily showed they were capable of catalyzing H2O2 to H2O and O2 (Figure 4A). Furthermore, the results of CAT assay indicated that both 100 and 1000 µg.mL−1 doses of DNPs and QNPs had catalase-like activities. As Figure 4B shows there are significant differences between 100 and 1000 µg.mL−1 doses of DNPs (p<0.0001) and QNPs (p<0.001), while the catalase-like activities of DNPs and QNPs have no significant difference. Thus, both DNPs and QNPs had dose-dependent catalase-like activities.
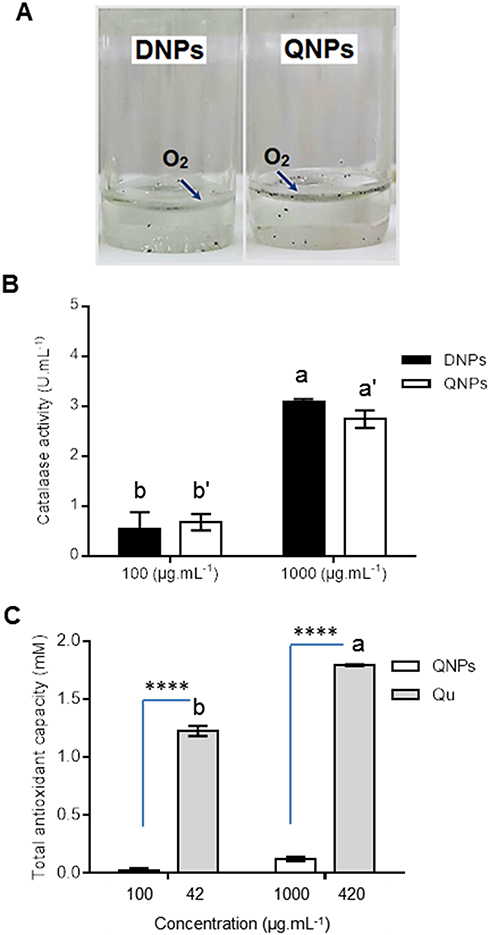 |
Figure 4 Catalase-like activity of DNPs and QNPs. (A) The interaction of DNPs and QNPs with H2O2; the observation of O2 bulbs confirms the catalase-like activity. (B) The graph of catalase-like activities of DNPs and QNPs; both NPs have dose-dependent catalase-like activities. (C) The total antioxidant capacity (TAC) graph of Qu and QNPs; Qu had a dose-dependent capacity and the conjugation of Qu to DNPs led to a noticeable reduction in its antioxidant capacity. n=3, mean ± SEM, the difference of a-b is p<0.0001 and a’-b’ is p<0.001. ****p<0.0001. |
The total antioxidant capacity (TAC) of Qu and QNPs
In order estimate an alteration in the antioxidant effect of Qu after conjugation to DNPs, total antioxidant capacity (TAC) assay was carried out. As shown in Figure 4C, there is a significant difference (p<0.0001) between the TACs of Qu and QNPs at both 42 (100 for QNPs) and 420 (1000 for QNPs) µg.mL−1 concentrations. A notable difference wasn’t observed in TACs values between 42 and 420 µg.mL−1 doses of Qu or QNPs. Therefore, conjugation of Qu to DNPs decreased its antioxidant capacity noticeably.
Free radical scavenging activity of Qu, DNPs, and QNPs
Free radical scavenging activity of Qu, DNPs, and QNPs was estimated using DPPH scavenging activity assay. Different concentrations of Q, DNPs, and QNPs (10, 100, and 1000 µg.mL−1) were compared for the ability of DPPH radical inhibition. The data showed that the radical scavenging activity of Qu was dose-dependent (Figure 5A) and was promoted with increasing concentration, while the exposure period had no effect on its activity. The inhibition capabilities were 70±3%, 78±4%, and 85±3% for 10, 100, and 1000 µg.mL−1 concentrations, respectively, after 12 h.
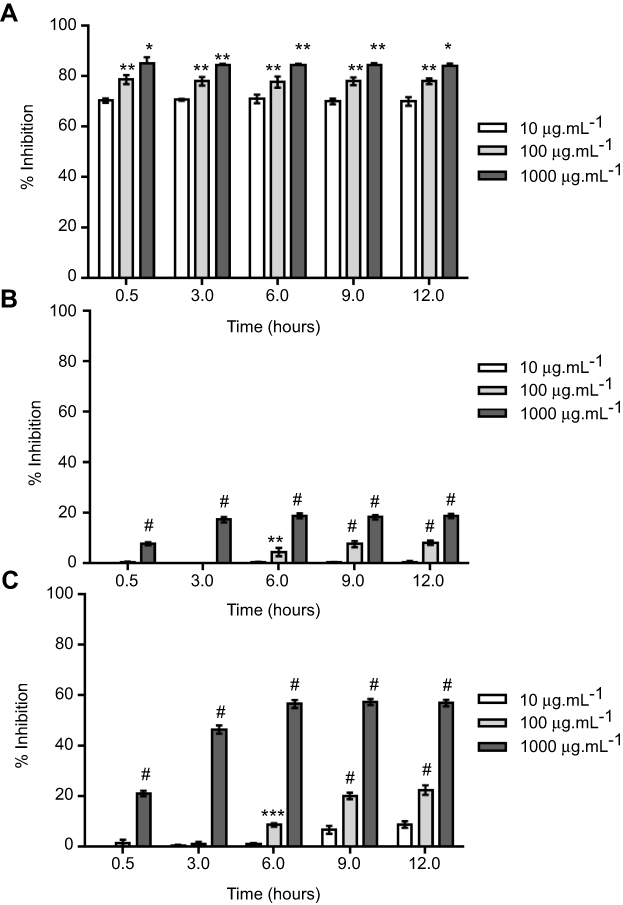 |
Figure 5 DPPH scavenging effects of Qu, DNPs, and QNPs. (A) The graph indicates that Qu had most free radical scavenging activity compared to QNPs and DNPs; and its activity increased along with elevating concentration, while its activity didn’t depend on time. (B) The graph of DNPs activity showed lowest free radical scavenging activities. Except for dose 10 µg.mL−1 which had no effect, DNPs indicated improvement in their activities along with increasing concentration and time. (C) The graph indicated QNPs had dose- and time-dependent free radical scavenging effects (n=3, mean ± SEM). *p<0.05, **p<0.01, ***p<0. 001, and #p<0. 0001. |
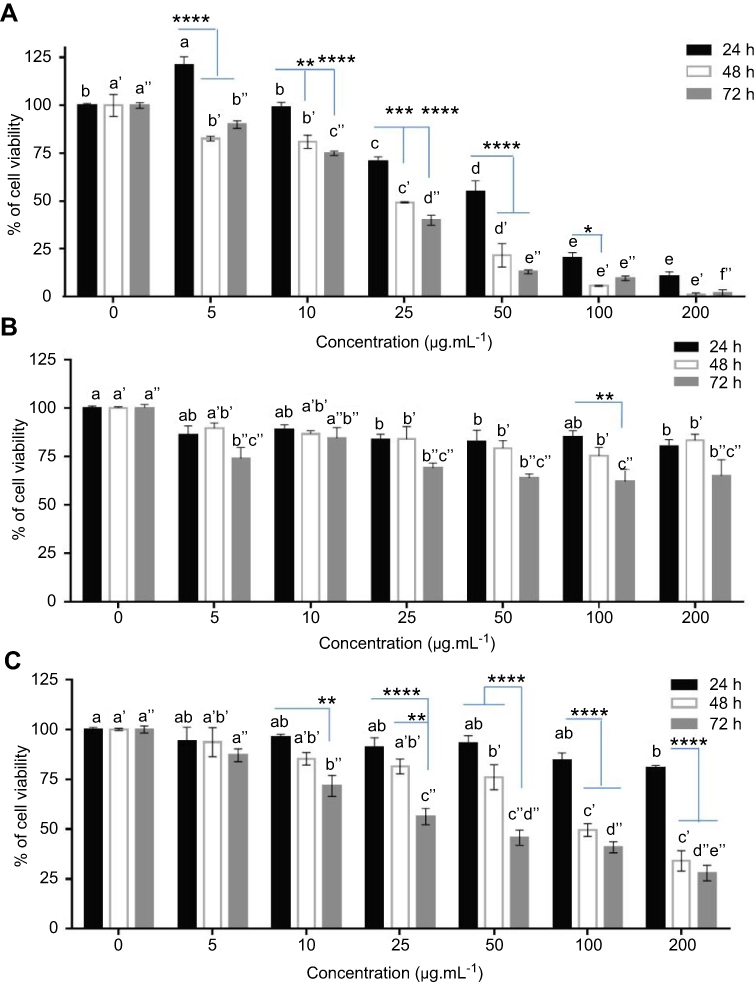 |
Figure 6 The toxicity of Qu, DNPs, and QNPs on PC12 cells. (A) The MTT assay results of Qu; Qu has dose- and time-dependent toxicity on the PC12 cells (a-b, b-c, c-d, d-e, a’-b’, b’-c’, c’-d’, d’-e’, a’’-b’’, b’’-c’’, c’’-d’’, d’’-e’’, and e’’-f’’ have significant differences with *, ****, ***, *, **, ***, *, **, ***, ****, ****, and *, respectively). (B) The MTT assay data of DNPs; DNPs have low toxicity on the cells (a-b, a’-b’, a’’-b’’, and b’’-c’’ have significant differences with *). (C) The MTT assay results of QNPs; QNPs had dose- and time-dependent cytotoxicity (a-b, a’-b’, a’’-b’’, b’’-c’’, c’’-d’’, and d’’-e’’ have significant differences with * and b’-c’ have significant differences with **). *p<0.05, **p<0.01, ***p<0.001, and ****p<0.0001, respectively. n=6, mean ± SEM. |
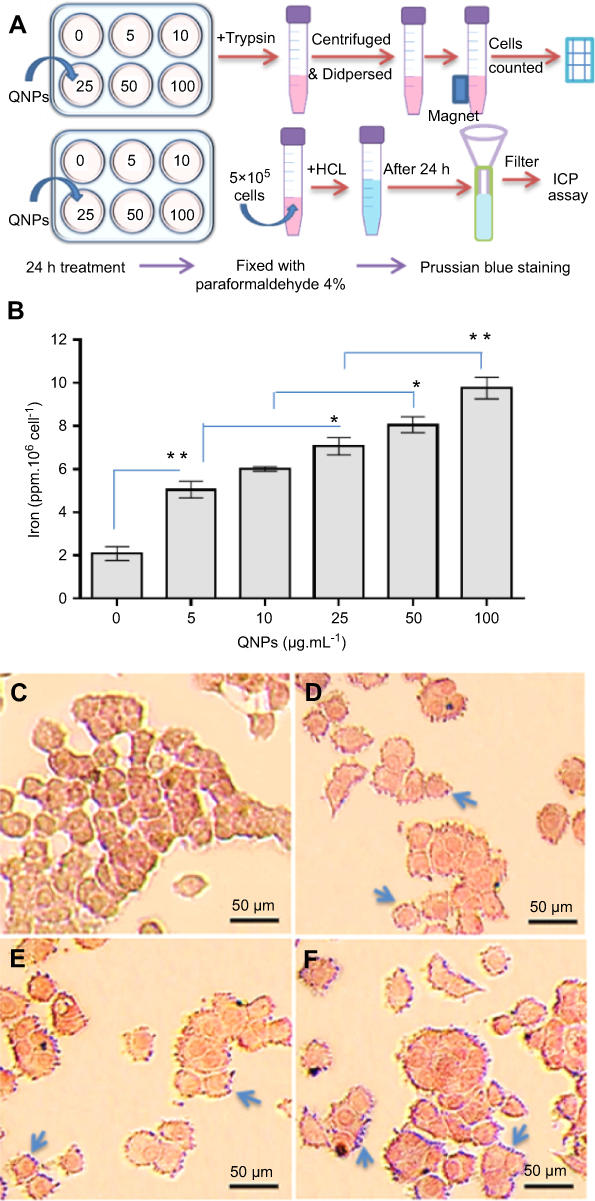 |
Figure 7 QNPs entrance into the PC12 cells. (A) Schematic picture of ICP assay and Prussian blue staining. (B) The drug release graph; the intracellular concentration of iron in PC12 cells was elevated along with increasing the dose of QNPs (n=3, mean ± SEM). *p<0.05 and **p<0.01, respectively). (C-F) Prussian blue staining pictures; PC12 cells were incubated with 0 (C), 25 (D), 50 (E) and 100 µg.mL−1 (F) concentrations of QNPs. The blue colored points observed on the surrounds and enter the cells confirm the entrance of QNPs into the cells. Arrows indicate QNPs. |
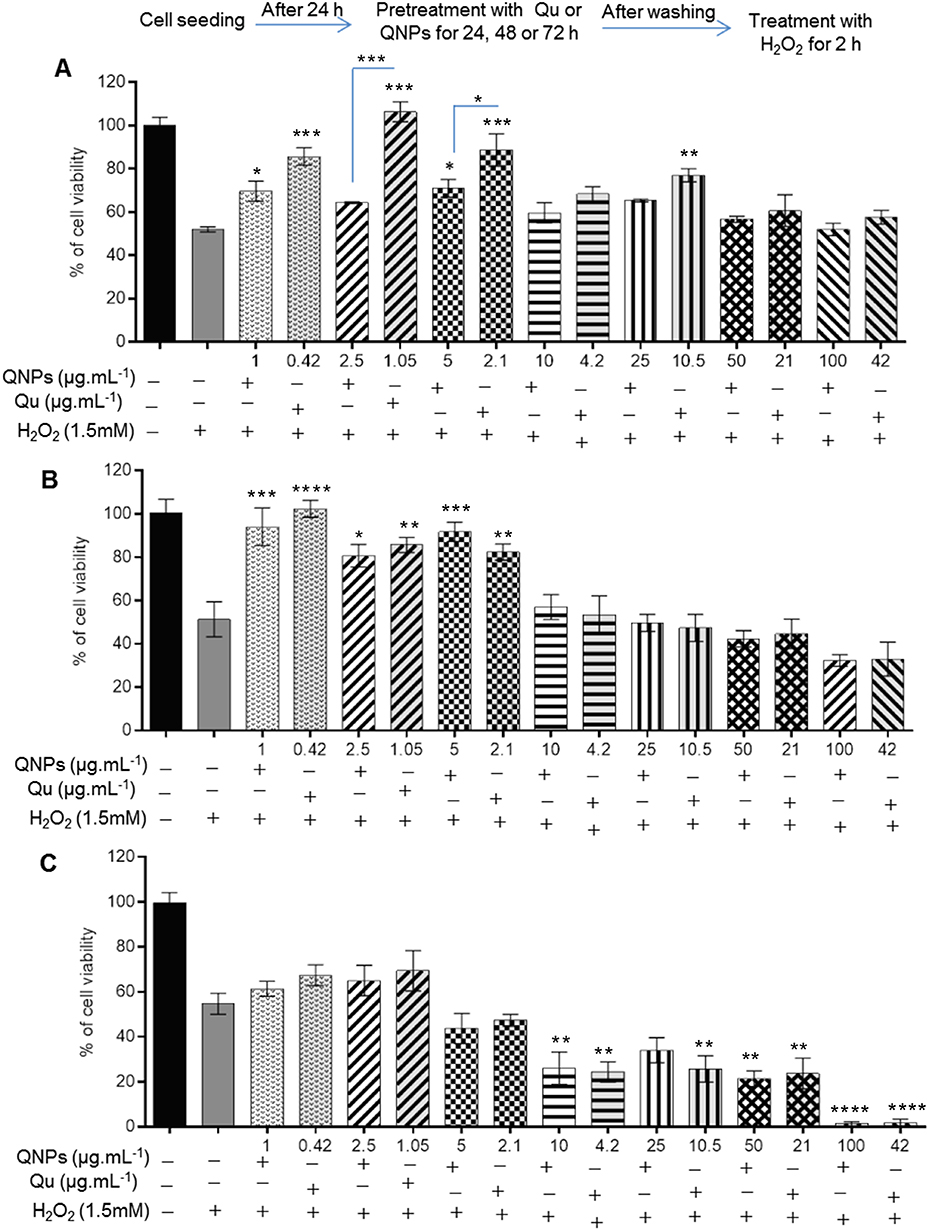 |
Figure 8 The antitoxic effects of Qu and QNPs against H2O2 on the PC12 cell viability. (A) The effect of 24 h pre-incubation with QNPs or Qu before H2O2 treatment on PC12 cells viability; the low doses of QNPs or Qu significantly improved the cell viability. (B) The effect of 48 h pre-incubation with QNPs or Qu; the low doses of QNPs or Qu significantly increased the cell viability. (C) The effect of 72 h pre-incubation with QNPs or Qu; there is no significant protective effect against H2O2 (n=9, mean ± SEM). *p<0.05, **p<0.01, ***p<0.001, and ****p<0.0001. |
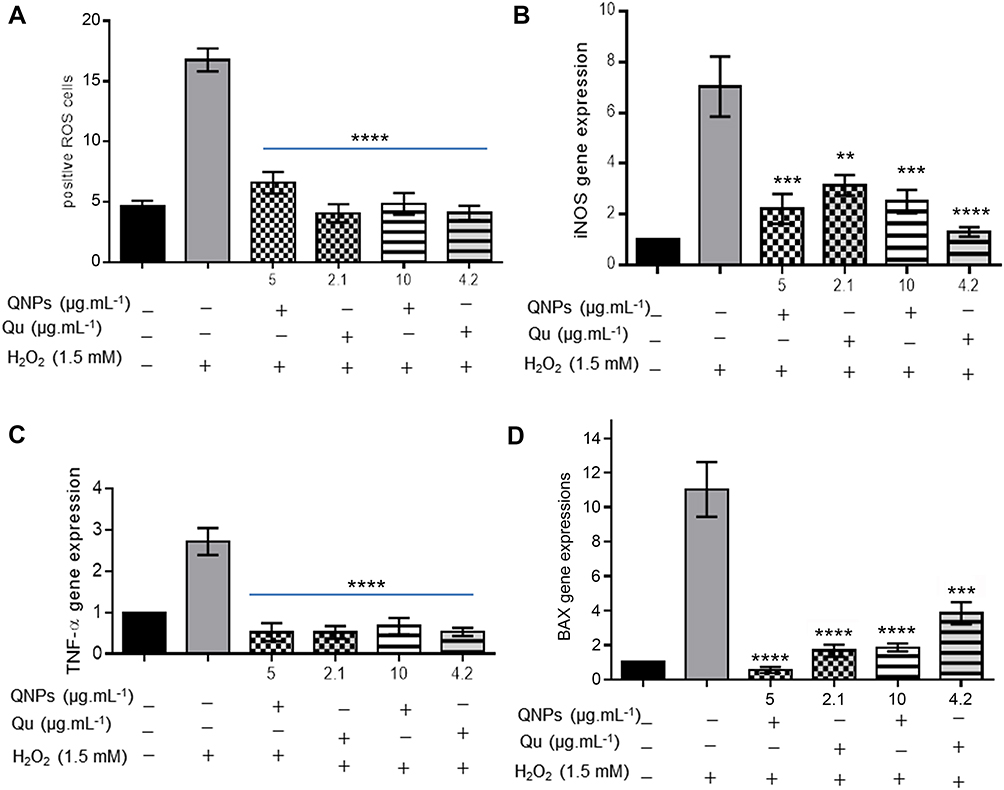 |
Figure 9 The protective effects of Qu and QNPs against H2O2 in PC12 cells. (A) The graph of staining with DCFDA kit; incubation with the low doses of Qu or QNPs reduced ROS level induced by H2O2. (B–D) The relative expression levels graph of iNOS, TNF-α, and Bax genes; pretreatment with the low concentrations of Qu and QNPs decreased the mRNA contents of iNOS, TNF-α, and Bax increased by H2O2 (n=3, mean ± SEM). **p<0.01, ***p<0.001, and ****p<0.0001. |
Free radical scavenging activities of DNPs and QNPs seemed both dose- and time-dependent. The percentages of inhibition at 10, 100, and 1000 µg.mL−1 concentrations of DNPs (Figure 5B) were calculated to be 0.8±0.2%, 7.5±2%, and 18.5±2%, respectively after 12 h, while that of QNPs (Figure 5C) were 8.3±3%, 22±3.2%, and 56±4%, respectively.
Overall, DPPH radical scavenging ability was higher in Qu samples confirming the antioxidant ability of Qu. Radical scavenging activity was lower in DNPs samples, showing coating with dextran has diminished reactivity of IONPs. QNPs had radical scavenging activity more than DNPs demonstrating Qu conjugated to QNPs maintained its antioxidant ability. Given the percentage of drug loading (42%) on QNPs, a higher radical scavenging activity in QNPs was expected. According to equation (9), the Qu radical scavenging activity (for 100 µg.mL−1 concentration) reduced approximately 33% after conjugation.
(9)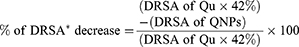
*(DRSA: DPPH radical scavenging activity)
Determination of cell viability
MTT assay was used to determine cell viability after treatment with Qu, DNPs, QNPs, and H2O2. The data of MTT assay for Qu treatment (Figure 6A) indicated cell viability significantly (p<0.01) increased at 5 µg.mL−1 concentration after 24 h. A significant decrease in viability was observed at 5 (p<0.05) and 10 µg.mL−1 (p<0.01) concentrations after 48 h and at 10 µg.mL−1 (p<0.0001) concentration after 72 h. The 25 µg.mL−1≤ concentrations of Qu showed noticeable (p<0.0001) toxicity for 24, 48, and 72 h. Approximately, 50 percentages of PC12 cells were dead at 25 µg.mL−1 concentration of Qu after 48 h.
MTT assay results of DNPs (Figure 6B) revealed that 25 and 50 µg.mL−1 concentrations of these NPs had a significant toxicity (p<0.05) after 24 h treatment. 25 µg.mL−1≤ concentrations of DNPs significantly (p<0.05) decreased cell viability after 48 h. A significant reduction occurred at the 5 (p<0.05) and 25 µg.mL−1 (p<0.01) ≤ concentrations of DNPs after 72 h.
MTT assay data of QNPs (Figure 6C) showed significant toxicity after 24 h exposure at 200 µg.mL−1 concentration (p<0.05). Significant cell toxicity was observed at the 25 µg.mL−1 ≤ concentrations at both 48 and 72 h. QNPs in 100 µg.mL−1 concentration approximately killed 50 percentages of PC12 cells after 48 h.
Two hours treatment with different concentrations of H2O2 demonstrated dose-dependent toxicity of H2O2. One mM ≤ doses of H2O2 significantly (p<0.0001) reduced the viability of PC12 cells; and IC50 was calculated 1.5 mM (Figure S1C). Finally, the MTT assay results confirmed both dose- and time-dependent toxicity of Qu, DNPs, QNPs, and H2O2 on the PC12 cells.
The entrance of QNPs to PC12 cells
QNPs entrance to PC12 cells was studied through two pathways, including ICP-OES assay and Prussian blue staining. The ICP-OES assay reports (Figure 7A and B) indicated that the mean concentrations of iron in 0, 5, 10, 25, 50, and 100 µg.mL−1 samples were 2.09±0.5, 5.05±0.42, 6.01±0.21, 7.06±0.65, 8.06±0.56, and 9.76±0.64 ppm/106 cells, respectively and intracellular iron content at the 100 µg.mL−1 dose reached 4.67 folds, when compared to control (0 µg.mL−1 dose). Thus, according to the ICP results, QNPs could dose-dependently enter the cells. Additionally, the pictures of Prussian blue staining [Figure 7C–F] showed the blue color (QNPs) in the surround and inside the cells indicating QNPs entrance to the cells. Therefore, both pathways demonstrated that QNPs entered the PC12 cells.
Investigating the antitoxic effects of Qu and QNPs against H2O2-induced toxicity on PC12 cells
The alterations of cell viability, ROS level, and total toxicity (a collection of oxidative stress, inflammation and apoptosis) were studied through MTT assay, flow cytometry, and real-time q-PCR, respectively.
MTT cell viability assay
The MTT assay results showed 24 h pretreatment with Qu at concentrations ≤42 µg.mL−1 or QNPs at equivalent concentrations (≤100 µg.mL−1) could improve the viability of PC12 cells when compared to the cells just treated with 1.5 mM H2O2 for 2 h. The increase of cell viability was significant at 10.5 (p<0.01) and ≤2.1 µg.mL−1 (p<0.001) concentrations of Qu and 1 and 5 µg.mL−1 (p<0.05) concentrations of QNPs while it was insignificant at others (Figure 8A). Additionally, 24 h pretreatment with Qu had significantly more antitoxic effects against H2O2 as compared to QNPs. Forty eight hours incubation with concentrations ≤2.1 µg.mL−1 of Qu and its equivalent amounts of QNPs (concentrations ≤5 µg.mL−1) significantly reduced H2O2-induced toxicity on the PC12 cells (Figure 8B). Pretreating with different concentrations of Qu or QNPs for 72 h not only had no significant protective effect (Figure 8C), but the high concentrations of QNPs (≥10 µg.mL−1) and Qu (≥4.2 µg.mL−1) intensified the cytotoxicity of H2O2. As a result, Qu and QNPs protected the PC12 cells from H2O2-induced toxicity dose- and time-dependently. However 24 h exposure to the low doses of Qu had a more protective effect as compared to QNPs, after 48 and 72 h pretreatment, they indicated a similar effect on the cell viability at all doses.
Flow cytometry technique
The results of staining with DCFDA kit (Figure 9A) indicated that a probably mechanism of H2O2 to reduced the viability of PC12 cells was ROS production and pretreating with doses ≤4.2 µg.mL−1 of Qu or its equivalent concentrations (≤10 µg.mL−1) of QNPs for 24 h significantly (p<0.001) reduced ROS levels in PC12 cells treated with H2O2 (1.5 mM for 2 h). An important difference wasn’t detected between Qu and QNPs for 24 h exposure. Thus, Qu and QNPs had equivalent anti-oxidant effects against the oxidative stress induced by H2O2 in the PC12 cells.
Real time q-PCR technique
As Figure 9B–D shows the expression levels of iNOS, TNF-α, and Bax genes were noticeably (p<0.0001) elevated after incubating with H2O2, indicating an increase in the inflammation and apoptosis levels of PC12 cells. Additionally, the real time q-PCR assay results revealed 24 h pretreating with 4.2 µg.mL−1≥ doses of Qu or its equivalent (10 µg.mL−1≥) concentrations of QNPs significantly attenuated the iNOS, TNF-α, and Bax mRNAs levels, and therefore, reduced the inflammation and apoptosis levels induced by H2O2 in the cells. Furthermore, there is no significant difference in the expression levels of iNOS, TNF-α, and Bax genes between Qu and QNPs. Given to the flow cytometry results in a hand and the real-time q-PCR data in the other hand, Qu and QNPs had equivalent antitoxic properties against H2O2-induced oxidative stress, inflammation, apoptosis, and generally cytotoxicity.
Discussion
Qu has attracted a lot of attention due to its antioxidant,3–5 anti-inflammation,6–8 anti-apoptotic,9 and anti-cancer10 properties, meanwhile due to low solubility in water and low bioavailability, cannot be still used as a drug and needs to undergo manipulation.11 The manipulation of materials at the nanoscale can modify their bioactivity and main properties such as solubility, circulation period, and access to the target tissue.22 Furthermore, NPs are especially useful for delivering water-insoluble compounds because their tiny size can arise the absorption and bioavailability of the compounds.23 Bagad and Khan encapsulated Qu into poly (n-butyl cyanoacrylate) NPs, with or without polysorbate-80 coating, for oral administration. They reported that the coated NPs improved the oral bioavailability of Qu and enhanced the Qu concentration in the brains of rats.24 In addition, conjugation of Qu to silica particles ameliorated its solubility and stability in water.25 However conjugation of Qu to DNPs couldn’t improve its solubility in PBS, our previous study showed QNPs noticeably increased the concentration of Qu in the brains of rats.13 Since IONPs have the most tendencies to attach together and form aggregates in 6–8.5 pH,26 the reduction of QNPs solubility in PBS with pH 7.4 is expectable. Therefore, we propose QNPs may elevate the Qu concentration in the brains by preventing its fast clearance from the body, fast metabolism or degradation by enzymes not through ameliorating its aqueous solubility.
Most likely the general neuroprotective mechanism of Qu is confronting to oxidative stress.27 The molecular properties of Qu and its glycosides indicate that they tend to give electrons rather than getting them, indicating their antioxidant activity.28 As reported by Bao and colleagues, two hours incubation with 125 μM ≤ concentrations of Qu decreased the oxidative stress induced by H2O2 in PC12 cells.3 Rats with subarachnoid hemorrhage were treated with different doses (10 and 50 mg/kg) of Qu, through intraperitoneal injection. The results showed Qu in 50 mg/kg dose markedly raised the activity of antioxidant enzymes, including copper/zinc superoxide dismutase (Cu/Zn-SOD) and glutathione peroxidase (GPx).4 Agree with the past results, the data of DPPH scavenging (Figure 5) and TAC (Figure 4C) assays confirmed the high antioxidant capacity of Qu; and also, the flow cytometry results (Figure 9A) showed 2.1 and 4.2 μg.mL−1 concentrations of Qu can confront with the oxidative stress induced by H2O2 in PC12 cells. Therefore, our results verify the strong antioxidant activity of Qu.
Numerous studies indicated Qu loaded NPs, had more anti-radical and antioxidant activities as compared to free Qu.5 Encapsulating of Qu and catechin into poly D, L lactide-co-glycolide NPs promoted its lipid oxidation inhibition and antioxidant capacities.5 Additionally, loading Qu into Eudragit® E (aminoalkyl methacrylate copolymers) - polyvinyl alcohol NPs increased the anti-radical and antioxidant activities of Qu.23 In the current study, the conjugation of Qu with DNPs strictly reduced the DPPH scavenging (Figure 5) and TAC (Figure 4C) of Qu in a non-cellular medium. Researchers reported replacing the hydroxyl groups of Qu with glucose has reduced its antioxidant effects.29 Additionally, binding of Qu to cadmium metal, originally from the 3-OH and carbonyl groups of the C ring, has decreased the antioxidant properties of Qu.30 Therefore, the conjugation of Qu through the functional groups -responsible for its anti-radical and antioxidant properties- with DNPs may have been the cause of the reduction in its activities. Meanwhile, QNPs presented a time-dependent anti-radical activity in one side and TAC assay were performed just for 2 min in the other side, thus it was possible that TAC value was increased along with elevating exposure time. We predict that the anti-radical and antioxidant activities of QNPs would be improved after passing time due to Qu release from QNPs and the activation of Qu functional groups. Although the DPPH scavenging and TAC assays results demonstrated QNPs had less antioxidant activities as compared to free Qu, the flow cytometry data (Figure 9A) revealed equivalent concentrations of QNPs had equivalent effects in reducing ROS level in the PC12 cells incubated with H2O2. Given QNPs have catalase-like activities (Figure 4A and B) and are able to decompose H2O2 to H2O and O2, we propose that the catalase-like activities of QNPs have compensated the detected reduction of their antioxidant activities in the cellular medium.
The MTT assay results showed that the low doses of Qu and QNPs improved the viability of PC12 cells after 24 or 48 h exposure (Figure 8A). But, along with increasing concentration and incubation period, their protective effects were reduced, and finally, altered to adverse effects at high concentrations after 48 and 72 h incubation (Figure 8B and C). In agreement with our data, Echeverry and colleagues indicated that the antitoxic effects of Qu against H2O2 on primary cerebellar granule neurons of rats declined with elevating Qu doses.31 Dajas and colleagues declared Qu at doses ≥100 µM may have a pro-oxidative activity and proposed the presence of an ortho-dihydroxy structure in the B ring and thus, susceptibility to auto-oxidation of Qu or be converting to pro-oxidant intermediates by enzymatic oxidation could be the causes of the Qu pro-oxidative activity.32 Additionally, Barnes et al declared the interaction between H2O2 and Qu can lead to oxidation of Qu and production of toxic radicals from Qu.33 Therefore, Qu and QNPs have dose- and time-dependent antioxidant effects and may be cytotoxic in high concentrations and long periods.
The many studies have indicated the role of Qu in preventing and diminishing inflammation6–8 and apoptosis.9 Bournival and colleagues pretreated microglia N9 with Qu (0.1 μM) for 3 hrs, before treating with 1-methyl-4-phenylpyridinium (MPP), and stated the Qu pretreatment inhibited to increase the inflammatory cytokines levels, including interleukin (IL)-6, IL-1β, and TNF-α.6 Furthermore, Nichols and his colleagues (2015) showed that the treatment with Qu, epicatechin, or both protected mitochondrial function and reduced oxygen and glucose deficiency-induced apoptosis in mouse cortical neurons.9 Along with the previous studies, our real-time q-PCR results revealed that QNPs along with Qu diminished the expression levels of iNOS and TNF-α (inflammatory genes) and Bax (a regulator of apoptosis) in PC12 cells treated with H2O2 (Figure 9B–D). Therefore, addition to antioxidant activities, both Qu and QNPs can attenuate cytotoxicity through their ant-inflammatory and anti-apoptotic activities.
Given the catalase-like activities of QNPs (Figure 4A and B), we expected which they can ameliorate the antitoxic effects of Qu against H2O2 cytotoxicity. But after 24 hrs exposure, Qu and QNPs showed the similar antioxidant, anti-inflammatory, and anti-apoptotic effects in PC12 cells; Additionally, QNPs had less protective effects on the viability of PC12 cells as compared to Qu. Based on drug release data (Figure 3), in first 24 h, the concentration of Qu released from QNPs is low in cell culture medium and the detected protective effects of QNPs was due to a set of activities including anti-radical, antioxidant, and catalase-like activities. Despite above contents, Qu and QNPs indicated the same antitoxic effects against H2O2 on the cell viability after 48 and 72 h incubation. According to drug release graph, after 48 and 72 h incubation, the more content of Qu released from QNPs and could perform its effects on the viability of PC12 cells. Overall, Qu and QNPs have similar antitoxic effects against H2O2-induced toxicity in the PC12 cells and because QNPs have magnetic properties and can be directed to a certain tissue, we propose that they may be useful carriers for Qu to use in neural research and treatment.
Conclusion
In this study, we conjugated Qu to DNPs and then studied the alteration of its solubility, antioxidant, anti-inflammatory, and anti-apoptotic activities after being conjugated. Our results indicated that the solubility of Qu in aqueous medium reduced after being conjugated to DNPs; and conjugation process led to a reduction in the antioxidant activity of Qu in a non-cellular medium. Meanwhile QNPs could compensate this reduction through their catalase-like activities and releasing Qu in the next hours. In a hand, Qu and QNPs have similar antioxidant, anti-inflammatory, and anti-apoptotic effects against H2O2-induced toxicity in PC12 cells and in the other hand QNPs had magnetic properties and can be directed to a certain tissue, therefore, we propose QNPs as suitable carriers for Qu to use in neural research and treatment.
Abbreviation list
CAT, catalase activity; DLS, dynamic light scattering; DNPs, Dextran-coated iron oxide nanoparticles; DRSA, DPPH radical scavenging activity; EDX, dispersive X-ray analysis; FE-SEM, field emission-scanning electron microscope; FTIR, Fourier transform infrared; ICP-OES, inductively coupled plasma-optical emission spectrometer; IL, interleukin; iNOS, inducible nitric oxide synthase; IONPs, iron oxide nanoparticles; MPP, 1-methyl-4-phenylpyridinium; NGF, nerve growth factor; PEG, polyethylene glycol; QNPs, Quercetin-conjugated iron oxide nanoparticles; Qu, Quercetin; TAC, total antioxidant capacity; TNF-α, tumor necrosis factor-alpha; XRD, X-ray diffraction.
Availability of data and materials
All of the data and references that we used in this manuscript are available upon request to the corresponding author.
Acknowledgments
We thank our colleagues for their association and helpful discussions in this study.
Disclosure
The authors report no conflicts of interest in this work.
References
1. Li Y, Yao J, Han C, et al. Quercetin, inflammation and immunity. Nutrients. 2016;8(3):1–14. doi:10.3390/nu8030167
2. Tsao B. Chemistry and biochemistry of dietary polyphenols. Nutrients. 2010;2:1231–1246. doi:10.3390/nu2121231
3. Bao D, Wang J, Pang X, Liu H. Protective effect of quercetin against oxidative stress-induced cytotoxicity in rat pheochromocytoma (PC-12) cells. Molecules. 2017;22(7):1–14. doi:10.3390/molecules22071122
4. Dong YS, Wang JL, Feng DY, et al. Protective effect of quercetin against oxidative stress and brain edema in an experimental rat model of subarachnoid hemorrhage. Int J Med Sci. 2014;11:282–290. doi:10.7150/ijms.7634
5. Pool H, Quintanar D, Figueroa JD, et al. Antioxidant effects of quercetin and catechin encapsulated into PLGA nanoparticles. J Nanomater. 2012;2012:1–12. doi:10.1155/2012/145380
6. Bournival J, Plouffe M, Renaud J, Provencher C, Martinoli MG. Quercetin and sesamin protect dopaminergic cells from MPP+-induced neuroinflammation in a microglial (N9)-neuronal (PC12) coculture system. Oxid Med Cell Longev. 2012;2012:1–11. doi:10.1155/2012/921941
7. Comalada M, Camuesco D, Sierra S, et al. In vivo quercitrin anti-inflammatory effect involves release of quercetin, which inhibits inflammation through down-regulation of the NF-kappaB pathway. Eur J Immunol. 2005;35:584–592. doi:10.1002/eji.200425778
8. Yang T, Luo F, Shen Y, et al. Quercetin attenuates airway inflammation and mucus production induced by cigarette smoke in rats. Int Immunopharmacol. 2012;13:73–81. doi:10.1016/j.intimp.2012.03.006
9. Nichols M, Zhang J, Polster BM, et al. Synergistic neuroprotection by epicatechin and quercetin: activation of convergent mitochondrial signaling pathways. Neuroscience. 2015;308:75–94. doi:10.1016/j.neuroscience.2015.09.012
10. Kumar SR, Priyatharshni S, Babu VN, et al. Quercetin conjugated superparamagnetic magnetite nanoparticles for in-vitro analysis of breast cancer cell lines for chemotherapy applications. J Colloid Interface Sci. 2014;436:234–242. doi:10.1016/j.jcis.2014.08.064
11. Massi A, Bortolini O, Ragno D, et al. Research progress in the modification of quercetin leading to anticancer agents. Molecules. 2017;22(8):1–27. doi:10.3390/molecules22081270
12. Westerink RH, Ewing AG. The PC12 cell as model for neurosecretion. Acta Physiol (Oxf). 2008;192(2):273–285. doi:10.1111/j.1748-1716.2007.01805.x
13. Enteshari Najafabadi R, Kazemipour N, Esmaeili A, Beheshti S, Nazifi S. Using superparamagnetic iron oxide nanoparticles to enhance bioavailability of quercetin in the intact rat brain. BMC Pharmacol Toxicol. 2018;1(19):1–12. doi:10.1186/s40360-018-0249-7
14. Ebrahimpour S, Esmaeili A, Beheshti S. Effect of quercetin-conjugated superparamagnetic iron oxide nanoparticles on diabetes-induced learning and memory impairment in rats. Int J Nanomedicine. 2018;13:6311–6324. doi:10.2147/IJN.S177871
15. Greene LA, Tischler AS. Establishment of a noradrenergic clonal line of rat adrenal pheochromocytoma cells which respond to nerve growth factor. Proc Natl Acad Sci. 1976;73(7):2424–2428. doi:10.1073/pnas.73.7.2424
16. Sasaki M, Nakamura H, Tsuchiya S, et al. Quercetin-induced PC12 cell death accompanied by caspase-mediated DNA fragmentation. Biol Pharm Bull. 2007;30(4):682–686. doi:10.1248/bpb.30.682
17. Wu XJ, Zheng YJ, Cui YY, Zhu L, Lu Y, Chen HZ. Propofol attenuates oxidative stress-induced PC12 cell injury via p38 MAP kinase dependent pathway. Acta Pharmacol Sin. 2007;28(8):1123–1128. doi:10.1111/j.1745-7254.2007.00610.x
18. Ghezzi P, Jaquet V, Marcucci F, Schmidt HHHW. The oxidative stress theory of disease: levels of evidence and epistemological aspects. Br J Pharmacol. 2017;174(12):1784–1796. doi:10.1111/bph.13544
19. Feng Q, Liu Y, Huang J, Chen K, Huang J, Xiao K. Uptake, distribution, clearance, and toxicity of iron oxide nanoparticles with different sizes and coatings. Sci Rep. 2018;8(1):1–13. doi:10.1038/s41598-017-17765-5
20. Heydari H, Zarrabi A, Zarepour A. Design and construction of curcumin – loaded targeted iron oxide nanoparticles for cancer treatment. J Babol Univ Med Sci. 2017;19(6):64–70. doi:10.22088/jbums.19.6.9
21. Tian L, Lou X, Pan ZQ, Zhou H. Synthesis, characterisation and catalase-like activity of silica-coated magnetite nanoparticles modified by a Schiff base Mn complex. Nano Lett. 2013;8(3):159–162. doi:10.1049/mnl.2012.0852
22. Caruthers SD, Wickline SA, Lanza GM. Nanotechnological applications in medicine. Curr Opin Biotechnol. 2007;18(1):26–30. doi:10.1016/j.copbio.2007.01.006
23. Wu TH, Yen FL, Lin LT, Tsai TR, Lin CC, Cham TM. Preparation, physicochemical characterization, and antioxidant effects of quercetin nanoparticles. Int J Pharm. 2008;342:160–168. doi:10.1016/j.ijpharm.2007.06.036
24. Bagad M, Khan ZA. Poly(n-butylcyanoacrylate) nanoparticles for oral delivery of quercetin: preparation, characterization, and pharmacokinetics and biodistribution studies in Wistar rats. Int J Nanomedicine. 2015;10:3921–3935. doi:10.2147/IJN.S80706
25. Vergara-Castañeda H, Hernandez-Martinez AR, Estevez M, Mendoza S, Luna-Barcenas G, Pool H. Quercetin conjugated silica particles as novel biofunctional hybrid materials for biological applications. J Colloid Interface Sci. 2016;15:44–55. doi:10.1016/j.jcis.2015.12.011
26. Baalousha M, Manciulea A, Cumberland S, Kendall K, Lead JR. Aggregation and surface properties of iron oxide nanoparticles: influence of pH and natural organic matter. Environ Toxicol Chem. 2008;27(9):1875–1882. doi:10.1897/07-559.1
27. Costa LG, Garrick JM, Roquè PJ, Pellacani C. Mechanisms of neuroprotection by quercetin: counteracting oxidative stress and more. Oxid Med Cell Longev. 2016;2016:1–10. doi:10.1155/2016/2986796
28. Zheng YZ, Deng G, Liang Q, Chen DF, Guo R, Lai RC. Antioxidant activity of quercetin and its glucosides from propolis: a theoretical study. Sci Rep. 2017;7(1):1–11. doi:10.1038/s41598-016-0028-x
29. Graefe EU, Wittig J, Mueller S, et al. Pharmacokinetics and bioavailability of quercetin glycosides in humans. J Clin Pharmacol. 2001;41:492–499. doi:10.1177/00912700122010366
30. Ravichandran R, Rajendran M, Devapiriam D. Antioxidant study of quercetin and their metal complex and determination of stability constant by spectrophotometry method. Food Chem. 2014;146:472–478. doi:10.1016/j.foodchem.2013.09.080
31. Echeverry C, Arredondo F, Abin-Carriquiry JA, et al. Pretreatment with natural flavones and neuronal cell survival after oxidative stress: a structure-activity relationship study. J Agric Food Chem. 2010;58(4):2111–2115. doi:10.1021/jf902951v
32. Dajas F, Abin-Carriquiry JA, Arredondo F, et al. Quercetin in brain diseases: potential and limits. Neurochem Int. 2015;89:140–148. doi:10.1016/j.neuint.2015.07.002
33. Barnes JS, Schug KA. Oxidative degradation of quercetin with hydrogen peroxide using continuous-flow kinetic electrospray-ion trap-time-of-flight mass spectrometry. J Agric Food Chem. 2014;62(19):4322–4331. doi:10.1021/jf500619x
Supplementary material
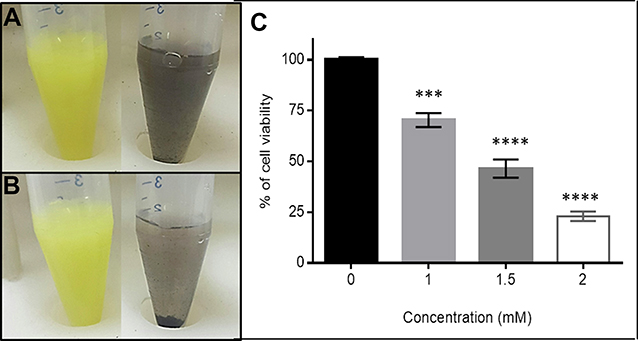 |
Figure S1 The study of the Qu and QNPs solubility and H2O2 cytotoxicity. (A) The comparison of Qu and QNPs solubility as soon as dissolved in water; and (B) three minutes after dissolution; shows that conjugation of Qu to DNPs couldn’t increase its solubility. (C) The MTT assay results of incubating PC12 cells with different concentrations of H2O2 for 2 h indicates the dose-dependently cytotoxicity of H2O2. ***p<0.001; ****p<0.0001; n=3; mean ± SEM. |
 © 2019 The Author(s). This work is published and licensed by Dove Medical Press Limited. The full terms of this license are available at https://www.dovepress.com/terms.php and incorporate the Creative Commons Attribution - Non Commercial (unported, v3.0) License.
By accessing the work you hereby accept the Terms. Non-commercial uses of the work are permitted without any further permission from Dove Medical Press Limited, provided the work is properly attributed. For permission for commercial use of this work, please see paragraphs 4.2 and 5 of our Terms.
© 2019 The Author(s). This work is published and licensed by Dove Medical Press Limited. The full terms of this license are available at https://www.dovepress.com/terms.php and incorporate the Creative Commons Attribution - Non Commercial (unported, v3.0) License.
By accessing the work you hereby accept the Terms. Non-commercial uses of the work are permitted without any further permission from Dove Medical Press Limited, provided the work is properly attributed. For permission for commercial use of this work, please see paragraphs 4.2 and 5 of our Terms.