")
Back to Journals » Journal of Inflammation Research » Volume 14
The ACE2-Ang-(1‑7)-Mas Axis Modulates M1/M2 Macrophage Polarization to Relieve CLP-Induced Inflammation via TLR4-Mediated NF-кb and MAPK Pathways
Authors Pan H, Huang W, Wang Z, Ren F, Luo L, Zhou J, Tian M, Tang L
Received 22 February 2021
Accepted for publication 29 April 2021
Published 20 May 2021 Volume 2021:14 Pages 2045—2060
DOI https://doi.org/10.2147/JIR.S307801
Checked for plagiarism Yes
Review by Single anonymous peer review
Peer reviewer comments 3
Editor who approved publication: Dr Monika Sharma
Hang Pan, Wenhan Huang, Zhongjie Wang, Feifeng Ren, Lei Luo, Jun Zhou, Mengxue Tian, Lin Tang
Department of Rheumatology and Immunology, Second Affiliated Hospital of Chongqing Medical University, Chongqing, People’s Republic of China
Correspondence: Lin Tang
Department of Rheumatology and Immunology, Second Affiliated Hospital of Chongqing Medical University, 76 Linjiang Road, Yuzhong District, Chongqing, People’s Republic of China
Tel +86 13795683033
Fax +86 23 62888265
Email [email protected]
Purpose: Angiotensin 1– 7 [Ang-(1-7)] has been identified as an important anti-inflammatory and anti-fibrotic factor. This study determined how the ACE2-Ang-(1-7)-Mas axis affected M1/M2 macrophage polarization and thus contributed to anti-inflammatory processes in the cecal ligation and puncture (CLP)-induced inflammation model.
Materials and Methods: ELISA, western blotting, and qRT-PCR were used to verify that Ang-(1-7) decreased the expression of pro-inflammatory cytokines and increased anti-inflammatory cytokines. The differentiation of M1/M2 macrophages was assessed by flow cytometry for assessing the cell-surface markers, CD86 and CD206. The related key receptors and pathways were analyzed by Western blotting, qRT-PCR, and immunofluorescence. CLP-induced inflammatory mice models were used for in vivo studies. Hematoxylin and eosin and immunohistochemical and immunofluorescence staining protocols were used to analyze histological changes in the spleen, and the related key pathway proteins were analyzed by western blotting.
Results: Ang-(1-7) decreased the expressions of the TNF-α and IL-6 pro-inflammatory cytokines and increased the expressions of the IL-4 and IL-10 anti-inflammatory cytokines. INOS and TNF-α, which represented M1 macrophage polarization, were decreased by Ang-(1-7). ARG1 and CD163, which represented M2 macrophage polarization, were increased by Ang-(1-7). Both Mas receptor and ACE2 are expressed on macrophages. Furthermore, the ACE2-Ang-(1-7)-MAS axis modulated macrophage polarization by ameliorating TLR4 expression and regulating the NF-кB and MAPK pathways. In addition, splenomegaly and macrophage infiltration were observed in the spleen of the CLP-induced mouse models and macrophages in the spleen suspension of CLP models were shifted to M1 phenotype and were effectively inhibited by Ang-(1-7) via the TLR4-mediated NF-кB and MAPK pathways, which could be partially rescued by A-779.
Conclusion: Ang-(1-7) inhibited inflammatory responses in vivo and in vitro, and repressed macrophage polarization toward the M1 phenotype and promoted it toward the M2 phenotype, which provided new evidence for the anti-inflammation activity of the ACE2-Ang-(1-7)-MAS axis.
Keywords: ACE2-Ang-(1‑7)-MAS axis, macrophage polarization, sepsis, NF-kB pathway, MAPK pathway
Introduction
Inflammation is a pathophysiological process caused by pathogen infection or tissue damage, including a complex series of responses of the immune system to harmful stimuli, such as pathogens, damaged cells, toxic compounds, or irradiation.1,2 Excessive inflammation contributes to a series of inflammatory diseases, such as sepsis.3 Sepsis is an acute inflammatory disease that caused by infections, which can cause multiple organ failure, including lung, liver, and kidney failure, as well as cognitive impairment.4 Macrophages are important innate immune cells that are closely related to the development of sepsis. Macrophages play a critical role in the initiation of inflammation by releasing inflammatory mediators and inflammatory cytokines.5 Macrophages use specific TLR4 receptors to detect pathogen-associated molecular patterns (PAMPs), such as lipopolysaccharide (LPS), which in turn activate effector functions, including inflammatory signaling pathways.6,7
LPS-induced inflammation is the leading cause of multiple organ failure in sepsis. LPS binds to the TLR4 macrophage membrane receptor, to trigger the differentiation of M1 phenotype macrophages involved in pro-inflammatory responses and the production of pro-inflammatory related factors through the activation of intracellular signaling cascades, including the mitogen-activated protein kinase (MAPK),8 nuclear factor kappa-B (NF-κB),6,8 Janus kinase (JAK)-signal transducer and activator of transcription (STAT) pathways.9 Activated macrophages are usually divided into two categories, M1-like and M2-like macrophages.10 The M1 differentiation of macrophages is enhanced in the early stage of sepsis, probably due to stimulation by cytokines, including interferon-γ (IFN-γ) and granulocyte macrophage colony stimulating factor (GM-CSF), and exogenous bacterial toxins, such as LPS.7 M1 macrophages are “classically activated” macrophages overexpressed cell-surface marker CD86, CD80 and CD16/32 that are characterized by an increased ability to secrete pro-inflammatory cytokines, including interleukin (IL)-1β, tumor necrosis factor (TNF)-α, high mobility group 1 (HMGB1) protein, IL-12, and IL-18, which recruits neutrophils, monocytes and mast cells from the circulation to amplify the inflammatory response in the early stages of sepsis and mediates tissue destruction.11 M2 macrophages are “alternative activated” macrophages stimulated by IL-4 and IL-13 and overexpressed cell-surface marker ARG1, CD163 and CD206 that are characterized by an increased ability to secrete anti-inflammatory cytokines, including IL-10, transforming growth factor β (TGF-β), C-C motif chemokine ligand 17 (CCL17) and CCL22 which repairs damaged tissues in the organ failure caused by sepsis and produces anti-inflammatory responses.12
The renin-angiotensin-aldosterone system (RAAS) is best recognized for its essential role in the physiological regulation of blood pressure homeostasis, vascular injury, and repair responses.13 The core component of classic RAAS is Ang II, which is mediated by the type‑1 Ang II (AT1) receptor to activate many pro-inflammatory and fibrotic effects in vascular, heart, kidney, and other tissues.14 A non-classical RAAS component is an enzyme called angiotensin‑converting enzyme 2 (ACE2), which has high Ang II affinity, and can transform this peptide to Ang-(1-7), and which binds to a G‑protein‑coupled receptor called Mas receptor. This ACE2-Ang-(1-7)-Mas axis has been reported to function as a counterbalance to the classic ACE-Ang II-AT1 axis, with opposite effects than those mediated by the classic axis.15 Our previous research has shown that Ang-(1‑7), via its Mas receptor, has anti‑inflammatory functions.16,17
However, the specific role of Ang-(1‑7) in anti-inflammatory functions is unclear, and the transforming macrophage phenotype and modulating macrophage function have been seldom investigated. Therefore, the current study investigated the inhibitory effect of Ang-(1‑7) via its Mas receptor to regulate LPS-induced M1/M2 macrophage polarization and cecal ligation and puncture (CLP)-induced sepsis, together with its associated signaling pathways, to provide further insight into the mechanism involving the anti-inflammatory activity of the ACE2/Ang-(1-7)/Mas axis.
Materials and Methods
RAW264.7 Cultures
Murine RAW264.7 macrophages were obtained from the American Type Culture Collection (Manassas, VA, USA) and cultured in high glucose Dulbecco’s Modified Eagle Medium (Invitrogen, Carlsbad, CA, USA) supplemented with 10% fetal bovine serum (Invitrogen) and 100 μg/mL of penicillin and streptomycin (HyClone, Logan, UT, USA) in a humidified incubator at 37°C with 5% CO2.
Experimental Groups
RAW264.7 was divided into six treatment groups: control group, LPS (Sigma-Aldrich, St. Louis, MO, USA) group, LPS + Ang-(1–7) (APExBIO, Houston, TX, USA) group, LPS + Ang-(1–7) + A-779 (APExBIO) group, Ang-(1–7) group, and A-779 group. A-779 is the Mas receptor antagonist and was preincubated for 30 minutes before treatment with LPS and Ang-(1–7).
Experimental Mouse Models
The research protocol was approved by the Institutional Animal Care and Use Committee of Chongqing Medical University. Male KM mice (8–10-weeks-old) were purchased from the Chongqing Medical University experimental Animal Center. All animal experiments were performed according to institutional guidelines.
The CLP-Induced Sepsis Model
CLP was used to induce murine sepsis. The mice were randomly separated into five groups (n = 6 per group): (1) control group; (2) sham-operation + normal saline; (3) sham-operation + Ang-(1-7) [dimethyl sulfoxide (DMSO), 2 mg/kg]; (4) CLP + normal saline; and (5) CLP + Ang-(1-7) (DMSO, 2 mg/kg). Briefly, the mice were anesthetized using sodium pentobarbital. Then, a midline laparotomy was performed, and the cecum was exteriorized and ligated distal to the ileocecal valve. The cecum was perforated using a 20-gauge needle and squeezed gently to extrude a small amount of fecal contents from the punctured cecum. The cecum was then returned to the peritoneal cavity, and the incision was closed using sutures. In the sham group, the cecum was exteriorized without ligation or puncture. In the sham-operation + Ang-(1-7) and CLP + Ang-(1-7) groups, the animals were intraperitoneally injected with Ang-(1-7) 0.5 hours before the CLP procedure and then injected once daily for 3 days. In the sham-operation + saline and CLP + saline groups, the animals were intraperitoneally injected with saline at the same time point. All animals were sacrificed on day 4 after the CLP procedure. The spleen tissue and blood were collected for further analysis.
Enzyme-Linked Immunosorbent Assay (ELISA)
The IL-6, TNF-α, IL-4 and IL-10 pro-inflammatory cytokines were measured using ELISAs (4A Biotech, Beijing, China) following the manufacturer’s protocol. RAW264.7 cell supernatants were obtained from cell-conditioned medium. Blood samples were collected through a cardiac puncture and centrifuged at 1,500 × g for 5 minutes to separate the serum.
Cell Viability Assay
Cellular viability was analyzed using Cell Counting Kit-8 (Dojindo, Kumamoto, Japan). RAW264.7 were plated in 96-well plates at a density of 5,000 cells/well and incubated overnight for adherence. Following the optimal treatment concentration, 10 μL of CCK-8 was added to each well. The absorbance at 450 nm was then measured using a microplate reader. Cell viability was calculated using the following formula: cell viability (%) = (experimental group absorbance-blank group absorbance)/(control group absorbance-blank group absorbance)× 100%.
Flow Cytometry
To determine the phenotype of macrophage differentiation, macrophages and cell suspensions containing 1×10⁶ splenocytes were analyzed using flow cytometry. Firstly, we should prepare the single cell suspension of splenocytes. The spleen tissue was transferred to a 35 mm sterile petri dish which added in PBS containing 1 mM EDTA. The piston from the 3 cc sterile syringe grinded spleen tissue for 5 times to destroy the spleen to release splenocytes and then Place a 40μm cell strainer on a 50mL sterile conical tube and rinse the strainer with 2mL PBS. The supernatant with tissue from the petri dish was transferred through the 40μm cell strainer to separate the cells. The liquid after the filter was centrifuged at 300 × g for 10 minutes to collect the cells. The supernatant was discarded and then add 6mL red blood cell lysate in tubes and place it on ice for 5 minutes to lyse red blood cells. The liquid was centrifuged at 1200rpm for 10min to collect white cell. Carefully discard the supernatant and gently tap the tube to resuspend the cells. The single cell suspension of splenocytes was used in the following flow cytometry experiments. Cells were suspended in phosphate-buffered saline (PBS) containing 2mM EDTA. Fcγ receptors were saturated with Fcγ blocking reagent (Dakewe, Beijing, China). Then, macrophages were separately stained with monoclonal antibodies specific for BV421-F4/80 and PE-CD86 (Dakewe, Beijing, China) and monoclonal antibodies specific for APC-CD163 and PE-CD86. The single cell suspension of splenocytes were stained with BV421-F4/80, PE-CD86 and APC-CD163 together. Both cells cultures were then analyzed using a FACSVerse flow cytometer (BD Biosciences, San Jose, CA, USA).
Immunofluorescent Staining for NF-kB and Mas Receptor
Immunofluorescent staining was performed on RAW264.7. The cells (106/mL) were seeded on coverslips and cultured in 6-well plates. After incubation and removal of medium, the slides were fixed with 4% paraformaldehyde for 15 minutes. The cells were then permeabilized for 10 minutes in 0.1% Triton X-100 (Solarbio, Beijing, China). Subsequently, nonspecific binding was abolished by incubation for 1 hour in 0.1% BSA (Solarbio). After washing with PBST (PBS containing 0.1% Tween-20), the cells were incubated with P65 (diluted 1:100, Abcam, Cambridge, UK) or Mas (diluted 1:200, proteintech, Wuhan, China) overnight at 4°C. Afterwards, the cells were treated with secondary Dylight 594-conjugated antibodies (diluted 1:200, Abbkine, Wuhan, China) for 1 hour at RT. Next, the cells were incubated for 15 minutes at RT with DAPI (4ʹ6-diamidino-2-phenylindole, Solarbio) to visualize the nucleus. Finally, antifade mounting medium was dripped on the glass slides. Nuclear translocation was observed after P65 staining with DAPI, by using a fluorescence microscope.
Protein Extraction and Western Blotting
For Western blot analysis, homogenized spleen tissues and treated RAW264.7 were lysed in RIPA lysis buffer with phenylmethylsulfonyl fluoride (Beyotime, Shanghai, China) for 2 hours at 4°C, followed by centrifugation at 12,000 rpm for 10 minutes at 4°C. The BCA protein assay kit (Solarbio) was used to determine protein concentrations of the supernatants. Equal protein samples were resolved on an 8–12% gradient SDS-PAGE and transferred onto polyvinylidene difluoride membranes, which were blocked with 5% BSA (Solarbio) at RT for 1 hour and then incubated with the corresponding primary antibodies overnight at 4°C. After the membranes were washed with TBST (TBS containing 0.1% Tween-20), they were incubated with a secondary antibody (Abbkine, Wuhan, China) for 1 hour at 37°C. The immunoreactive protein bands were detected with ECL Prime Western Blotting Detection Reagent (Amersham, Little Chalfont, UK) and visualized by enhanced chemiluminescence on a ChemiDoc MP system (Bio-Rad, Hercules, CA, USA).
RNA Extraction and Quantitative Reverse Transcription PCR
Total RNA was isolated from RAW264.7 using an RNA Extraction Kit and quantified by a Nanodrop 2000 (Thermo Fisher Scientific, Waltham, MA, USA). Approximately 500 ng of RNA was converted to cDNA using an RT Reagent Kit (Takara, Tokyo, Japan). Subsequently, qRT-PCR reactions were run on a CFX96 Real-time System (Bio-Rad). Cycle threshold values (Ct) of the genes were normalized to expression of the GAPDH housekeeping gene. The relative expression levels of genes were calculated using the formula delta/delta Ct method. The primer sequences used in this study are shown in Table 1.
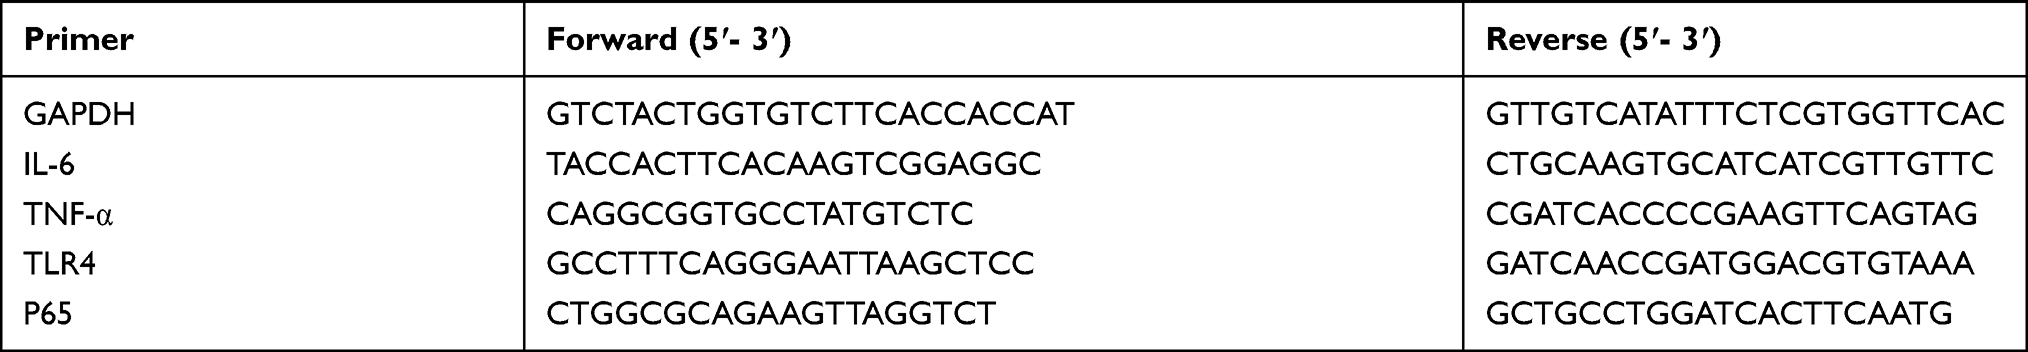 |
Table 1 Sequences of Primers Used for the RT-PCR Assay |
Histological Evaluation and Pathological Scoring Criteria
The spleen tissue samples were fixed with 4% paraformaldehyde for 48 hours, dehydrated in graded alcohol, embedded in paraffin wax, then sectioned (5 μm each) and stained with hematoxylin-eosin (H&E, Solarbio) for histomorphometric assessment. The histological sections were visualized using light microscopy and were photographed. The pathology of spleen was judged from the cell density of lymphatic sheaths around arteries, lymph node hyperplasia (lymphoid follicles), marginal zone hyperplasia, red marrow hyperemia and the total number of germinal centers. According to the severity of the lesion, 0 to 3 (0 = Normal) grade pathology score. ① The score of cell density of lymphatic sheath around artery: 0 = normal; 1 = cell density slightly increased; 2 = cell density moderately increased with cell’s crowding; 3 = cell density severely increased with cell’s crowding and superimposition. ② The score of lymph node hyperplasia: 0 = no hyperplasia with no or few germinal centers; 1 = mild hyperplasia with visible germinal centers; 2 = moderate hyperplasia with obvious germinal centers; 3 = excessive hyperplasia with more germinal centers. ③ The score of marginal zone hyperplasia: 0 = no hyperplasia mixed with a small amount of red blood cells in marginal zone; 1 = mild hyperplasia with mildly widened marginal zone; 2 = moderate hyperplasia with significantly widened marginal zone and reduction of red blood cell; 3 = severe hyperplasia with the blurred boundary around white marrow. ④ The score of red pulp hyperemia: 0 = no hyperemia; 1 = slight hyperemia; 2 = moderate hyperemia; the intrinsic cellular components are reduced in the red pulp and there are some lymphatic tissue squeezed by blood near trabecula or capsule; 3 = severe hyperemia; The spleen is filled with a large amount of blood. The intrinsic cellular components are greatly reduced in the red pulp and there are significantly visible lymphatic tissues squeezed by blood near trabecula or capsule.
Immunofluorescence and Immunohistochemistry Tissue Staining
Mice were sacrificed and immediately transcardially perfused with PBS, followed by 20 minutes of perfusion with 4% paraformaldehyde. The spleen was removed and post-fixed for 1.5 hours in 4% paraformaldehyde. After antigen retrieval, sections were incubated in 0.1% Sudan black B (diluted by 70% ethanol) for 25 minutes and were then rinsed with water for 10 minutes to block the autofluorescence of spleen. Sections were permeabilized with 0.1% Triton X-100 and blocked with 10% BSA for 1 hour. The slides were incubated with F4/80 (Cell Signaling Technology, Danvers, MA, USA) or P65 antibody overnight at 4°C. Subsequently, sections were incubated for 2 hours with secondary fluorescein isothiocyanate-conjugated antibody or horseradish peroxidase-conjugated antibody. Next, the slides were incubated for 10 minutes with DAPI for immunofluorescence or stained for 3 minutes with hematoxylin followed by diaminobenzidine chromogenic staining for immunohistochemistry. Images were captured using a digital camera, by a technician, who was blinded to the treatment groups and the purpose of the study. The images were saved as 16 bit (grey scale) TIFF files containing the necessary variables for analysis with ImageJ software (National Institutes of Health, Bethesda, MD, USA).
Statistical Analysis
Data are presented as the mean ± SEM. One-way analysis of variance, followed by Student’s t-test, was used to compare the data among multiple groups. Statistical analyses were performed and histograms were generated using Prism software version 7.0 (GraphPad, San Diego, CA, USA). P < 0.05 was considered a significant difference.
Results
Ang-(1-7) Reduced the Inflammatory Response of RAW264.7 Induced by LPS in a Time- and Dose-Dependent Manner
RAW264.7 were treated with LPS at different concentrations (0, 100, and 1,000 ng/mL) for 6, 12, and 24 hours. The results showed that LPS at 1,000 ng/mL for 24 hours increased the highest levels of IL-6 and TNF-α (p<0.05 or p<0.01, Figure 1A). Next, LPS-induced macrophages were treated with different concentrations of Ang-(1-7) (0, 10−6, 10−7, 10−8 mol/L). The results showed that Ang-(1-7) at 10−6 mol/L significantly reduced the secretion of IL-6 and TNF-α and increased the production of IL-4 and IL-10 (p<0.05 or p<0.01, Figure 1B and C). Then, the inhibitory effect was blocked when cells were preincubated with different concentrations of A-779 (0, 10−5, 10−6, 10−7 mol/L) for 1 hour. ELISA determination of IL-6, TNF-α, IL-4 and IL-10 showed that A-779 at 10–5mol/L partially inhibited the anti-inflammatory activity of Ang-(1-7) (p<0.05 or p<0.01, Figure 1D–E). In subsequent experiments, the optimal treatment concentration and time were determined to be treated with 1 μg/mL for LPS, 10–6 mol/L for Ang-(1-7) lasted 24 hours, and preincubated with A-779 at 10–5 mol/L for 1 hour. CCK-8 assay data showed that compared with the control group, LPS, Ang-(1-7), and/or A-779 had no significant cytotoxic effect on RAW264.7 (Figure 1F). The protein expression of ACE2 was low level in macrophages. But Ang-(1-7) could inhibit its slightly higher level under inflammatory stimulation (p<0.05 or p<0.01, Figure 1G and I). The protein expression of Mas receptor was significantly high level on macrophages. But, there was no significant difference in each group (ns = non-significant, Figure 1H, J and K).
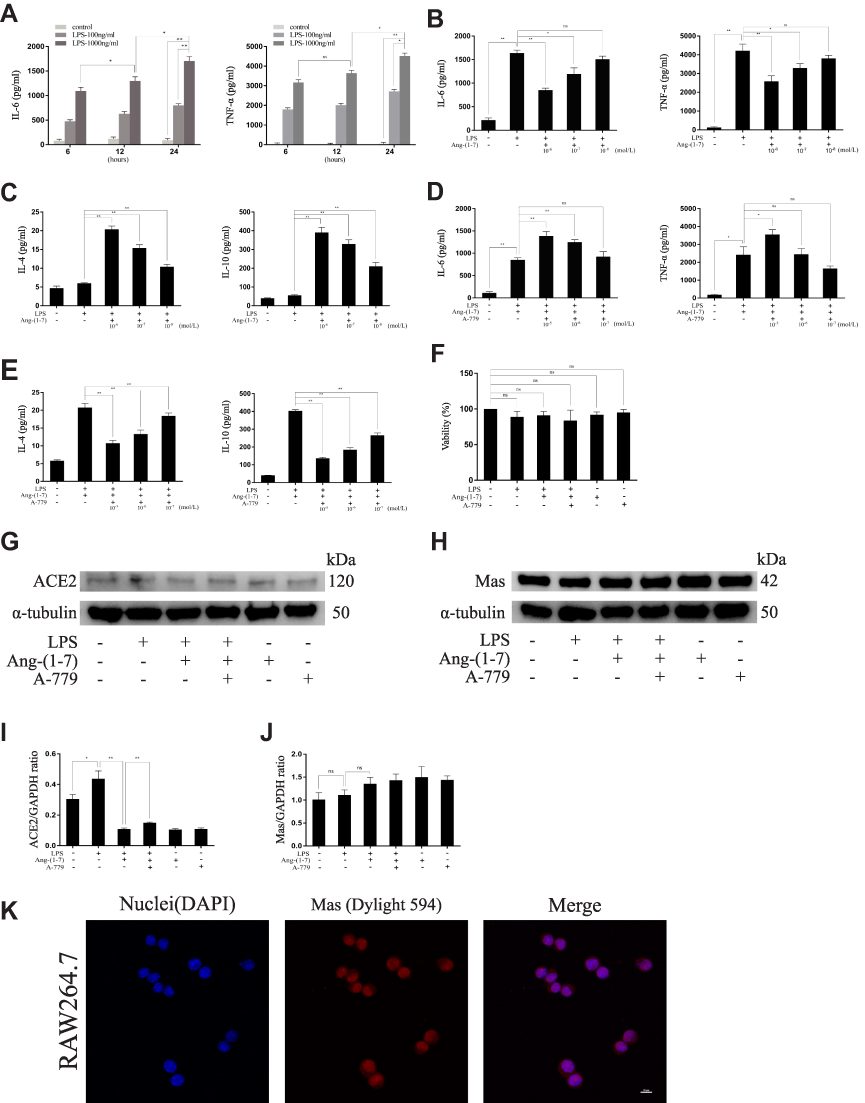 |
Figure 1 The effect on pro-inflammatory and anti- inflammatory cytokines at different concentrations for different times. (A) The secreted protein levels of the TNF-α and IL-6 pro-inflammatory cytokines on RAW264.7 cells untreated or treated with lipopolysaccharide (LPS) (100 ng/mL, 1,000 ng/mL) for different times (6, 12, and 24 hours). (B and C) The levels of TNF-α and IL-6 pro-inflammatory cytokines and IL-4 and IL-10 anti-inflammatory cytokines of RAW264.7 cells treated with LPS (1000 ng/mL) and Ang-(1-7) (10−6, 10−7, or 10−8 mol/L) for 24 hours. (D and E) The levels of TNF-α and IL-6 pro-inflammatory cytokines and IL-4 and IL-10 anti-inflammatory cytokines of RAW264.7 cells treated with LPS (1,000 ng/mL), Ang-(1-7) (10−6 mol/L), and A-779 (10−5, 10−6, or 10−7 mol/L) for 24 hours. (F) The cell viability of RAW264.7 cells was measured using the CCK-8 assay after treatment. (G and H) Representative Western immunoblots for ACE2 and Mas receptor. (I and J) Bar graph showing the corresponding quantitative data. (K) Representative fluorescence images of the Mas receptor in RAW 264.7 cells (scale bar: 10μm). Error bars indicate the mean ± SD for three separate experiments, n = 3 for each group, *p < 0.05; **p < 0.01. Abbreviation: ns, non-significant. |
The ACE2/Ang-(1-7)/Mas Axis Ameliorated the LPS-Induced Inflammatory Response of RAW264.7 via Inhibiting Pro-Inflammatory Factors and M1 Macrophage Polarization and Promoting Anti-Inflammatory Factors and M2 Macrophage Polarization
Ang-(1-7) significantly reduced RNA and secreted protein levels of TNF-α and IL-6 and increased IL-4 and IL-10 in RAW264.7, which had previously been increased by LPS (p<0.05 or p<0.01, Figure 2A–F). The results showed that Ang-(1-7) inhibited the protein levels of INOS and TNF-α, the M1 phenotype marker, and promoted the protein expressions of ARG1 and CD163, the M2 phenotype marker (p<0.05 or p<0.01, Figure 2G–K). Flow cytometry indicated that Ang-(1-7) could significantly decrease the ratio of CD86/F4/80 and slightly increase the expression of CD163 (Figure 2L–M). The results implied that Ang-(1-7) inhibited LPS-induced M1 polarization and promoted M2 phenotype alteration in macrophages which could be partly rescued by A-779.
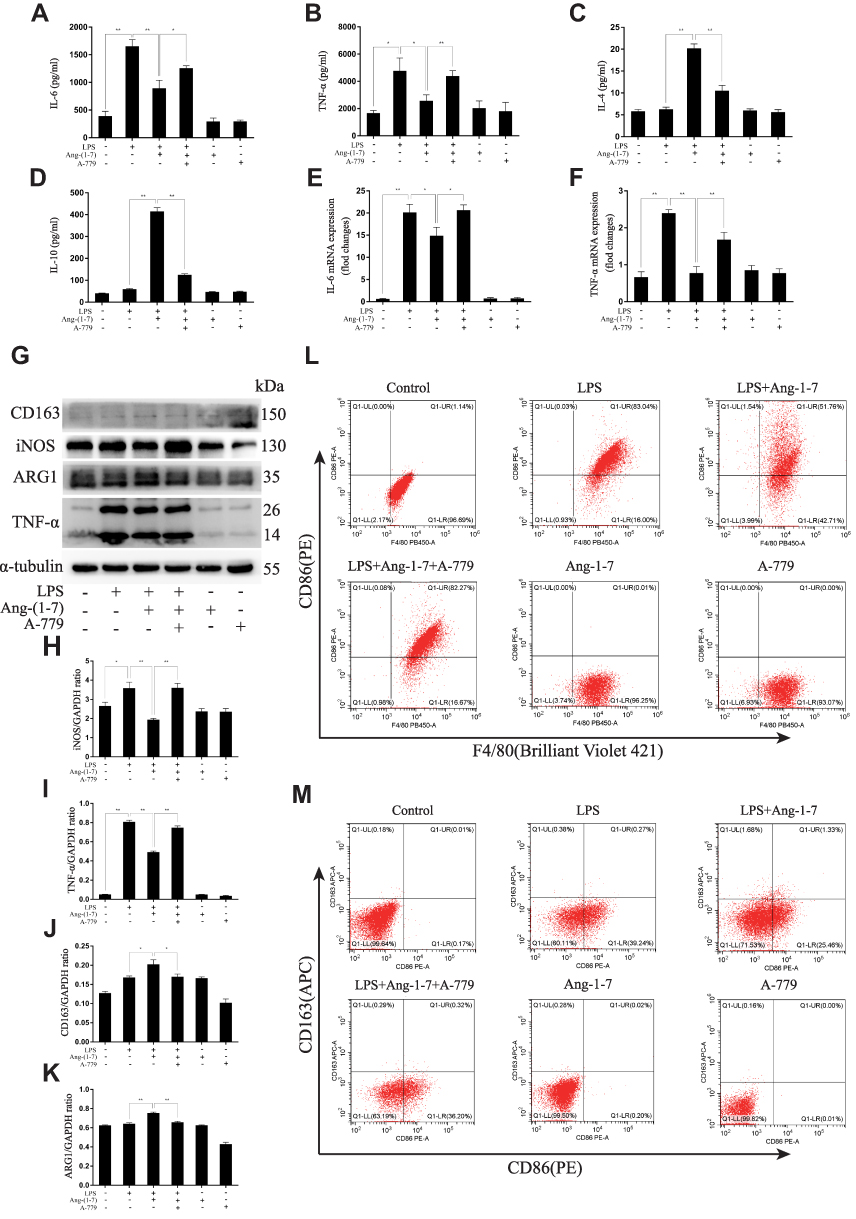 |
Figure 2 Ang-(1–7) reduced pro-inflammatory cytokines and increased anti-inflammatory cytokines and significantly decreased M1 polarization and slightly increased M2 polarization in lipopolysaccharide (LPS)-stimulated RAW264.7. (A and B) The expression levels of TNF-α and IL-6 were determined by ELISAs for each group. (C and D) The expression levels of IL-4 and IL-10 were determined by ELISAs for each group. (E and F) The expression levels of TNF-α and IL-6 were determined by qRT-PCR for each group. (G) Representative Western immunoblots for iNOS, TNF-α, ARG1 and CD163. (H–K) Bar graph showing the corresponding quantitative data. (L) The ratio of M1 macrophage phenotype-related surface markers, CD86/F4/80, were determined by flow cytometry for each group. (M) The ratio of CD86/CD163 were determined by flow cytometry for each group. Error bars indicated the mean ± SD for three separate experiments, n = 3 for each group, *p < 0.05; **p < 0.01. |
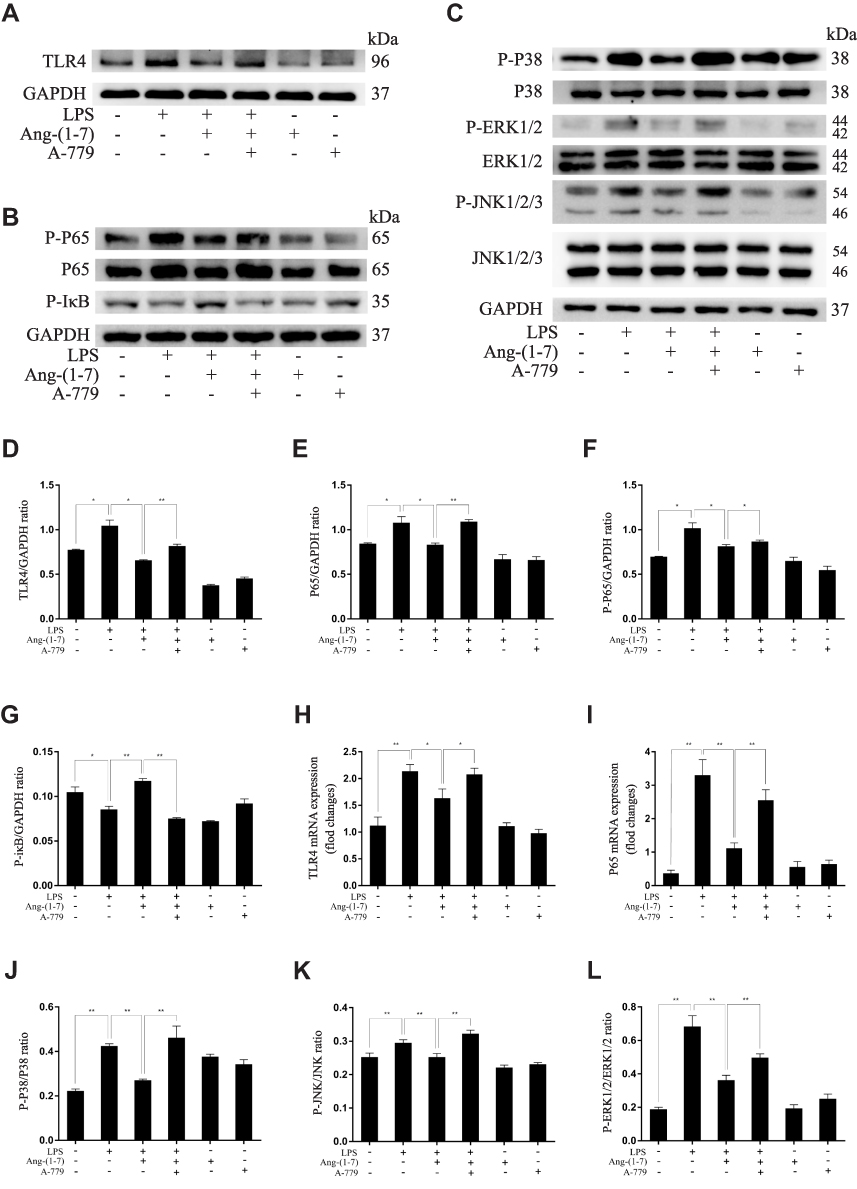 |
Figure 3 Continue. |
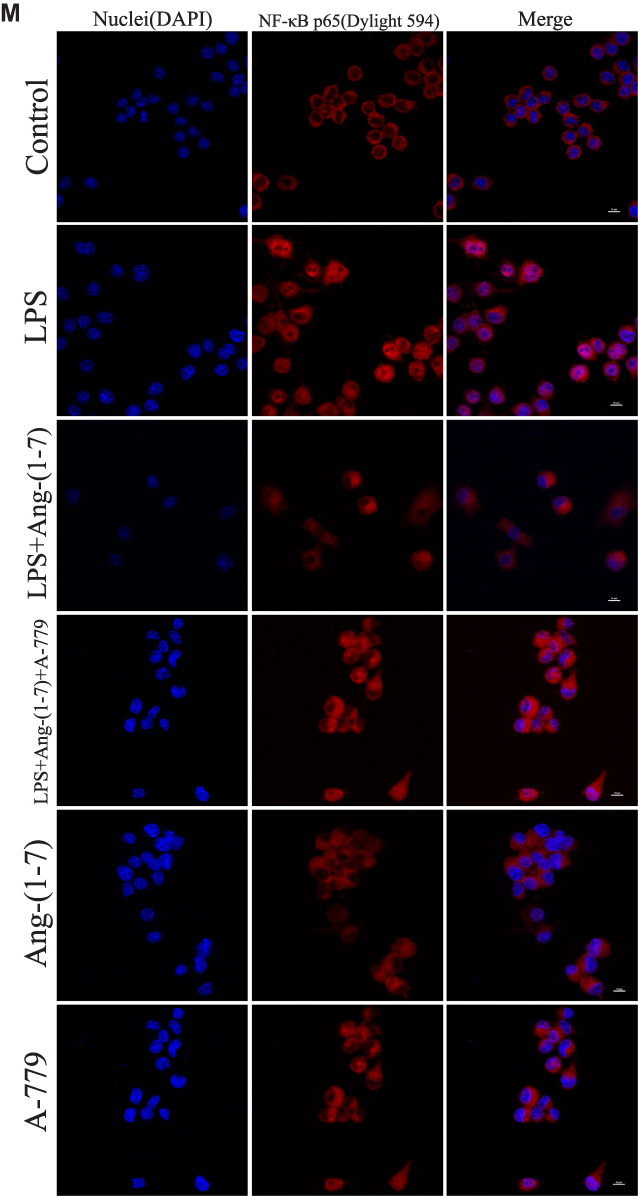 |
Figure 3 Ang-(1–7) regulates M1/M2 polarization in lipopolysaccharide (LPS)-stimulated RAW264.7 by altering the TLR4-mediated NF-κB pathway. (A–C) Representative Western immunoblots for TLR4, P65, P-P65, P-IκB, P38, P-P38, ERK1/2, P-ERK1/2, JNK, and P-JNK. (D–G and J–L) Bar graph showing the corresponding quantitative data. (H and I) The mRNA levels of TLR4 and P65 were determined by qRT-PCR. (M) Representative fluorescence images of the nuclear translocation of p65 in RAW 264.7 cells for each group (scale bar: 10μm). Error bars indicate the mean ± SD for three separate experiments, n = 3 for each group, *p < 0.05; **p < 0.01. Abbreviation: ns, non-significant. |
The ACE2/Ang-(1-7)/Mas Axis Ameliorated LPS-Induced Inflammatory Response of Macrophages via the Inhibition of TLR4-Mediated NF-κB and MAPK Pathways
TLR4 is a crucial regulator receptor of inflammatory reactions. NF-κB is a transcriptional regulator that plays a central role in signal transduction via Toll-like receptors. To detect the protein and RNA expression of TLR4, We observed that Ang-(1-7) could significantly inhibit its level (p<0.05 or p<0.01, Figure 3A, D and H). Then, the results showed that Ang-(1-7) suppressed the protein and RNA expressions of P65 and P-P65 previously stimulated by LPS, and competitively reversed the protein expression of phosphorylated IκB-α, the inhibitor of NF-κB, which could be partly rescued by A-779 (p<0.05 or p<0.01, Figure 3B, E–G and I). Immunofluorescent staining showed that the Ang-(1-7) suppressed LPS-induced nuclear translocation of P65 (Figure 3M). The MAPKs pathway links the cell-surface receptors to the transcription machinery, transducing the extracellular signals into several outputs, which may also adapt the host defense mechanism to pathogen attacks. The effects of the ACE2/Ang-(1-7)/Mas axis on the LPS-induced phosphorylation of p38, JNK, and ERK using three different phospho-specific antibodies indicated that LPS treatment significantly increased the levels of protein of the MAPK pathway by increasing the phosphorylation of p38, JNK, and ERK. The P38/P-P38, ERK/P-ERK, and JNK/P-JNK levels were attenuated to some degree in Ang-(1-7)-treated LPS-induced macrophages, when compared to LPS-treated macrophages (p<0.05 or p<0.01, Figure 3C and J–L). Together, these results showed that the ACE2/Ang-(1-7)/Mas axis decreased cell inflammation by inhibition of TLR4 receptor and the pathways of NF-kB and MAPKs.
The ACE2/Ang-(1-7)/Mas Axis Attenuated Pro-Inflammatory Cytokine and Enhanced Anti-Inflammatory Cytokine Production in vivo and Relieved Splenomegaly by Infection in CLP Mice
After injected with Ang-(1-7), high levels of IL-6 and TNF-α expressed in mice subjected to CLP surgery were significantly reduced, and low levels of IL-4 and IL-10 were on the contrary (p<0.05 or p<0.01, Figure 4A–D). The spleens were removed from mice models and measured by weight and longest length (p<0.05 or p<0.01, Figure 4F). The results confirmed that Ang-(1-7) effectively reduced splenomegaly in CLP mice. The histological analysis scores by H&E staining observed that Ang-(1-7) significantly relieved the destruction of the splenic cord and corpuscle pathological structures (p<0.05 or p<0.01, Figure 4E and G). The results implied that ACE2/Ang-(1-7)/Mas axis could regulate immune cells in spleen to control inflammatory response.
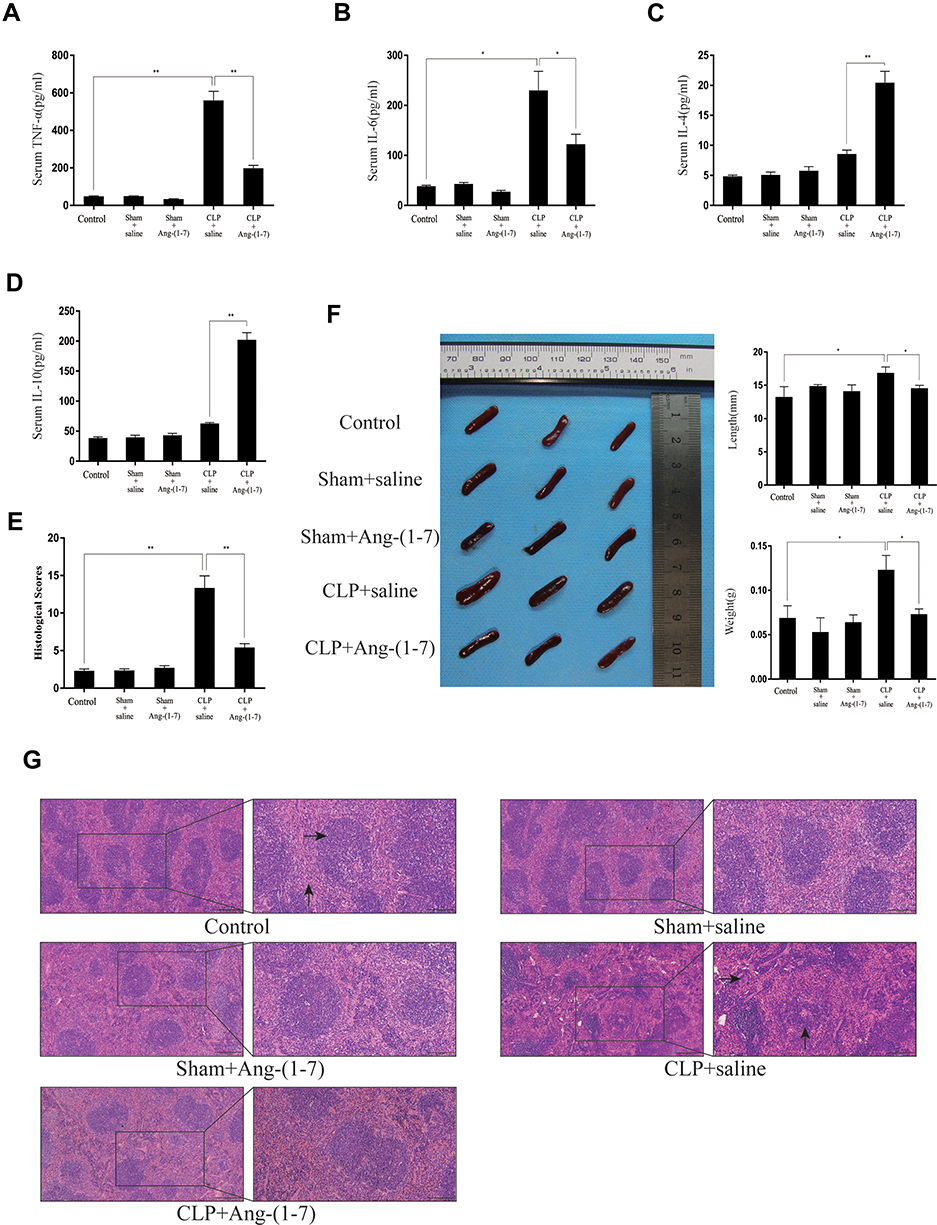 |
Figure 4 Ang-(1–7) reduced serum inflammatory factors and relieved the pathology of spleens during cecal ligation and puncture-induced sepsis. (A–E) The serum levels of TNF-α, IL-6, IL-4 and IL-10 on day 4 day after surgery were determined using ELISAs. (F) After injected with Ang-(1-7) for 3 days, the mice were sacrificed, and representative images of the spleens in the mice and the morphology of the spleen are presented. Weights and lengths of spleens were measured and compared. (G) Spleens were sectioned and stained with hematoxylin and eosin, and representative histopathological images are presented (scale bar: 200 μm/100μm). In the control group of Figure 4G, →showed white pulp, ↑showed red pulp. In the CLP+saline group of Figure 4G, →showed macrophage, ↑showed lymphoid follicular hyperplasia. The histological scores for H&E staining are presented. Error bars indicate the mean ± SD for three separate experiments, n = 3 for each group, *p < 0.05; **p < 0.01. |
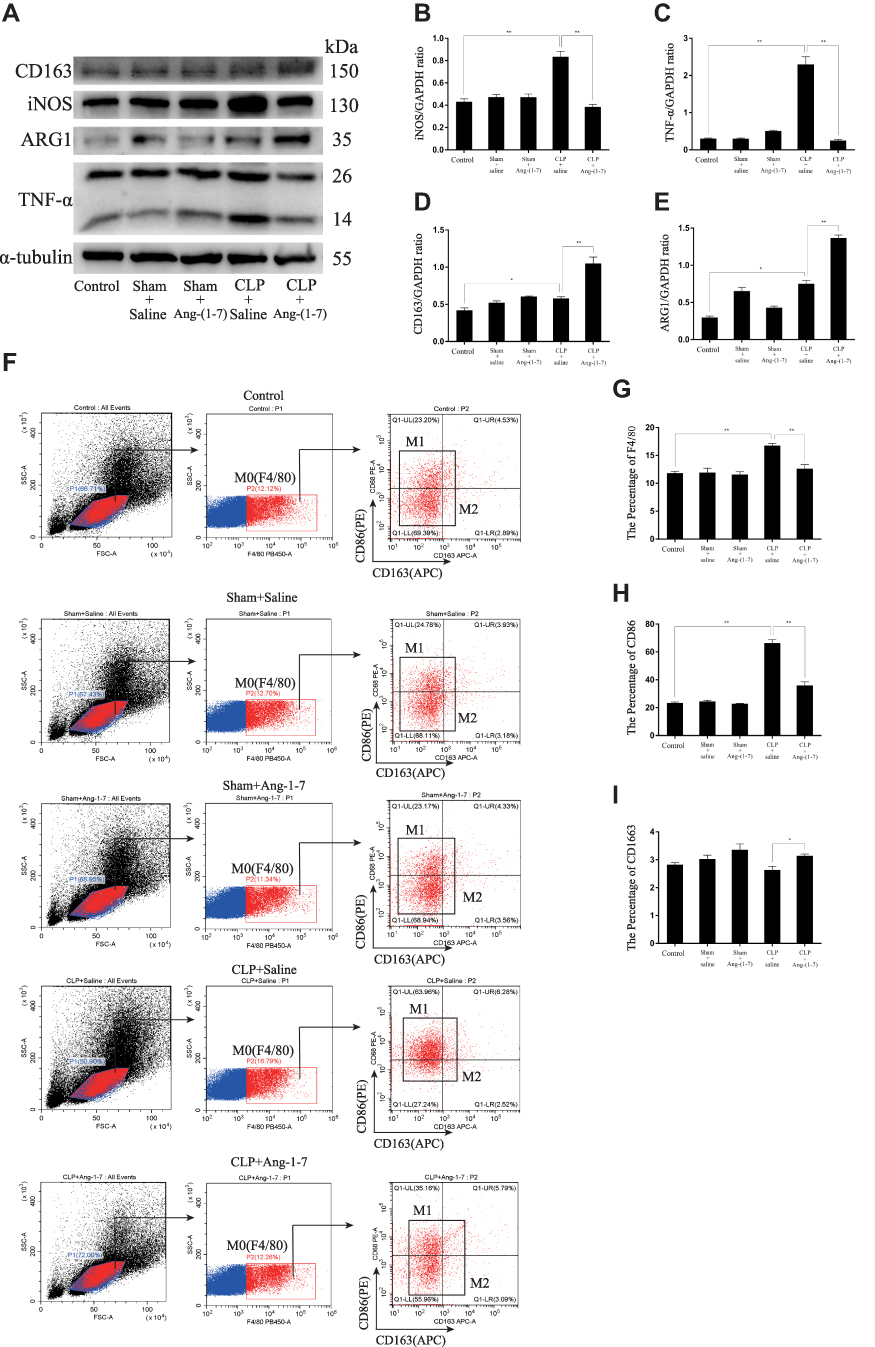 |
Figure 5 Continue. |
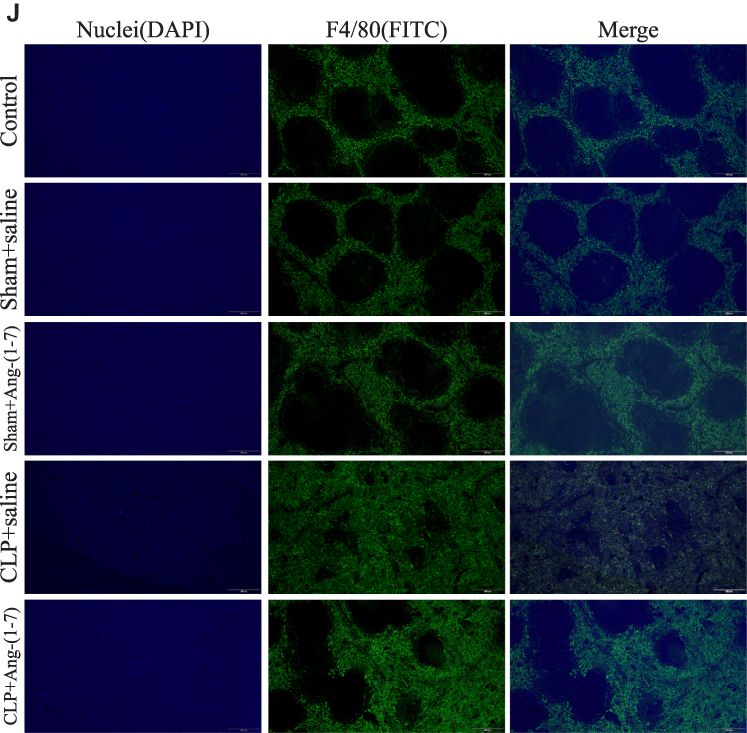 |
Figure 5 Ang-(1-7) modulated macrophage polarization of spleen cells suspensions and relieved macrophage infiltration of spleens in CLP mice. (A) Representative Western immunoblots for iNOS, TNF-α, ARG1 and CD163. (B–E) Bar graph showing the corresponding quantitative data. (F) The percentage of M0/M1/M2 macrophage phenotype-related surface markers, F4/80, CD86 and CD163, were determined by flow cytometry for each group. (G–I) Bar graph showing the corresponding quantitative data. (J) Representative fluorescence images of frozen spleen slices were measured using the macrophage surface markers, F4/80, and nuclear staining (4ʹ,6-diamidino-2-phenylindole) (scale bar: 200 μm). Error bars indicated the mean ± SD for three separate experiments, n = 3 for each group, *p < 0.05; **p < 0.01. |
The ACE2/Ang-(1-7)/Mas Axis Modulated Macrophage Polarization of Spleen Cells Suspensions in vivo and Relieved Macrophage Infiltration of Spleens by Infection in CLP Mice
By detecting the protein levels of INOS, TNF-α, ARG1 and CD163, the results showed that Ang-(1-7) inhibited the protein levels of the M1 phenotype marker and promoted the protein expressions of the M2 phenotype marker (p<0.05 or p<0.01, Figure 5A–E). Flow cytometry demonstrated that Ang-(1-7) could alleviate the accumulation of macrophage in CLP mice models spleen cells suspensions by detecting the percentage of F4/80 (Figur 5F–I). We also observed that Ang-(1-7) significantly decreased the positive rate of CD86 and slightly elevated the positive rate of CD163 in CLP mice spleen cell suspensions (Figure 5F–I). The results of immunofluorescence showed that Ang-(1-7) extenuated the amount and accumulation of macrophages in the spleen of CLP mice compared with control group mice (Figure 5J). Together, these results suggested that Ang-(1-7) shifted M1 macrophage polarization to M2 phenotype and relieved macrophage infiltration of spleen in the CLP mice models.
The ACE2/Ang-(1-7)/Mas Axis Attenuated the Inflammatory Response in Sepsis Models via Suppression of the TLR4-Mediated NF-κB and MAPKs Pathways
To further characterize the protective mechanism of Ang-(1-7) underlying CLP-related sepsis, we evaluated the effect of Ang-(1-7) on the TLR4 and inflammation pathway of NF-κB and MAPKs. We observed that Ang-(1-7) could inhibit TLR4 protein levels (p<0.05 or p<0.01, Figure 6A and D). The results showed that Ang-(1-7) decreased the protein expressions of P65 and p-p65 and increased the protein expression of P-IκBα compared with CLP groups (p<0.05 or p<0.01, Figure 6B and E–G). The mean density analysis of immunohistochemistry showed that Ang-(1-7) significantly suppressed the distribution status of P65 nuclear translocation (p<0.05 or p<0.01, Figure 6K–L). The results showed that Ang-(1-7) attenuated the ratio of P-P38/P38, P-ERK/ERK, and P-JNK/JNK levels to some degree compared with significant elevation of the CLP group (p<0.05 or p<0.01, Figure 6C and H–J). These results showed that the ACE2/Ang-(1-7)/Mas axis upregulated protein expression of TLR4 and the classic inflammation pathway involving NF-κB and MAPKs.
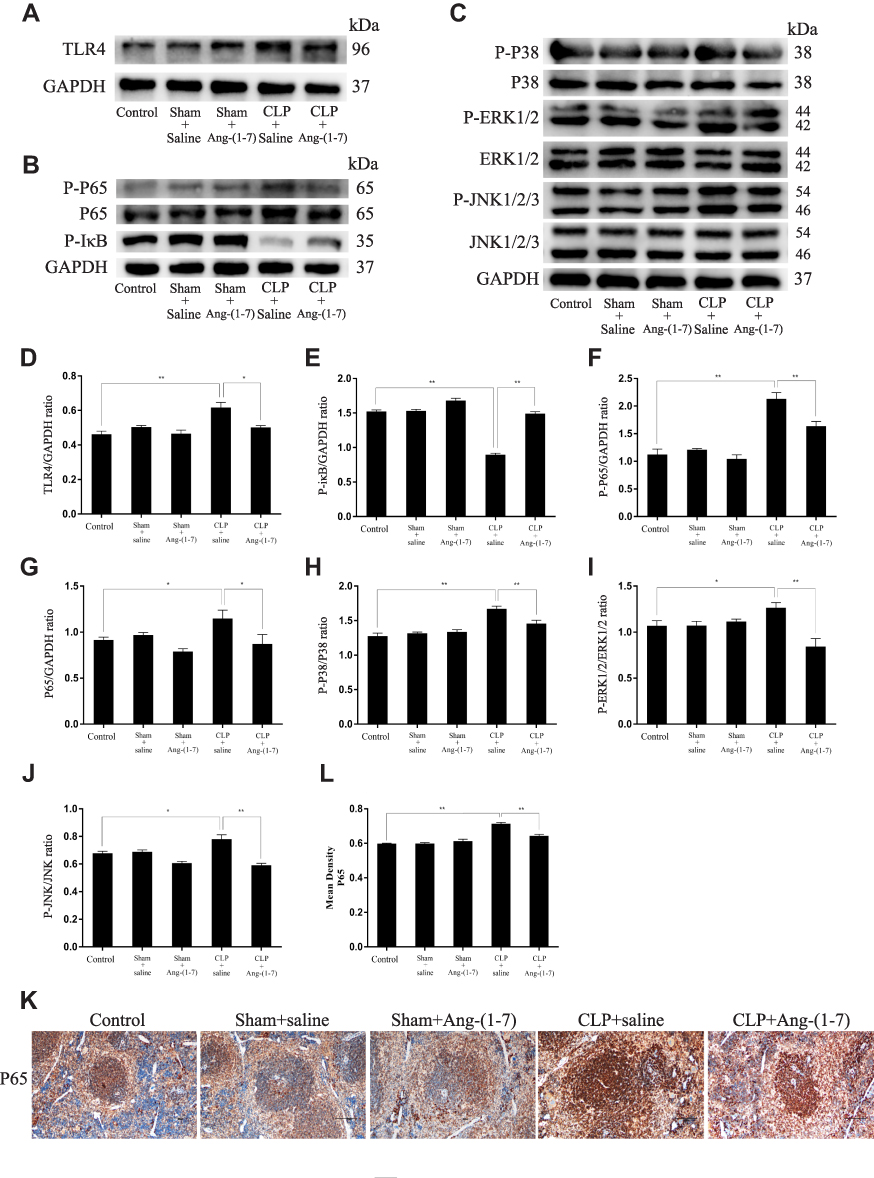 |
Figure 6 Ang-(1–7) inhibited TLR4-mediated NF-κB and MAPK in spleens of CLP-induced models. (A–C) Representative Western immunoblots for TLR4, P65, P-P65, P-IκB, P38, P-P38, ERK1/2, P-ERK1/2, JNK, and P-JNK. (D–J) Bar graph showing the corresponding quantitative data. (K) Representative immunohistochemistry tissue staining images of frozen spleen slices were measured for the nuclear translocation of NF-κB p65 (scale bar: 200 μm). (L) The mean density of immunohistochemistry images were presented. Error bars indicated the mean ± SD for three separate experiments, n = 3 for each group, *p < 0.05; **p < 0.01. |
Discussion
In this study, the results showed that Ang-(1-7) inhibited M1-like macrophage polarization and promoted M2 macrophage phenotype transformation in vitro and in vivo, which revealed the role and mechanism of the ACE2-Ang-(1-7)-Mas axis during inhibiting inflammatory response and provided evidence for future investigations into the potential therapeutic value of Ang-(1-7) in the treatment of human sepsis and other inflammatory diseases.
During inflammation, macrophages play a crucial role in the initiation of inflammation and clearance of pathogens, infected and dead cells, and debris.18 In the initial onset of the inflammatory phase, the traditional M0 macrophage phenotype undergoes reprogramming to classically activated M1 macrophages. After being activated by LPS, macrophages rapidly polarize toward the M1 phenotype and secrete large amounts of pro-inflammatory cytokines and chemokines to recruit more circulating neutrophils, monocytes, and mast cells, which amplify the inflammatory response.19 However, stimulated by IL-4 and IL-10, macrophages partially shifted M1 polarization to M2 phenotype and produced anti-inflammatory factors to repair tissue damage caused by acute inflammation.20 In this study, we verified that iNOS and TNF-α were highly expressed in the LPS-induced macrophages and the spleens of CLP-induced mice models, but ARG1 and CD163 were lowly expressed in these models. In the present study, the ratio of CD86/F4/80 in LPS-stimulated macrophages and the rate of F4/80 and CD86 in the spleen cell suspensions were increased, which confirmed that a phenotypic switch from M0 to M1 macrophage polarization characterized the transition from normal to the onset of inflammation.
Increasing evidence has suggested that the shifts in macrophage phenotype dynamics may be involved in toll-like receptor agonist-mediated inflammatory responses.6,7 Recent studies have shown that in autoinflammatory diseases, inflammasome activity needs to be tightly regulated at multiple levels, which is typically delivered via NF-κB activation by TLR ligands to stimulate NLRP3 and IL-1β transcription and prepare the cells for a vigorous inflammatory response for priming.21,22 TLR4, located on the cell surface, is a major sensor of bacterial LPS during inflammatory responses of macrophages. TLR4 is the only TLR that signals through both myeloid differentiation primary response protein 88 (MyD88) and TRIF signaling pathways to initiate the activation and nuclear translocation of NF-кB to induce inflammation.23 In our studies, we confirmed that when macrophages accomplished M1 phenotypic conversion, TLR4 was detected at high levels, allowing the activation of the NF-кB and MAPKs pathways and subsequent stimulation of inflammation.
Ang-(1-7) is a biologically active product of the RAAS cascade, which is mainly formed from Ang II (angiotensin II) by catalysis of ACE2. The expression of ACE2 would increase under inflammatory stimulation in macrophages. The ACE2 can transform Ang II to Ang-(1-7), and then acting on Mas receptor play an important role in inflammation. ACE2-Ang-(1-7)-Mas axis functions as an antagonist to the classical ACE/Ang II/AT1 receptor branch via the Mas receptor.24,25 Souza et al reported that Ang-(1–7) inhibited LPS-induced pro-inflammatory cytokine production and hypothermia in endotoxemia mice.26 We were therefore interested in determining how the ACE2-Ang-(1-7)-Mas axis affected macrophage polarization. We determined the effects of the ACE2-Ang-(1-7)-Mas axis on CLP-induced inflammation in mice models. Our previous studies indicated that Ang-(1-7) impeded the activation of TGF-β1 induced by LDL and subsequently protected human mesangial cells from injury by regulating the LDLr-SREBP2-SCAP pathway.16 Further studies have shown that Ang-(1-7) treatment reduces pro-inflammatory factors, along with the levels of JNK and Fox1 in macrophages.17 These established studies showed that Ang-(1-7) could alleviate inflammation. In the present study, we provided new insights into the effect and mechanism of the ACE2/Ang-(1-7)/Mas axis on macrophage polarization and CLP-induced inflammation mice models. We confirmed that Ang-(1-7) altered the M1 polarization status toward M2 phenotype of LPS-stimulated macrophages and reduced the secretion of inflammatory factors, suggesting that Ang-(1-7) effectively inhibited an acute inflammatory state and alleviated the development of inflammation. Further studies then indicated that TLR4 was significantly activated in the formation of inflammation, and that Ang-(1-7) treatment specifically blocked the inflammatory effect by LPS via TLR4, suggesting that anti-inflammation was responsible for Ang-(1-7) via TLR4 in the transition of M1 polarization to M2 macrophage and alleviation in sepsis models. Moreover, we determined that NF-кB and MAPK signaling pathways were related to TLR4, which could be inhibited by Ang-(1-7) in LPS-stimulated macrophages and CLP-induced mice models. We also confirmed that Ang-(1-7) effectively alleviated splenomegaly and macrophage infiltration in the spleens of CLP-induced inflammatory mice. A-779 blocked the anti-inflammatory function of Ang-(1-7), which confirmed that Ang-(1-7) played anti-inflammatory roles via the Mas receptor. Overall, this study determined the role of the ACE2/Ang-(1-7)/Mas axis in the conversion of the M1/M2 phenotype of macrophages, and the destruction of the splenic cord and corpuscle histological structures and macrophage infiltration in spleens of CLP-induced inflammatory mice models through the regulation of TLR4 and its related NF-κB and MAPKs pathways.
Conclusion
The study showed that Ang-(1-7) via its Mas receptor inhibited M1-like macrophage activation and facilitated conversion of macrophage to M2 polarization in LPS-induced macrophages and CLP-induced inflammatory mice models. By decreasing inflammation, regulation of TLR4 and related NF-κB and MAPKs pathways through the ACE2/Ang-(1-7)/Mas axis therefore provides a promising therapeutic treatment for patients with macrophage inflammatory diseases.
Acknowledgments
This study was supported by grant 81771738 from the National Natural Science Foundation of China and (2020) 7 from Kuanren Talents Program of the Second Affiliated Hospital of Chongqing Medical University.
Disclosure
The authors report no conflicts of interest in this work.
References
1. Medzhitov R. Inflammation 2010: new adventures of an old flame. Cell. 2010;140:771–776. doi:10.1016/j.cell.2010.03.006
2. Weiss U. Inflammation. Nature. 2008;454:7203. doi:10.1038/454427a
3. Varela ML, Mogildea M, Moreno I, et al. Acute inflammation and metabolism. Inflammation. 2018;41:1115–1127. doi:10.1007/s10753-018-0739-1
4. Faix JD. Biomarkers of sepsis. Crit Rev Clin Lab Sci. 2013;50:23–36. doi:10.3109/10408363.2013.764490
5. Chazaud B. Inflammation and skeletal muscle regeneration: leave it to the macrophages! Trends Immunol. 2020;41:481–492. doi:10.1016/j.it.2020.04.006
6. Schappe MS, Szteyn K, Stremska ME, et al. Chanzyme TRPM7 mediates the Ca2+ influx essential for lipopolysaccharide-induced toll-like receptor 4 endocytosis and macrophage activation. Immunity. 2018;48:59–74. doi:10.1016/j.immuni.2017.11.026
7. Sica A, Mantovani A. Macrophage plasticity and polarization: in vivo veritas. J Clin Invest. 2012;122:787–795. doi:10.1172/JCI59643
8. Liu L, Guo H, Song A, et al. Progranulin inhibits LPS-induced macrophage M1 polarization via NF-кB and MAPK pathways. BMC Immunol. 2020;21(1):32–44. doi:10.1186/s12865-020-00355-y
9. Lescoat A, Lelong M, Jeljeli M, et al. Combined anti-fibrotic and anti-inflammatory properties of JAK-inhibitors on macrophages in vitro and in vivo: perspectives for scleroderma-associated interstitial lung disease. Biochem Pharmacol. 2020;178:114103. doi:10.1016/j.bcp.2020.114103
10. Mills CD, Kincaid K, Alt JM, et al. M-1/M-2 macrophages and the Th1/Th2 paradigm. J Immunol. 2000;164:6166–6173. doi:10.4049/jimmunol.164.12.6166
11. Liu YC, Zou XB, Chai YF, Yao YM. Macrophage polarization in inflammatory diseases. Int J Biol Sci. 2014;10:520–529. doi:10.7150/ijbs.8879
12. Orecchioni M, Ghosheh Y, Pramod AB, et al. Macrophage polarization: different gene signatures in M1(LPS+) vs. classically and M2(LPS-) vs. alternatively activated macrophages. Front Immunol. 2019;10:1084. doi:10.3389/fimmu.2019.01084
13. Romero CA, Orias M, Weir MR, et al. Novel RAAS agonists and antagonists: clinical applications and controversies. Nat Rev Endocrinol. 2015;11:242–252. doi:10.1038/nrendo.2015.6
14. AlQudah M, Hale TM, Czubryt MP, et al. Targeting the renin-angiotensin-aldosterone system in fibrosis. Matrix Biol. 2020;91-92:92–108. doi:10.1016/j.matbio.2020.04.005
15. Simões e Silva AC, Silveira KD, Ferreira AJ, et al. ACE2, angiotensin-(1-7) and Mas receptor axis in inflammation and fibrosis. Br J Pharmacol. 2013;169:477–492. doi:10.1111/bph.12159
16. Huang W, Tang L, Cai Y, et al. Effect and mechanism of the Ang-(1-7) on human mesangial cells injury induced by low density lipoprotein. Biochem Biophys Res Commun. 2014;450:1051–1057. doi:10.1016/j.bbrc.2014.06.107
17. Jiang M, Huang W, Wang Z, et al. Anti-inflammatory effects of Ang-(1–7) via TLR4-mediated inhibition of the JNK/FoxO1 pathway in lipopolysaccharide-stimulated RAW264.7 cells. Dev Comp Immunol. 2019;92:291–298. doi:10.1016/j.dci.2018.11.009
18. Shapouri-Moghaddam A, Mohammadian S, Vazini H, et al. Macrophage plasticity, polarization, and function in health and disease. J Cell Physiol. 2018;233:6425–6440. doi:10.1002/jcp.26429
19. Liu L, Zhu X, Zhao T, et al. Sirt1 ameliorates monosodium urate crystal-induced inflammation by altering macrophage polarization via the PI3K/Akt/STAT6 pathway. Rheumatology. 2019;58:1674–1683. doi:10.1093/rheumatology/kez165
20. Yunna C, Mengru H, Lei W, et al. Macrophage M1/M2 polarization. Eur J Pharmacol. 2020;877:173090. doi:10.1016/j.ejphar.2020.173090
21. Broderick L, De Nardo D, Franklin BS, et al. The inflammasomes and autoinflammatory syndromes. Annu Rev Pathol. 2015;10:395–424. doi:10.1146/annurev-pathol-012414-040431
22. Tartey S, Kanneganti T. Inflammasomes in the pathophysiology of autoinflammatory syndromes. J Leukoc Biol. 2020;107:379–391. doi:10.1002/JLB.3MIR0919-191R
23. O’Hare FM, Watson RW, Molloy EJ. Toll-like receptors in neonatal sepsis. Acta Pædiatrica. 2013;102:572–578. doi:10.1111/apa.12201
24. e Silva ACS, Teixeira MM. ACE inhibition, ACE2 and angiotensin-(1-7) axis in kidney and cardiac inflammation and fibrosis. Pharmacol Res. 2016;107:154–162. doi:10.1016/j.phrs.2016.03.018
25. Rodrigues Prestes TR, Rocha NP, Miranda AS, et al. The anti-inflammatory potential of ACE2/angiotensin-(1-7)/Mas receptor axis: evidence from basic and clinical research. Curr Drug Targets. 2017;18:1301–1313. doi:10.2174/1389450117666160727142401
26. Souza L, Duchene J, Todiras M, et al. Receptor MAS protects mice against hypothermia and mortality induced by endotoxemia. Shock. 2014;41:331–336. doi:10.1097/SHK.0000000000000115
 © 2021 The Author(s). This work is published and licensed by Dove Medical Press Limited. The full terms of this license are available at https://www.dovepress.com/terms.php and incorporate the Creative Commons Attribution - Non Commercial (unported, v3.0) License.
By accessing the work you hereby accept the Terms. Non-commercial uses of the work are permitted without any further permission from Dove Medical Press Limited, provided the work is properly attributed. For permission for commercial use of this work, please see paragraphs 4.2 and 5 of our Terms.
© 2021 The Author(s). This work is published and licensed by Dove Medical Press Limited. The full terms of this license are available at https://www.dovepress.com/terms.php and incorporate the Creative Commons Attribution - Non Commercial (unported, v3.0) License.
By accessing the work you hereby accept the Terms. Non-commercial uses of the work are permitted without any further permission from Dove Medical Press Limited, provided the work is properly attributed. For permission for commercial use of this work, please see paragraphs 4.2 and 5 of our Terms.