")
Back to Journals » Clinical Interventions in Aging » Volume 9
The abilities of new anthropometric indices in identifying cardiometabolic abnormalities, and influence of residence area and lifestyle on these anthropometric indices in a Chinese community-dwelling population
Authors Fu S, Luo L , Ye P, Liu Y, Zhu B, Bai Y, Bai J, Ping P
Received 9 September 2013
Accepted for publication 8 October 2013
Published 15 January 2014 Volume 2014:9 Pages 179—189
DOI https://doi.org/10.2147/CIA.S54240
Checked for plagiarism Yes
Review by Single anonymous peer review
Peer reviewer comments 2
Shihui Fu,1 Leiming Luo,1 Ping Ye,1 Yuan Liu,1 Bing Zhu,1 Yongyi Bai,1 Jie Bai2
1Department of Geriatric Cardiology, 2Department of Clinical Biochemistry, Chinese People's Liberation Army General Hospital, Beijing, People's Republic of China
Objective: The study aimed to investigate the prevalence of overweight, obesity, and cardiometabolic abnormalities, the influence of residence area, occupation, and lifestyle on new anthropometric indices, and the relationship between anthropometric indices and cardiometabolic abnormalities in a Chinese community-dwelling population.
Methods: The study included 4,868 residents through a large health check-up program in Beijing.
Results: Overall obesity existed in 22.2% of men and 28.1% of women. 67.1% of men and 65.2% of women were overweight. 65.99% of men and 65.97% of women had central obesity. Residents of rural areas, manual workers, and smokers had significantly higher anthropometric indices. The power of each anthropometric index varied for identifying different cardiometabolic abnormalities, and the ability of the waist-to-height ratio to identify participants with greater than one or two cardiometabolic abnormalities was optimal. The appropriate cut-off values of all anthropometric indices for cardiometabolic abnormalities were obtained.
Conclusion: Overweight is common for both sexes in the People's Republic of China, as are general and central obesity. Residents of rural areas, manual workers, and smokers have significantly higher anthropometric indices. Waist-to-height ratio has the ability to reflect the compound risk of different cardiometabolic abnormalities and the greatest potential to be widely applied in clinical practice.
Keywords: anthropometric indices, residence area, lifestyle, cardiometabolic abnormalities, Chinese community-dwelling population
Introduction
Obesity is an important public health problem worldwide. Almost all countries, irrespective of economic status, are currently experiencing an obesity epidemic.1–3 Residence area, occupation, and lifestyle significantly modify the body fat composition, and thus affect the prevalence of obesity.4,5 As a country undergoing economic transition, the People’s Republic of China has its own characteristics, such as the rapid economic growth and huge rural–urban disparity, leading to the corresponding disparities in work and lifestyle. Whether or not these disparities in the residence area, occupation, and lifestyle increase the risk of obesity in the People’s Republic of China is a new issue and worthy of further study.
Obesity is a fundamental pathology of cardiometabolic abnormalities, such as hypertension, type 2 diabetes, and dyslipidemia.6,7 In the People’s Republic of China, obesity contributes to an increased risk for cardiovascular disorders, the leading cause of death, especially in rural areas.8 Therefore, early prevention, identification, and treatment of obesity are recognized as a major public health issue, emphasizing the importance of developing methods and criteria for establishing an accurate diagnosis.9 The excess and abnormal distribution of body fat are the primary defining characteristics of obesity, and various alternative methods of the measurement of obesity, such as the body mass index (BMI) and waist circumference (WC), have been proposed and applied in clinical practice as easy to use and noninvasive. The BMI is often used to reflect total body fat, whereas the WC is used as a surrogate marker of body fat centralization. In recent years, it has been proposed that central rather than overall obesity can serve as an important identifier of cardiometabolic abnormalities.10 Accordingly, the WC has been suggested to be a more useful tool in measuring abdominal fat.11 Nevertheless, the WC has been criticized for not taking into account differences in the height and hip circumference (HC), thus the waist-to-hip ratio (WHR) and waist-to-height ratio (WHtR) have emerged as new parameters of body fat, and have been reported to be more closely associated with cardiometabolic abnormalities.12 In addition, another study has provided evidence that the waist-to-hip-to-height ratio (WHHR) is the best variable of identifying cardiometabolic abnormalities; however, it has also been emphasized that the WHHR needs to be tested in more diverse populations.13 Recently, one study has confirmed that the body adiposity index (BAI) is a useful measure of body fat,14 while another study has developed a body shape index (ABSI), which can play a significant role as a preferable identifier of cardiometabolic abnormalities.15 It is unclear, however, if these new indices of body adiposity better identify cardiometabolic abnormalities than the BMI and WC, and thus the best way to measure body fat has become increasingly controversial.
Most studies examining the risk of adverse health associated with obesity have been based on data from the United States or European countries, with little data available on populations in the People’s Republic of China. Several studies have demonstrated that many Asians with lower BMI levels have higher amounts of body fat, as well as a high prevalence of cardiometabolic abnormalities, thus the limitation of extrapolating anthropometric criteria established with Westerners to Asian populations has been underscored.16 The applicability of anthropometric criteria to Chinese may differ from the current recommendations by other countries due to racial differences in body build and fat distribution,17 thus to apply ethnically-appropriate anthropometric indices for evaluating cardiometabolic abnormalities is of great importance. In view of all these considerations, the aims of the current study were to evaluate the following in a Chinese community-dwelling population: 1) the prevalence of obesity and cardiometabolic abnormalities; 2) the influence of residence area, occupation, smoking, and alcohol consumption on anthropometric indices; 3) the relationship between anthropometric indices and cardiometabolic abnormalities; and 4) the appropriate cut-off values for identifying cardiometabolic abnormalities.
Methods
Study population
This community-based survey was conducted in 5,116 participants through a large health check-up program in Beijing, People’s Republic of China. All of the participants were permanent residents of Han origin and ≥18 years of age. A stratified cluster sampling design was used in this survey. In the first stage of sampling, three districts (Fengtai, Shijingshan, and Daxing) were selected from 18 districts in Beijing. In the second stage of sampling, two urban communities were selected from two districts (Fengtai and Shijingshan), and two residential villages were selected from another district (Daxing). In the third stage of sampling, the participants were selected from these communities and villages to represent the overall Beijing population. Data were collected between May 2007 and July 2009. Two hundred forty-eight subjects with missing data for essential variables were excluded from the analysis. The final study population comprised 4,868 participants.
Questionnaire survey
A questionnaire survey that included questions about residence area, occupation, lifestyle, and histories of hypertension, type 2 diabetes, high triglyceride level, high low-density lipoprotein-cholesterol (LDL-C) level, and low high-density lipoprotein-cholesterol (HDL-C) level was administered using a face-to-face counseling method. The questionnaire survey, anthropometric and blood pressure measurements were all performed by physicians in the Chinese People’s Liberation Army General Hospital. Knowledge work mainly depended on mental activities, while manual work mainly entailed physical activities. Cigarette smoking was defined as having smoked at least 100 cigarettes in one’s lifetime.18 Alcohol drinking was defined as the consumption of at least 30 grams of alcohol per week for ≥1 year.18
Anthropometric measurements
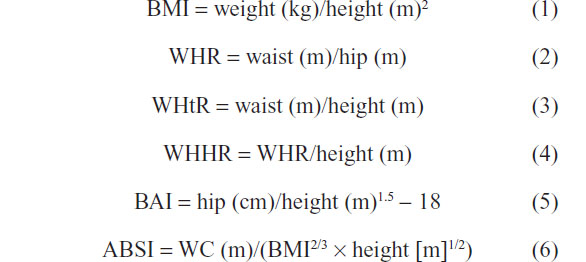
Physical examination was performed the morning following an overnight fast of at least 12 hours. Height, weight, WC, and HC were measured using a standardized protocol. Anthropometrics were measured with participants wearing light clothing and no shoes. Height was measured in centimeters using a wall-mounted measuring tape, and weight was measured in kilograms using a digital scale. WC was measured on standing subjects with a soft tape midway between the lowest rib and the iliac crest, and HC was measured over the widest part of the gluteal region. The anthropometric indices were calculated using the following equations:
Blood pressure measurements
Blood pressures were measured according to a standard protocol using the right arm of the participants with a calibrated desktop sphygmomanometer (Yuwell medical equipment & supply Co., Ltd., Jiangsu, People’s Republic of China) between 8 am and 10 am, after the participants had been in a seated position for ≥5 minutes.19 Systolic blood pressure (SBP) and diastolic blood pressure (DBP) were recorded at the first and fifth Korotkoff sounds, respectively. Reported SBP and DBP were the averages of two separate measurements at an interval of more than 1 minute.
Laboratory analyses
Samples of venous blood were drawn by venipuncture between 8 am and 10 am from fasting participants who had been resting for at least 5 minutes. Blood samples were routinely stored at 4°C, and delivered to the central laboratory in the Department of Biochemistry, Chinese People’s Liberation Army General Hospital, on the same day. Serum concentrations of fasting blood glucose, triglyceride, LDL-C, and HDL-C were measured by a technician, blinded to clinical data, using enzymatic assays (Roche Products Ltd, Basel, Switzerland) on a fully automatic biochemical autoanalyzer (COBAS c6000; Roche Products Ltd). The standard oral glucose tolerance test was completed after the fasting blood samples were collected. Participants were given a standard 75 g glucose solution, and blood samples were drawn 120 minutes after the glucose load to measure glucose concentrations.
Diagnoses of obesity and cardiometabolic abnormalities
Overweight, general obesity, and central obesity were defined, respectively, as a BMI ≥24 kg/m2, BMI ≥28 kg/m2, and WC ≥85 cm for men and ≥80 cm for women, according to the guidelines on prevention and control of overweight and obesity in Chinese adults.20 A subject was considered to have hypertension when SBP ≥140 mmHg, DBP ≥90 mmHg, and/or taking an antihypertensive medication.21 Type 2 diabetes was defined as follows: fasting blood glucose ≥7.0 mmol/L, postprandial blood glucose ≥11.1 mmol/L, and/or taking a hypoglycemic medication or insulin.22 Dyslipidemia, including elevated triglyceride level, elevated LDL-C level, and reduced HDL-C level, was diagnosed when the subject had triglyceride level ≥1.70 mmol/L, LDL-C level ≥3.37 mmol/L, and HDL-C level <1.04 mmol/L.23 Cardiometabolic abnormalities ≥1 indicated that the participant had one or more abnormalities (hypertension, type 2 diabetes, and dyslipidemia), whereas cardiometabolic abnormalities ≥2 indicated that the participant had two or more abnormalities (hypertension, type 2 diabetes, and dyslipidemia).
Statistical analyses
Continuous variables were described using the mean and standard deviation for variables with a normal distribution and the median and interquartile range for nonnormally distributed variables. Categorical data were expressed as the number and percentage of the total. The bivariate association was assessed by Student’s t-test for continuous variables (normal distribution), Mann–Whitney U test for continuous variables (abnormal distribution), and chi-square analysis for categorical variables. The independent association, after adjusting for age, was evaluated by multivariate regression analyses. The receiver operating characteristic curve and area under the curve (AUC) were calculated to compare the power of all anthropometric indices to identify cardiometabolic abnormalities and indicate the corresponding optimal cut-off values. The statistical analyses were two-sided at the 0.05 significance level and performed with SPSS version 17 (IBM Corporation, Armonk, NY, USA).
Results
The basic characteristics of all subjects, stratified by sex, are listed in Table 1. In total, 2,323 men and 2,545 women were included in this study. The ages of all participants ranged from 18–96 years, with mean and median ages of 51.38 (±14.96) and 52.00 (40.00–63.00) years, respectively. Of the study participants, 17.9% of men and 23.5% of women resided in rural areas, and 45.6% of men and 20.4% of women were engaged in knowledge work. There were more men who lived in urban areas and did knowledge work than women. Further, 54.8% of men were smokers and 56% consumed alcohol, while 8.7% of women were smokers and 4.4% consumed alcohol. The smoking and drinking rates were significantly higher for men than for women.
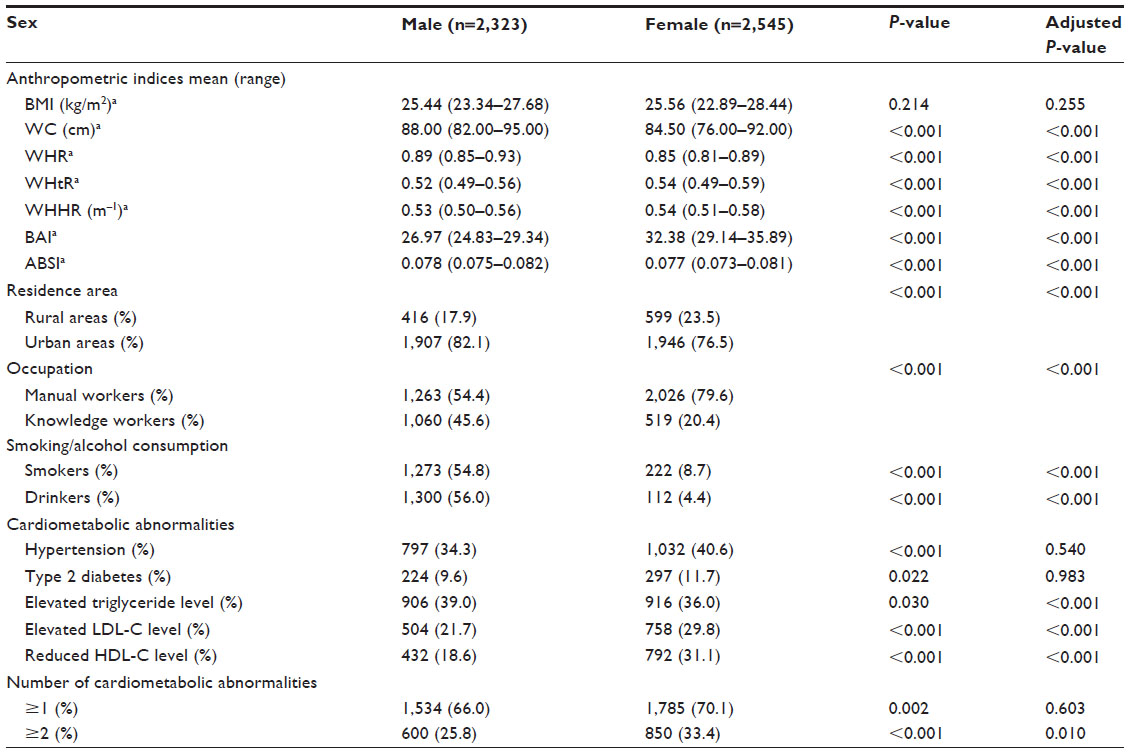 | Table 1 Basic characteristics of all subjects stratified by sex |
The median BMI levels in both sexes exceeded Chinese overweight standard; 67.1% of men and 65.2% of women were overweight according to the BMI standard. Moreover, 22.2% of men and 28.1% of women were considered to be generally obese, with 65.99% of men and 65.97% of women having central obesity. The prevalence of hypertension, type 2 diabetes, elevated triglyceride level, elevated LDL-C level, and reduced HDL-C level was 37.6%, 10.7%, 37.4%, 25.9%, and 25.1% for the total population, respectively; women had a higher prevalence of elevated LDL-C level and reduced HDL-C level, and a lower prevalence of elevated triglyceride level than men. There was no difference in the prevalence of hypertension and type 2 diabetes between the two sexes. The likelihood that women had ≥2 cardiometabolic abnormalities was higher than men; however, no difference existed between women and men with respect to ≥1 cardiometabolic abnormalities.
Table 2 summarizes the association of residence area, occupation, smoking, and alcohol consumption with anthropometric indices, stratified by sex. The residents of rural areas or manual workers had moderately or significantly higher anthropometric indices than inhabitants of urban areas or knowledge workers in both sexes, except that there was no significant difference in the BMI between rural and urban men. The anthropometric indices were significantly higher for men who smoked compared with men who did not smoke, except for the BMI and BAI. Women who smoked only had higher WHR and ABSI than women who did not smoke in all anthropometric indices. Alcohol consumption had no significant relationship with the anthropometric indices in both sexes.
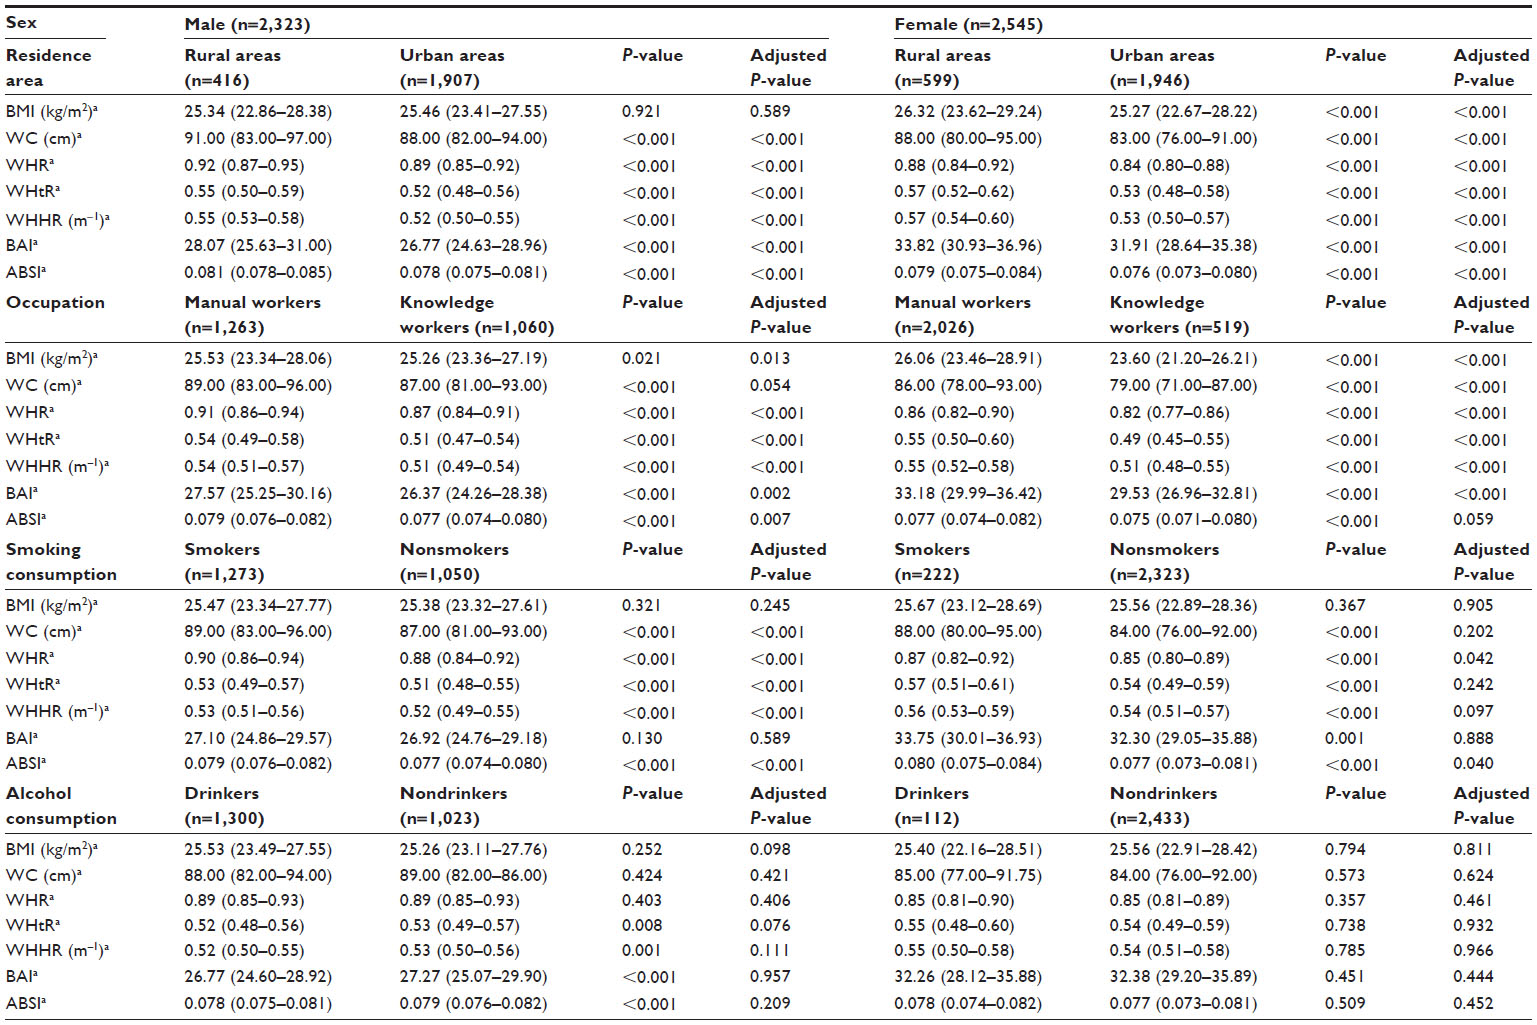 | Table 2 Relationship of residence area, occupation, smoking, and alcohol consumption with anthropometric indices |
Table 3 shows the association between the anthropometric indices and different cardiometabolic abnormalities, stratified by sex. All of the anthropometric indices for the male and female participants who had elevated triglyceride level, reduced HDL-C level, and elevated LDL-C level were significantly higher than the participants who did not have these abnormalities. Except there was no significant difference in ABSI between the hypertensive and non-hypertensive women, as well as a moderate difference in BAI between women with and without type 2 diabetes, the men and women with hypertension and type 2 diabetes had significantly higher anthropometric indices than those without hypertension and type 2 diabetes. The participants with ≥1 or ≥2 cardiometabolic abnormalities in the higher anthropometric indices group outnumbered the participants in the lower anthropometric indices group, except for the ABSI in women.
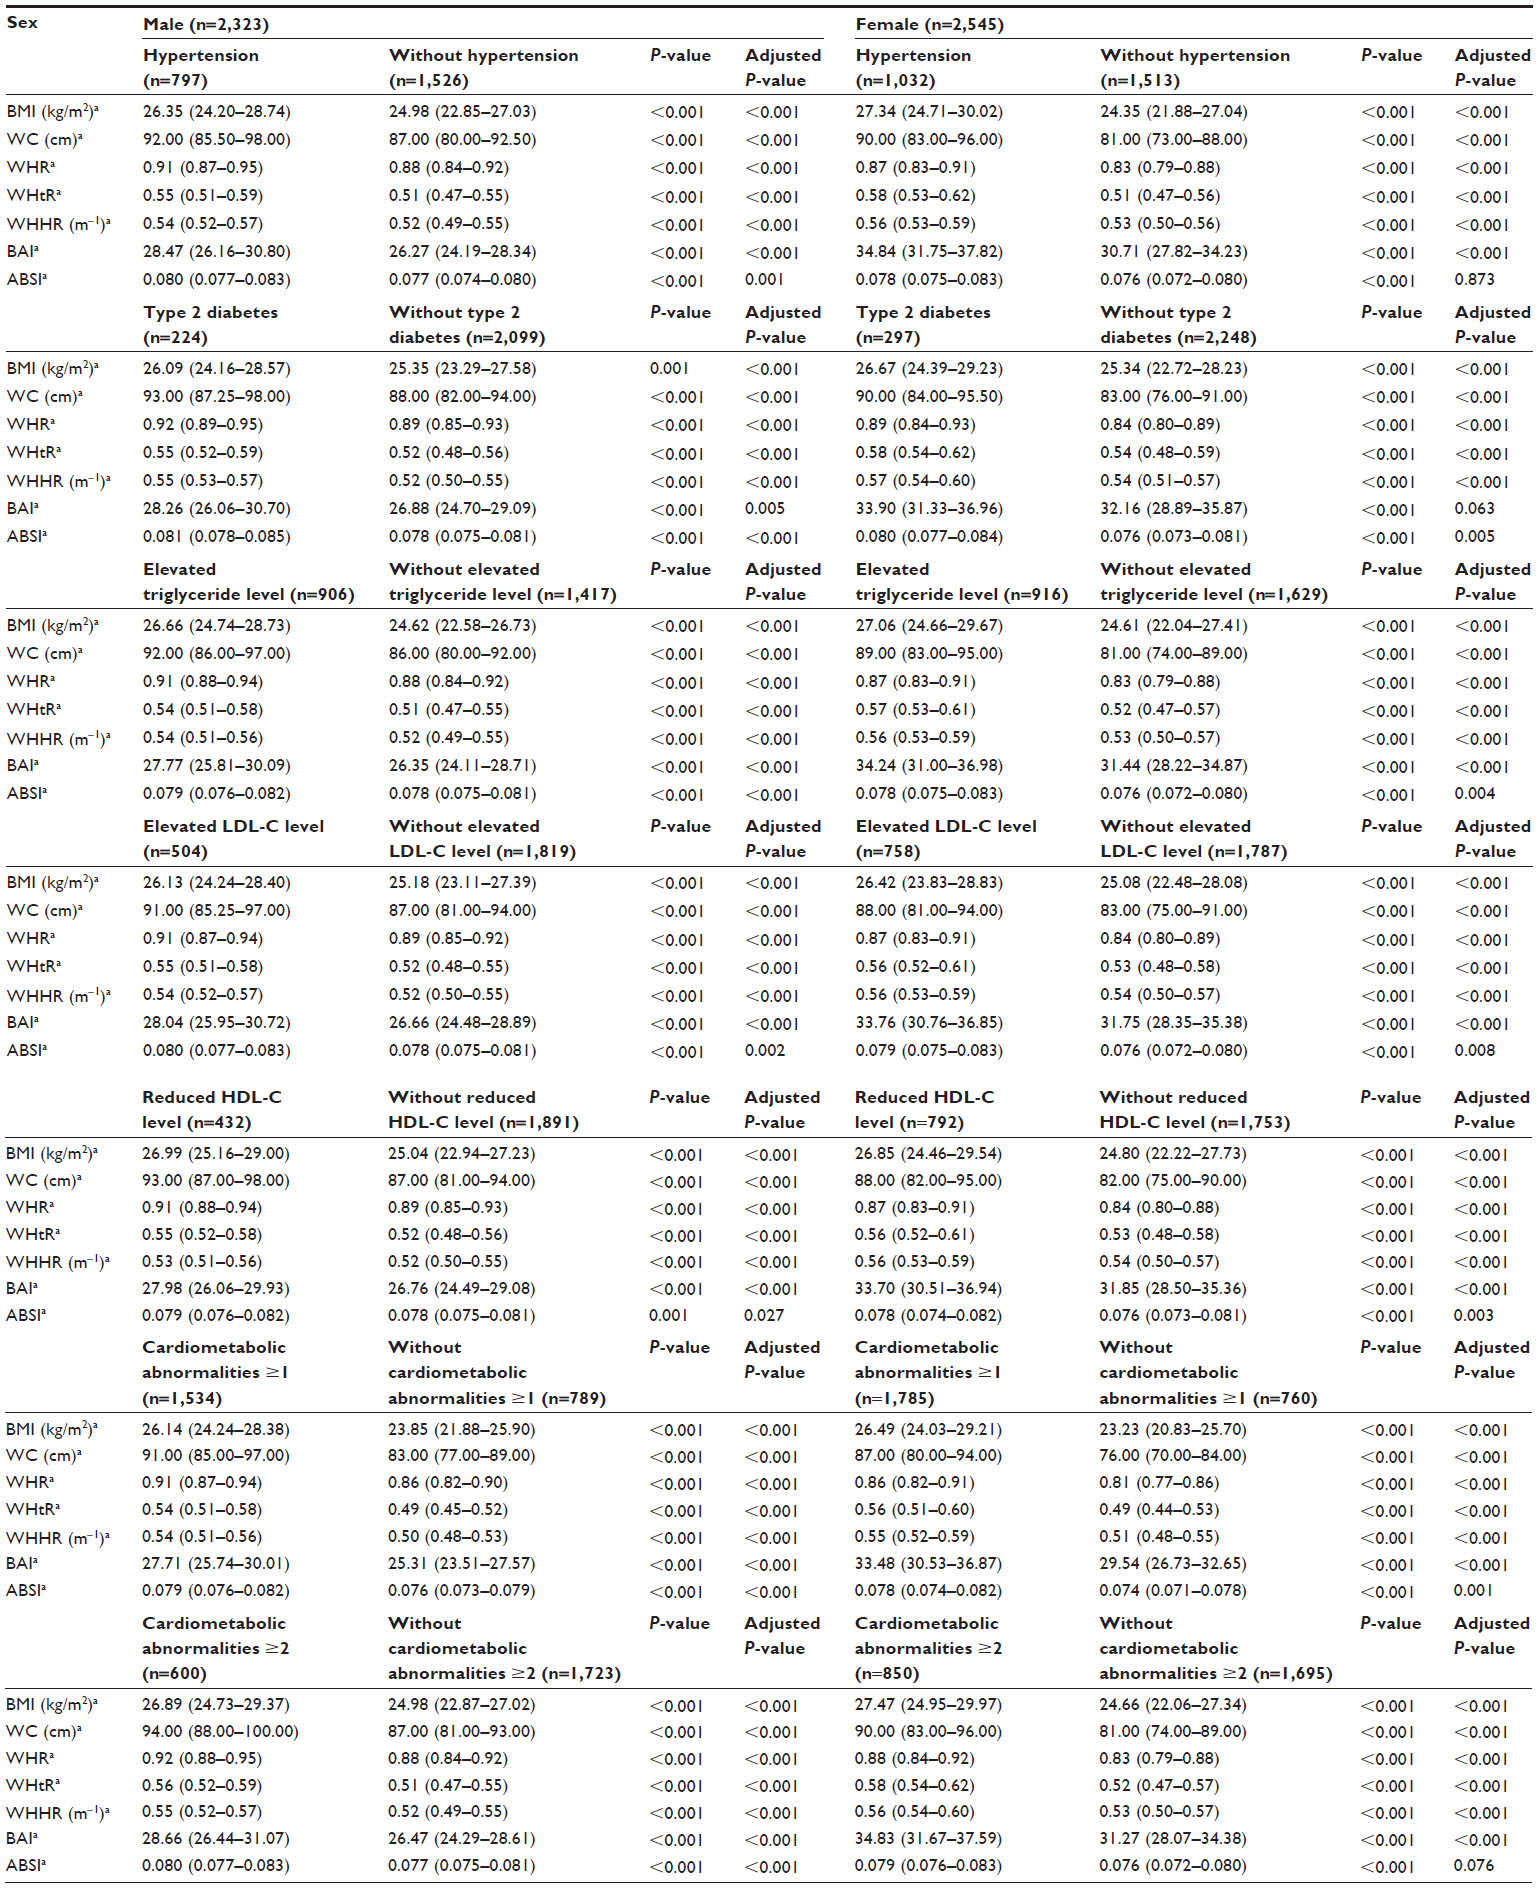 | Table 3 Association between anthropometric indices and cardiometabolic abnormalities |
Table 4 displays the AUC and cut-off values of all anthropometric indices for identifying different cardiometabolic abnormalities. Among all anthropometric indices, WHtR had the highest AUC values in both sexes for identifying the risk of hypertension and elevated LDL-C level. The cut-off value of WHtR for hypertension was 0.53 for both sexes, and the cut-off values for elevated LDL-C level were 0.53 for men and 0.52 for women. Additionally, the index with the highest AUC values for both sexes to assess the risk of elevated triglyceride level and reduced HDL-C level was WC; for men, the cut-off values were 87.50 and 89.95 cm, respectively, and for women, the cut-off values were 85.25 and 82.75 cm, respectively. With respect to type 2 diabetes, the AUC value of ABSI was the highest among all anthropometric indices for men (cut-off value: 0.079), while that of the WHR was the highest for women (cut-off value: 0.86). The WHtR best identified the participants with ≥1 cardiometabolic abnormalities (cut-off values: 0.51 for men and 0.53 for women), and ≥2 cardiometabolic abnormalities (cut-off value: 0.54 for both sexes) in all anthropometric indices.
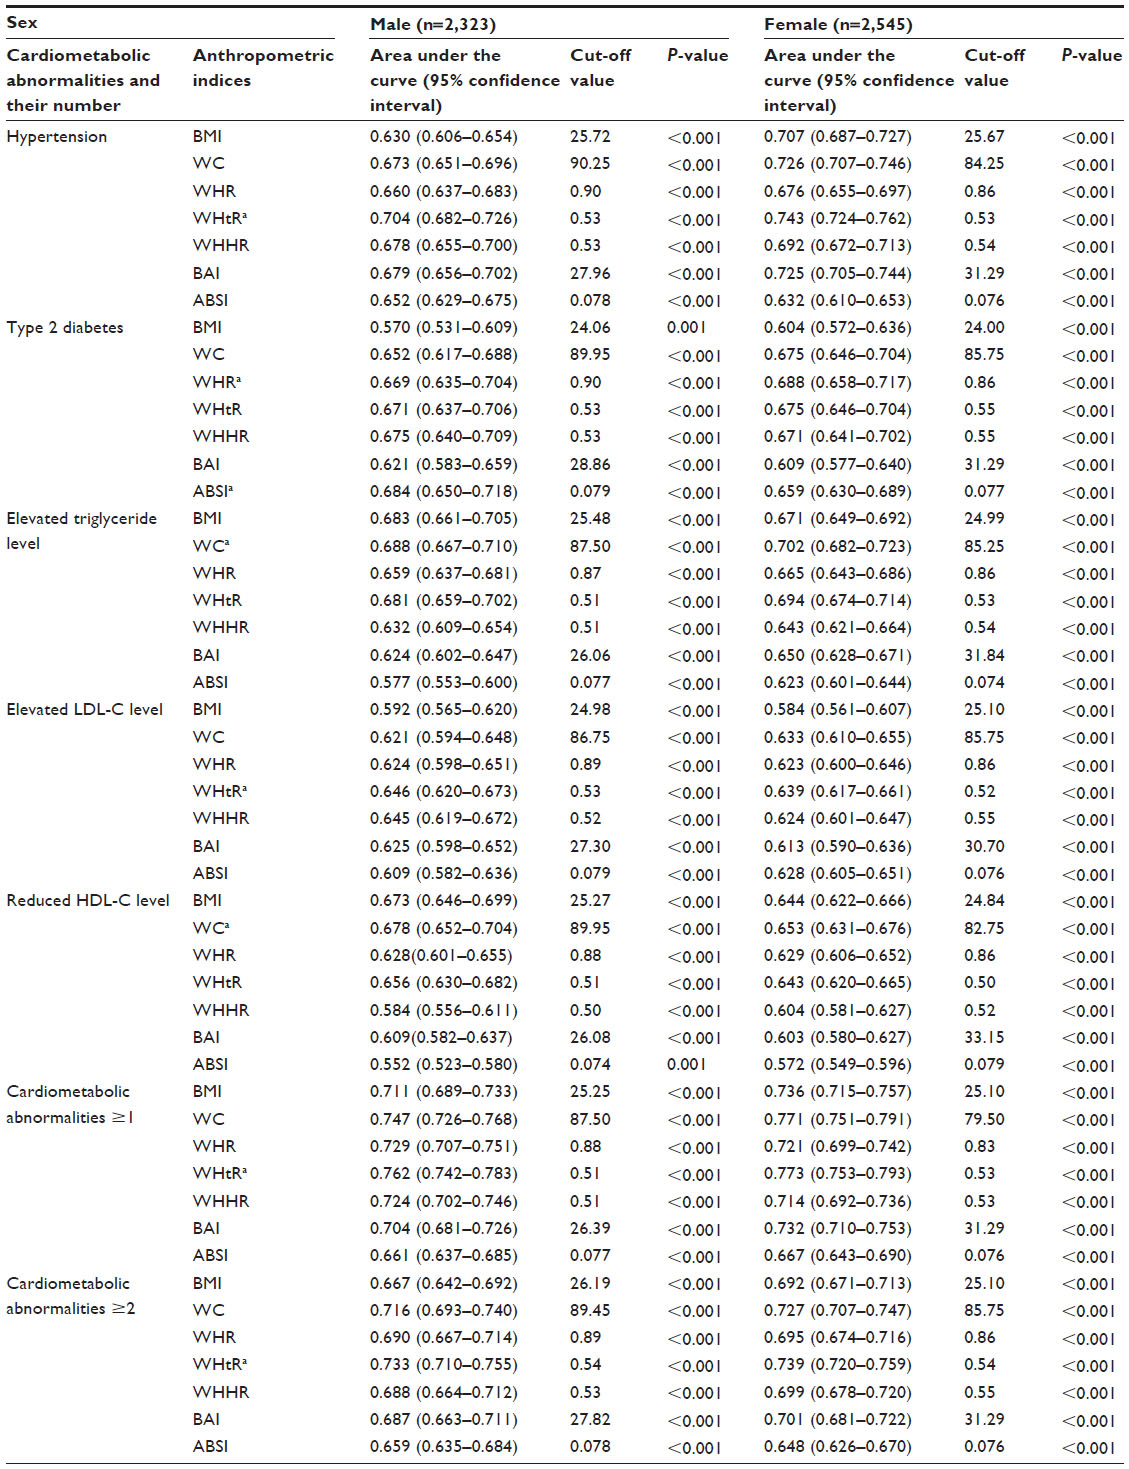 | Table 4 Area under the curve and cut-off values of anthropometric indices for identifying cardiometabolic abnormalities |
Discussion
Alarming increase in adiposity has been identified in many developed and developing countries.1–3 The current study demonstrates a serious public health problem in the People’s Republic of China; specifically, approximately two-thirds of adults are overweight based on the BMI standard. The prevalence of overall obesity is 22.2% in men and 28.1% in women, and that of abdominal obesity is 65.99% for men and 65.97% for women. As a country undergoing economic transition, the People’s Republic of China has its own characteristics, such as the rapid economic growth and huge rural–urban disparity, leading to the corresponding disparities in work and lifestyle. Above all of these disparities may have a significant responsibility for such a high prevalence of obesity and overweight in the People’s Republic of China.
The results from the current study illustrate that the residents of rural areas have moderately or significantly higher anthropometric indices than residents of urban areas in both sexes, except that there is no significant difference in BMI between rural and urban men. The relationship of smoking and alcohol consumption with anthropometric indices remains uncertain, especially in a Chinese community-dwelling population. Smoking exerts different effects on anthropometric indices depending on the study population. Some studies have shown that smokers exhibit higher body weight than nonsmokers, whereas other studies have reported the opposite result. Smoking not only increases energy expenditure and suppresses appetite, but also is a risk factor for chronic diseases, which may lead to weight loss;24 however, central weight gain as an effect of smoking may be more common and often associated with other adverse behaviors, such as overeating, irregular eating time, and lack of exercise.25 A population-based study involving 21,828 British men and women showed that smokers had a lower mean BMI compared with nonsmokers, but had a higher WHR.26 In the current study, the tendency that smoking adds weight is observed for all anthropometric indices reflecting central adiposity, and there is no distinction in BMI and BAI, which are representative of general obesity, confirming that cigarette smoking appears to result in a metabolically-adverse fat distribution pattern rather than a simple increase or loss of weight.26 It is widely believed that alcohol energy adds to total energy intake. Meanwhile, alcohol induces increased food intake and prolonged meal duration;27 however, an inverse correlation between anthropometric indices and alcohol consumption has been shown in another study.28 The explanation for this paradoxical phenomenon involving alcohol is that the energy from alcohol has a low biological value.29 In the current study, drinking has no influence on the anthropometric indices in both sexes. The result may be the overall expression of the diverse influence of drinking on anthropometric indices.
The roles of overweight and obesity, especially abdominal adiposity, in the development of cardiometabolic abnormalities have drawn considerable attention.6,7 In the People’s Republic of China, obese adults are often at increased risk of cardiovascular disorders, the leading cause of death, especially in rural areas.8 Various methods measuring overall and central adiposity have been developed to assess adiposity, and more studies have been designed to systematically and rigorously evaluate their accuracy in identifying cardiometabolic abnormalities. Some investigators have reported that WC is more sensitive and indicative of cardiometabolic abnormalities than BMI,11 or that WC and BMI are both suitable measures to identify adults with cardiometabolic abnormalities.30 Nevertheless, data from other studies have suggested that WHR and WHtR are superior in identifying cardiometabolic abnormalities,12 while other investigators have shown that when each of the anthropometric measures is used, WHHR emerges as the best identifier of cardiometabolic abnormalities.13 Recently, one study has demonstrated that the BAI is a better indicator of body mass,14 whereas another study has developed the ABSI that successfully expresses the excess risk from obesity in a convenient form.15 However, it has yet to be clarified if the new indices of body adiposity, such as the BAI and ABSI, are more useful identifiers of cardiometabolic abnormalities than other indices. There has been considerable heterogeneity in the results from studies that have analyzed the association between cardiometabolic abnormalities and anthropometric indices, and no consensus as to which anthropometric measure best identifies cardiometabolic abnormalities.
Asians are predisposed to visceral obesity, with higher amounts of body fat corresponding to lower BMI levels than Westerners, and their health risks associated with obesity occur at lower BMI levels, suggesting that the heterogeneity may be attributable to difference in the ethnicity distributions of participants.16,17 For Chinese adults, the current study indicates that the anthropometric indices have unequal power in the risk assessment of different abnormalities. In other words, these abnormalities may have the best identifying anthropometric indices of their own. We observe that the WHtR is superior to other anthropometric indices in risk assessment for hypertension and elevated LDL-C level in both sexes. The WC has a better performance than other anthropometric indices in its association with elevated triglyceride level and reduced HDL-C level. The anthropometric indices better identifying type 2 diabetes are ABSI in males and WHR in females. Compared with other anthropometric indices, the WHtR has stronger ability for identifying participants with greater than one or two cardiometabolic abnormalities, illustrating that WHtR has the ability to reflect the compound risk of different cardiometabolic abnormalities. In addition, the cut-off points of anthropometric indices for identifying cardiometabolic abnormalities are derived from studies in the US or European countries, and thus may not be applicable to other ethnic groups. To solve the problem, the cut-off values of anthropometric indices for Chinese are obtained in the current study as well. To apply the best anthropometric indices combined with the indigenous cut-off values may provide the greatest convenience for preventing cardiometabolic abnormalities. Moreover, it may be worth noting the importance of collecting longitudinal data so we can relate changes in anthropometric indices over time with changes in cardiometabolic abnormalities over time.
Conclusion
The current study demonstrates that being overweight is very common for both sexes in the People’s Republic of China, as are general and central obesity, and the residents of rural areas, manual workers, and smokers have significantly higher anthropometric indices, warning us that overweight and obesity are serious threats to the public health and social security of the People’s Republic of China. Meanwhile, WHtR is superior at identifying individuals with hypertension and elevated LDL-C level, WC has a greater ability of identifying elevated triglyceride level and reduced HDL-C level, and the anthropometric indices that are considered to be more indicative of type 2 diabetes are ABSI in males and WHR in females, verifying that the identifying power of each anthropometric index varies for different cardiometabolic abnormalities. More importantly, the ability of the WHtR to identify the participants with greater than one or two cardiometabolic abnormalities is superior to other anthropometric indices, showing that WHtR has the ability to reflect the compound risk of different cardiometabolic abnormalities and the greatest potential to be widely applied in clinical practice.
Acknowledgments
This study was supported by grants from the National Key Basic Research Project (2012CB517503 and 2013CB530804), the Health Special Scientific Research Subject of Chinese People’s Liberation Army (12BLZ34), and the Clinical Scientific Research Project of Chinese People’s Liberation Army General Hospital (2012FC-TSYS1021).
Disclosure
The authors report no conflicts of interest in this work.
References
Gortmaker SL, Swinburn BA, Levy D, et al. Changing the future of obesity: science, policy, and action. Lancet. 2011;378(9793):838–847. | |
Abelson P, Kennedy D. The obesity epidemic. Science. 2004; 304(5676):1413. | |
Haslam DW, James WP. Obesity. Lancet. 2005;366(9492):1197–1209. | |
Kjøllesdal MR, Holmboe-Ottesen G, Mosdøl A, Wandel M. The relative importance of socioeconomic indicators in explaining differences in BMI and waist: hip ratio, and the mediating effect of work control, dietary patterns and physical activity. Br J Nutr. 2010;104(8):1230–1240. | |
Panagiotakos DB, Pitsavos C, Chrysohoou C, et al. Epidemiology of overweight and obesity in a Greek adult population: the ATTICA Study. Obes Res. 2004;12(12):1914–1920. | |
Eckel RH, Alberti KG, Grundy SM, Zimmet PZ. The metabolic syndrome. Lancet. 2010;375(9710):181–183. | |
Fox CS, Massaro JM, Hoffmann U, et al. Abdominal visceral and subcutaneous adipose tissue compartments: association with metabolic risk factors in the Framingham Heart Study. Circulation. 2007;116(1):39–48. | |
Ministry of Health of the People’s Republic of China. China Health Statistical Yearbook 2010. Beijing: Peking Union Medical College Press; 2010. Chinese. | |
Kopelman PG. Obesity as a medical problem. Nature. 2000;404(6778):635–643. | |
Hu D, Xie J, Fu P, et al. Central rather than overall obesity is related to diabetes in the Chinese population: the InterASIA study. Obesity (Silver Spring). 2007;15(11):2809–2816. | |
Zhu S, Heymsfield SB, Toyoshima H, Wang Z, Pietrobelli A, Heshka S. Race-ethnicity-specific waist circumference cutoffs for identifying cardiovascular disease risk factors. Am J Clin Nutr. 2005;81(2):409–415. | |
Cheng CH, Ho CC, Yang CF, Huang YC, Lai CH, Liaw YP. Waist-to-hip is a better anthropometric index than body mass index for predicting the risk of type 2 diabetes in Taiwanese population. Nutr Res. 2010;30(9):585–593. | |
Aekplakorn W, Pakpeankitwatana V, Lee CM, et al. Abdominal obesity and coronary heart disease in Thai men. Obesity (Silver Spring). 2007;15(4):1036–1042. | |
Bergman RN, Stefanovski D, Buchanan TA, et al. A better index of body adiposity. Obesity (Silver Spring). 2011;19(5):1083–1089. | |
Krakauer NY, Krakauer JC. A new body shape index predicts mortality hazard independently of body mass index. PLoS One. 2012;7(7): e39504. | |
Kagawa M, Kerr D, Uchida H, Binns CW. Differences in the relationship between BMI and percentage body fat between Japanese and Australian-Caucasian young men. Br J Nutr. 2006;95(5):1002–1007. | |
Deurenberg-Yap M, Schmidt G, van Staveren WA, Deurenberg P. The paradox of low body mass index and high body fat percentage among Chinese, Malays and Indians in Singapore. Int J Obes Relat Metab Disord. 2000;24(8):1011–1017. | |
Yang SH, Dou KF, Song WJ. Prevalence of diabetes among men and women in China. N Engl J Med. 2010;362(25):2425–2426. | |
Perloff D, Grim C, Flack J, et al. Human blood pressure determination by sphygmomanometry. Circulation. 1993;88(5 Pt 1):2460–2470. | |
Chen C, Lu FC; Department of Disease Control Ministry of Health, PR China. The guidelines for prevention and control of overweight and obesity in Chinese adults. Biomed Environ Sci. 2004;17(Suppl):1–36. | |
Chobanian AV, Bakris GL, Black HR, et al; Joint National Committee on Prevention, Detection, Evaluation and Treatment of High Blood Pressure; National Heart, Lung, and Blood Institute; National High Blood Pressure Education Program Coordinating Committee. Seventh report of the Joint National Committee on Prevention, Detection, Evaluation, and Treatment of High Blood Pressure. Hypertension. 2003;42(6):1206–1252. | |
Genuth S, Alberti KG, Bennett P, et al; Expert Committee on the Diagnosis and Classification of Diabetes Mellitus. Follow-up report on the diagnosis of diabetes mellitus. Diabetes Care. 2003;26(11):3160–3167. | |
Joint Committee for Developing Chinese guidelines on Prevention and Treatment of Dyslipidemia in Adults. [Chinese guidelines on prevention and treatment of dyslipidemia in adults]. Zhonghua Xin Xue Guan Bing Za Zhi. 2007;35(5):390–419. Chinese. | |
Chiolero A, Jacot-Sadowski I, Faeh D, Paccaud F, Cornuz J. Association of cigarettes smoked daily with obesity in a general adult population. Obesity (Silver Spring). 2007;15(5):1311–1318. | |
Laaksonen M, Prättälä R, Karisto A. Patterns of unhealthy behaviour in Finland. Eur J Public Health. 2001;11(3):294–300. | |
Canoy D, Wareham N, Luben R, et al. Cigarette smoking and fat distribution in 21,828 British men and women: a population-based study. Obes Res. 2005;13(8):1466–1475. | |
Sonko BJ, Prentice AM, Murgatroyd PR, Goldberg GR, van de Ven ML, Coward WA. Effect of alcohol on postmeal fat storage. Am J Clin Nutr. 1994;59(3):619–625. | |
Leite ML, Nicolosi A. Lifestyle correlates of anthropometric estimates of body adiposity in an Italian middle-aged and elderly population: a covariance analysis. Int J Obes (Lond). 2006;30(6):926–934. | |
Lands WE, Zakhari S. The case of missing calories. Am J Clin Nutr. 1991;54(1):47–48. | |
Vazquez G, Duval S, Jacobs DR, Silventoinen K. Comparison of body mass index, waist circumference, and waist/hip ratio in predicting incident diabetes: a meta-analysis. Epidemiol Rev. 2007;29:115–128. |
 © 2014 The Author(s). This work is published and licensed by Dove Medical Press Limited. The full terms of this license are available at https://www.dovepress.com/terms.php and incorporate the Creative Commons Attribution - Non Commercial (unported, v3.0) License.
By accessing the work you hereby accept the Terms. Non-commercial uses of the work are permitted without any further permission from Dove Medical Press Limited, provided the work is properly attributed. For permission for commercial use of this work, please see paragraphs 4.2 and 5 of our Terms.
© 2014 The Author(s). This work is published and licensed by Dove Medical Press Limited. The full terms of this license are available at https://www.dovepress.com/terms.php and incorporate the Creative Commons Attribution - Non Commercial (unported, v3.0) License.
By accessing the work you hereby accept the Terms. Non-commercial uses of the work are permitted without any further permission from Dove Medical Press Limited, provided the work is properly attributed. For permission for commercial use of this work, please see paragraphs 4.2 and 5 of our Terms.