")
Back to Journals » International Journal of Nanomedicine » Volume 13
The 95RGD97 sequence on the Aα chain of fibrinogen is essential for binding to its erythrocyte receptor
Authors Carvalho FA, Guedes AF, Duval C , Macrae FL, Swithenbank L , Farrell DH, Ariëns RAS , Santos NC
Received 19 October 2017
Accepted for publication 12 January 2018
Published 3 April 2018 Volume 2018:13 Pages 1985—1992
DOI https://doi.org/10.2147/IJN.S154523
Checked for plagiarism Yes
Review by Single anonymous peer review
Peer reviewer comments 3
Editor who approved publication: Dr Thomas Webster
Filomena A Carvalho,1,* Ana Filipa Guedes,1,* Cedric Duval,2 Fraser L Macrae,2 Luke Swithenbank,2 David H Farrell,3 Robert AS Ariëns,2 Nuno C Santos1
1Instituto de Medicina Molecular, Faculdade de Medicina, Universidade de Lisboa, Lisbon, Portugal; 2Theme Thrombosis, Division of Cardiovascular and Diabetes Research, Leeds Institute for Genetics, Health and Therapeutics, University of Leeds, Leeds, UK; 3Department of Surgery, Oregon Health and Science University, Portland, OR, USA
*These authors contributed equally to this work
Background: Erythrocyte aggregation, a cardiovascular risk factor, is increased by high plasma fibrinogen levels. Here, the effect of different fibrinogen mutations on binding to its human erythrocyte receptor was assessed in order to identify the interaction sites.
Methods: Three fibrinogen variants were tested, specifically mutated in their putative integrin recognition sites on the Aα chain (mutants D97E, D574E and D97E/D574E) and compared with wild-type fibrinogen.
Results: Atomic force microscopy-based force spectroscopy measurements showed a significant decrease both on the fibrinogen–erythrocyte binding force and on its frequency for fibrinogen with the D97E mutation, indicating that the corresponding arginine–glycine–aspartate sequence (residues 95–97) is involved in this interaction, and supporting that the fibrinogen receptor on erythrocytes has a β3 subunit. Changes in the fibrin clot network structure obtained with the D97E mutant were observed by scanning electron microscopy.
Conclusion: These findings may lead to innovative perspectives on the development of new therapeutic approaches to overcome the risks of fibrinogen-driven erythrocyte hyperaggregation.
Keywords: atomic force microscopy, fibrinogen, fibrin clot, erythrocyte aggregation, mutant protein
Plain language summary
Currently, cardiovascular diseases are the leading cause of mortality worldwide, accounting for about one third of all deaths. Erythrocyte aggregation, which may lead to the formation of thrombus on the bloodstream, is associated with an increase in the concentration of fibrinogen. However, it is not known which binding sites on the fibrinogen protein structure are involved on the interaction with its specific receptor on the erythrocyte membrane, contributing to erythrocyte aggregation.
Here, the effect of different fibrinogen mutations on binding to its human erythrocyte receptor was assessed in order to identify the interaction sites. Using atomic force microscopy, a nanotechnology technique, we were able to use mutated fibrinogen molecules as “bait” to “fish” its receptor on the surface of red blood cells. It was shown that the force required to break the binding between fibrinogen (the “bait”) and red blood cell (the “fish”), as well as the frequency of this binding, were lower for the proteins with the D97E mutation on the Aα chain, indicating that the corresponding arginine–glycine–aspartate sequence is involved in this interaction. Changes on fibrin clot network for the D97E mutant were also observed.
This study opens new perspectives on the development of novel therapeutic approaches to overcome the risks of fibrinogen-driven erythrocyte hyperaggregation.
Introduction
Fibrinogen has a crucial role in blood clotting.1 The increase in fibrinogen plasma concentration leads to increased erythrocyte aggregation, one of the most important factors affecting blood flow and a significant cardiovascular risk factor.2 It has been reported that there is specific binding between fibrinogen and a previously unknown erythrocyte receptor.3
The fibrinogen molecule contains multiple binding motifs for different cellular receptors, acting as a molecular link between coagulation, inflammation and immunity. Particularly, fibrinogen binds to the αIIbβ3 integrin on activated platelets, leading to the platelet aggregation necessary for blood coagulation.4,5 Three potential binding sites for this integrin on the fibrinogen molecule have been identified, which are structural RGD (arginine–glycine–aspartate) sequences on each Aα chain (amino acid residues 572–574 and 95–97) and one dodecapeptide sequence on the γ chain, yielding a total of six potential binding sites per fibrinogen molecule (formed by two Aα, two Bβ and two γ chains).6
Maeda et al proposed a model for a possible location of the erythrocyte-binding regions of fibrinogen in its Aα chain and tried to explain how it may affect erythrocyte aggregation and deformability.7 The Aα 207–303 domain was found to include one of the possible erythrocyte-binding sites.7 Using atomic force microscopy (AFM)-based force spectroscopy measurements, we demonstrated the existence of a single-molecule interaction between fibrinogen and a receptor on the erythrocyte membrane, with a lower but comparable affinity relative to platelet binding.8 Fibrinogen binding to this receptor is inhibited by calcium depletion and by eptifibatide (an inhibitor considered to be specific for the receptor of fibrinogen on platelets, the glycoprotein αIIbβ3), but not as strongly as the platelet receptor. The results from a Glanzmann thrombasthenia (a rare hereditary bleeding disease caused by αIIbβ3 deficiency) patient showed an impaired fibrinogen–erythrocyte binding. Correlation with genetic sequencing data demonstrated that one of the units of the fibrinogen receptor on erythrocytes is a product of the expression of the β3 gene.8,9 To further assess the specificity of the fibrinogen–erythrocyte binding, as well as to complete its identification, we recently measured the inhibition of the fibrinogen–erythrocyte interaction using specific antibodies against integrins.10 We also demonstrated that younger erythrocytes bind more fibrinogen than the older ones, being therefore the main cells responsible for the cardiovascular risk associated with an increase in the fibrinogen content in blood.11 More recently, we showed that the interaction between fibrinogen and erythrocytes is modified in chronic heart failure (CHF) patients. The average force necessary to break the bond between fibrinogen and erythrocytes from CHF patients is higher than for erythrocytes from the control group.10 Also using AFM, we showed that increasing fibrinogen levels lead to an increase in erythrocyte–erythrocyte adhesion in essential arterial hypertension patients.12 Thus, AFM-based force spectroscopy is an approach with a high potential for applicability on biomedical research, inclusively on the study of cardiovascular diseases.10–14
Here, three stable fibrinogen variants were obtained according to previously established procedures,4,15 specifically altered in the described integrin binding sites on the Aα chain (D97E, D574E and the D97E/D574E double mutant). Using these variants, we conducted force spectroscopy measurements to determine the force necessary to break the bond between each fibrinogen variant (attached to the AFM tip) and erythrocytes. For the sake of comparison, identical measurements were conducted with wild-type (WT) fibrinogen. The analysis of the structure of the fibrin fibers in the blood clot was done using scanning electron microscopy (SEM). The results shed light on which integrin binding sites of the fibrinogen molecule are involved on the binding to the erythrocyte receptor. Knowledge of these aspects may lead to innovative perspectives on the development of new therapeutic drugs to overcome the risks of fibrinogen-driven erythrocyte hyperaggregation.
Methods
Fibrinogen mutants
The constructs for the fibrinogen variants were produced as previously described.4,15 We performed DNA sequence analysis, constructed the expression vectors and conducted site-directed mutagenesis according to established procedures. Briefly, baby hamster kidney cells, purchased from ATCC, were used to produce three stable fibrinogen mutants (Aα chain mutants D97E, D574E and the D97E/D574E double mutant) and the WT fibrinogen. Aα chain mutations have a single-nucleotide change, resulting in a codon for a different amino acid residue (aspartate changed to glutamate).
Erythrocyte isolation
Blood from adult healthy donors was collected into K3EDTA anticoagulant tubes with their previous written informed consent, following a protocol with the Portuguese Blood Institute (Lisbon), approved by the joint Ethics Committee of the Faculty of Medicine of the University of Lisbon and the Santa Maria Hospital. The experimental work was carried out in accordance with the Declaration of Helsinki of the World Medical Association. Erythrocytes were isolated from the blood samples according to established procedures.8,10,11 Briefly, erythrocytes were separated from the other blood components by centrifugation at 200 g for 10 min, at 10°C. Plasma and buffy-coat were removed, and the erythrocytes were washed three times with buffered saline glucose citrate (1.6 mM KH2PO4, 8.6 mM Na2HPO4, 120 mM NaCl, 13.6 mM sodium citrate, 11.1 mM glucose, pH 7.3) supplemented with 1 mM CaCl2. Erythrocytes (0.1% hematocrit) were attached to a clean poly-L-lysine-treated glass slide after 30 min of deposition, at room temperature. Nonadherent cells were removed by sequential washes with buffer. Samples were loaded into the AFM and allowed to equilibrate in buffer for 15 min before force spectroscopy measurements.
AFM tip functionalization
A previously optimized procedure was used for the covalent attachment of fibrinogen to the AFM tips (functionalization) and for blood cells deposition on a solid substrate.8,10,11 Briefly, cleaned AFM silicon nitride tips were silanized with 3-aminopropyl-triethoxysilane. Then, the probes were treated with a glutaraldehyde solution 2.5% (v/v) and finally immersed in a 0.5 mg/mL final concentration of fibrinogen (WT or mutant).
AFM-based force spectroscopy
Force spectroscopy measurements were performed on a NanoWizard II atomic force microscope (JPK Instruments, Berlin, Germany), mounted on an Axiovert 200 inverted optical microscope (Zeiss, Jena, Germany), using fibrinogen functionalized OMCL TR-400-type silicon nitride AFM tips (Olympus, Tokyo, Japan), as previously described.8 The spring constant of the tips was calibrated by the thermal fluctuation method, resulting in values of 19±7 mN/m. The applied force was adjusted to 0.8 nN before retraction. Molecular recognition was searched by intermittently pressing the cantilevers on each erythrocyte adsorbed on the glass slide. Data collection for each force–distance cycle was performed at 2 μm/s, leading to a loading rate of 4 nN/s. Force curves were analyzed using the JPK image processing software v. 4.2.61. For any given experiment, ~5,000 force–distance curves were collected, analyzed and adjusted by polynomial fit.16 Each experiment was performed at least three times, each time on different blood samples and with different functionalized tips.
SEM
SEM was used to investigate the differences on structure of clots formed from WT and D97E recombinant fibrinogen, especially in the presence of erythrocytes.
WT or D97E recombinant fibrinogen (0.5 mg/mL final concentration) and CaCl2 (final concentration 10 mM) were diluted in TBS (50 mM Tris–HCl, 100 mM NaCl, pH 7.5) and premixed. Human thrombin (Calbiochem, Nottingham, UK; final concentration 1 U/mL) was then added to initiate clotting. The mixtures were immediately transferred to Eppendorf lids, which were pierced with a syringe to assist solvent permeation. Clots were formed in a moist chamber, at room temperature, for 120 min. Clots were then washed with saline solution to remove excess salt, followed by fixation in 2% (v/v) glutaraldehyde (120 min). Clots were further washed extensively with sodium cacodylate buffer and dehydrated in a series of increasing acetone concentrations (30%–100%). Clots were critical-point dried with CO2, mounted onto stubs and sputter-coated with platinum, using a Cressington 208 HR (Watford, UK). Clots were also prepared with the appropriate amount of erythrocytes for a final hematocrit of 20%. They were observed and photographed digitally on at least three different areas per clot, using a scanning electron microscope Hitachi SU8230 FESEM (Tokyo, Japan), at five different magnifications (2,500× [data not shown], 5,000×, 10,000× [data not shown], 25,000× and 50,000×). At least, duplicates of each type of clot were performed. Fiber diameters were measured from 20 random fibers of each image in high magnification (25,000×), using ImageJ software (National Institutes of Health, Bethesda, MD, USA). Each cross-section measurement was performed over a single fibrin fiber and values of fiber diameter were extracted and averaged. All cross-section analysis were performed away from the branching points, in order to avoid biased results.
Statistical analysis
Unpaired samples Student’s t-test was used for statistical analysis. Differences were considered statistically significant for p<0.05. For AFM, each experiment was performed at least three times, each time with different blood samples and with different functionalized tips. At least 15 erythrocytes were tested on each blood sample. For SEM, at least duplicates of each type of clot were performed. Average fiber diameters were measured from 20 random fibers of each image, at high magnification (25,000×).
Results and discussion
AFM-based force spectroscopy studies, conducted at the single-molecule level, yielded force vs distance curves, acquired after the binding of mutant or WT fibrinogen to the receptor on erythrocytes (Figure 1A). The repeated measurements of the adhesion events, as the one shown in Figure 1B, allowed us to build up rupture force histograms for each fibrinogen variant and cell population studied.
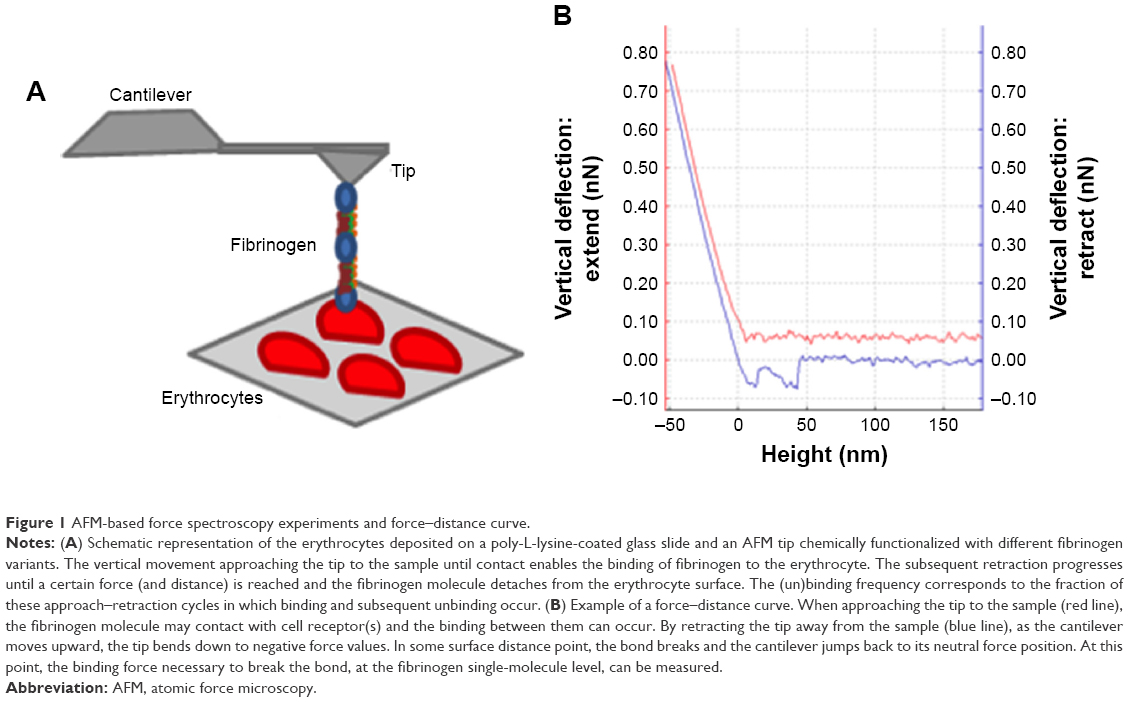 | Figure 1 AFM-based force spectroscopy experiments and force–distance curve. |
Figure 2A shows the rupture force histograms for the three different fibrinogen mutants and WT fibrinogen. It can be noticed that, in the presence of the D97E or D97E/D574E mutant, the histogram is shifted to lower binding forces, when compared with those obtained for WT fibrinogen. The opposite variation trend was obtained for the rupture force histogram of D574E, which is shifted to higher and stronger binding forces.
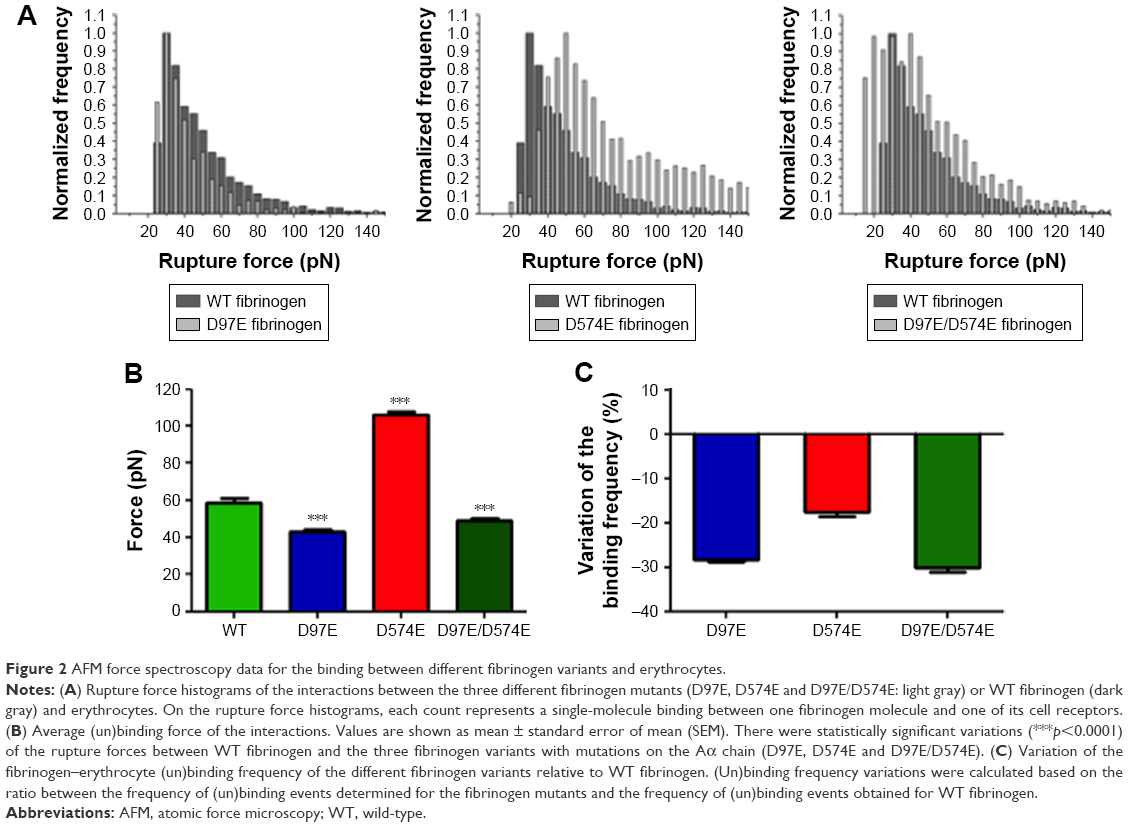 | Figure 2 AFM force spectroscopy data for the binding between different fibrinogen variants and erythrocytes. |
As it can be observed in Figure 2B, the average force necessary to break the bond between the D97E fibrinogen mutant (43.2±1.1 pN) or the D97E/D574E double mutant (49.2±0.8 pN) and erythrocytes is significantly lower than for WT fibrinogen (58.8±2.3 pN; p<0.0001 for both pairs). On the other hand, the average force necessary to break the bond between erythrocytes and the D574E mutant (105.9±1.7 pN) was significantly higher than for the WT (p<0.0001).
Decreases on the frequency (probability) of fibrinogen–erythrocyte binding and subsequent unbinding for the D97E (11.4%), D574E (13.1%) or D97E/D574E (11.1%) mutants in comparison with the WT fibrinogen (15.9%) were observed. The variation of the binding frequency of the different mutants relative to the WT is presented in Figure 2C.
Our results indicate that the RGD sequence corresponding to amino acid residues 95–97 of the fibrinogen Aα chain is involved in the binding to the erythrocyte membrane receptor. It has previously been reported that this RGD sequence is also involved in the binding to the β3 subunit of the αVβ3 receptor in endothelial cells.17 These results further support our recent findings regarding the fibrinogen receptor on erythrocytes.8,10
The force necessary to break the bond between D574E fibrinogen and the erythrocyte membrane receptor was significantly higher than for WT fibrinogen, while the frequency of (un)binding events for this mutant was lower. These apparently opposite effects might be explained by the location of the specific binding site. As it is located close to the C-terminus of the α chain, the domain may eventually change conformation, leading to a stabilization of the complex formed upon binding to the erythrocyte receptor.
It is worth to mention that during the conversion of fibrinogen to fibrin, thrombin cleaves fibrinogen Aα chain at Arg-16 and the Bβ chain at Arg-14, releasing the fibrinopeptides A and B, respectively, and forming the so-called fibrin monomers.18,19 In the fibrinogen structure, the thrombin cleavage regions are distant from the mutated regions of fibrinogen variants produced here. Therefore, these mutations on the fibrinogen molecule do not interfere with the thrombin-induced conversion of fibrinogen to fibrin.
The existence of a specific binding mechanism in fibrinogen-induced erythrocyte hyperaggregation suggests the possibility of developing new treatments to decrease erythrocyte aggregation, therefore potentially decreasing cardiovascular risk. Fibrinogen is considered an independent risk factor on screening programs aimed at identifying individuals at high risk for cardiovascular diseases.20 Our results show that, in addition to the assessment of the plasma fibrinogen concentration itself, it may also be important to identify mutations in the fibrinogen molecules that may change the binding to erythrocytes as a risk assessment strategy.
Moreover, in order to see if this fibrinogen variant induces changes on the structure of the fibrin blood clot, SEM analysis was also performed. From the micrographs obtained for the D97E and WT fibrin clots, we observed that there were no differences in fibrin clot structure (Figure 3). Clots were also evaluated in the presence of 20% of erythrocytes (Figure 4). The clots formed with WT fibrin have a more homogeneous structure than those formed with the D97E mutant. The D97E fibrin clots seem to have a more disorganized structure, with higher number of clusters that entrap erythrocytes. The clots appear to be more loosely packed, eventually leading to a higher risk of embolism. SEM images correlate well with the AFM data, where a decrease in both the binding force and the binding frequency were observed for this mutant, when compared with the WT fibrinogen.
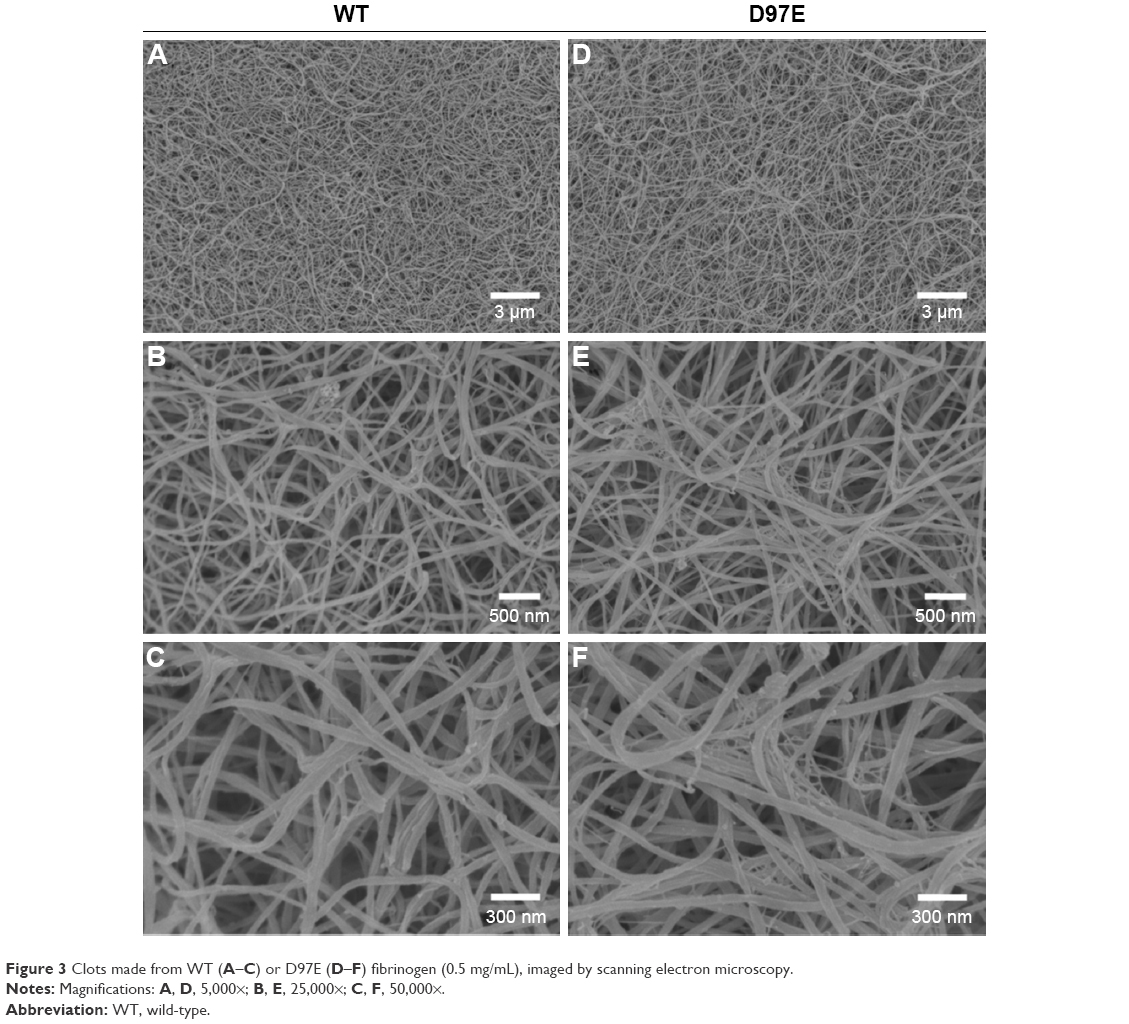 | Figure 3 Clots made from WT (A–C) or D97E (D–F) fibrinogen (0.5 mg/mL), imaged by scanning electron microscopy. |
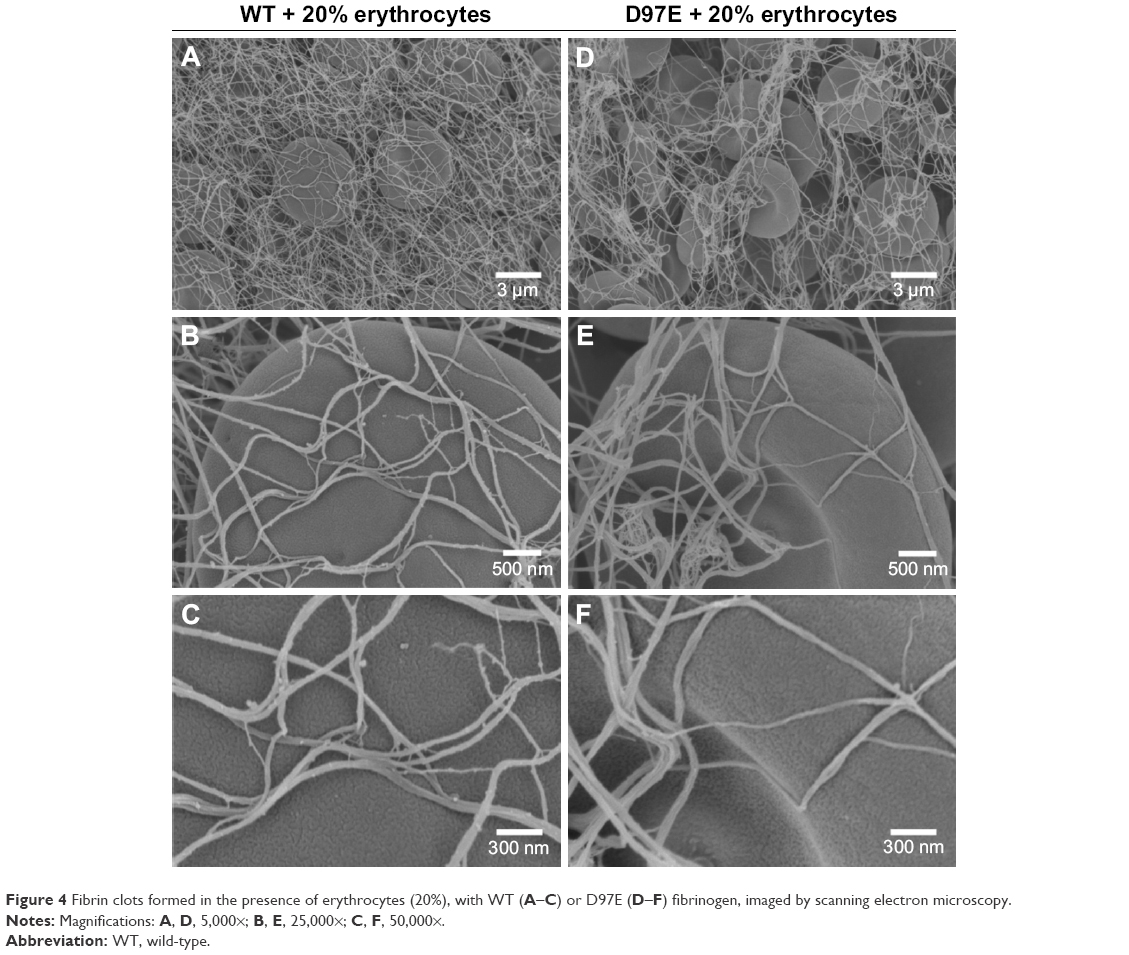 | Figure 4 Fibrin clots formed in the presence of erythrocytes (20%), with WT (A–C) or D97E (D–F) fibrinogen, imaged by scanning electron microscopy. |
After analyzing the SEM micrographs shown in Figures 3 and 4, the diameters of the fibers were calculated (Figure 5). No differences in fiber diameter between both fibrinogen variants were observed in the absence of erythrocytes, but statistically significant differences were found in the presence of these cells. The addition of 20% of erythrocytes to the D97E fibrin clot caused a decrease in fiber thickness (37.7±2.0 nm without erythrocytes vs 18.9±1.1 nm with erythrocytes; p<0.0001) and led to an extensive network rearrangement. A statistically significant variation of the fibers’ diameters was also observed between WT fibrin and D97E fibrin, both in the presence of erythrocytes (30.8±1.8 nm vs 18.9±1.1 nm, respectively; p<0.0001).
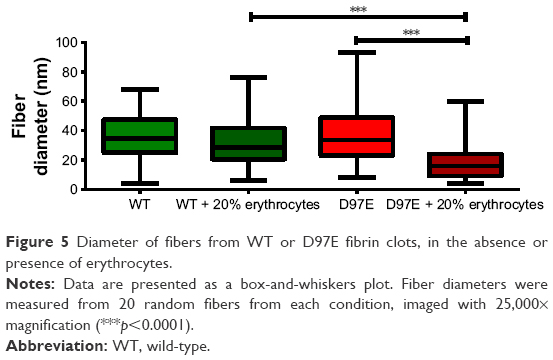 | Figure 5 Diameter of fibers from WT or D97E fibrin clots, in the absence or presence of erythrocytes. |
The difference in the D97E fibrin fibers’ diameter in the presence of erythrocytes is clear. This should be due to the mutant fibrin(ogen) interaction with erythrocytes, and not due to any difference in the polymerization of this fibrinogen variant itself, as the structure of the mutant fibrin without these cells seems the same as for the WT. Only when erythrocytes are present, the clot D97E fibrin structure becomes different.
The architecture of the clot may affect its stability, viscoelastic and mechanical properties, as well as its fibrinolytic characteristics.21,22 These characteristics may determine if a clot breaks down by fibrinolysis, or if it will lead to blood vessel occlusion or embolization.23 Moreover, it has been previously reported that tightly packed and rigid clots, with thinner fibers and low porosity, are less susceptible to the action of thrombolytic agents.24,25
This work yields valuable new information on the identification of the fibrinogen domains that interact with its erythrocyte membrane receptor, contributing to the erythrocyte hyperaggregation in the bloodstream induced by increased levels of fibrinogen. Moreover, in this study, AFM-based force spectroscopy demonstrated its potential as an important nanotechnology approach for biomedical research application, important to measure the interaction forces between fibrinogen (or other plasma proteins) and human blood cells. Future studies using animal models would be important to test the binding between the fibrinogen variants and erythrocytes in vivo, in order to develop new therapeutic approaches to treat fibrinogen-driven erythrocyte hyperaggregation.
Acknowledgments
The authors thank Teresa Freitas (IMM, FM, UL) for excellent technical assistance. This work was supported by Fundação para a Ciência e a Tecnologia – Ministério da Ciência, Tecnologia e Ensino Superior (FCT-MCTES, Portugal) grants PTDC/QUI-BIQ/119509/2010 and PTDC/BBB-BMD/6307/2014, FEDER, through POR Lisboa 2020 − Programa Operacional Regional de Lisboa, PORTUGAL 2020 and FCT-MCTES (LISBOA-01-0145-FEDER-007391), and by the Calouste Gulbenkian Foundation (Portugal). AFG also acknowledges FCT-MCTES PhD fellowship SFRH/BD/84414/2012.
Disclosure
Oregon Health and Science University (OHSU) and Dr David Farrell have a significant interest in Gamma Therapeutics, a company that may have a commercial interest in the results of this research and technology. This potential individual and institutional conflict of interest has been reviewed and managed by OHSU. The authors report no other conflicts of interest in this work.
References
Kamath S, Lip GY. Fibrinogen: biochemistry, epidemiology and determinants. QJM. 2003;96(10):711–729. | ||
Lominadze D, Dean WL, Tyagi SC, Roberts AM. Mechanisms of fibrinogen-induced microvascular dysfunction during cardiovascular disease. Acta Physiol (Oxf). 2010;198(1):1–13. | ||
Sokolova IA, Muravyov AV, Khokhlova MD, et al. An effect of glycoprotein IIb/IIIa inhibitors on the kinetics of red blood cells aggregation. Clin Hemorheol Microcirc. 2014;57(3):291–302. | ||
Farrell DH, Thiagarajan P. Binding of recombinant fibrinogen mutants to platelets. J Biol Chem. 1994;269(1):226–231. | ||
Holmback K, Danton MJ, Suh TT, Daugherty CC, Degen JL. Impaired platelet aggregation and sustained bleeding in mice lacking the fibrinogen motif bound by integrin alpha IIb beta 3. EMBO J. 1996;15(21):5760–5771. | ||
Salsmann A, Schaffner-Reckinger E, Kieffer N. RGD, the Rho’d to cell spreading. Eur J Cell Biol. 2006;85(3–4):249–254. | ||
Maeda N, Seike M, Kume S, Takaku T, Shiga T. Fibrinogen-induced erythrocyte aggregation: erythrocyte-binding site in the fibrinogen molecule. Biochim Biophys Acta. 1987;904(1):81–91. | ||
Carvalho FA, Connell S, Miltenberger-Miltenyi G, et al. Atomic force microscopy-based molecular recognition of a fibrinogen receptor on human erythrocytes. ACS Nano. 2010;4(8):4609–4620. | ||
Carvalho FA, Martins IC, Santos NC. Atomic force microscopy and force spectroscopy on the assessment of protein folding and functionality. Arch Biochem Biophys. 2013;531(1–2):116–127. | ||
Guedes AF, Carvalho FA, Malho I, Lousada, Sargento L, Santos NC. Atomic force microscopy as a tool to evaluate the risk of cardiovascular diseases in patients. Nat Nanotechnol. 2016;11(8):687–692. | ||
Carvalho FA, de Oliveira S, Freitas T, Gonçalves S, Santos NC. Variations on fibrinogen-erythrocyte interactions during cell aging. PLoS One. 2011;6(3):e18167. | ||
Guedes AF, Carvalho FA, Moreira C, Nogueira JB, Santos NC. Essential arterial hypertension patients present higher cell adhesion forces, contributing to fibrinogen-dependent cardiovascular risk. Nanoscale. 2017;9(39):14897–14906. | ||
Guedes AF, Carvalho FA, Domingues MM, Macrae FL, McPherson HR, Santos NC, Ariëns RAS. Sensing adhesion forces between erythrocytes and γ’ fibrinogen, modulating fibrin clot architecture and function. Nanomedicine. 2018;14(3):909–918. | ||
Carvalho FA, Santos NC. Atomic force microscopy-based force spectroscopy – biological and biomedical applications. IUBMB Life. 2012;64(6):465–472. | ||
Standeven KF, Carter AM, Grant PJ, et al. Functional analysis of fibrin gamma-chain cross-linking by activated factor XIII: determination of a cross-linking pattern that maximizes clot stiffness. Blood. 2007;110(3):902–907. | ||
Ratto TV, Rudd RE, Langry KC, Balhorn RL, McElfresh MW. Nonlinearly additive forces in multivalent ligand binding to a single protein revealed with force spectroscopy. Langmuir. 2006;22(4):1749–1757. | ||
Thiagarajan P, Rippon AJ, Farrell DH. Alternative adhesion sites in human fibrinogen for vascular endothelial cells. Biochemistry. 1996;35(13):4169–4175. | ||
Blomback B, Hessel B, Hogg D, Therkildsen L. A two-step fibrinogen – fibrin transition in blood coagulation. Nature. 1978;275(5680):501–505. | ||
Hurlet-Jensen A, Cummins HZ, Nossel HL, Liu CY. Fibrin polymerization and release of fibrinopeptide B by thrombin. Thromb Res. 1982;27(4):419–427. | ||
Meade TW, North WR, Chakrabarti R, et al. Haemostatic function and cardiovascular death: early results of a prospective study. Lancet. 1980;1(8177):1050–1054. | ||
Undas A, Ariens RA. Fibrin clot structure and function: a role in the pathophysiology of arterial and venous thromboembolic diseases. Arterioscler Thromb Vasc Biol. 2011;31(12):e88–e99. | ||
Weisel JW. Structure of fibrin: impact on clot stability. J Thromb Haemost. 2007;5(Suppl 1):116–124. | ||
Weisel JW. The mechanical properties of fibrin for basic scientists and clinicians. Biophys Chem. 2004;112(2–3):267–276. | ||
Bridge KI, Philippou H, Ariens R. Clot properties and cardiovascular disease. Thromb Haemost. 2014;112(5):901–908. | ||
Collet JP, Soria J, Mirshahi M, et al. Dusart syndrome: a new concept of the relationship between fibrin clot architecture and fibrin clot degradability: hypofibrinolysis related to an abnormal clot structure. Blood. 1993;82(8):2462–2469. |
 © 2018 The Author(s). This work is published and licensed by Dove Medical Press Limited. The full terms of this license are available at https://www.dovepress.com/terms.php and incorporate the Creative Commons Attribution - Non Commercial (unported, v3.0) License.
By accessing the work you hereby accept the Terms. Non-commercial uses of the work are permitted without any further permission from Dove Medical Press Limited, provided the work is properly attributed. For permission for commercial use of this work, please see paragraphs 4.2 and 5 of our Terms.
© 2018 The Author(s). This work is published and licensed by Dove Medical Press Limited. The full terms of this license are available at https://www.dovepress.com/terms.php and incorporate the Creative Commons Attribution - Non Commercial (unported, v3.0) License.
By accessing the work you hereby accept the Terms. Non-commercial uses of the work are permitted without any further permission from Dove Medical Press Limited, provided the work is properly attributed. For permission for commercial use of this work, please see paragraphs 4.2 and 5 of our Terms.