")
Back to Journals » Journal of Inflammation Research » Volume 14
Th1/Th2 Balance in Young Subjects: Relationship with Cytokine Levels and Metabolic Profile
Authors Matia-Garcia I , Vadillo E, Pelayo R, Muñoz-Valle JF, García-Chagollán M, Loaeza-Loaeza J, Vences-Velázquez A, Salgado-Goytia L , García-Arellano S, Parra-Rojas I
Received 3 October 2021
Accepted for publication 22 November 2021
Published 6 December 2021 Volume 2021:14 Pages 6587—6600
DOI https://doi.org/10.2147/JIR.S342545
Checked for plagiarism Yes
Review by Single anonymous peer review
Peer reviewer comments 4
Editor who approved publication: Professor Ning Quan
Ines Matia-Garcia,1 Eduardo Vadillo,2 Rosana Pelayo,3 José F Muñoz-Valle,4 Mariel García-Chagollán,4 Jaqueline Loaeza-Loaeza,1 Amalia Vences-Velázquez,1 Lorenzo Salgado-Goytia,1 Samuel García-Arellano,4 Isela Parra-Rojas1
1Facultad de Ciencias Químico Biológicas, Universidad Autónoma de Guerrero, Chilpancingo, Guerrero, México; 2Unidad de Investigación Médica en Enfermedades Oncológicas, Hospital de Oncología, Centro Médico Nacional, Instituto Mexicano del Seguro Social, Ciudad de México, México; 3Centro de Investigación Biomédica de Oriente, Instituto Mexicano del Seguro Social, Atlixco, Puebla, México; 4Instituto de Investigación en Ciencias Biomédicas, Centro Universitario de Ciencias de la Salud, Universidad de Guadalajara, Guadalajara, Jalisco, México
Correspondence: Isela Parra-Rojas
Laboratorio de Investigación en Obesidad y Diabetes, Facultad de Ciencias Químico Biológicas, Universidad Autónoma de Guerrero, Avenida Lázaro Cárdenas S/N, Ciudad Universitaria, Chilpancingo, Guerrero, 39090, México
Tel +52 7474719310
Email [email protected]
Purpose: We aim to identify Th1 and Th2 cell clusters in young subjects, including their clinical and metabolic characteristics and the Th1/Th2 balance.
Patients and Methods: A total of 100 participants were included. The frequencies of Th1 and Th2 cells in peripheral blood were determined by flow cytometry. Serum C-reactive protein was measured using a turbidimetric assay, and insulin levels were quantified with an enzyme-linked immunosorbent assay. Circulating cytokine levels were analyzed using a multiplex system.
Results: A cluster analysis was performed to determine the Th1/Th2 balance in a group of young people, and 3 clusters were formed with the following characteristics: 1) subjects with a higher prevalence of hyperglycemia (38%), dyslipidemia (38– 75%), and insulin resistance (50%), as well as a higher percentage of Th1 cells and Th1/Th2 ratio, including elevated IFN-ɣ levels; 2) subjects with a lower prevalence of hyperglycemia (23%) and insulin resistance (15.4%), but a higher prevalence of dyslipidemia (8– 85%) with a predominance of Th2 cells, and lower Th1/Th2 ratio; 3) subjects with a lower prevalence of hyperglycemia (6%), insulin resistance (41%), and dyslipidemia (10– 63%), as well as a balance of Th1 and Th2 cells and lower Th1/Th2 ratio, including low IFN-ɣ levels. Positive correlations between Th1 cells with IFN-γ, IL-12, and IL-1β and between Th2 cells with IFN-γ, IL-2, and IL-4 were found (p < 0.05). A significant increase in Th1 cells was observed in the presence of hyperglycemia and high LDL-C levels, as well as increased Th2 cells in the absence of abdominal obesity and high blood pressure, including low HDL-C levels. The Th1/Th2 ratio was higher in the group with high cardiometabolic risk (p = 0.03).
Conclusion: Th1/Th2 balance is related to metabolic abnormalities that may occur in young population, and thus the timely identification of different phenotypes may help predict an increased cardiometabolic risk.
Keywords: Th1 cells, Th2 cells, hyperglycemia, dyslipidemias, IFN-ɣ levels
Introduction
Chronic low-grade systemic inflammation is an essential component of metabolic diseases, such as insulin resistance (IR), type 2 diabetes mellitus (T2DM), hypertension, metabolic syndrome (MetS), nonalcoholic fatty liver disease (NAFLD), and cardiovascular disease (CVD). In this sense, obesity is considered the main link between inflammation and these comorbidities.1,2 Chronic low-grade inflammation is characterized by circulating elevated levels of acute-phase proteins and cytokines, including C-reactive protein (CRP), tumor necrosis factor-alpha (TNF-α), interleukin 1β (IL-1β), interleukin 6 (IL-6), and the increased infiltration of immune cells, namely macrophages and T lymphocytes in insulin-dependent tissue.3,4
Several epidemiological studies have shown elevated levels of inflammatory biomarkers, for instance, CRP, and IL-6 in T2DM, interleukin 12 (IL-12) in T2DM, and a mixed Th1 and Th2 serum cytokine profile in subjects with MetS.5–7 Similarly, in another study, a mixed Th1 and Th2 serum cytokine profile in T2DM, while subjects with T2DM-coronary artery disease showed an increase in Th1 cytokines and a reduction in Th2 cytokines, indicating that in addition to proinflammatory cytokines, Th2 cytokines could play an important role in inflammation, IR, T2DM, and MetS.8 These high concentrations of inflammatory biomarkers reflect the activation of both innate and adaptive immune systems in response to metabolic changes that occur in obesity and its comorbidities.9
The activation of the innate immune system is the main component of chronic low-grade inflammation and is characterized by the accumulation of proinflammatory macrophages within adipose tissue and the production of proinflammatory cytokines. Interleukin 6 (IL-6) and tumor necrosis factor alpha (TNF-α) are proinflammatory cytokines secreted by adipocytes and macrophages, which have been documented as the link to inflammation with IR and T2DM.10 However, in recent years, there has been growing interest in studying the contribution of the adaptive immune response to obesity-associated inflammation, IR, and T2DM. In 2009, three independent studies demonstrated the crucial role of T cells infiltrating white adipose tissue for the development of IR and the associated inflammatory phenotype in genetically obese mouse models.11–13 Furthermore, several studies demonstrated the accumulation of T cells in adipose tissue of obese humans and mice, which precedes the accumulation of macrophages.14–16
Th1 and Th2 cells are phenotypes of the specific immune response mediated by CD4+ T cells during the host’s defense against harmful microorganisms and in the pathogenesis of inflammatory diseases.17 Some studies have found a relationship between the peripheral blood T cells and several diseases, namely obesity, T2DM, and MetS.18,19 In obesity, a positive correlation of body mass index (BMI) with CD4+ T cells in peripheral blood has been reported in previous studies, while a decreased T lymphocyte population (CD4+ and CD8+) was found in another study.20–22 In subjects with T2DM, an increase in Th22, Th1, and Th17 subpopulations, while a decrease in Treg subpopulations, have also been reported.23,24
Some studies have reported that obesity-associated inflammation leads to increased cardiovascular risk in young adult population. In this context, it is important to analyze the mechanisms that may explain this relationship to accurately identify apparently healthy young subjects who already have immunometabolic phenotypes of increased cardiovascular risk to provide personalized therapy and thus improve their inflammatory and metabolic status.25,26 To our knowledge, no studies have determined the association of Th1 and Th2 cells clusters with the metabolic profile in a young adult population. In this research, we aimed to identify Th1 and Th2 cell clusters in young subjects and their clinical and metabolic characteristics and investigate the relationship between cytokine levels and metabolic abnormalities in the Th1/Th2 balance.
Patients and Methods
Subjects
We recruited a total of 100 apparently healthy subjects aged 18 to 30 years old from the state of Guerrero, Mexico. Inclusion criteria were subjects without renal, hepatic, autoimmune, or thyroid disease, nor infectious diseases, and without pharmacological treatment. Pregnant women or women undergoing hormonal treatment were excluded. This protocol was approved by the Research Ethics Committee of the Autonomous University of Guerrero (CB-005/2017). Informed consent was obtained from all study subjects.
Anthropometric and Clinical Measurements
Body weight was determined in light clothes and without shoes using a body composition monitor (Tanita TBF-300 GS), and height was measured to the nearest 0.1 cm using a stadiometer (Seca, Hamburg, Germany).
Both waist (WC) and hip (HC) circumferences were measured with an anthropometric tape to the nearest ±0.1 cm (Seca 201, Hamburg, Germany). The abdominal obesity was defined using the harmonized definition established in 2009 by the International Diabetes Federation (IDF) and the American Heart Association/the National Heart, Lung, and Blood Institute (AHA/NHLBI) as ≥90 cm for men and ≥80 cm for women.24 Blood pressure was measured in the sitting position with an automatic sphygmomanometer (Omron Hem-7120, Omron Healthcare, USA) on the left arm after a 10 min rest. The systolic blood pressure (SBP) and diastolic blood pressure (DBP) were calculated from two readings taken at least with a 10-min interval. High blood pressure was defined as SBP ≥130 mmHg and/or DBP ≥85 mmHg, in accordance with the harmonized definition.27
Biochemical Parameters
A venous blood sample was taken from each subject after a fast of at least 12 hours to measure total cholesterol (TC), high-density lipoprotein-cholesterol (HDL-C), low-density lipoprotein-cholesterol (LDL-C), triglycerides (TG), and glucose levels; these parameters were determined immediately by enzymatic colorimetric methods using commercially available kits (Spinreact, Barcelona, Spain). The cardiometabolic risk factors (CRFs) were defined as TC ≥200 mg/dL, TG ≥150 mg/dL, LDL-C ≥100 mg/dL, HDL-C ≤40 mg/dL in men and ≤50 mg/dL in women, and glucose ≥100 mg/dL, and based on the criteria of the National Cholesterol Education Program Expert Panel on the Detection, Evaluation, and Treatment of High Blood Cholesterol in Adults (Adult Treatment Panel III).
The serum concentrations of high-sensitivity C-reactive protein (hs-CRP) were measured by turbidimetric assays using a clinical chemistry analyzer (Mindray BS-200, Shenzhen, China); the detection limit was less than 1 mg/L. High hsCRP was determined as ≥1 mg/L according to the recommendations of the American Heart Association. Insulin levels were measured using an enzyme-linked immunosorbent assay (Human Insulin, Invitrogen by Life Technologies, CA, USA); the detection limit was 0.17 µU/mL. The homeostasis model assessment of insulin resistance (HOMA-IR) was used to determine IR with the following formula: fasting serum insulin (μU/mL) x fasting serum glucose (mg/dL)/405.28 IR was defined as a HOMA-IR at the 90th percentile or above, which was ≥ 3.2.
Flow Cytometry Analysis
The peripheral blood mononuclear cells (PBMCs) were isolated from ethylenediaminetetraacetic acid (EDTA) blood samples by Ficoll-HypaqueTM Premium (GE Healthcare) density-gradient centrifugation and were accurately counted by the trypan blue exclusion method for each subject. The cell samples from all studied subjects were individually manipulated and analyzed by multicolor flow cytometry in a FACSCanto II flow cytometer (BD Biosciences) after staining with fluorochrome-conjugated antibodies to cell surface markers of T helper cells: anti-CD3-APC (clone UCHT1) and anti-CD4-FITC (clone RPA-T4); all kits were purchased from BioLegend.
Th1/Th2 helper T cells were quantified by intracellular cytokine staining for anti-IFN-ɣ-PE (clone B27) (Th1) and anti-IL-4-PE (clone 8D4-8) (Th2) (BioLegend): PBMCs were incubated with Brefeldin-A (BFA, BioLegend) for 5 h at 37°C. After surface staining for CD3 and CD4 (to select CD3+/CD4+ T helper cells), cells were fixed and permeabilized using BD Cytofix/CytopermTM and BD Perm/WashTM (BD Biosciences, Pharmingen) according to manufacturer´s instructions. After intracellular staining for IFN-ɣ and IL-4, cells were immediately analyzed by flow cytometry, calculating the percentage of Th1 and Th2 cells of the total CD3+CD4+ population. Analysis of flow cytometry data was performed using the FlowJo version 7.6.1 software. Immune cell subsets were expressed as a percentage of the total white cell count. Figure 1 shows a representative example in which T cells were subdivided according to CD4 expression and CD3 co-expression. Representative dot plots showing Th1 (CD3+CD4+IFN-ɣ+) (1A) and Th2 (CD3+CD4+IL4+) (1B) cells.
 |
Figure 1 Representative dot plots of flow cytometry data. Figure shows a representative example in which T cells were subdivided according to CD4 expression and CD3 co-expression. Th-cells identification was performed by intracellular detection of IFN-ɣ and IL-4. The CD3+CD4+ T-helper cells were quantified as Th1 cells (CD3+CD4+IFN-ɣ+) (A) and Th2 cells (CD3+CD4+IL4+) (B). |
Quantification of Serum Cytokines Levels
Cytokine serum levels (IFN-γ, IL-2, IL-12, IL-6, IL-1β, IL-4, and IL-10) were measured in 77 samples of the total using a MAGPIX® System (Luminex, USA) with the Human Cytokine Magnetic 10-plex custom kit (Invitrogen Life Technologies, USA) according to manufacturer’s instructions.
Statistical Analysis
Data analysis was performed using STATA software (v.13.0) and GraphPad Prism (v 8.4.3). Differences in characteristics between groups were analyzed using the Fisher´s exact test for categorical variables (data presented as percentages), Student’s t-test or one-way ANOVA for parametric variables (data presented as mean ± SD), and Kruskal–Wallis test for non-parametric variables (data presented as median and 25th to 75th percentiles). Correlations between variables were expressed as Spearman correlation coefficient. P <0.05 was considered statistically significant.
In the STATA software (v.13.0), a K-means cluster analysis was carried out to identify structures within the data and divide subjects into different groups based on the percentages of Th1 and Th2 cells. Before conducting the clustering analysis, the cell percentage values were standardized (Z scores). We examined 2 to 3 solutions to evaluate which set of clusters was more significant to define cell phenotypes.
Results
Characteristics of the Study Population
Demographic and anthropometric characteristics, cardiometabolic abnormalities, and the percentage of Th1 and Th2 cells are shown in Table 1. A total of 100 participants, 46 men and 54 women with a median age 21 years, were enrolled in this study.
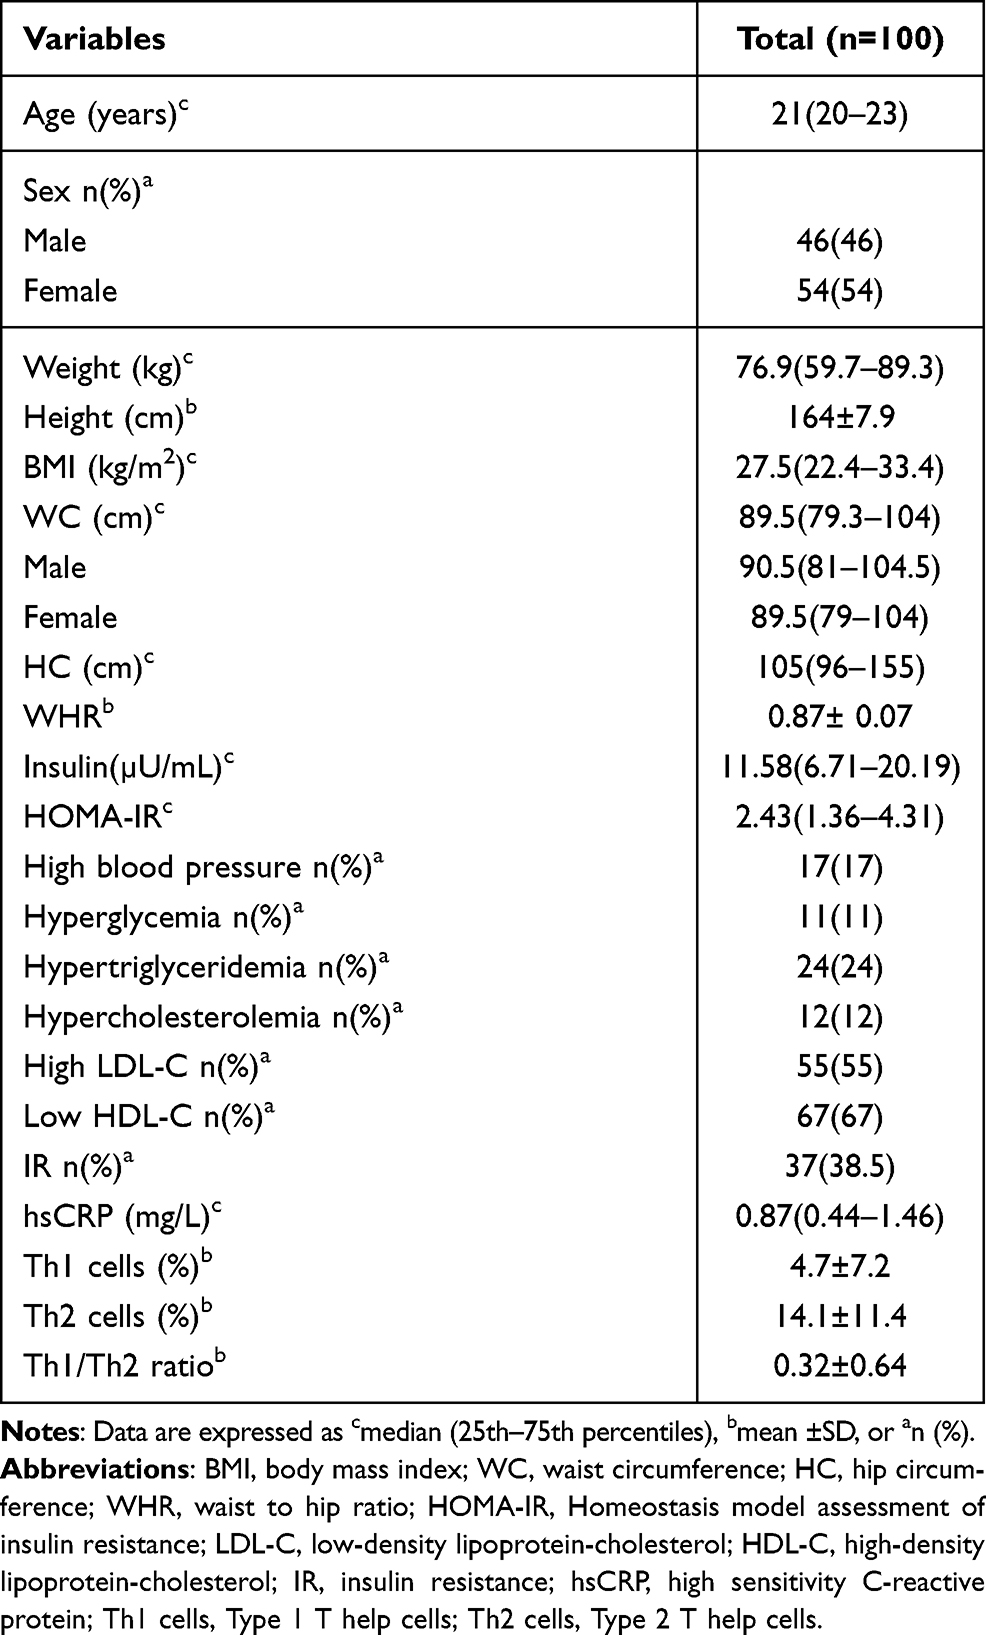 |
Table 1 Clinical Characteristics and Th1 and Th2 Cells of Participants Included in the Study |
Heterogeneity of the Th1 and Th2 Cells
A K-means cluster analysis was performed to explore possible phenotypes of Th1 and Th2 cells in the total population; with this analysis, we were able to identify 3 phenotypes of cells, which were very different from each other: cluster 1 (n=8), cluster 2 (n=13) and cluster 3 (n=79). A heat map of Th1 and Th2 cells was created using cluster analysis and heterogeneity of cells was observed among all subjects to clearly identify three groups of subjects with different cell phenotype (Figure 2A). A comparison analysis of Th1 and Th2 cells and Th1/Th2 ratio according to the three clusters was also performed and a higher percentage of Th1 cells was found in cluster 1 compared to clusters 2 and 3 (23.7±8.2, 9.9±4.9, 1.95±2.5; p<0.001, respectively). The percentage of Th2 cells was increased in cluster 2, followed by cluster 1 and 3 (34.6±7.9, 26.0±13.8, 9.5±5.8; p<0.001, respectively) (Figure 2B). Similarly, the Th1/Th2 ratio was found to be higher in cluster 1 compared to clusters 2 and 3 (1.47±1.8, 0.30±0.16, 0.21±0.29; p<0.001, respectively) (Figure 2C). An imbalance of Th1 and Th2 cells was observed in the subgroup of subjects in cluster 1 because they have a higher percentage of both Th1 and Th2 cells, whereas those in cluster 2 have an increase in Th2 cells and a decrease in Th1 cells, and those in cluster 3 have decreased Th1 and Th2 cells.
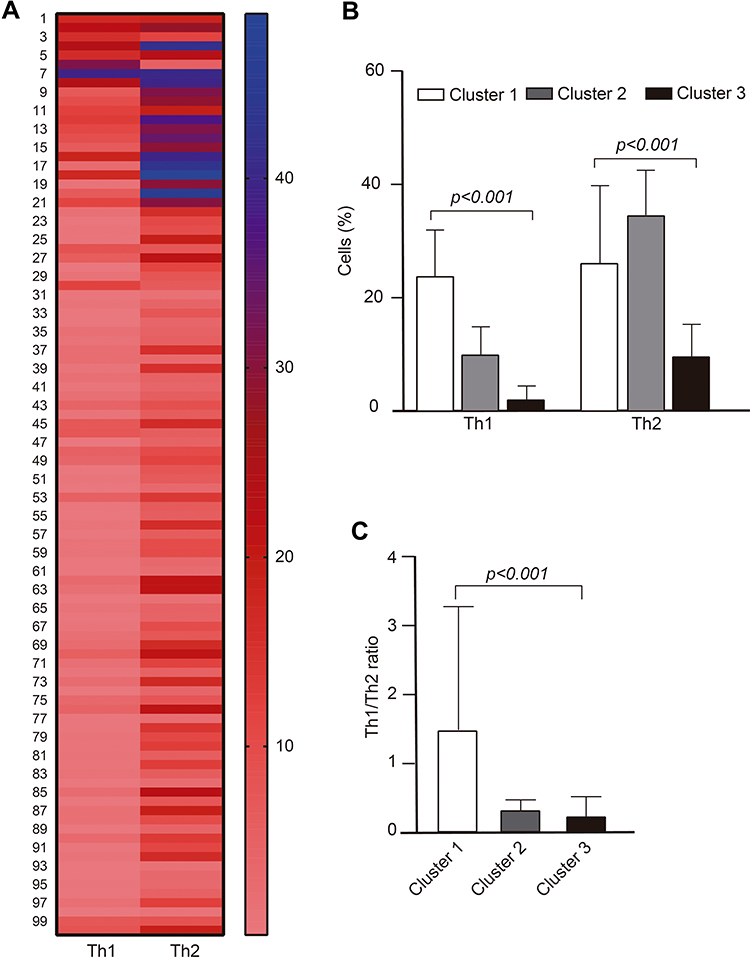 |
Figure 2 Heat map of Th1 and Th2 cell by K-means cluster analysis in the total population. (A) In the heat map, rows represent each subject, while columns display Th1 and Th2 cells, (B) cluster-wise comparison of Th1 and Th2 cells, and (C) Th1/Th2 ratio. Data are expressed as mean ± SD; p value was calculated by one-way ANOVA. |
Comparison of Clinical Characteristics and Serum Cytokine Levels Among the Three Clusters
Table 2 shows clinical characteristics, cardiometabolic alterations, and serum cytokine levels among the three clusters. Cluster 1 (n=8) had the smallest number of individuals, of which, 50% were male and 50% female and individuals presented hyperglycemia (37.5 vs 23 and 6%, p= 0.01), as well as increased serum IFN-ɣ levels (2.86 vs 2.54 and 2.21, p= 0.04), with respect to the other clusters. Cluster 3 (n=79), the largest cluster with more than 70% of all individuals in the study, only presented a significant increase in cholesterol levels (166 vs 161 and 157 mg/dL, p= 0.03) when compared to the other clusters.
 |
Table 2 Clinical Characteristics and Cytokine Levels by Cluster |
Correlation of the Th1 and Th2 Cells and Pro- and Anti-Inflammatory Cytokine Levels
In Figure 3, a heat map is presented where Th1 and Th2 cells and levels of pro- and anti-inflammatory cytokines are observed for each cluster. A heterogeneous pattern in the distribution of cytokine levels is observed and all cytokines were detected in each subject (Figure 3A). A correlation analysis between Th1 and Th2 cells and cytokines showed that Th1 cells correlated significantly with IFN-ɣ (r=0.33, p=0.003), IL-12 (r=0.25, p=0.03) and IL-1β (r=0.24, p=0.04). Similarly, Th2 cells correlated with IFN-ɣ (r=0.32, p=0.004), IL-2 (r=0.25, p=0.03), and IL-4 (r=0.25, p=0.02) (Figure 3B).
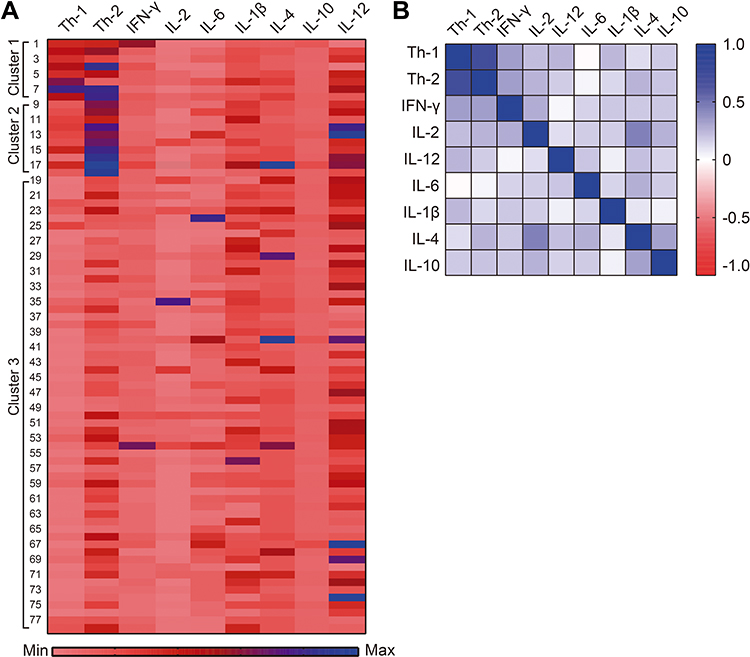 |
Figure 3 Heat map of Th1 and Th2 cells and serum cytokine levels by cluster. (A) In the heat map, rows represent individual subjects, while columns display Th1 and Th2 cells and cytokine levels, (B) correlation between Th1 and Th2 cells with pro- and anti-inflammatory cytokines in the total population. Spearman correlation coefficient was calculated. |
Th1 and Th2 Cells According to Cardiometabolic Abnormalities
Table 3 shows the number of Th1 and Th2 cells according to cardiometabolic abnormalities presented by study subjects. A significant increase in Th1 cells was observed in the presence of hyperglycemia (10.28 vs 4.04, p=0.006) and high LDL-C (6.13 vs 3.01, p=0.03). Th2 cells were increased in the group without abdominal obesity (17.40 vs 12.10, p=0.02), with normal blood pressure (15.47 vs 7.49, p=0.008), and with low HDL-C (15.90 vs 10.48, p=0.03). The Th1/Th2 ratio was higher in the group with hyperglycemia (0.84 vs 0.26, p=0.004) and with hypercholesterolemia (0.74 vs 0.27, p=0.02).
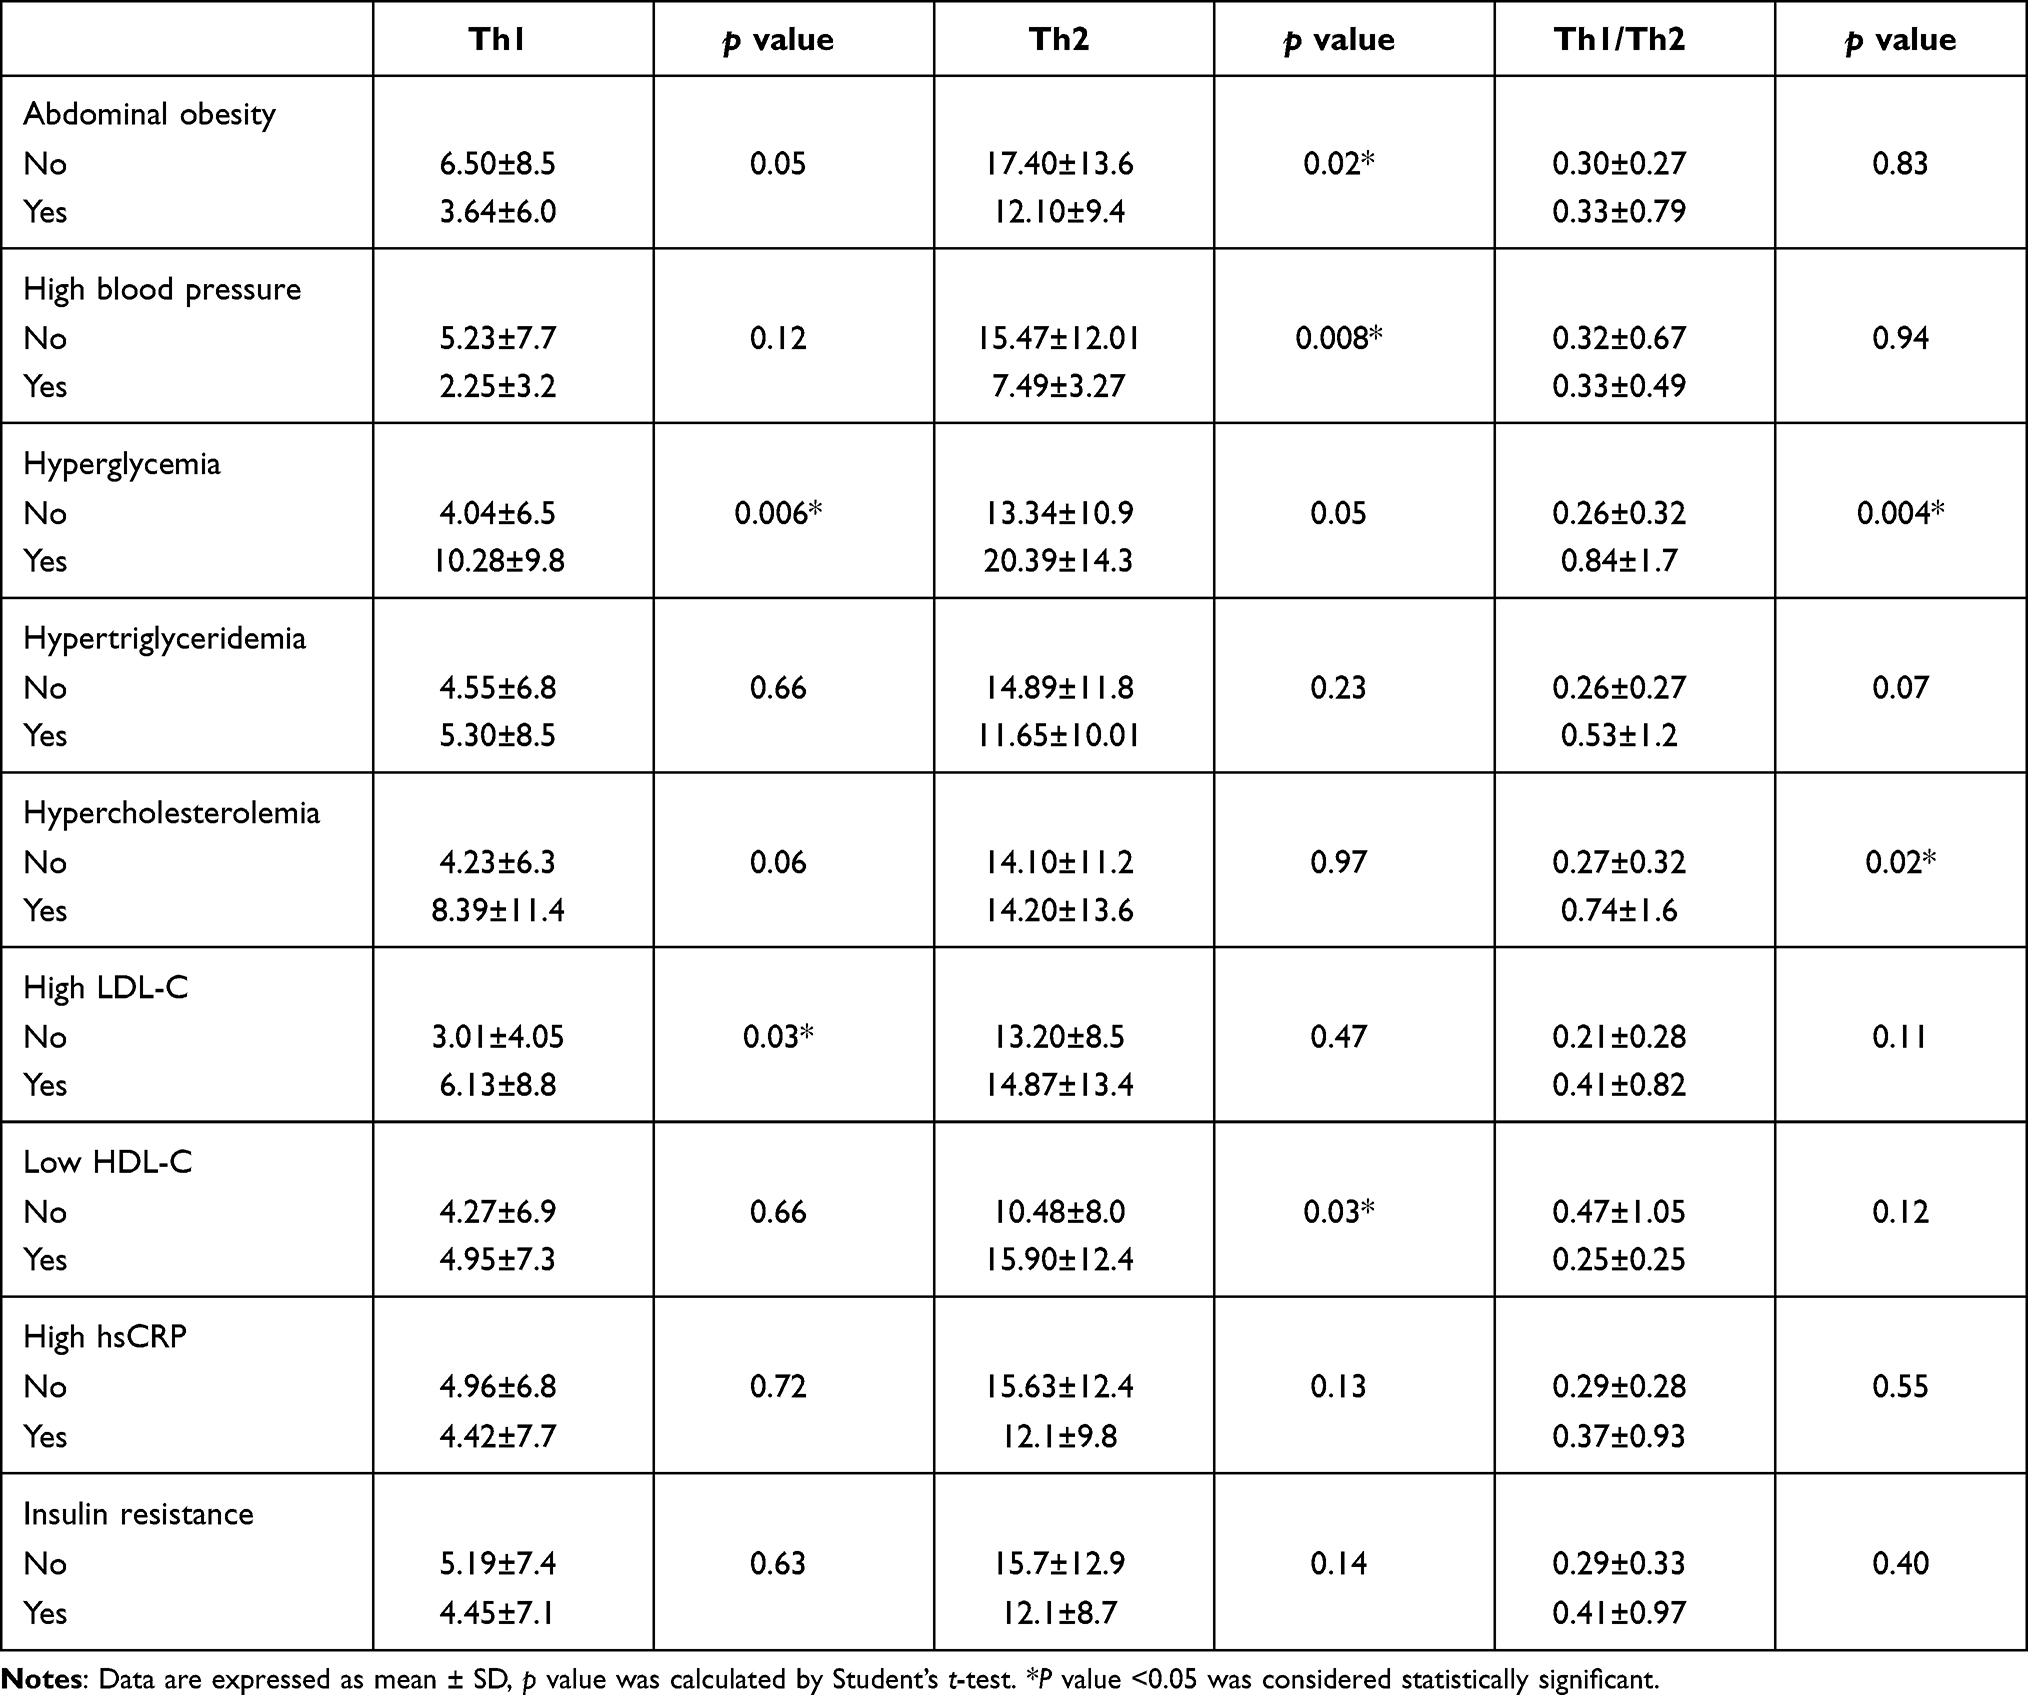 |
Table 3 Th Cells and Th1/Th2 Ratio in Subjects with Cardiometabolic Abnormalities in the Study Population |
Comparison of Th1 and Th2 Cells Between Groups with <3 and ≥3 Cardiovascular Risk Factors
Figure 4 shows the comparison of the number of Th cells between groups with <3 CRFs and with 3 or more CRFs; no significant differences were found in Th1 and Th2 cells between groups (Figure 4A), but there were significant differences in the Th1/Th2 ratio, which was higher in the group with ≥3 CRFs compared to the group with <3 CRFs (p=0.03) (Figure 4B).
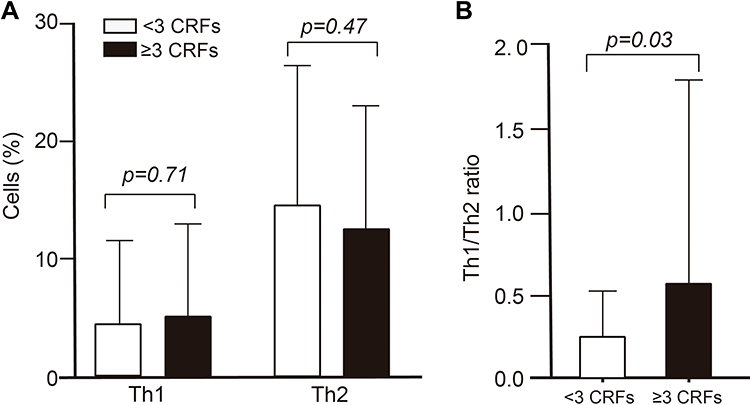 |
Figure 4 The cells according to the cardiometabolic risk factors (CRFs). Comparison of Th1 and Th2 cells (A) and Th1/Th2 ratio (B) between groups with <3 CRFs and ≥3 CRFs. Data shown as mean ± SD, p value was calculated by Student’s t-test. |
Discussion
In this study, a cluster analysis was performed to determine the Th1/Th2 balance in a group of young people and 3 clusters were identified, which were characterized according to inflammatory and metabolic markers. It appeared that each cluster was marking a transient pathophysiological stage, which could be interchanged according to the metabolic state. As observed in cluster 1, subjects showed a higher prevalence of cardiometabolic alterations: 38% had hyperglycemia, hypertriglyceridemia or hypercholesterolemia; 75% presented high LDL-C or low HDL-C, suggesting higher cardiometabolic risk in this group; besides, a low-grade systemic inflammation may be present since cluster 1 subjects have a higher number of Th1 cells and Th1/Th2 ratio, and higher levels of hsCRP and IFN-ɣ. Cluster 2 was characterized by high LDL-C (69%) or low HDL-C (85%) levels; Th1 cells decreased and Th2 cells increased, and the Th1/Th2 ratio was low, suggesting a compensatory effect of Th2 cells to balance the proinflammatory response, probably presented by cluster 1 subjects before moving to cluster 2. Finally, in the most abundant cluster (cluster 3), subjects had high LDL-C (51%) or low HDL-C (63%) levels more frequently and a lower number of Th1 and Th2 cells, as well as a lower Th1/Th2 ratio, suggesting a balance between Th1 and Th2 cells and a low concentration of proinflammatory cytokines that indicate a reduced cardiometabolic risk.
The results suggest that cluster 1 individuals present a proinflammatory state defined by a higher percentage of Th1 cells and Th1/Th2 ratio with high levels of IFN-ɣ. It should be noted that 37.5% of study subjects had abdominal obesity and/or prediabetes, 50% insulin resistance, and 25% cardiometabolic risk profile, suggesting that these cardiometabolic abnormalities may be related to T-cell homeostasis and systemic inflammation. Several studies have shown that inflammatory immune cells and their cytokines participate in the pathogenesis of T2DM, including Th1, Th17, Th22, and CD8+ T cells.24,29,30 The imbalance of circulating Th1/Th2 cytokines has been reported in MetS,7 acute coronary syndrome (ACS) with T2DM, or impaired glucose tolerance (IGT),31 and T2DM, whereas in diabetic coronary artery disease (CAD), an increase in Th1 cytokines with a suppression of Th2 cytokines was observed.8 These changes suggest that the Th1/Th2 cytokine balance plays an important role in the inflammatory state accompanying MetS and T2DM, and even in patients with acute coronary syndrome and associated comorbidities, such as T2DM or IGT where a more severe degree of inflammation may be present.
In line with our results, Pacifico et al in children with obesity reported that a change in the Th1 cytokine profile with predominance of IFN-ɣ production, a proinflammatory and proatherogenic cytokine is already present in children with obesity. Thus, the Th1 cytokine pattern can be considered an early stage contributor to inflammation with a subsequent risk of cardiovascular disease.32 In another study, elevated IFN-ɣ levels were found in overweight men with T2DM-hypertension.33 IFN-ɣ has been shown to participate in low-grade inflammation of adipose tissue induced by diet, obesity, and glucose intolerance.14 In addition to IFN-ɣ levels, elevated IL-12 levels in patients with T2DM are also associated with insulin resistance.6 These reports support the role of Th1 cytokines in adipose tissue inflammation and decreased insulin sensitivity.
However, the exact mechanism by which Th1 cytokines induce insulin resistance is not clearly known. Cytokines such as TNF-α, IL-1β, and IFN-ɣ can adversely regulate metabolism and cause IR in various cell types, including adipocytes and skeletal muscle myocytes through endocrine and paracrine effects. These cytokines act through interactions of their cell surface receptors, activating a number of intracellular signaling pathways, which alter insulin signaling and induce insulin resistance in cells. The IKK/NF-κB pathway, activated mainly by cytokines such as TNF-α and IL-1β, including saturated fatty acids and damage-associated molecular patterns, contributes to IR by serine phosphorylation of insulin receptor substrate 1(IRS-1), or insulin receptor (IR) with inhibition of insulin-induced tyrosine phosphorylation and downstream signaling.4
IFN-ɣ could exert its action by interfering with insulin signaling and glucose uptake,34 which could lead to insulin resistance, considered a pathophysiological mechanism of metabolic syndrome. In addition to the fact that increased levels of Th1 cytokines have been reported, an upregulation of Th2 cytokines (IL-4, IL-5, and IL-13) has also been observed in patients with T2DM,7,8 suggesting a bidirectional relationship between the two cytokine profiles with either a predominant Th1 or Th2 profile according to the metabolic state.
In leukocytes, insulin influences glucose uptake and metabolism, as well as the regulation of some of their immune functions.35 Our data are consistent with previous findings that showed increased Th1 cells at the systemic level in obese children32 and in morbidly obese adults, Th1 cells correlated with the degree of insulin resistance.36 In a community-based Multi-Ethnic Study of Atherosclerosis (MESA), a high proportion of memory CD4+ cells and low proportion of naive CD4+ cells in circulating blood were associated with the prevalence of T2DM.37 A recent study in adults aged 60–84 years found that the peripheral blood T-cell compartment of individuals with insulin sensitivity is characterized by a higher percentage of naive CD4+ and CD8+ T-cell phenotype and a decreased percentage of activated and differentiated memory CD4+ and CD8+ T cells compared to subjects with IR.38 In this context, quiescent T cells do not express the insulin receptor on their membrane, so in this state they are insensitive to insulin, but once activated, both T and B cells express the insulin receptor and increase glucose uptake. The activation and metabolic turnover of T cells is accompanied by the positive regulation of the insulin receptor, which allows a greater proliferation capacity, cytokine production and survival, and as a result, a correct activation of these cells.35,39 Furthermore, T lymphocytes from obese individuals with insulin resistance stimulated in vitro with supraphysiological insulin concentrations showed no increase in AKT phosphorylation or decrease in the Th1/Th2 ratio, nor was there any effect on Th cell differentiation as in lymphocytes from lean controls, since insulin under normal conditions can promote the differentiation of Th cells towards an anti-inflammatory Th2 phenotype. This indicates that lymphocytes from obese individuals have an altered response to insulin.36 Therefore, the Th1 polarization seen in obesity and T2DM may be partially caused by insulin resistance.
In cluster 2, the main metabolic alterations are high LDL-C, low HDL-C, and a low prevalence of IR (15.4%) with a decrease in the Th1/Th2 ratio and a predominance of Th2 cells. In a study performed in morbidly obese subjects compared to lean controls, an increase in CD4+ T cells in peripheral blood with predominance towards a Th2 and T reg cell phenotype was found, suggesting an adaptive shift to anti-inflammatory T cells as a way to counteract dysfunction in obesity. It should be noted that obese subjects were relatively healthy, as they did not have diabetes or elevated TNF-α and IL-6 plasma levels,40 as is commonly observed in obese individuals or those with metabolic syndrome.41 In particular, TNF-α has been reported to be associated with IR and T2DM, since TNF-α inhibits tyrosine kinase activity of the insulin receptor.42 Another study showed that Th2 cells in adipose and peripheral blood tissue of healthy obese and overweight individuals are inversely associated with systemic IR, indicating a protective effect.18 Moreover, evidence has shown that when T cells from healthy individuals undergo in vitro treatment with insulin, it has the potential to polarize T cell differentiation toward the Th2 phenotype by decreasing the Th1/Th2 ratio,43 while the transfer of Th2 cells in Rag 1(recombination activation gene 1)-null mice with diet-induced obesity reverses weight gain and IR.13 These data suggest that insulin ameliorates the inflammatory state in individuals with IR, and that Th2 cells in addition to having an anti-inflammatory effect protect against IR.
The role of other proinflammatory and anti-inflammatory T cells in the development of IR and T2DM is known, so a limitation of our study is that Th17, Th22, and Treg cells as well as their cytokines were not determined, considering an imbalance of Th1, Th17, and Treg cells with Th1 and Th17 cell dominance has been observed in patients with T2DM.24 Another metabolic disease that usually occurs in people with visceral obesity is NAFLD. In visceral fat, it has been found that macrophages release IL17 into the circulation, but when there is thickening of the carotid intima media, a greater secretion of eotaxin by smooth muscle cells induced by IL17 is detected, so this cytokine may have a relevant role in atherogenesis.44 In obese subjects with or without T2DM, Th22 cells and IL22 levels were found to be elevated compared to lean subjects, and particularly, Th22 cells were positively correlated with HOMA-IR,23 suggesting their involvement in obesity-related systemic inflammation, IR, and T2DM. As we can observe in cluster 2, the Th1/Th2 ratio is lower with a predominance of Th2 cells, suggesting that Th2 cells counteract Th1 cells seeking a balance of the inflammatory state, probably indicating a transition from cluster 1 to cluster 2 as IR decreases and the metabolic state improves; however, if metabolic alterations remain or increase, it may return to cluster 1.
Cluster 3, unlike clusters 1 and 2, is characterized by a balance between Th1 and Th2 cells, and consequently, a lower Th1/Th2 ratio, which is reflected in low concentrations of proinflammatory cytokines, such as IFN-ɣ even if metabolic abnormalities are also present in these cells, suggesting a state of lower cardiometabolic risk. This could be explained because proinflammatory cytokines contribute to the development of metabolic syndrome and T2DM. In this regard, human and animal experimental studies have shown that treatment with proinflammatory cytokines induces hypertriglyceridemia and IR,42,45 whereas in IFN-ɣ-deficient obese animals, a significant decrease in mRNA expression of inflammatory genes in adipose tissue has been reported, thus indicating the role of IFN-ɣ in adipose tissue inflammation and IR.14 This cluster is in a dynamic balance of Th1 and Th2 cells, including their respective pro- and anti-inflammatory cytokine levels and lower IR compared to the other clusters, which denotes that these individuals may have lower cardiometabolic risk.
In this study, the data shows a positive correlation between Th1 cells with IFN-γ, IL-12, and IL-1β, and between Th2 cells with IFN-γ, IL-2, and IL-4, which is consistent with previous studies.46 These findings indicate that there is a dominance of Th1 or Th2 cells according to insulin resistance and metabolic abnormalities that allowed the identification of three clusters with defined characteristics, which are probably dynamically interchanging. Both Th1 and Th2 cells play an important role in the pro- and anti-inflammatory immune response. Th1 cells produce IFN-γ, IL-12, and TNF-α, activate macrophages, and promote cell-mediated immunity, while IFN-ɣ and IL-12 aid in the polarization of naive T cells to Th1 cells.17,47 On the other hand, Th2 cells mainly produce IL-4, IL-5, IL-10, and IL-13, which suppress Th1 cell activation and contribute to humoral immunity; moreover, IL-4 is a key factor in Th2 cell differentiation, B cell proliferation, and immunoglobulin class switching.47 Very few studies have addressed the role of Th cells and their cytokines in metabolic alterations.
The present study also found that subjects with hyperglycemia and high LDL-C had a higher percentage of Th1 cells and the Th1/Th2 ratio was higher in individuals with hyperglycemia and hypercholesterolemia, suggesting that hyperglycemia and dyslipidemia may alter the CD4+ T-cell compartment, and thus promote the proinflammatory state. Hyperglycemia may also induce oxidative stress due to the overproduction of reactive oxygen species, which indicates its role in the development of an inflammatory response.48 Several molecular mechanisms have been implicated as mediators of the hyperglycemia effect: increased oxidative stress, activation of protein kinase C (PKC) through de novo synthesis of the lipid second messenger diacylglycerol, increased flux of the hexosamine pathway, activation of the polyol pathway, regulation of NADPH oxidase, and the formation of advanced glycation end products (AGEs).49 One study showed, that acute hyperglycemia in humans with and without impaired glucose tolerance (IGT), induces an increase in circulating levels of TNF-α, IL-6, and IL-18, which demonstrates a more pronounced effect on IGT. Furthermore, they observed that the antioxidant glutathione prevents the hyperglycemia-induced increase in plasma cytokines, indicating that an oxidative mechanism mediates the effect of hyperglycemia.50 There is strong evidence that TNF-α release induced by high glucose in vitro can be mediated by reactive oxygen species51 and that oxidative stress can promote low-grade systemic inflammation in patients with diabetes mellitus.52 Hence glucose, oxidative stress and inflammation are interrelated.
Few studies have reported the relationship of circulating Th cell phenotypes with metabolic profile, including obesity. A correlation analysis of T cell subtypes and metabolic indicators in patients with T2DM showed an imbalance of Th1, Th17, and Treg cells as a skewed proinflammatory phenotype characterized by increased Th1 and Th17 cells and decreased Treg cells. In addition, Th17 cells correlated negatively with plasma HDL-C levels, evidencing the relationship of hyperglycemia and dyslipidemia with altered CD4+ T-cell subtypes in patients with T2DM.24 A previous study demonstrated that advanced glycation products, which are increased in patients with diabetes, stimulate cytokine production by macrophages.53 Acute exposure of leukocytes to hyperglycemia results in low expression of lipopolysaccharide (LPS)-induced inflammatory genes, such as nuclear factor of kappa light chain gene enhancer in B-cells inhibitor alpha (NFKBIA), interleukin-1 alpha (IL-1α), and chemokine (C-C motif) ligand 3 (CCL3), while exposure to hyperinsulinemia increases mRNA levels in most of the inflammatory genes measured in the study. The combined effect of hyperglycemia and hyperinsulinemia also led to increased mRNA levels of IL-1α, interleukin-1 beta (IL-1β), and CCL3. This suggests that hyperglycemia and hyperinsulinemia influence the expression of several inflammatory genes in the opposite direction, where the acute effect of hyperinsulinemia may be stronger than that of hyperglycemia and the effect of insulin may be relevant in the presence of hyperglycemia.54
A relationship between interleukins and lipid metabolism has also been demonstrated. Proinflammatory cytokines contribute to dyslipidemia because they decrease lipoprotein lipase activity and de novo lipogenesis, and stimulate lipolysis.45,55 Early studies in humans showed that acute inflammatory conditions and increased circulating levels of interleukins lead to hypertriglyceridemia.45 It was observed in experimental animal and human studies that treatment with TNF-α, increases serum triglyceride levels.56,57 Subsequently, another study also showed that IL-1, IL-2, IL-6 stimulate hepatic fatty acid and cholesterol synthesis.58 While IL-4 had no effect on hepatic fatty acid synthesis, it did inhibit the effects of IL-1 and IL-6 on hepatic lipogenesis.59 These findings show that cytokines are capable of altering lipid metabolism and may favor an increase in serum lipid levels.
In our study, young people with a high cardiometabolic profile showed a higher Th1/Th2 ratio than those with a lower risk profile, indicating that the presence of metabolic abnormalities begins to induce an imbalance of Th1/Th2 cells, probably towards a Th1 dominance; although a statistical difference was not observed, this finding could be attributed to a lower prevalence of metabolic abnormalities in young people, including the median age of 21 years and only 23% had a high cardiometabolic profile. Nonetheless, it has been reported that the persistence of metabolic abnormalities at an early age increases both the rate of progression of atherosclerosis in young adults60 and the risk of premature death in adolescents and young adults.26 On the other hand, in people older than 50 years, a Th1/Th2 cytokine imbalance with a predominance of Th1 was reported in ACS-T2DM27 and in CAD-T2DM,8 whereas a mixed profile of Th1/Th2 cytokines was found in subjects with MetS with a mean age of 47 years.7 This shows that the older the age and the longer evolution of metabolic alterations, the higher cytokine levels, which reflect a more severe proinflammatory state at the systemic level and a more severe proinflammatory state.
We acknowledge that our study has limitations, such as a small sample size that did not allow us to match subjects in each cluster. Furthermore, due to the cross-sectional nature of our study we were unable to determine the causal relationship between the different T-cell clusters and their cytokines with cardiometabolic abnormalities. Therefore, future studies are needed to validate these findings and determine the role of each phenotype per cluster in the development of metabolic diseases associated with chronic systemic inflammation.
Conclusion
In conclusion, three distinct clusters of subjects were identified in a young population. The largest cluster showed a balanced Th1/Th2 response with some metabolic abnormalities, followed by the group tending toward a Th2 response and fewer metabolic abnormalities, and the smallest group tending toward a Th1 response and the presence of hyperglycemia and dyslipidemia. These findings support the hypothesis that chronic low-grade inflammation is related to cardiometabolic risk profile at a young age.
Acknowledgment
We thank to Aralia B. Salgado-Bernabé for her technical assistance.
Disclosure
The authors report no conflicts of interest in this work.
References
1. Donath MY, Shoelson SE. Type 2 diabetes as an inflammatory disease. Nat Rev Immunol. 2011;11(2):98–107. doi:10.1038/nri2925
2. Jung UJ, Choi MS. Obesity and its metabolic complications: the role of adipokines and the relationship between obesity, inflammation, insulin resistance, dyslipidemia and nonalcoholic fatty liver disease. Int J Mol Sci. 2014;15(4):6184–6223. doi:10.3390/ijms15046184
3. Weisberg SP, McCann D, Desai M, Rosenbaum M, Leibel RL, Ferrante AW
4. Wu H, Ballantyne CM. Metabolic inflammation and insulin resistance in obesity. Circ Res. 2020;126(11):1549–1564. doi:10.1161/CIRCRESAHA.119.315896
5. Pradhan AD, Manson JE, Rifai N, Buring JE, Ridker PM. C-reactive protein, interleukin 6, and risk of developing type 2 diabetes mellitus. JAMA. 2001;286(3):327–334. doi:10.1001/jama.286.3.327
6. Wegner M, Winiarska H, Bobkiewicz-Kozłowska T, Dworacka M. IL-12 serum levels in patients with type 2 diabetes treated with sulphonylureas. Cytokine. 2008;42(3):312–316. doi:10.1016/j.cyto.2008.02.014
7. Surendar J, Mohan V, Rao MM, Babu S, Aravindhan V. Increased levels of both Th1 and Th2 cytokines in subjects with metabolic syndrome (CURES-103). Diabetes Technol Ther. 2011;13(4):477–482. doi:10.1089/dia.2010.0178
8. Madhumitha H, Mohan V, Deepa M, Babu S, Aravindhan V. Increased Th1 and suppressed Th2 serum cytokine levels in subjects with diabetic coronary artery disease. Cardiovasc Diabetol. 2014;13:1. doi:10.1186/1475-2840-13-1
9. Zhou T, Hu Z, Yang S, Sun L, Yu Z, Wang G. Role of adaptive and innate immunity in type 2 diabetes mellitus. J Diabetes Res. 2018;2018:7457269. doi:10.1155/2018/7457269
10. Sell H, Eckel J. Adipose tissue inflammation: novel insight into the role of macrophages and lymphocytes. Curr Opin Clin Nutr Metab Care. 2010;13(4):366–370. doi:10.1097/MCO.0b013e32833aab7f
11. Feuerer M, Herrero L, Cipolletta D, et al. Lean, but not obese, fat is enriched for a unique population of regulatory T cells that affect metabolic parameters. Nat Med. 2009;15(8):930–939. doi:10.1038/nm.2002
12. Nishimura S, Manabe I, Nagasaki M, et al. CD8+ effector T cells contribute to macrophage recruitment and adipose tissue inflammation in obesity. Nat Med. 2009;15(8):914–920. doi:10.1038/nm.1964
13. Winer S, Chan Y, Paltser G, et al. Normalization of obesity-associated insulin resistance through immunotherapy. Nat Med. 2009;15(8):921–929. doi:10.1038/nm.2001
14. Rocha VZ, Folco EJ, Sukhova G, et al. Interferon-gamma, a Th1 cytokine, regulates fat inflammation: a role for adaptive immunity in obesity. Circ Res. 2008;103(5):467–476. doi:10.1161/CIRCRESAHA.108.177105
15. Duffaut C, Zakaroff-Girard A, Bourlier V, et al. Interplay between human adipocytes and T lymphocytes in obesity: CCL20 as an adipochemokine and T lymphocytes as lipogenic modulators. Arterioscler Thromb Vasc Biol. 2009;29(10):1608–1614. doi:10.1161/ATVBAHA.109.192583
16. Kintscher U, Hartge M, Hess K, et al. T-lymphocyte infiltration in visceral adipose tissue: a primary event in adipose tissue inflammation and the development of obesity-mediated insulin resistance. Arterioscler Thromb Vasc Biol. 2008;28(7):1304–1310. doi:10.1161/ATVBAHA.108.165100
17. Hirahara K, Nakayama T. CD4+ T-cell subsets in inflammatory diseases: beyond the Th1/Th2 paradigm. Int Immunol. 2016;28(4):163–171. doi:10.1093/intimm/dxw006
18. McLaughlin T, Liu LF, Lamendola C, et al. T-cell profile in adipose tissue is associated with insulin resistance and systemic inflammation in humans. Arterioscler Thromb Vasc Biol. 2014;34(12):2637–2643. doi:10.1161/ATVBAHA.114.304636
19. Andersen CJ, Murphy KE, Fernandez ML. Impact of obesity and metabolic syndrome on immunity. Adv Nutr. 2016;7(1):66–75. doi:10.3945/an.115.010207
20. O’Rourke RW, Kay T, Scholz MH, et al. Alterations in T-cell subset frequency in peripheral blood in obesity. Obes Surg. 2005;15(10):1463–1468. doi:10.1381/096089205774859308
21. Kim JA, Park HS. White blood cell count and abdominal fat distribution in female obese adolescents. Metabolism. 2008;57(10):1375–1379. doi:10.1016/j.metabol.2008.05.005
22. Tanaka S, Isoda F, Ishihara Y, Kimura M, Yamakawa T. T lymphopaenia in relation to body mass index and TNF-alpha in human obesity: adequate weight reduction can be corrective. Clin Endocrinol. 2001;54(3):347–354.
23. Zhao R, Tang D, Yi S, et al. Elevated peripheral frequencies of Th22 cells: a novel potent participant in obesity and type 2 diabetes. PLoS One. 2014;9(1):e85770. doi:10.1371/journal.pone.0085770
24. Zeng C, Shi X, Zhang B, et al. The imbalance of Th17/Th1/Tregs in patients with type 2 diabetes: relationship with metabolic factors and complications. J Mol Med (Berl). 2012;90(2):175–186. doi:10.1007/s00109-011-0816-5
25. Upadhyay J, Farr O, Perakakis N, Ghaly W, Mantzoros C. Obesity as a disease. Med Clin North Am. 2018;102(1):13–33. doi:10.1016/j.mcna.2017.08.004
26. Saydah S, Bullard KM, Imperatore G, Geiss L, Gregg EW. Cardiometabolic risk factors among US adolescents and young adults and risk of early mortality. Pediatrics. 2013;131(3):e679–e686. doi:10.1542/peds.2012-2583
27. Alberti KG, Eckel RH, Grundy SM, et al. Harmonizing the metabolic syndrome: a joint interim statement of the International Diabetes Federation Task Force on Epidemiology and Prevention; National Heart, Lung, and Blood Institute; American Heart Association; World Heart Federation; International Atherosclerosis Society; and International Association for the Study of Obesity. Circulation. 2009;120(16):1640–1645. doi:10.1161/CIRCULATIONAHA.109.192644
28. Matthews DR, Hosker JP, Rudenski AS, Naylor BA, Treacher DF, Turner RC. Homeostasis model assessment: insulin resistance and beta-cell function from fasting plasma glucose and insulin concentrations in man. Diabetologia. 1985;28(7):412–419. doi:10.1007/BF00280883
29. Stentz FB, Kitabchi AE. Transcriptome and proteome expressions involved in insulin resistance in muscle and activated T-lymphocytes of patients with type 2 diabetes. Genomics Proteomics Bioinformatics. 2007;5(3–4):216–235. doi:10.1016/S1672-0229(08)60009-1
30. Guo H, Xu BC, Yang XG, et al. A high frequency of peripheral blood IL-22(+) CD4(+) T cells in patients with new onset type 2 diabetes mellitus. J Clin Lab Anal. 2016;30(2):95–102. doi:10.1002/jcla.21821
31. Zhao SL, Mo ZH, He HH, Zhao LL, Xie YH. Imbalance of T-helper 1/T-helper 2 cytokines and impaired glucose tolerance among patient with acute coronary syndrome. J Cancer Res Ther. 2018;14(9):S480–S485. doi:10.4103/0973-1482.194346
32. Pacifico L, Di Renzo L, Anania C, et al. Increased T-helper interferon-gamma-secreting cells in obese children. Eur J Endocrinol. 2006;154(5):691–697. doi:10.1530/eje.1.02138
33. Asadikaram G, Ram M, Izadi A, et al. The study of the serum level of IL-4, TGF-β, IFN-γ, and IL-6 in overweight patients with and without diabetes mellitus and hypertension. J Cell Biochem. 2019;120(3):4147–4157. doi:10.1002/jcb.27700
34. McGillicuddy FC, Chiquoine EH, Hinkle CC, et al. Interferon gamma attenuates insulin signaling, lipid storage, and differentiation in human adipocytes via activation of the JAK/STAT pathway. J Biol Chem. 2009;284(46):31936–31944. doi:10.1074/jbc.M109.061655
35. Cruz-Pineda WD, Parra-Rojas I, Rodríguez-Ruíz HA, Illades-Aguiar B, Matia-García I, Garibay-Cerdenares OL. The regulatory role of insulin in energy metabolism and leukocyte functions. J Leukoc Biol. 2021;1–12. doi:10.1002/JLB.2RU1220-847R
36. Viardot A, Heilbronn LK, Samocha-Bonet D, Mackay F, Campbell LV, Samaras K. Obesity is associated with activated and insulin resistant immune cells. Diabetes Metab Res Rev. 2012;28(5):447–454. doi:10.1002/dmrr.2302
37. Olson NC, Doyle MF, de Boer IH, et al. Associations of circulating lymphocyte subpopulations with type 2 diabetes: cross-sectional results from the multi-ethnic study of atherosclerosis (Mesa). PLoS One. 2015;10(10):e0139962. doi:10.1371/journal.pone.0139962
38. Sbierski-Kind J, Goldeck D, Buchmann N, et al. T cell phenotypes associated with insulin resistance: results from the Berlin aging study II. Immun Ageing. 2020;17(1):40. doi:10.1186/s12979-020-00211-y
39. Fischer HJ, Sie C, Schumann E, et al. The insulin receptor plays a critical role in T cell function and adaptive immunity. J Immunol. 2017;198(5):1910–1920. doi:10.4049/jimmunol.1601011
40. van der Weerd K, Dik WA, Schrijver B, et al. Morbidly obese human subjects have increased peripheral blood CD4+ T cells with skewing toward a Treg- and Th2-dominated phenotype. Diabetes. 2012;61(2):401–408. doi:10.2337/db11-1065
41. Bremer AA, Jialal I. Adipose tissue dysfunction in nascent metabolic syndrome. J Obes. 2013;2013:393192. doi:10.1155/2013/393192
42. Hotamisligil GS, Budavari A, Murray D, Spiegelman BM. Reduced tyrosine kinase activity of the insulin receptor in obesity-diabetes. Central role of tumor necrosis factor-alpha. J Clin Invest. 1994;94(4):1543–1549. doi:10.1172/JCI117495
43. Viardot A, Grey ST, Mackay F, Chisholm D. Potential antiinflammatory role of insulin via the preferential polarization of effector T cells toward a T helper 2 phenotype. Endocrinology. 2007;148(1):346–353. doi:10.1210/en.2006-0686
44. Tarantino G, Costantini S, Finelli C, et al. Is serum interleukin-17 associated with early atherosclerosis in obese patients? J Transl Med. 2014;12(1):214. doi:10.1186/s12967-014-0214-1
45. Feingold KR, Grunfeld C. Role of cytokines in inducing hyperlipidemia. Diabetes. 1992;41(Suppl 2):97–101. doi:10.2337/diab.41.2.s97
46. Mahlangu T, Dludla PV, Nyambuya TM, et al. A systematic review on the functional role of Th1/Th2 cytokines in type 2 diabetes and related metabolic complications. Cytokine. 2020;126:154892. doi:10.1016/j.cyto.2019.154892
47. Cosmi L, Maggi L, Santarlasci V, Liotta F, Annunziato F. T helper cells plasticity in inflammation. Cytometry A. 2014;85(1):36–42. doi:10.1002/cyto.a.22348
48. Sun Q, Li J, Gao F. New insights into insulin: the anti-inflammatory effect and its clinical relevance. World J Diabetes. 2014;5(2):89–96. doi:10.4239/wjd.v5.i2.89
49. Giri B, Dey S, Das T, Sarkar M, Banerjee J, Dash SK. Chronic hyperglycemia mediated physiological alteration and metabolic distortion leads to organ dysfunction, infection, cancer progression and other pathophysiological consequences: an update on glucose toxicity. Biomed Pharmacother. 2018;107:306–328. doi:10.1016/j.biopha.2018.07.157
50. Esposito K, Nappo F, Marfella R, et al. Inflammatory cytokine concentrations are acutely increased by hyperglycemia in humans: role of oxidative stress. Circulation. 2002;106(16):2067–2072. doi:10.1161/01.cir.0000034509.14906.ae
51. Guha M, Bai W, Nadler JL, Natarajan R. Molecular mechanisms of tumor necrosis factor alpha gene expression in monocytic cells via hyperglycemia-induced oxidant stress-dependent and -independent pathways. J Biol Chem. 2000;275(23):17728–17739. doi:10.1074/jbc.275.23.17728
52. Arnalich F, Hernanz A, López-Maderuelo D, et al. Enhanced acute-phase response and oxidative stress in older adults with type II diabetes. Horm Metab Res. 2000;32(10):407–412. doi:10.1055/s-2007-978662
53. Vlassara H, Brownlee M, Manogue KR, Dinarello CA, Pasagian A. Cachectin/TNF and IL-1 induced by glucose-modified proteins: role in normal tissue remodeling. Science. 1988;240(4858):1546–1548. doi:10.1126/science.3259727
54. Stegenga ME, van der Crabben SN, Dessing MC, et al. Effect of acute hyperglycaemia and/or hyperinsulinaemia on proinflammatory gene expression, cytokine production and neutrophil function in humans. Diabet Med. 2008;25(2):157–164. doi:10.1111/j.1464-5491.2007.02348.x
55. Mirhafez SR, Ebrahimi M, Saberi Karimian M, et al. Serum high-sensitivity C-reactive protein as a biomarker in patients with metabolic syndrome: evidence-based study with 7284 subjects. Eur J Clin Nutr. 2016;70(11):1298–1304. doi:10.1038/ejcn.2016.111
56. Feingold KR, Grunfeld C. Tumor necrosis factor-alpha stimulates hepatic lipogenesis in the rat in vivo. J Clin Invest. 1987;80(1):184–190. doi:10.1172/JCI113046
57. Starnes HF
58. Feingold KR, Soued M, Serio MK, Moser AH, Dinarello CA, Grunfeld C. Multiple cytokines stimulate hepatic lipid synthesis in vivo. Endocrinology. 1989;125(1):267–274. doi:10.1210/endo-125-1-267
59. Grunfeld C, Soued M, Adi S, et al. Interleukin 4 inhibits stimulation of hepatic lipogenesis by tumor necrosis factor, interleukin 1, and interleukin 6 but not by interferon-alpha. Cancer Res. 1991;51(11):2803–2807.
60. Juonala M, Viikari JS, Kähönen M, et al. Life-time risk factors and progression of carotid atherosclerosis in young adults: the cardiovascular risk in young Finns study. Eur Heart J. 2010;31(14):1745–1751. doi:10.1093/eurheartj/ehq141
 © 2021 The Author(s). This work is published and licensed by Dove Medical Press Limited. The full terms of this license are available at https://www.dovepress.com/terms.php and incorporate the Creative Commons Attribution - Non Commercial (unported, v3.0) License.
By accessing the work you hereby accept the Terms. Non-commercial uses of the work are permitted without any further permission from Dove Medical Press Limited, provided the work is properly attributed. For permission for commercial use of this work, please see paragraphs 4.2 and 5 of our Terms.
© 2021 The Author(s). This work is published and licensed by Dove Medical Press Limited. The full terms of this license are available at https://www.dovepress.com/terms.php and incorporate the Creative Commons Attribution - Non Commercial (unported, v3.0) License.
By accessing the work you hereby accept the Terms. Non-commercial uses of the work are permitted without any further permission from Dove Medical Press Limited, provided the work is properly attributed. For permission for commercial use of this work, please see paragraphs 4.2 and 5 of our Terms.