")
Back to Journals » International Journal of Women's Health » Volume 6
Tertiary care availability and adolescent pregnancy characteristics in Saudi Arabia
Authors Al-Kadri H, Madkhali A, Al-Kadi M, Bakhsh H, Alruwaili N, Tamim H
Received 17 November 2013
Accepted for publication 8 January 2014
Published 1 April 2014 Volume 2014:6 Pages 359—366
DOI https://doi.org/10.2147/IJWH.S57743
Checked for plagiarism Yes
Review by Single anonymous peer review
Peer reviewer comments 4
Hanan M Al-Kadri,1 Azza Madkhali,1 Mohammed T Al-Kadi,2 Hanadi Bakhsh,1 Nourah N Alruwaili,2 Hani M Tamim2
1Department of Obstetrics and Gynecology, King Abdulaziz Medical City, King Saud Bin Abdulaziz University for Health Sciences, Riyadh, 2King Saud Bin Abdulaziz University for Health Sciences, Riyadh, Kingdom of Saudi Arabia
Background: In this study, we aimed to assess the rate of adolescent delivery in a Saudi tertiary health care center and to investigate the association between maternal age and fetal, neonatal, and maternal complications where a professional tertiary medical care service is provided.
Methods: A cross-sectional study was performed between 2005 and 2010 at King Abdulaziz Medical City, Riyadh, Saudi Arabia. All primigravid Saudi women ≥24 weeks gestation, carrying a singleton pregnancy, aged <35 years, and with no chronic medical problems were eligible. Women were divided into three groups based on their age, ie, group 1 (G1) <16 years, group 2 (G2) ≥16 up to 19 years, and group 3 (G3) ≥19 up to 35 years. Data were collected from maternal and neonatal medical records. We calculated the association between the different age groups and maternal characteristics, as well as events and complications during the antenatal period, labor, and delivery.
Results: The rates of adolescent delivery were 20.0 and 16.3 per 1,000 births in 2009 and 2010, respectively. Compared with G1 and G2 women, G3 women tended to have a higher body mass index, a longer first and second stage of labor, more blood loss at delivery, and a longer hospital stay. Compared with G1 and G2 women, respectively, G3 women had a 42% and a 67% increased risk of cesarean section, and had a 52% increased risk of instrumental delivery. G3 women were more likely to develop gestational diabetes or anemia, G2 women had a three-fold increased risk of premature delivery (odds ratio 2.81), and G3 neonates had a 50% increased overall risk of neonatal complications (odds ratio 0.51).
Conclusion: The adolescent birth rate appears to be low in central Saudi Arabia compared with other parts of the world. Excluding preterm delivery, adolescent delivery cared for in a tertiary health care center is not associated with a significantly increased medical risk to the mother, fetus, or neonate. The psychosocial effect of adolescent pregnancy and delivery needs to be assessed.
Keywords: adolescent pregnancy, maternal mortality, maternal morbidity, neonatal mortality, neonatal morbidity
Introduction
Marriage of adolescents aged 10–19 years is still widely practiced across the world, while the duration between marriage and having a first baby is in decline.1 Young couples often have their first child within 12–20 months of marriage.2 In Bahrain, for instance, one in five adolescent girls delivers before the age of 16 years, and some adolescent mothers are as young as eleven years.2 In Mali, where 25% of girls are married by the age of 15 years, one in ten was reported to be pregnant by the age of 15 years, and nearly 40% were pregnant or had already become mothers by the age of 17 years.2
Apart from pain and psychological trauma,3 many medical complications related to adolescent pregnancy and childbirth might occur.4,5 These medical risks are well documented in the international literature, and include an increased risk of preterm labor,6 increased risk of low birth weight,7 increased labor and delivery complications, and a higher chance of perinatal mortality.8 Adolescent women are at greater risk of perinatal mortality than women aged 20–24 years.9,10 Importantly, it has been reported that pregnant adolescents aged 15 years or younger are more likely to die compared with older women, including older adolescents.11 These deaths are mainly a result of hemorrhage, sepsis, pre-eclampsia/eclampsia, and obstructed labor.9,12
The health problems linked to early marriage and pregnancy affect pregnant mothers, their fetuses, and their children, and evidence shows that infant mortality in children of very young mothers is higher.13 Pregnancies occurring “too early” extend a woman’s reproductive life span and constitute a major risk to the survival and future health of both mother and child.4,5 If a mother is under 18 years, her baby’s chance of dying in the first year of life is 60% greater than that of a baby born to a woman aged 19 years or older.14
To the best of our knowledge, most studies of the outcomes of early marriage and pregnancy have focused on premature sex, dropping out of school, and pregnancy complications in the presence of low health care resources.13,15 Much work remains to be done to assess the extent of the problem of adolescent pregnancy, the effect of professional care during the antenatal period and delivery, and the adolescent pregnancy rates in various regions of the world.
The aim of this study was to assess the rate of adolescent delivery in a tertiary referral health care center in the central region of Saudi Arabia. Moreover, we investigated the association between maternal age and fetal, neonatal, and maternal complications in a group of adolescent women who received professional health care during their pregnancy and/or delivery.
Materials and methods
Study setting
This research was conducted in the Department of Obstetrics and Gynecology at King Abdulaziz Medical City (KAMC), Riyadh, Saudi Arabia. KAMC is a tertiary health care center where complicated cases are referred for management. About 8,500 deliveries occur every year, with a cesarean section rate of about 20% and an instrumental delivery rate of about 3%–5%.
Study subjects and sampling technique
This cross-sectional study included all primigravid Saudi patients who were ≥24 weeks gestation, delivered at KAMC, and were eligible to participate in the study. An independent research assistant randomly selected the participants from a labor and delivery registry book where all deliveries are documented, including maternal nationality, age, parity, and gestational age. The paper and electronic files for these Saudi women were then reviewed to confirm their eligibility. Gestational age ≥24 weeks was confirmed either based on the women-documented “sure dates” of last menstrual period, or dating by ultrasound scan during the first trimester of their pregnancy. The nationality and age of each woman at delivery were confirmed by official registration in hospital medical electronic documents.
Patients who were less than 24 weeks gestation were considered as abortion cases16 and were excluded from the study. Patients with chronic medical problems (eg, diabetes, hypertension, systemic lupus erythematosus) and those with multiple gestations were excluded to eliminate any bias related to pre-existing health/pregnancy problems.
After application of the inclusion and exclusion criteria, the eligible participants were divided into three main groups based on their age at delivery. The first two groups comprised adolescent women based on the World Health Organization definition of adolescents (age 13 up to 19 years of age), and the third group comprised older women and was used as a comparison or control group. Group 1 (G1) comprised patients who delivered while aged <16 years (pregnant adolescents in this age group are reported to be at highest risk).9,11 Group 2 (G2) patients who delivered at ≥16 up to 19 years of age. Group 3 (G3) comprised patients older than 19 years but excluded those over 35 years to avoid including elderly primigravid women. We obtained a representative sample of each age group of primigravid patients who were admitted and delivered at KAMC between the years 2005 and 2010.
Data collection included maternal characteristics, including age, parity, weight and height, medical history, and whether the woman had had booked antenatal care at KAMC at least once. The data also included information on labor and delivery, and fetomaternal information such as the presence or absence of postpartum hemorrhage (blood loss of at least 500 mL post vaginal delivery and more than 1,000 mL post cesarean delivery). We collected data on the presence or absence of anemia in the study women based on the World Health Organization cutoff (hemoglobin <120 g/L) and data on the presence or absence of premature rupture of membranes (before 37 weeks gestation). We also collected data on the presence or absence of intrauterine growth restriction (fetal weight less than the tenth percentile for gestational age). The data were gathered from electronic and paper-based medical maternal and neonatal records up to the date of discharge from hospital.
Sample size
Considering the occurrence of preterm labor or (labor before 37 weeks gestation) as the main outcome, and assuming an 8% incidence of preterm labor in the general population, we calculated that a sample of 219 patients was needed in each group to identify a difference of 10% with a power of 80% and an alpha error of 0.05.
Data management and analysis plan
The data were entered into Statistical Package for the Social Sciences version 15 software (SPSS Inc., Chicago, IL, USA). Continuous variables were categorized according to clinically relevant cutoff points. Descriptive analyses were carried out by calculating the numbers and percentages for categorical variables and calculating mean and standard deviation for continuous variables. Bivariate analyses for the association between maternal age and development of fetal, neonatal, and maternal complications were carried out, and P-values were calculated using Pearson’s chi-squared test or the Student’s t-test as appropriate. Odds ratios and 95% confidence intervals were calculated for categorical variables and for categorized continuous variables. P-values ≤0.05 was considered to be statistically significant. The approval of The King Abdullah International Medical Research Center institutional review board committee was obtained prior to conducting this research.
Results
The total number of deliveries occurring at KAMC during the years 2009 and 2010 were 8,548 and 8,499, respectively. The number of adolescent women of any parity who delivered in the years 2009 and 2010 were 174 and 136, respectively. Therefore, the proportion of adolescent delivery or its rate, considering the denominator as the total number of deliveries at KAMC, was 20/1,000 births and 16.3/1,000 births during the years 2009 and 2010, respectively. We compared our results between G1 and G3, between G2 and G3, and between G1 and G2. However, in the tables, we only present comparisons between G1 and G3 and between G2 and G3. The comparison between G1 and G2 is not presented due to the insignificant differences noted between these two groups.
Overall, we collected data on 179 women from G1 (youngest aged 13 years), 236 women from G2, and 238 women from G3. We were not able to reach the target sample size for G1 because all the eligible women for G1 during the study period were 179 women whom were all included.
Table 1 shows the demographic and clinical data for the three groups of women. As can be seen, the only significant differences between the study groups were: a significantly higher body mass index (BMI) in G3 compared with G1 and G2 (P=0.001 and P=0.003, respectively); a significantly longer first stage of labor in G3 than in G1 and G2 (P=0.01 and P=0.03, respectively); a significantly longer second stage of labor in G3 than in G1 and G2 (P=0.01 and P=0.01, respectively); and significantly more post-partum blood loss in G3 than in G1 and G2 (P=0.01 and P=0.01, respectively). Table 1 also shows that there was no significant difference in antenatal care booking status between the three groups, and that almost 85% of the women in each of the groups have received this service at KAMC.
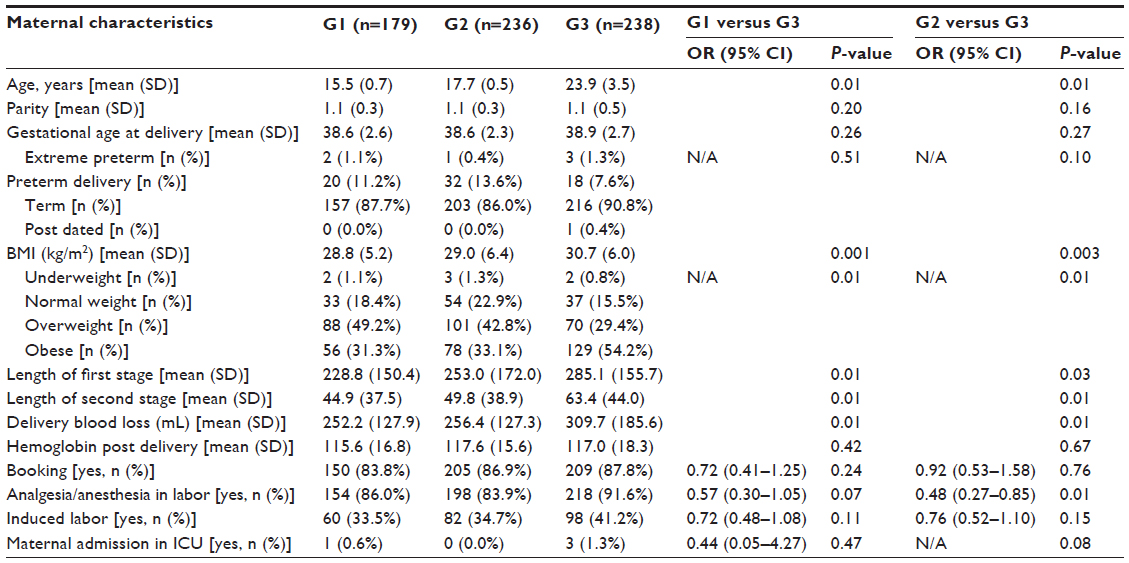 | Table 1 Characteristics of patients according to age group at time of delivery |
Surgical deliveries are presented in Table 2, and include both cesarean sections and instrumental deliveries. We found that the rate of instrumental deliveries by either ventouse or forceps was 47% higher in G3 than in G1 (P=0.05) and 52% higher in G3 than in G2 (P=0.02). Moreover, the tendency for cesarean section deliveries was about 50% higher in G3 compared with G1 and G2 (P=0.01 and P=0.03, respectively). Fetal distress as an indication for surgical delivery was 61% higher in G3 compared with G1 and 42% higher in G3 compared with G2 (P=0.002 and P=0.03, respectively). On the other hand, failure to progress was 58% higher in G3 compared with G1 and 40% higher in G3 compared with G2 (P=0.03 and P=0.01, respectively). There was no difference between G1 and G2 in terms of the surgical interventions performed.
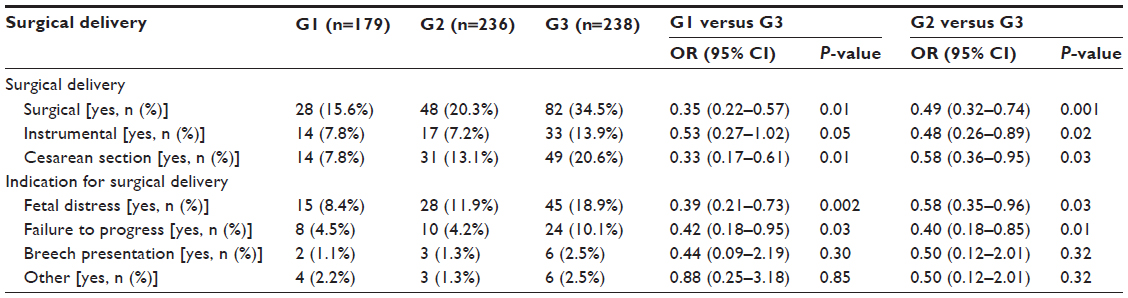 | Table 2 Characteristics of surgical delivery according to age group at time of delivery |
We assessed the cardiotocographic changes that occurred during progress of labor and delivery in the three groups of women and found no significant difference between them, so no data are presented in this regard.
Table 3 shows maternal complications; an 88% increase in tendency to develop gestational diabetes mellitus was noted for G3 when compared with G2 (P=0.02) but not when compared with G1. The diagnosis was based on a 2-hour post 75 g glucose challenge test result ≥7.8 mmol/L. Further, G3 showed a 69% increased tendency to stay longer in hospital compared with G1 and a 33% increased tendency to stay longer in hospital compared with G2 (P=0.01 and P=0.03, respectively). We considered the normal hospital stay post-delivery at KAMC to be 24 hours following vaginal delivery and 72 hours following cesarean delivery based on internal postpartum policy and procedure in the obstetrics and gynecology department. We identified that G2 women had a 2.8-fold increased risk of preterm labor compared with G3 women but not when compared with G1 (P=0.03). In fact, when we compared G1 and G2, we found that the only difference in term of maternal complications was that G2 women tended to stay longer in hospital compared with those in G1 (P=0.01).
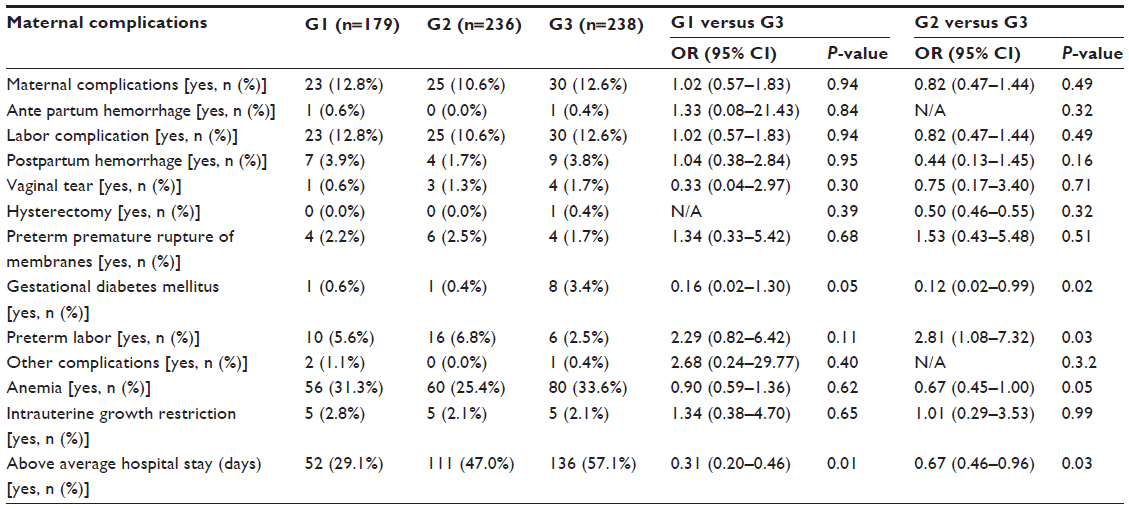 | Table 3 Maternal complications according to age group at time of delivery |
Table 4 shows the neonatal outcomes and complications that occurred in the three study groups. G3 had about a 50% increased risk of developing various types of neonatal complications compared with G1 (P=0.02) but not when compared with G2; overall neonatal complications were higher in G2 compared with G1 (P=0.03).
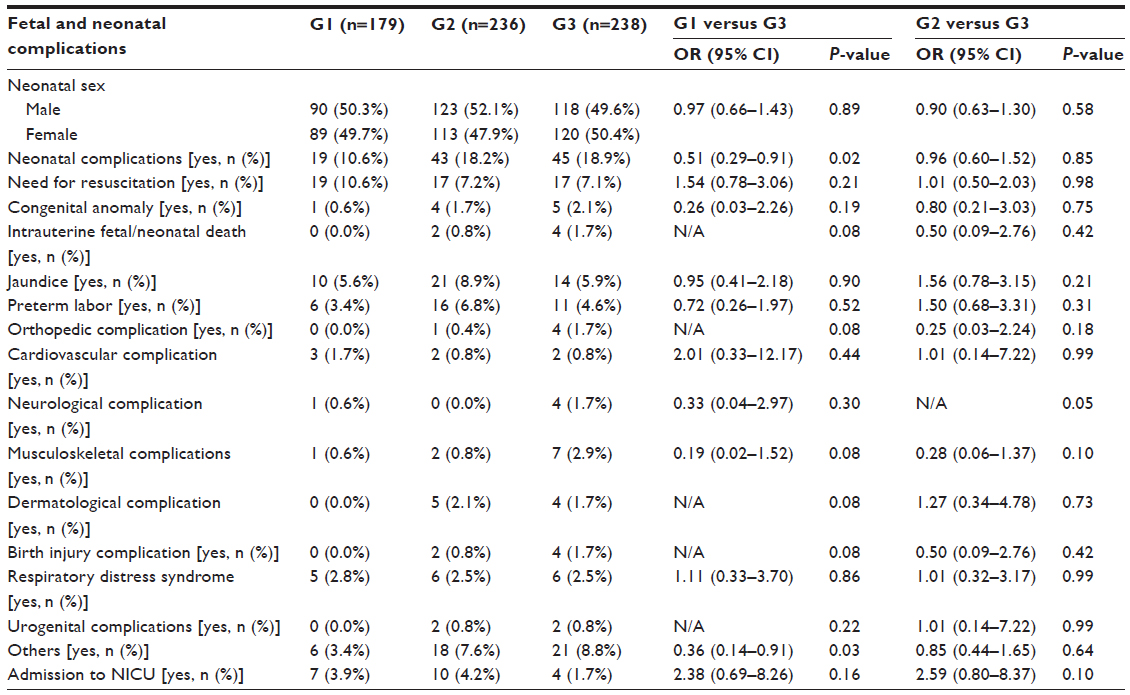 | Table 4 Fetal and neonatal complications according to age group at time of delivery |
When we investigated for differences in birth weight, Apgar scores at 1, 5, and 10 minutes, length of hospital stay, need for admission to the neonatal intensive care unit, and cord pH between the study groups, the only significant finding was that the Apgar score was significantly lower in G3 compared with G1 (P=0.04); however, this difference did not persist for the 5-minute and 10-minute Apgar scores.
Discussion
In this work, we found that pregnancy in adolescence (13 up to 19 years of age) did not add a major risk to the mother and/or her newborn when compared with older mothers attending a tertiary care center during pregnancy and for delivery. This finding is consistent with recent national data reported from Taiwan based on government statistics and a survey of women who delivered between 1989 and 2009.17 It is also consistent with that from a large Canadian cohort study that confirmed the positive effect of multidisciplinary prenatal care and adequate socioeconomic status on better adolescent pregnancy outcomes.18 Generally, the greatest maternal mortality occurs in mothers aged 20–34 years, who represent the majority of women giving birth, but in the absence of appropriate medical care, older women and adolescents remain at higher risk.19
The recommended method for calculation of birth rate is to use the total female population as the denominator. However, the total female population in the catchment area for KAMC is unknown, so we used total number of deliveries as our denominator. Thus, the calculated birth rate or the proportion of adolescent women delivery at KAMC was 20/1,000 births and 16.3/1,000 births during the years 2009 and 2010, respectively. As the number of KAMC women population is likely to be much higher than those women who delivered within the same period of time, we expect that the true adolescent delivery rate is considerably lower than what we calculated, and also lower when compared with the adolescent birth rates reported in both developed and developing countries.13
Surgical intervention during labor is more common in high-risk patients due to the increased tendency of these women to develop complications during labor.20,21 The adolescent women in our study were not in this high-risk category and performed as well or even better than the comparison group. It seems that pelvic maturity and shape in adolescent women is favorable for vaginal delivery.22 Moreover, good average birth weights (2,885.8±530.0 g for G1 and 2,929.4±537.4 g for G2) along with good general antenatal and labor conditions would have contributed to the lower complication rate and higher rate of vaginal delivery seen in our study. Cesarean section on demand23 is unlikely to account for the increased number of cesarean section deliveries in G3. Cesarean section on demand is extremely rare at KAMC according to annual statistics held in its obstetrics and gynecology department.
Obesity during pregnancy is associated with numerous maternal and neonatal risks.24 There is good evidence that maternal prepregnancy weight, pattern of weight gain, and total pregnancy-related weight gain, are important factors in predicting and determining neonatal birth weight and resulting perinatal and maternal mortality and morbidity.25,26 Moreover, abnormal maternal weight gain during pregnancy may affect fetal and maternal health in the long term.27 BMI calculated at time of delivery in our study was significantly higher in the comparison group (G3). G3 patients were more likely to be obese with a BMI ≥30 kg/m2, which might explain their increased rates of gestational diabetes28 and cesarean section deliveries.29,30
It is well known that women at the extremes of reproductive life (younger than 19 years and older than 35 years) are at increased risk of preterm labor. Age older than 35 years is an independent risk factor for spontaneous preterm labor and preterm premature rupture of membranes,31 so these women were excluded from our study. On the other hand, adolescent women appear to be more prone to preterm labor and preterm delivery than the older group.6 This risk persisted in our adolescent women, despite the availability of appropriate antenatal care, when compared with older women.
The various maternal outcomes investigated indicate more favorable maternal outcomes in adolescent women from G1 and G2 than in older women in G3. We do not have a clear explanation for these better adolescent outcomes, except for the fact that our adolescent women receive more care when they are pregnant and during delivery than older women because, according to our antenatal risk scoring system, being an adolescent pregnant woman indicates higher risk that requires specific antenatal intervention. Therefore, follow-up and attendance during labor is more frequent, with the pregnant adolescent kept under the direct care of physicians rather than midwives, along with implementation of other precautionary measures. These measures, in particular risk classification, provision of careful qualified monitoring, and early identification of problems, are known to result in better outcomes.5,14,32 Our pregnant adolescents have better outcomes than those reported for other adolescent populations,33,34 and a possible reason for this is the high-quality care and resources made available for this age group.
As with maternal complications, the overall neonatal complication rate was significantly higher in G3. It is well known that neonatal outcomes are directly affected by maternal condition during pregnancy, labor, and delivery.35,36 It seems that neonates born to adolescent pregnant women, if screened carefully during their antenatal visits and delivery, do well and sometimes even better than neonates from comparison groups. This is true particularly when their mothers undergo pregnancy and labor while in good general condition.37 Although Apgar scores at one minute were significantly lower in neonates from the older group of mothers (G3), this transient fetal distress did not affect perinatal outcomes in this group.38 An isolated low Apgar score at one minute followed by normal 5-minute and 10-minute Apgar scores is not known to cause significant residual fetal morbidity and will usually not affect the final outcome. In fact, the literature correlates neonatal outcomes with 5-minute and 10-minute Apgar scores rather than the one-minute Apgar score in isolation.38,39
Finally, the absence of major differences between G1 and G2 could be explained by women in both these groups being healthy from the beginning of their pregnancies and having received good similar health care throughout their pregnancies. Further, this lack of an observed difference may be related to the relatively high mean age in G1, ie, 15.5 years, which is approaching the lower limit of ≥16 years in G2. Both factors may have contributed to the absence of a recognizable difference between G1 and G2 in this regard.
Weaknesses and recommendations for future research
This study has some limitations warranting mention. First, this work was done in one tertiary care center in the central region of Saudi Arabia, and while its results may be generalizable to the total population of women in the central region, they may not be generalizable nationally or internationally. Second, this research only included women who attended a tertiary care center where even the un-booked women who did not receive antenatal care during pregnancy have enjoyed a high standard of care during labor. It did not assess the effect of poor medical care on adolescents’ pregnancy outcomes. Third, this research only explored the medical fetomaternal effects of adolescent pregnancy and delivery; unfortunately, the psychosocial effects of pregnancy and delivery were not included. We speculate that the psychosocial effect might have a more serious effect on mother, fetus, and newborn. Finally, we relied in calculating the adolescent birth rate on the total number of deliveries as a denominator rather than the total number of women population. Having the number of the population within KAMC catchment area “unknown” made this calculation impossible. However, we do believe that the calculated rate will be much lower if we use the female population as the denominator.
We recommend conducting multicenter research that includes several primary, secondary, and tertiary care centers distributed across Saudi Arabia. This research should explore the medical, as well as the psychosocial effects of adolescent pregnancy and delivery, and calculate the overall rate of adolescent pregnancy/delivery in the Kingdom of Saudi Arabia.
Conclusion
The adolescent birth rate at the studied tertiary care center is found to be low. Excluding pre-term delivery, adolescent pregnancy in the presence of high quality care did not carry significant increased medical risk to either mother or fetus. This is true even for those who fell pregnant before the age of 16. It appears that optimal and careful antenatal care and high standard labor and delivery management may play a major role in reducing common known complications that have been traditionally related to young maternal age at delivery. In order to generalize the result of this research, further work that evaluates the overall physical and psychosocial effects of adolescent pregnancy in different regions and health care setups in Saudi Arabia is highly recommended.
Disclosure
The authors report no conflicts of interest in this work.
References
McIntyre P. Married Adolescents: No Place of Safety. Oxford, UK: WHO; 2006. | |
Katzive L. Addressing the Human Rights of Married Adolescents, presented at WHO/UNFPA/Population CouncilTechnical Consultation on Married Adolescents. Geneva: WHO; 2003. | |
Koleva H, Stuart S. Risk factors for depressive symptoms in adolescent pregnancy in a late-teen subsample. Archives of Women’s Mental Health. November 13, 2013. | |
UNICEF. Safe Motherhood. New York: UNICEF; also extensive WHO and IPPF literature;1990. Available from: http://www.unfpa.org/public/mothers. | |
Hampton T. Child marriage threatens girls’ health. JAMA: the journal of the American Medical Association. 2010;304(5):509–510. | |
Hediger ML, Scholl TO, Schall JI, Krueger PM. Young maternal age and preterm labor. Annals of Epidemiology. Aug 1997;7(6):400–406. | |
Second World Situation Report. Geneva 1992. Available from: http://www.unscn.org/layout/modules/resources/files/rwns2_1.pdf. | |
Santos MI, Rosario F. A score for assessing the risk of first-time adolescent pregnancy. Family Practice. 2011;28(5):482–488. | |
Adolescent Sexuality, WHO (Original source is The World’s Women 1990, UN Department of Economic and Social Affairs, New York). Geneva 2000. Available from: http://unstats.un.org/unsd/demographic/products/Worldswomen/WW1990.pdf. | |
Conde-Agudelo A, Belizan JM, Lammers C. Maternal-perinatal morbidity and mortality associated with adolescent pregnancy in Latin America: Cross-sectional study. American Journal of Obstetrics and Gynecology. 2005;192(2):342–349. | |
World Health Organization, “Maternal Mortality Fact Sheet”. Nov 2010. Available from: http://www.who.int/mediacentre/factsheets/fs348/en/. | |
Duenhoelter JH, Jimenez JM, Baumann G. Pregnancy performance of patients under fifteen years of age. Obstetrics and Gynecology. 1975;46(1):49–52. | |
Adolescent pregnancy : Issues in Adolescent Health and Development. Geneva: WHO; 2004. 92 4 159145 5. | |
Block RW, Saltzman S, Block SA. Teenage pregnancy. Adv Pediatr. 1981;28:75–98. | |
Montenegro H. Educacion sexual de ninos y adolescentes. [Sex education of children and adolescent]. Revista Medica de Chile. 2000;128(6):571–573. | |
Kilborn PT. Definition of abortion is found to vary abroad. The New York Times. November 24, 1999:A18. | |
Wang SC, Wang L, Lee MC. Adolescent mothers and older mothers: who is at higher risk for adverse birth outcomes? Public Health. 2012;126(12):1038–1043. | |
Fleming N, Ng N, Osborne C, et al. Adolescent pregnancy outcomes in the province of Ontario: a cohort study. Journal of Obstetrics and Gynaecology Canada: Jogc = Journal D’obstetrique et Gynecologie Du Canada: JOGC. 2013;35(3):234–245. | |
Blanc AK, Winfrey W, Ross J. New findings for maternal mortality age patterns: aggregated results for 38 countries. PloS one. 2013;8(4):e59864. | |
Oyuela-Garcia J, Hernandez-Herrera RJ. Psicoprofilaxis e indice de cesareas. [Psychoprophylaxis and the rate of cesarean section]. Revista Medica Del Instituto Mexicano Del Seguro Social. 2010;48(4):439–442. | |
Dabbas M, Al-Sumadi A. Cesarean section rate: much room for reduction. Clinical and Experimental Obstetrics and Gynecology. 2007;34(3):146–148. | |
Gueye MB. Une grossesse d’adolescente comporte de graves risques pour la mere et son enfant. [An adolescent pregnancy carries grave risk for the mother and her child]. Pop Sahel: Bulletin d’Information Sur la Population et le Developpement. 1990(13):14–16. | |
Ludwig H, Loeffler FE. Caesarean section on demand – an ethical dilemma. Archives of Gynecology and Obstetrics. 2001;264(4):169–170. | |
Practice Committee of American Society for Reproductive M. Obesity and reproduction: an educational bulletin. Fertility and sterility. 2008;90(Suppl 5):S21–S29. | |
McDonald SD, Han Z, Mulla S, et al. High gestational weight gain and the risk of preterm birth and low birth weight: a systematic review and meta-analysis. Journal of Obstetrics and Gynaecology Canada: Jogc = Journal D’obstetrique et Gynecologie Du Canada: JOGC. 2011;33(12):1223–1233. | |
Ricci E, Parazzini F, Chiaffarino F, Cipriani S, Polverino G. Pre-pregnancy body mass index, maternal weight gain during pregnancy and risk of small-for-gestational age birth: results from a case-control study in Italy. The Journal of Maternal-Fetal and Neonatal Medicine: the Official Journal of the European Association of Perinatal Medicine, the Federation of Asia and Oceania Perinatal Societies, the International Society of Perinatal Obstet. 2010;23(6):501–505. | |
Mamun AA, O’Callaghan M, Callaway L, Williams G, Najman J, Lawlor DA. Associations of gestational weight gain with offspring body mass index and blood pressure at 21 years of age: evidence from a birth cohort study. Circulation. 2009;119(13):1720–1727. | |
Beigelman A, Wiznitzer A, Shoham-Vardi I, Vardi H, Holtcberg G, Mazor M. [Premature delivery in diabetes: etiology and risk factors]. Harefuah. 2000;138(11):919–923. | |
Stotland NE, Hopkins LM, Caughey AB. Gestational weight gain, macrosomia, and risk of cesarean birth in nondiabetic nulliparas. Obstetrics and gynecology. 2004;104(4):671–677. | |
Abenhaim HA, Benjamin A. Higher caesarean section rates in women with higher body mass index: are we managing labour differently? Journal of Obstetrics and Gynaecology Canada: JOGC = Journal d’Obstetrique et Gynecologie du Canada: JOGC. 2011;33(5):443–448. | |
McIntyre SH, Newburn-Cook CV, O’Brien B, Demianczuk NN. Effect of older maternal age on the risk of spontaneous preterm labor: a population-based study. Health care for women international. 2009;30(8):670–689. | |
Fielding JE, Williams CA. Adolescant pregnancy in the United States: a review and recommendations for clinicians and research needs. American Journal of Preventive Medicine. 1991;7(1):47–52. | |
Kim WY, Huh JW, Lim CM, Koh Y, Hong SB. Analysis of progression in risk, injury, failure, loss, and end-stage renal disease classification on outcome in patients with severe sepsis and septic shock. Journal of Critical Care. 2012;27(1):104 e101–e107. | |
Pinto A, Tuttolomondo A, Di Raimondo D, Fernandez P, Licata G. Risk factors profile and clinical outcome of ischemic stroke patients admitted in a Department of Internal Medicine and classified by TOAST classification. International Angiology: A Journal of the International Union of Angiology. 2006;25(3):261–267. | |
Ray JG, Vermeulen MJ, Shapiro JL, Kenshole AB. Maternal and neonatal outcomes in pregestational and gestational diabetes mellitus, and the influence of maternal obesity and weight gain: the DEPOSIT study. Diabetes Endocrine Pregnancy Outcome Study in Toronto. QJM: Monthly Journal of the Association of Physicians. 2001;94(7):347–356. | |
Sebire NJ, Jolly M, Harris JP, et al. Maternal obesity and pregnancy outcome: a study of 287,213 pregnancies in London. International Journal of Obesity and Related Metabolic Disorders: Journal of the International Association for the Study of Obesity. 2001;25(8):1175–1182. | |
Tetui M, Ekirapa EK, Bua J, Mutebi A, Tweheyo R, Waiswa P. Quality of Antenatal care services in eastern Uganda: implications for interventions. The Pan African Medical Journal. 2012;13:27. | |
Forsblad K, Kallen K, Marsal K, Hellstrom-Westas L. Apgar score predicts short-term outcome in infants born at 25 gestational weeks. Acta paediatrica. 2007;96(2):166–171. | |
Carlo WA, Schelonka R. The outcome of infants with an Apgar score of zero at 10 minutes: past and future. American Journal of Obstetrics and Gynecology. 2007;196(5):422–423. |
 © 2014 The Author(s). This work is published and licensed by Dove Medical Press Limited. The full terms of this license are available at https://www.dovepress.com/terms.php and incorporate the Creative Commons Attribution - Non Commercial (unported, v3.0) License.
By accessing the work you hereby accept the Terms. Non-commercial uses of the work are permitted without any further permission from Dove Medical Press Limited, provided the work is properly attributed. For permission for commercial use of this work, please see paragraphs 4.2 and 5 of our Terms.
© 2014 The Author(s). This work is published and licensed by Dove Medical Press Limited. The full terms of this license are available at https://www.dovepress.com/terms.php and incorporate the Creative Commons Attribution - Non Commercial (unported, v3.0) License.
By accessing the work you hereby accept the Terms. Non-commercial uses of the work are permitted without any further permission from Dove Medical Press Limited, provided the work is properly attributed. For permission for commercial use of this work, please see paragraphs 4.2 and 5 of our Terms.