")
Back to Journals » Clinical, Cosmetic and Investigational Dermatology » Volume 12
Temporal shifts in the collective dermatologic microbiome of military trainees
Authors Gibbons TF, Noe JC , Patterson AT , Lenz BL, Beachkofsky TM
Received 24 May 2019
Accepted for publication 11 July 2019
Published 30 August 2019 Volume 2019:12 Pages 625—637
DOI https://doi.org/10.2147/CCID.S216993
Checked for plagiarism Yes
Review by Single anonymous peer review
Peer reviewer comments 3
Editor who approved publication: Dr Jeffrey Weinberg
Thomas F Gibbons,1 Jody C Noe,1 Andrew T Patterson,2 Brittany L Lenz,2 Thomas M Beachkofsky3
159th Medical Wing Science and Technology, Clinical Investigations and Research Support, San Antonio, TX, USA; 2Department of Dermatology, 59th Medical Wing, San Antonio, TX, USA; 3Department of Dermatology, 6th Medical Group, Tampa, FL, USA
Correspondence: Thomas M Beachkofsky
Department of Dermatology, MacDill AFB, Tampa, FL 33621, USA
Tel +1 813 827 9379
Email [email protected]
Background: New military members undergo a highly-regimented 7-week training course during which trainees live and work within the same group of approximately 50 subjects for nearly 24 hours a day. This creates an optimal environment for assessing the impact of communal living on the collective skin microbiome.
Purpose: The objective of this pilot study was to investigate dynamic changes of the skin microbiome in basic military trainees (BMT), in light of the unique environmental influences faced by this population.
Patients and methods: We evaluated collective changes in the skin microbiome of normal healthy adult basic trainees in response to communal living and universal Group A Strep prophylaxis with penicillin over the course of their initial 7-week training course. Samples from 10 flights of trainees were collected by swabbing upon arrival at Lackland AFB for their training (week 0) which is prior to prophylaxis with penicillin, at the 4 week point, and at the conclusion of their 7-week course of basic military training. Three separate high-throughput sequencing platforms and three bioinformatic pipeline analysis tools were utilized to assess the data.
Results: At all three time points we found that the top three bacterial genus identified were Propionibacterium, Staphylococcus, and Corynebacterium. We detected a community membership difference between the initial week 0 samples and the week 4 and 7 samples. A strong inverse correlation between Propionibacterium and Staphylococcus was noted with Propionibacterium being high at week 0 and much lower at weeks 4 and 7; conversely, Staphylococcus was low at week 0 and higher at weeks 4 and 7, this relationship was noted in both the individual and collective specimens.
Conclusion: The collective dermatologic microbiome in the military trainee population examined exhibited a relative increase in Staphylococcus and Corynebacterium abundance coupled with a relative decrease in Propionibacterium abundance in this observational pilot study. Additional studies are needed to further assess the causal impact of communal living and widespread penicillin chemoprophylaxis.
Keywords: metagenomics, 16S rRNA, prophylaxis, bacteria, penicillin
Introduction
The human body harbors numerous microbial communities consisting of bacteria, fungi, and viruses across various body surfaces including the skin, oral cavity, respiratory tract, gastrointestinal tract, and urogenital regions with a wide diversity of constituents depending on location.1 The skin microbiome contains a diverse microbial ecosystem that has yet to be fully characterized despite its potential role in contributing to host health and disease. As our scientific capacity for genetic, transcriptomic, and microbial sequencing has increased, we can now better characterize several of these areas and their susceptibility to external environmental influence; for example, colonic/gut flora’s susceptibility to change based on antibiotic administration and subsequent attempts to regain homeostasis via probiotics, stool transplantation, and other means. The NIH launched the Human Microbiome Project in an attempt to better characterize the “normal” human microbiota with specific emphasis on its contributions to both healthy and disease states. Using metagenomic sequencing, researchers have been able to analyze and identify the complex taxonomy and composition of these microorganism environments on the body, whereas traditional bacterial culture mediums often allow growth of only the most hardy, easily cultivatable organisms from a site and specific viral or fungal panels which can report on only a handful of selected pathogens.2
The skin represents one of the most prominent body areas sustaining microorganism colonies. Grice et al documented distinct dermatologic microbiome niches based on location even within the same individual and effectively established a barometer for topographical and temporal diversity of the human skin microbiome among healthy individuals.1 Kong et al further explored the relationship between dermatologic disease and the skin microbiome when they examined a group of children affected by atopic dermatitis (AD) and identified statistically significant alterations in their skin microbiome composition during flares as well as post-treatment.3 Notable decreases in microbial diversity during flares as well as an increase in Staphylococcus aureus proportions were observed. Significant decreases in community diversity have also been reported as hallmark signs of disease states by Oh et al.4 While this change in the proportion of the pathogenic organism S. aureus could be reasonably assumed, the high-resolution metagenomic sequencing also identified a proportional increase in other cutaneous bacteria such as Streptococcus, Propionibacterium, and Corynebacterium species during periods of disease improvement after topical corticosteroid therapy.3 This singular example of temporal diversity among the microbiota functions as an excellent demonstration of the presumed sensitivity of the dermatologic microbiome to outside influences and demonstrates that additional longitudinal studies are needed to further outline the unique disease pathophysiology associated with the microbiota of dermatologic conditions such as AD, psoriasis, acne, and others.
Military personnel are at an increased risk for skin and soft tissue infection (SSTI) development as a result of the unique environmental stressors faced during both combat and standard occupational locales. Several studies in particular have examined the increased propensity for SSTIs in the basic military trainee (BMT) population with one study documenting nasal carriage of S. aureus and methicillin-resistant S. aureus (MRSA) associated with an increased rate of SSTI.5 While it is reasonable to assume S. aureus and MRSA colonization play a significant role in the development of SSTI in this group, an estimated 40–50% of the general population have also been shown to be colonized by S. aureus suggesting a more complex interplay among both pathogenic and non-pathogenic microorganisms within the microbiome.6 Additional studies have examined various prophylactic hygiene regimens with an outcome measurement goal of reducing infection incidence rates, but no study has documented how the myriad of unique environmental variables encountered by the BMT population such as living in close quarters with the same group of peers for an extended period of time or the administration of universal prophylactic antibiotics influence the dermatologic microbiome.7 Determining how the skin flora of our BMT population evolves in response to these stressors provides a baseline determination for the propensity these military members may have for developing dermatologic conditions such as SSTI, contact dermatitis, acne, and others once those at-risk microbiota skin signatures have been further elucidated.
With the emergence of metagenomic sequencing and its ability to rapidly and cost-effectively characterize the entire skin microbiota composition of the dermatologic communities at various sites, increased attention in the literature has been placed on characterizing the association of microbiome changes with common skin conditions. While other studies have documented the variability of the cutaneous microbiome across locations in an individual and across time in certain dermatologic disease states, our BMT population affords a rare opportunity to assess for the impact of communal living as well as systemic antibiotic administration on the collective skin microbiome in the highly regulated environment associated with military training. To our knowledge, no study to date has established the effect of systemic antibiotic administration on the skin microbiome. Our BMT population of generally healthy young subjects at Lackland Air Force Base universally receives antibiotics in the form of intramuscular penicillin in the non-allergic majority of the population to prevent outbreaks of Group A Streptococcal (GAS) pharyngitis.8 In addition to this universal antibiotic chemoprophylaxis, there is the added scientific benefit of minimizing confounding variables due to the limited number of outside influences affecting the subjects that would need to be accounted for in a similarly designed civilian study. Assessing for microbiome skin changes after systemic antibiotic exposure will offer a useful baseline for future researchers and providers to take into consideration as the use of antibiotics in today’s society continues to rise. Additional information gleaned from the influence of communal living on skin microbiota changes may have wide-ranging ramifications for not only military personnel but also college dorms, prisons, athletic locker rooms, and other situations where suboptimal hygiene conditions also exist and community-acquired diseases may cause a significant health burden.
Materials and methods
Study population
Ten groups (referred to as flights) of new BMT flights, 6 male and 4 female, encompassing an estimated 500 participating subjects were swabbed. Each flight was composed of between 30 and 50 trainees.
Sample collection
Subjects had sterile saline pre-moistened Copan Flocked Swabs (Copan, Murrieta, CA, USA; Cat# 501CS01) taken from the bilateral forearms and forehead at 3 time points – week 0, week 4, and week 7 of their training curriculum. Subjects with reported penicillin allergy were excluded from the study. Skin swabs were pooled, by flight and time point, into 5.5 mL of DNA/RNA Shield (Zymo Research Corp., Irvine, CA, USA; Cat# R1100-50) – described as “Collective” samples. Additionally, one flight had duplicate sterile swabs collected, for the collective samples above and the other for individual sample assessments – described as “Individual” samples. Individual samples were collected into 0.5 mL of DNA/RNA shield.
DNA extraction and purification
DNA was extracted from all collective and individual samples using the ZymoBIOMICS™ DNA Microprep Kit (Zymo Research Corp.; Cat# D4301). All manufacturer’s recommendations for low biomass samples were utilized with the following modifications for the collective specimens only. Collective specimens were extracted in duplicate and the DNA combined to maximize final concentration. Purified genomic DNA was stored at ≤−20°C until used for library preparation.
Collective sample sequencing
The hypervariable regions of the rRNA gene were sequenced utilizing the Ion 16S Metagenomics kit (ThermoFisher, Waltham, MA, USA; Cat# A26216) following the manufacturer’s protocol. Five microliters of swab-extracted DNA were amplified for each primer set. Amplicon libraries were prepared using the Ion Plus Fragment Library Kit (ThermoFisher, Cat# 4471252) and molecularly barcoded with IonXpress Barcode Adapters (ThermoFisher, Cat# 4471250) as described in the Metagenomics kit protocol. Amplified DNA was quantified with a Fragment Analyzer (Advanced Analytical, Ankeny, IA, USA) using their High Sensitivity NGS Fragment Analysis Kit (Cat# DNF-474-0500); 50 ng/μL of amplified DNA was used for barcode adaptor ligation for the pool samples. Barcoded libraries were quantified using the Fragment Analyzer using the High Sensitivity NGS Fragment Analysis Kit. Equimolar amounts of each library were used to seed an Ion PGM Hi-Q View OT2 (ThermoFisher, Cat# A29900) reaction and enriched using the Ion OneTouch ES system. Enriched, templated beads were loaded onto an Ion Torrent 318 V2 chip (ThermoFisher, Cat# 4488146) and sequenced using the Ion PGM Hi-Q View Sequencing kit (ThermoFisher, Cat# A30044).
Individual sample sequencing
The V3 and V4 hypervariable regions of the rRNA gene were tested as described in the Illumina (SanDiego, CA, USA) 16S Metagenomics Sequencing Library Protocol (15044223 B). The gene-specific sequences used in this protocol target the 16S V3 and V4 region. They are selected from the Klindworth et al publication.9 Illumina adapter overhang nucleotide sequences (see underlined portion of primer) are added to the gene-specific sequences. 16S Forward Primer = 5ʹ-TCGTCGGCAGCGTCAGATGTGTATAAGAGACAGCCTACGGGNGGCWGCAG 16S Reverse Primer = 5ʹ-GTCTCGTGGGCTCGGAGATGTGTATAAGAGACAGGACTACHVGGGTATCTAATCC. The following modifications to the protocol were included: 7.5 μL of swab-extracted DNA was amplified with 2.5 μL of 2 μM forward and reverse primers and KAPA HiFi HotStart Ready Mix (Roche, Indianapolis, In, USA, Cat# KK2602). Samples were molecularly barcoded with Nextera WT Indes Kit v2 Set A (Illumina, Cat# FC-131-2001) as described in the 16S Metagenomics Sequencing Library Protocol. Indexed libraries were quantified on the Fragment Analyzer using the High Sensitivity NGS Fragment Analysis Kit. Each sample was normalized to 1 nM, pooled and denatured using 5 μL of pooled library and 5 μL of 0.2 N NaOH. PhiX control was denatured as described; 200 μL of 20 pM PhiX Control and 400 μL of 5pM diluted library were combined and used for loading on the MiSeq.
16S rRNA sequence data analysis
DNA sequences were processed using Ion Reporter Software 5.0, 16S Metagenomics workflow version 1.0. (ThermoFisher), BaseSpace Onsite 16S Metagenomics App version 1.0.1 (Illumina) and QIIME2-2018.4 (https://qiime2.org). Collective sample data analysis was performed using the Ion Reporter Software which leverages QIIME’s open-source bioinformatics pipeline to produce diversity analyses and visualizations. Unaligned binary data files (Binary Alignment Map) generated by the Ion Torrent PGM were uploaded to an in-house Ion Reporter server (ThermoFisher) and analyzed using default settings. The genus level operational taxonomic unit (OTU) from the ION Reporter analysis of consensus reads was copied to an excel where all results were normalized by converting OTUs for each sample to a percentage of the reads for a given sample. Any OTU with <0.1% reads from a given sample were excluded. Resulting OTUs for each sample were utilized to construct Venn diagrams and relative concentrations of specific phylotypes. Inverse Simpson’s for alpha diversity was calculated by Ion Reporter as was Beta diversity principal-coordinate analysis (PCoA) showing the variation of microbiomes at specified time points. Individual sample data analysis was performed using the BaseSpace Onsite 16S Metagenomics App. The genus level OTU from the 16S Metagenomics App was imported to excel where the results were normalized by converting OTUs for each sample to a percentage of the reads from the sample. Any OTU with <0.1% reads from a given sample were excluded. Resulting OTUs for each sample were utilized to construct Venn diagrams and relative concentrations of specific phylotypes. Inverse Simpson’s for alpha diversity was calculated from OTU data as reported by the 16S Metagenomics App. Beta diversity PCoA showing the variation of microbiomes at specified time points was produced with QIIME2. The raw sequencing data have been uploaded to the National Center for Biotechnology Information database under the BioProject SRA accession: PRJNA543597.
Results
Sequencing results
Three separate high-throughput sequencing platforms (PGM, NextSeq, MiSeq) and three bioinformatic pipeline analysis tools (Ion Reporter, Base Space App, QIIME2) were utilized to assess the data. Using the PGM platform, next-generation sequencing (NGS) from 30 total collective samples (3 time points from 10 flights) was conducted over two separate sequencing reactions. Three flights were ultimately excluded because a single time point did not produce results sufficient for analysis. Complete sequencing results from seven flights (21 collective samples) yielded a total of 8,352,499 raw sequences. Each collective sample had approximately 397,738 reads (range 201,876–749,856 reads) with an average read length of 255 base pairs (bp) (range 243–370 bp). From a single flight, 15 individual subjects, each with three individual weeks 0, 4, and 7 samples were processed for NGS on a single sequencing platform (MiSeq) reaction. Extraction of individual specimens yielded very low amounts of DNA and only 10 subjects yielded high-quality results at all 3 time points. A high-quality result was one in which rarefaction curves (data not shown) represented the total microbiota within each sample. These 30 individual samples produced 1,959,154 high-quality sequences after quality filtering. In total, each sample had approximately 65,305 reads (range 21,692–102,547 reads) with an average read length of 450 bp (range 299–479 bp). NGS from collective and individual specimens were also conducted on the NextSeq for comparative purposes.
Temporal microbiota phylotypes
The number of genera revealed by microbial profiling varied greatly with the collection method (pooled vs individual samples), sequencing platform and bioinformatics pipeline utilized. The difference was especially large prior to omitting reads in each specimen that represented <0.1% of the total mapped reads. Prior to omitting low reads on a per specimen basis, microbial profiling of the collective specimens with the PGM and Ion Reporter at the various time points revealed a total of 142 genera with an average of 37, 52, and 40 genera at the 0, 4, and 7 weeks collection times, respectively. When filtering for only genera that represent 0.01% of mapped reads for any given specimen, the total number of genera decreased to 98 with an average number of genera of 28, 39, and 29 at the same time points (weeks 0, 4, and 7). Further filtering for genera that produced a read representing at least 0.1% resulted in a total of 32 unique genera with weekly averages of 8, 12 and 9 (for weeks 0, 4, and 7, respectively). Microbial profiling of the individual specimens with MiSeq NGS platform and the QIIME2 analysis pipeline resulted in 261 total genera with an average of 50, 33 and 39 genera at the same time points in the 10 individual specimens. When utilizing the QIIME2 pipeline, we employed the QIIME2 dada2 denoise-paired option to denoise, dereplicate, and filter chimeras from the sequence data. Utilizing this step resulted in the same 261 genera after filtering for those that represent 0.01% of mapped reads. Further filtering to genera that produced a read representing at least 0.1% resulted in a total of 181 unique genera with weekly averages of 33, 24 and 29 (for weeks 0, 4, and 7, respectively). Collective and Individual specimens were also analyzed with the BaseSpace 16S app which produced much higher total genera identified as well as much higher genera at each the 0, 4, and 7 weeks time points in the unfiltered and 0.01% filtered counts. Once the reads were filtered to only those at 0.1% or more the results became much closer (Figure 1) to those found with the PGM Ion Reporter and QIIME2 bioinformatics pipelines.
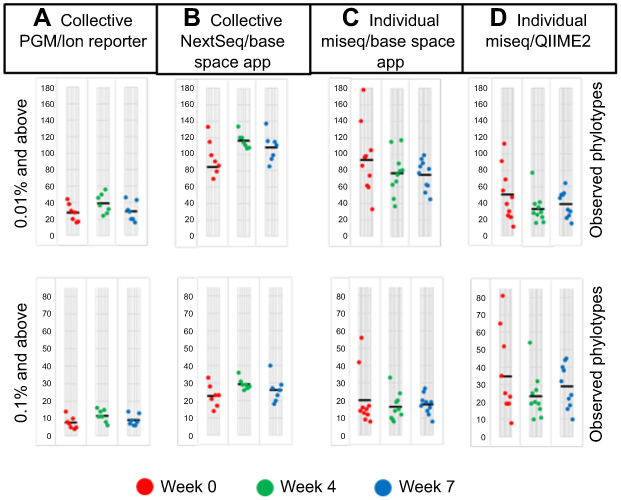 |
Figure 1 Number of phylotypes with 0.01% or 0.1% reads or more per sample. Each circle represents a single flight (A and B), or an individual sample (C and D). Mean values are indicated by a solid black line. |
Temporal microbiota characterization
While more genera were identified in the individual specimens, the overall signatures for both the collective and individual specimens were similar and chiefly represented by three genera: Propionibacterium, Staphylococcus and Corynebacterium. In the individual specimens, the species of Propionibacterium was Propionibacterium acnes, while Staphylococcus and Corynebacterium were only classified to the genus level; 33% of the reads classified by QIIME2 were Staphylococcus. Although these reads were not able to be confidently classified to the species level, we investigated the likelihood of these reads being S. aureus by comparing the top 10 reads to a reference strain of S. aureus, Staphylococcus epidermidis and Staphylococcus hominis. These top 10 reads comprised 85% of the Staphylococcus reads, and in all cases, S. aureus had the least amount of homology to the selected reference species (Figure 2). Propionibacterium, Staphylococcus and Corynebacterium genera comprise three of the seven genera most often found in other skin microbiome studies of similar sites.10 Heat maps representing the 32, 60, 122 and 181 identified phylotypes illustrate the similarities of both the collective and individual specimens regardless of the sequencing platform and bioinformatic pipeline utilized (Figures 3 and 4). The number of phylotypes present at each time point is shown in Venn diagrams for each specimen type and processing pipeline (Figure 5). A closer inspection of the genera identified at each of these specific time points was conducted for both the PGM/Ion Reporter (collective specimen analysis) and the MiSeq/QIIME2 (individual specimen analysis). While many phylotypes were noted only at a particular time point, none of the changes were consistently observed across multiple platforms (Figure 6).
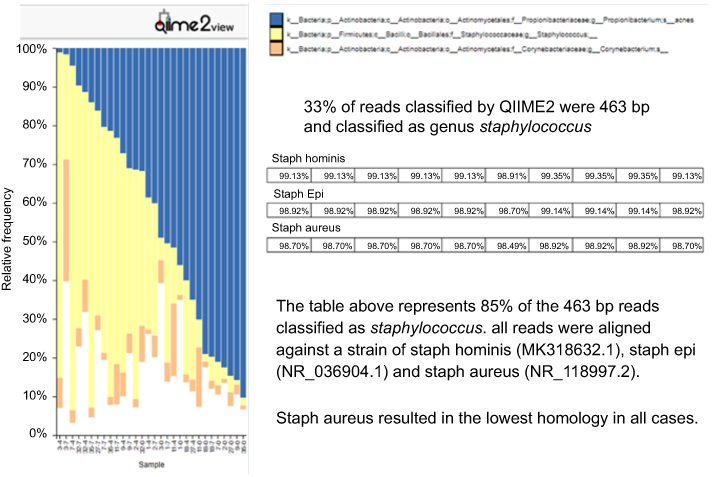 |
Figure 2 QIIME2 view of top three bacterial genera identified in individual specimens. Only Propionibacterium was classified to the species level. The top 10 Staphylococcus reads were aligned against three species of Staphylococcus; Staph aureus gave the lowest homology. |
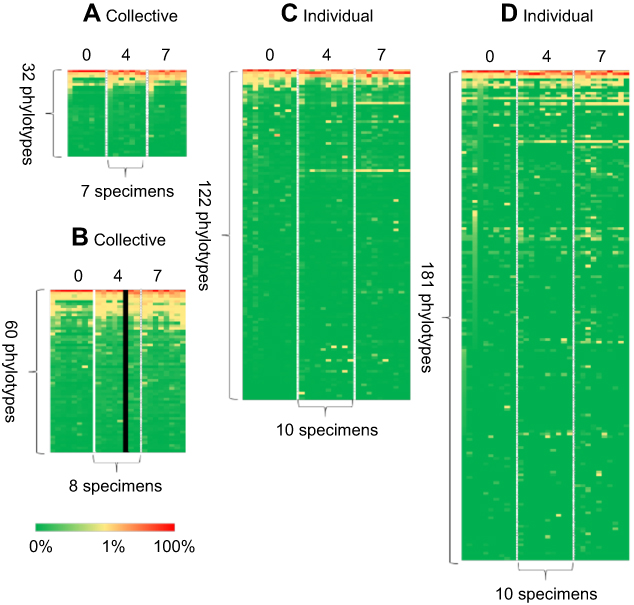 |
Figure 3 Heat maps showing the percentage distribution of phylotype levels at the 0, 4 and 7 weeks time points. Each row contains 7, 8 or 10 specimens. Each column contains 32, 60, 122 or 181 phylotypes. Percent abundance value of each genus is described by the color key: (A) PGM/Ion Reporter, (B) NextSeq/BaseSpace App, (C) MiSeq/BaseSpace App and (D) MiSeq/QIIME2. |
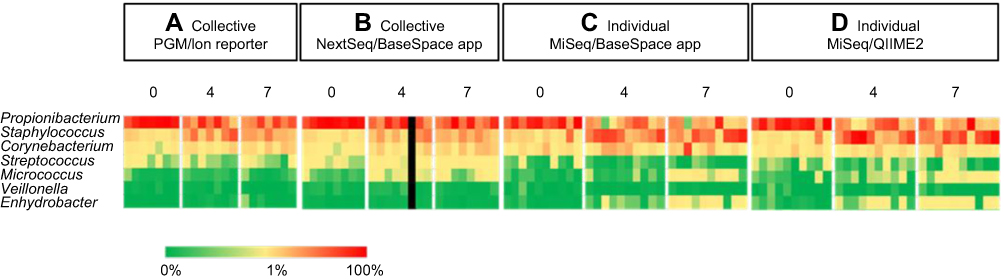 |
Figure 4 Select genus from heat maps. These 7 phylotypes represent the most common found in other skin microbiome studies of similar sites. Percent abundance value of each genus is described by the color key. |
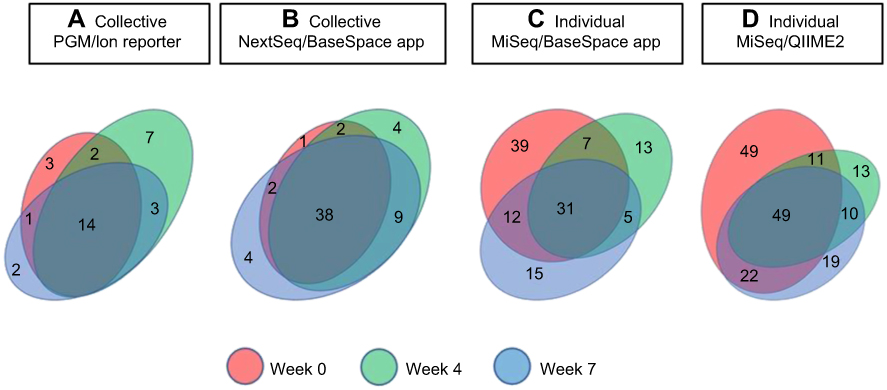 |
Figure 5 Phylotype distribution levels at different time points. Venn diagram showing the number of phylotypes at each time point for collective (A, B) and individual specimens (C, D). Values within overlapping circles represent phylotypes shared among different time points. |
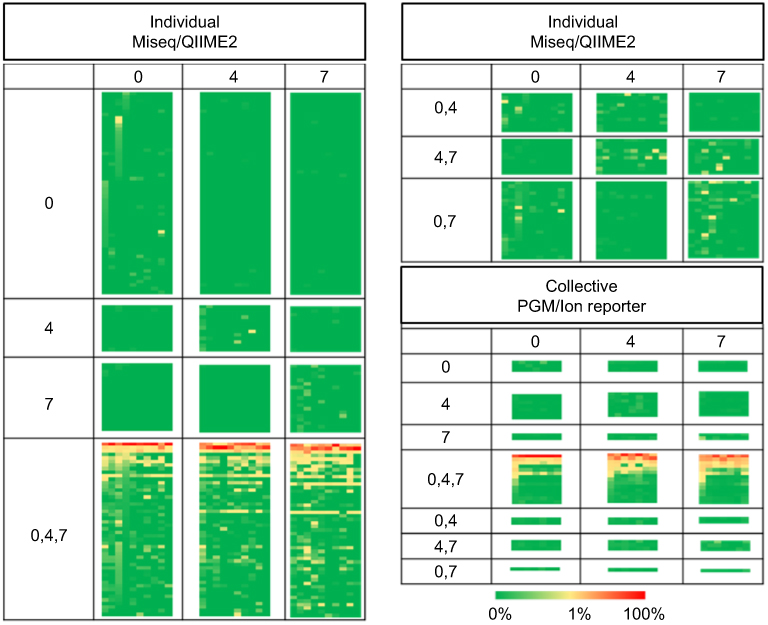 |
Figure 6 Heat maps of individual and collective samples. This is the same heat map represented in Figure 3A and D with the phylotypes divided into patterns of temporal occurrence illustrated by the relative Venn diagrams represented in Figure 5A and D. |
Temporal microbiota diversity
When overall diversity was assessed using the inverse Simpson (invsimpson) index, the phylotypes showed little change in diversity overtime (Figure 7). While little change was noted in the alpha diversity at the weeks 0, 4 and 7 collection times, beta diversity analyses indicated a unique microbial composition of the week 0 specimens, this was more pronounced in the individual specimens. PCoA of the Bray–Curtis distance matrix revealed clear separation of the week 0 specimens from the weeks 4 and 7 specimens (Figure 8).
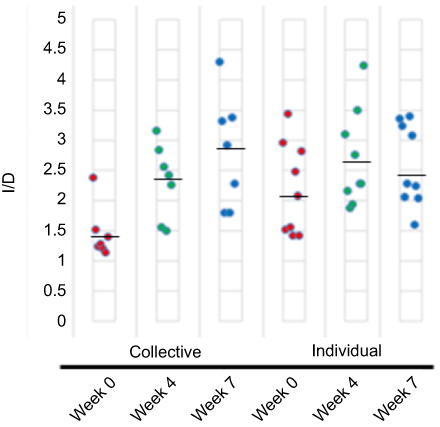 |
Figure 7 Sample diversity as determined using the invsimpon index (1/D). Each circle represents a single flight for collective sampling subject (PGM) or an individual for individual sampling (MiSeq) and the mean values are indicated by a solid black line. The higher the value, the more diverse the sample. |
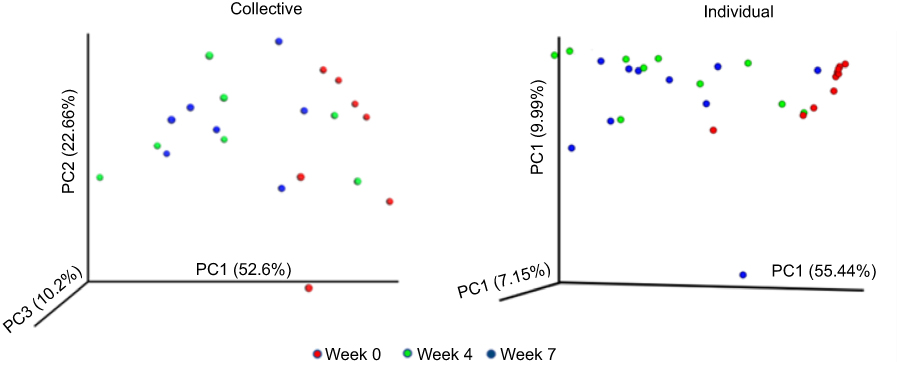 |
Figure 8 Principal-coordinate analysis (PCoA) showing the variation of microbiomes at time points as determined using the Bray–Curtis diversity calculator. Each colored symbol corresponds to an individual sample. The variation represented by each axis (PC1, PC2, or PC3) is shown in parentheses. (A) Collective samples (PGM) and (B) individual samples (MiSeq). |
Microbial composition impact on Staphylococcus compared to Propionibacterium
To look for possible impacts of the overall microbiome composition on the relative amounts of Staphylococcus, we compared the abundance of the top three organisms, Propionibacterium, Staphylococcus, and Corynebacterium in both the PGM/Ion Reporter collective specimens and the MiSeq/QIIME2 individual specimens. When the abundance of Staphylococcus is plotted against the abundance of Propionibacterium a very strong inverse relationship is noted. Propionibacterium levels are relatively high at week 0 and lower at weeks 4 and 7 in both the collective and individual specimens while the opposite is noted with Staphylococcus. The coefficient of determination for this inverse relationship is r2=0.8581 for the collective specimens and r2=0.781 for the individual specimens (Figure 9).
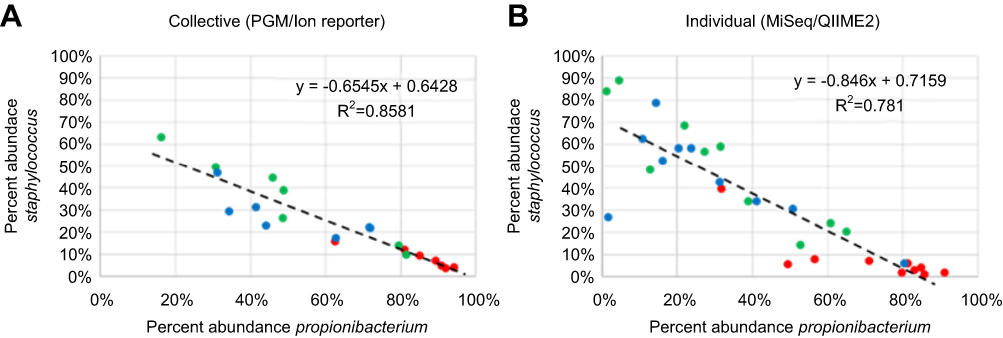 |
Figure 9 Percent abundance of Propionibacterium compared to abundance of Staphylococcus for week 0 (red), week 4 (green) and week 7 (blue). Each symbol corresponds to a collective ((A) PGM/Ion Reporter) or an individual ((B) MiSeq/QIIME2) sample. Line and inset equation represents the line of best fit [y=slope(X) + y intercept]. R2 = coefficient of determination. |
Additional microbial composition comparisons
Abundance plots of Staphylococcus and Corynebacterium as well as Corynebacterium and Propionibacterium were also compared (Figure 10). A positive correlation of Staphylococcus and Corynebacterium was noted in the collective specimens but this was not noted in the individual specimens. A negative correlation of Propionibacterium and Corynebacterium was noted in the collective specimens but again this was not noted at the same level in the individual specimens.
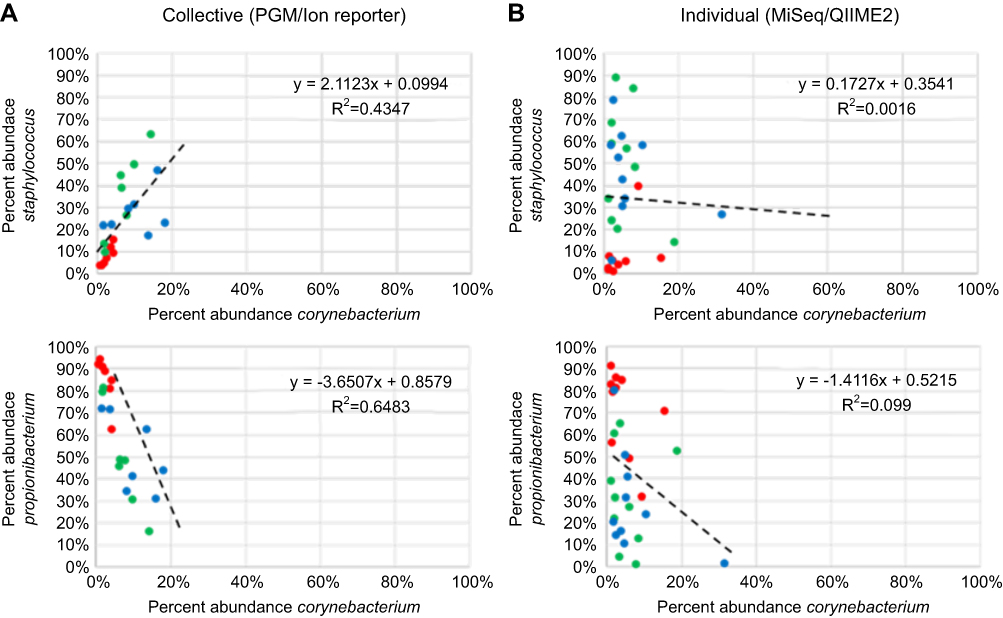 |
Figure 10 Percent abundance of Staphylococcus and Corynebacterium as well as Propionibacterium compared to Corynebacterium for week 0 (red), week 4 (green) and week 7 (blue). Symbols, line and inset equation represented as in Figure 9. |
Collective versus individual sampling
To assess the impact of collective sampling, we compared the results from the one group that had both collective and individual samples. To minimize confounding variables for this comparison the number and amounts of phylotypes were both determined from the same NGS analyzer (NextSeq) and from the same BaseSpace 16S App. After filtering for genera that represent 0.1% of mapped reads or more, the total number of genera in the week 0 collective specimen was 20 while the number of genera in the 10 individual specimens that were part of the collective specimen was 89. A similar difference was noted in the week 7 collective specimen with 32 genera, while 61 genera were noted in the 10 individual specimens. With respect to the percent amount of the seven most common genera found in similar microbiome studies, the collective sample result (dashed line in Figure 11) was within 5% of the average individual result (solid line in Figure 11) for 12 of the 14 comparisons. The two outliers were the week 0 Propionibacterium with an 8% higher amount in the collective samples and the week 7 Staphylococcus specimens with a 16% higher amount in the individual samples. Heat map comparisons of the same data from these 7 genera also depict the impact of collective sampling (Figure 9). With respect to these genera, all 7 were detected at the 0.1% cutoff in at least one of the individual specimens, but when these specimens are pooled prior to analysis only 5 of 7 are detected at 0.1% or higher level. Both Veillonella and Enhydrobacter have collective results with <0.1% of the reads for the respective collective samples.
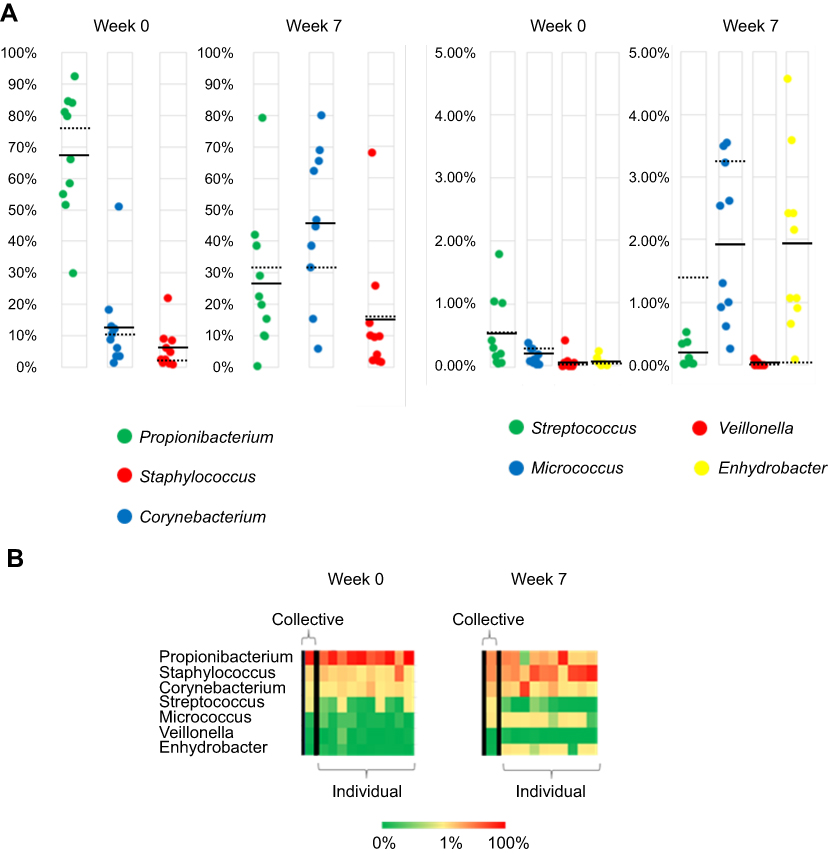 |
Figure 11 (A) Percent abundance of 7 phylotypes of bacteria at two collected time points as determined by BaseSpace 16S app for both individual and collective sampling. Each circle represents a single subject and the mean values are indicated by a solid black line. Dashed line is the value from collective sample. (B) Heat map of same 7 phylotypes with collective sample at left for both weeks 0 and 7. |
Discussion
The results of this study found similar composition patterns of bacteria in our cutaneous samples as those previously noted in other skin microbiome studies.4,10,11 Although the same genera of bacteria were identified, importantly our study population did not show the temporal stability of the genera of the skin microbiome that has been previously noted in healthy individuals.4 Instead, our population exhibited a rapid change in the collective microbiome composition from week 0 to weeks 4 and 7 time points as indicated in the beta diversity results. Presumably, this change was due at least in part to a strong negative correlation between Staphylococcus and Propionibacterium. The week 0 subjects’ microbiome consisted of high levels of Propionibacterium and low levels of Staphylococcus, with the reverse occurring in the microbiota signatures at weeks 4 and 7. It is possible that this change in the microbiome is at least in part in response to the GAS chemoprophylaxis provided during week 0 of training. However, it is unknown whether this microbiome shift may also occur in the absence of chemoprophylaxis with exposure to other factors such as communal living in a rigorous training environment. A similar correlation between S. aureus and P. acnes levels has been noted between lesional and non-lesional AD.12 Authors found higher amounts of S. aureus and lower amounts of P. acnes in lesional skin compared to non-lesional skin. In our population, it is unknown if this change in the skin microbiome, specifically the increase in Staphylococcus or the decrease in Propionibacterium, is likely to decrease or increase protection against the development of SSTIs. With this pilot study, the QIIME2 identification of Staphylococcus was limited to the genus level. There are competing mechanisms both for and against an increase in a pathogenic organism such as S. aureus. Although we were not able to fully identify the Staphylococcus to the species level, the alignment results of the most prominent Staphylococcus reads which represented 85% of the Staphylococcus showed more homology with S. hominis than S. aureus which indicates that there is likely not a large increase in S. aureus. Propionibacterium was identified to the species level with P. acnes being identified in our samples. P. acnes has been shown to promote and inhibit the growth of S. aureus. P. acnes, produces a small molecule, coproporphyrin III, which promotes S. aureus aggregation and biofilm formation.13 In other studies, P. acnes has been shown to inhibit S. aureus growth by producing propionic acid.12
Collective sampling did approximate the average microbiome of the aggregate of individual samples but with a loss in granularity. Fewer phylotypes were identified in the collective samples than in the corresponding individual specimens. While the results from the collective sample should not be interpreted as the average microbiome from the individuals in the sample, the collective samples did correspond well with the inverse correlation of Propionibacterium and Staphylococcus in this study. Future additional validation studies utilizing collective samples may prove to be a rapid cost-effective method to monitor for large shifts in the dermatologic microbiome in the BMT and other populations. There were instances where the collective results were contradictory to the individual samples. This was the case when examining the relationship of Staphylococcus and Corynebacterium, which highlights one of the limitations of collective sampling. While the cause of this observation is not fully understood, pooling of samples may result in fewer phylotypes represented than those actually present in certain individuals due to the threshold required for detection in sequencing analysis. This under representation of phylotypes may lead to erroneous results in some cases. Even with this limitation of collective sampling, pooling samples have been successfully utilized in the past, and may prove to be a technique worth further investigation with respect to its utility in metagenomics screening of large populations. Screening samples for the presence of an agent is a procedure commonly used to reduce the cost of screening a large number of individuals for infectious diseases.14 HIV screening of pooled blood has been validated for both antibody screening and nucleic acid screening of blood with little loss in sensitivity or specificity.15,16
There are several limitations to our small, pilot study. Our analysis represents a mere 3 time points over the course of 7 weeks, providing only snapshots of the microbiome’s evolution over that period. Our young, generally healthy study population may not reflect potential microbiome changes to the general population that would occur in similar circumstances. The study was performed in an isolated location (south Texas) and season (summer) which may not take into account humidity/weather/temperature influence on cutaneous microbial change. In addition, this study design did not control for incidental antibiotic administration that may have occurred during the course of training or variations in personal hygiene. Due to the large number of subjects, individuals were asked to self-swab specified sites to obtain samples. Skin swabs were obtained from easily accessible body sites on each individual (forehead/forearms), but do not account for niche-specific changes to the axillae, groin, and other body areas. The microbiome of forehead and forearm was combined to one sample, and other studies have shown that there are differences in the microenvironments of these two sites.10 While the genera level data trends are intriguing, we were unable to reach species-level classification of reads with our targeted 16S rRNA approach and as a result, our analysis is limited by our taxonomic resolution capacity. While several intriguing trends were observed, our observational study was not designed to determine the causality of the changes noted.
Conclusion
The collective dermatologic microbiome in the military trainee population examined exhibited a relative increase in Staphylococcus and Corynebacterium abundance coupled with a relative decrease in Propionibacterium abundance in this observational pilot study. Additional studies are needed to further assess the causal impact of communal living and widespread penicillin chemoprophylaxis. The cutaneous microbiome is dynamic in nature and involves a complex interplay between host and skin microbes as well as external influences. Targeted metagenomic sequencing may help elucidate the linkage between cutaneous dysbiosis and its clinical impact on dermatologic disease.
Acknowledgment
We thank Dr Laura Munro, Dr Bryant Webber, Col. William Fischer, and all the BMT leadership; Lt Col. Ruth Brenner and the AFMSA team; Kimberly Murphy; the 59th Medical Wing Science & Technology Division. This work was funded by the Air Force Medical Support Agency (AFMSA/SG5M).
Disclosure
This research was reviewed and approved by the 59th MDW Institutional Review Board as minimal risk human research. The views expressed are those of the authors and do not reflect the official views or policy of the Department of Defense or its Components. The views of the manufactures are not necessarily the official views of, or endorsed by, the US Government, the Department of Defense, or the Department of the Air Force. No Federal endorsement of manufactures is intended. The voluntary, fully informed consent of the subjects used in this research was obtained as required by 32 CFR 219 and DODI 3216.02_AFI 40-402. Dr Andrew T Patterson is employed as an active duty member of the United States Air Force. The authors report no conflicts of interest in this work.
References
1. Grice EA, Segre JA. The skin microbiome. Nat Rev Microbiol. 2011;9(4):244–253. doi:10.1038/nrmicro2537
2. Conlan S, Kong HH, Segre JA. Species-level analysis of DNA sequence data from the NIH human microbiome project. PLoS ONE. 2012;7(10):e47075. doi:10.1371/journal.pone.0047075
3. Kong HH, Oh J, Deming C, et al. Temporal shifts in the skin microbiome associated with disease flares and treatment in children with atopic dermatitis. Genome Res. 2012;22:850–859. doi:10.1101/gr.131029.111
4. Oh J, Byrd AL, Deming C, Conlan S, Kong HH, Segre JA. Biogeography and individuality shape function in the human skin metagenome. Nature. 2014;514:59–64. doi:10.1038/nature13786
5. Johnson RC, Ellis MW, Lanier JB, Schlett CD, Cui T, Merrell DS. Correlation between nasal microbiome composition and remote purulent skin and soft tissue infections. Infect Immun. 2015;83:802–811. doi:10.1128/IAI.02664-14
6. Fanelli M, Kupperman E, Lautenbach E, Edelstein PH, Margolis DJ. Antibiotics, acne, and Staphylococcus aureus colonization. Arch Dermatol. 2011;147:917–927. doi:10.1001/archdermatol.2011.67
7. Ellis MW, Schlett CD, Millar EV, et al. Hygiene strategies to prevent methicillin-resistant Staphylococcus aureus skin and soft tissue infections: a cluster-randomized controlled trial among high-risk military trainees. Clin Infect Dis. 2014;58:1540–1548. doi:10.1093/cid/ciu166
8. Webber JB, Keiffer HW, White BK, Hawksworh AW, Graf PC, Yun HC. Chemoprophylaxis against group A streptococcus during military training. Prev Med. 2019;118:142–149. doi:10.1016/j.ypmed.2018.10.023
9. Klindworth A, Pruesse E, Schweer T, et al. Evaluation of general 16S ribosomal RNA gene PCR primers for classical and next-geneartion sequincing-based diversity studies. Nucleic Acids Res. 2013;41:1–11. doi:10.1093/nar/gks1039
10. Byrd AL, Belkaid Y, Segre JA. The human skin microbiome. Nature Rev Microbiol. 2018;6:143–155. doi:10.1038/nrmicro.2017.157
11. Meisel JS, Hannigan GD, Tyldsley AS, et al. Skin microbiome surveys are strongly influenced by experimental design. J Invest Dermatol. 2016;136:947–956. doi:10.1016/j.jid.2016.01.016
12. Francuzik W, Franke K, Schumann RR, Heine G, Worm M. Propionibacterium acnes abundacne correlates inversely with Staphylococcus aureus: data from atopic dermatitis skin microbiome. Acta Derm Venereol. 2018;98:490–495. doi:10.2340/00015555-2896
13. Wollenber MS, Claesen J, Escapa IF, Aldridge KL, Fischbach MA, Lemon KP. Propionibacterium-produced coproporphyrin III iinduces Staphylococcus aureus aggregation and biofilm formation. mBIO. 2014;5(4):e01286–14.
14. Bilder CR, Tebbs JM. Pooled testing procedures for screening high volume clinical specimens in heterogenous populations. Stat Med. 2012;27:3261–3268. doi:10.1002/sim.5334
15. Mehta SR, Nguyen VT, Osorioa G, Littlea S, Smitha DM. Evaluation of pooled rapid HIV antibody screening of patients admitted to a San Diego hospital. J Virol Methods. 2011;174:94–98. doi:10.1016/j.jviromet.2011.04.002
16. Pilcher CD, Fiscus SA, Nguyen TQ, et al. Detection of acute infection during HIV testing in North Carolina. N Engl J Med. 2005;352:1873–1883. doi:10.1056/NEJMoa042291
 © 2019 The Author(s). This work is published and licensed by Dove Medical Press Limited. The full terms of this license are available at https://www.dovepress.com/terms.php and incorporate the Creative Commons Attribution - Non Commercial (unported, v3.0) License.
By accessing the work you hereby accept the Terms. Non-commercial uses of the work are permitted without any further permission from Dove Medical Press Limited, provided the work is properly attributed. For permission for commercial use of this work, please see paragraphs 4.2 and 5 of our Terms.
© 2019 The Author(s). This work is published and licensed by Dove Medical Press Limited. The full terms of this license are available at https://www.dovepress.com/terms.php and incorporate the Creative Commons Attribution - Non Commercial (unported, v3.0) License.
By accessing the work you hereby accept the Terms. Non-commercial uses of the work are permitted without any further permission from Dove Medical Press Limited, provided the work is properly attributed. For permission for commercial use of this work, please see paragraphs 4.2 and 5 of our Terms.