")
Back to Journals » International Journal of Chronic Obstructive Pulmonary Disease » Volume 15
Temperature Variability and Hospital Admissions for Chronic Obstructive Pulmonary Disease: Analysis of Attributable Disease Burden and Vulnerable Subpopulation
Authors Zhan ZY, Tian Q, Chen TT, Ye Y, Lin Q, Han D , Ou CQ
Received 12 May 2020
Accepted for publication 12 August 2020
Published 22 September 2020 Volume 2020:15 Pages 2225—2235
DOI https://doi.org/10.2147/COPD.S260988
Checked for plagiarism Yes
Review by Single anonymous peer review
Peer reviewer comments 2
Editor who approved publication: Dr Richard Russell
Zhi-Ying Zhan,1,2,* Qi Tian,3,* Ting-Ting Chen,1,* Yunshao Ye,3 Qiaoxuan Lin,3 Dong Han,1 Chun-Quan Ou1
1State Key Laboratory of Organ Failure Research, Department of Biostatistics, Guangdong Provincial Key Laboratory of Tropical Disease Research, School of Public Health, Southern Medical University, Guangzhou, People’s Republic of China; 2Department of Health Care Management and Social Medicine, School of Public Health, Fujian Medical University, Fuzhou, People’s Republic of China; 3Department of Information Resources, Guangzhou Health Information Center, Guangzhou, People’s Republic of China
*These authors contributed equally to this work
Correspondence: Chun-Quan Ou Email [email protected]
Purpose: Chronic obstructive pulmonary disease (COPD) is a major cause of chronic diseases causing considerable social and economic burden globally. Despite substantial evidence on temperature-COPD association, few studies have investigated the acute effect of temperature variability (TV), a potential trigger of exacerbation of COPD disease, and it remains unknown what fraction of the disease burden of COPD is attributable to TV.
Patients and Methods: Based on 71,070 COPD hospitalizations during 2013– 2015 in Guangzhou, China, we conducted a time-series analysis using quasi-Poisson regression to assess the association between TV and hospital admission for COPD after adjusting for daily mean temperature. Short-term TV was captured by the standard deviation of hourly or daily temperatures across various exposure days. We also provided the fraction (total number) of COPD attributable to TV. Stratified analyses by admission route, sex, age, occupation, marital status and season were performed to identify vulnerable subpopulations.
Results: We found a linear relationship between TV and COPD hospitalization, with a 1°C increase in hourly TV and daily TV associated with 4.3% (95%CI: 2.2– 6.4) and 4.0% (2.3– 5.8) increases in COPD, respectively. The greater relative risks of TV identified males, people aged 0– 64 years, blue collar, and divorced/widowed people as vulnerable population. There were 12.0% (8500 cases) of COPD hospitalization attributable to hourly TV during the study period. Daily TV produced similar estimates of relative effects (relative risk) but grater estimates of absolute effects (attributable fraction) than hourly TV.
Conclusion: We concluded that TV was an independent risk factor of COPD morbidity, especially among the susceptible subgroups. These findings would be helpful to guide the development of targeted public intervention.
Keywords: epidemiology, COPD hospitalization, distributed lag non-linear model, time-series analysis, China
Introduction
Chronic obstructive pulmonary disease (COPD), characterized by persistent respiratory symptoms and airflow restriction, is a leading cause of chronic morbidity and mortality all over the world.1,2 The social and economic burden associated with COPD was considerable in both developed and developing countries.3,4 For example, in China in 2014–15, the prevalence of COPD was 13.6% (about 77.2 million) in adults aged 40 years and older, the annual total costs per patient ranged from USD1964 to USD3449, and the total cost for the whole country ranged from USD151.6 billion to USD266.3 billion per year.4,5 Continued exposure to risk factors and aging of the population may lead to increase the disease burden caused by COPD,6 which is projected to rank third worldwide in terms of mortality by 2020.7 However, COPD is preventable and treatable to some extent, so the identification of risk factors may be helpful to protect people from an acute exacerbation of COPD.
Climate change is one of the biggest threats to human health during the twenty-first century.8 Ambient temperature is the most direct way of climate to affect human health, which has been extensively explored.9–11 The detrimental impacts of ambient mean temperature on COPD mortality or morbidity, especially cold temperatures, have been ascertained in some studies.12–15 Ambient mean temperatures may in part account for the public health burden, but the excess public health risk of climate change may also result from temperature variability (TV), a frequent representation of unstable weather. Generally, TV was described by intraday TV as diurnal temperature range (DTR) and interday TV as temperature change between neighboring days (TCN) separately, and the increased risk of COPD was associated with both DTR16,17 and TCN.18 Since temperature fluctuation is a continuous process that may last for a few days, considering merely intra- or interday TV may hamper the overall impacts of TV.
Recently, two composite TV indexes were proposed to simultaneously involve intra- and interday variations, which were calculated by the SD of daily minimum and maximum temperatures19 or the SD of hourly temperatures during exposure days.20 Although these two indices have been ascertained to be related with mortality or cardiovascular hospitalizations in several studies,19–24 to our best knowledge, relevant evidence on the adverse effect of TV on COPD hospitalization remains limited. Liang et al16 and Ma et al17 investigated the effect of DTR within a day on COPD hospitalization. A study in Hong Kong has found that seasonal TV during the whole summer or winter increased COPD hospitalizations among an elderly cohort.25 However, the effect of short-term TV within several days which might show different patterns was not investigated, particularly further studies covering the whole population are needed to provide a comprehensive insight on the impact of TV.
The effects modification of the association between TV and COPD hospitalization are still not elucidated. Only few studies have investigated sex and age as potential modifiers of TV-mortality association, and found a relatively consistent conclusion that female and elderly were more vulnerable.26,27 However, no evidence is available on effects modified by occupation and marital status. Therefore, to target vulnerable population accurately, further evidence is needed to comprehensively investigate the individual characteristics as potential modifiers. Previous studies found more significant TV-mortality association during moderate seasons19 or summer,28 but whether TV-COPD hospitalization association varied by seasons remains unclear. A multicity study pointed out that mortality risks related to TV were higher in hot areas,19 and another found that cities with dense population, higher temperatures and relative humidity had greater mortality risks caused by TV.22 Based on hospitalization instead of the most severe health outcome (ie, mortality), the investigation of vulnerable subpopulations and seasons to TV would be of greater importance for the management of COPD exacerbations.
Compared with the relative risk, attributable fraction and attributable number would provide extra public health information of disease burden due to a specific risk factor. Some studies have reported COPD burden due to nonoptimal mean temperatures.15,29 However, evidence on TV-attributable COPD burden was limited. A previous study in Zhejiang province, China found that TV accounted for 6.66% of COPD mortality,26 but so far, there was no study to provide information on TV-related burden of COPD morbidity. In addition, due to climate varyiation between seasons, seasonal patterns could be expected for TV-related burden of COPD morbidity. Relevant evidence is needed and is important for planning and evaluating public health interventions and controls.
This paper aimed to assess the TV-COPD association using hospitalizations data in Guangzhou, China in 2013–2015. Various lag periods were applied to explore the lag structure of TV. We estimated the fraction of COPD attributable to TV and examined the potential effect modifications by individual characteristics (sex, age, occupation, marital status) and seasons.
Patients and Methods
Study Area and Population
Guangzhou is the provincial capital city of Guangdong province, as well as one of China’s three largest cities with a population of 14.9 million and high population density of 2000 per km2 at the end of 2018. Located south of the Tropic of Cancer and on the Pearl River about 120 km north-west of Hong Kong, Guangzhou has a humid subtropical climate, with high temperature and humidity during the long-lasting summer. The study was approved by the ethical committee of Southern Medical University, where the study was conducted. Patient informed consent was waived because Guangzhou Health Information Center provided the de-identified data derived from the National Health Statistics Network Direct Report system and the daily count of hospitalization was anonymously analyzed in this study.
Data Collection
The information on the home page of electronic medical records for hospitalizations are required to submit to Guangzhou Health Information Center, which is a part of the National Health Statistics Network Direct Report system with strict standard operation procedure and quality assurance measures.30 A few previous studies in Beijing31 and Nanchang, China,32 have utilized similar medical records to investigate the temperature-hospitalization association. The database in Guangzhou encompassed all 122 large hospitals ranked level II and above. We obtained all individual hospitalization data due to COPD during 2013–2015 in Guangzhou from the Guangzhou Health Information Center, including admission date, sex, age, occupation, marital status, medical cost, and duration of hospitalization. The COPD patients were defined by the tenth revision of the International Classification of Disease (ICD10) of J41–J44 according to discharge diagnosis,33 which were extracted to construct the corresponding daily time series. We aggregated daily number of COPD hospitalizations for subgroups by type of admission (emergency and nonemergency), sex, age (0–64 years and 65 years or older), occupation (white collar, blue collar, and unemployed) and marital status (unmarried, married, and divorced/widowed) groups. Hourly meteorological data during the same period was obtained from the National Oceanic and Atmospheric Administration (NOAA), including hourly temperature and dew point temperature, based on which the relative humidity was calculated by the formula that was provided. We used daily mean temperature and relative humidity, derived from the average hourly measurements, to represent the exposure throughout whole day and night, and corresponded to the daily count of COPD hospitalizations.
Calculation of Temperature Variability
We adopted two typical and composite TV indexes as exposure measurements of short-term temperature variability, including hourly TV and daily TV, respectively. As depicted in previous literature, during exposure days, daily TV was calculated by the SD of daily minimum and maximum temperatures,19 and hourly TV was the SD of hourly temperatures.20 These two TVs have ability to take account for both intraday and interday temperature variability simultaneously, overcoming the strong collinearity between intra- and interday TV.19 To sufficiently investigate TV-COPD associations and the lag effects, we conducted a separate analysis for TV on various exposure days (from lag zero to one day to lag zero to seven days). Notably, both hourly TV and daily TV were daily measures. For example, hourly TV over lag zero to one day was calculate by the SD of hourly temperatures on the same day and one day before. The hourly TV and daily TV were matched with daily count of COPD hospitalizations and other daily meteorological factors by the same date.
Statistical Analysis
A quasi-Poisson regression model was applied to estimate the risk of daily COPD hospitalizations associated with TV exposure. We firstly explored the exposure-response relationship between COPD hospitalization and hourly TV or daily TV by using a natural cubic spline function with 3 df. The exposure-response curve revealed a linear effect of TV on COPD hospitalization (Supplementary Figure S1), as showed in two previous studies of TV and mortality.20,23 To simplify the mode, we finally included a linear term of TV in the model. The model controlled for daily mean temperature, relative humidity, long-term trend, seasonality, day of the week, public holiday, as previous studies,23 which is shown below:
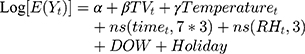
where E(Yt) is the expected count of COPD hospitalization on day t (ie, 1,2,3, …,1095), a is the intercept, β represents the log-relative risk of COPD associated with a 1°C increase of TVt, Temperaturet is a cross-basis matrix produced by the distributed lag nonlinear model with a natural cubic spline function with 4 df for daily mean temperature (knots at the 25th, 50th, and 75th percentiles) and a natural cubic spline function with 4 df for 21 lag days (knots at approximately 1.4, and 5.5 days) to adjust the nonlinear and lagged effects of temperature.19 The ns() is a natural cubic spline function, with 7 df per year for timet to control for seasonality and long-term trend of hospitalization, and with 3 df for relative humidity (RHt). Day of the week (DOW) and public holidays were controlled for as indicator variables.
We estimated the percentage change (PC) and 95%CI of COPD hospitalization associated with a 1°C increase in TV, calculating by PC=(RR–1)*100% where RR=exp(β). To investigate potential effect modifiers, we conducted stratified analyses by sex, age, occupation, marital status and seasons (ie, spring from March to May, summer from June to August, autumn from September to November, and winter including December, January and February). To estimate COPD burden associated with TV, we quantitatively estimated attributable number (AN) and attributable fraction (AF) of COPD hospitalization due to TV. The attributable relative risk was calculated based on estimated risk coefficients (β) of TV and the theoretical minimum risk of TV exposure (ie, 0°C). For each day of the time-series (t), the attributable fraction (AFt) and attributable number (ANt) were computed using the following formula:34,35
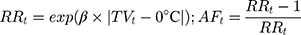
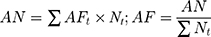
where Nt was the number of COPD hospitalization on day t, the total attributable number of COPD hospitalization due to TV was the sum of the ANt from all the days, and its ratio with the total number of COPD hospitalization is the total attributable fraction.20
The effects of TV were estimated for subgroups stratified by gender, age group (0–64 years and 65+) and marital status (married, unmarried and divorced/widowed), occupational categories (blue collar, white collar and unemployed) and season (spring, summer, autumn, and winter). Then, the statistical difference on effect estimates between subgroups was examined through the Z-test with the following equation.
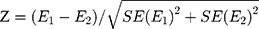
where E1 and E2 are the estimates, ln( ) and ln(
 ), for the two subgroups; SE(E1) and SE(E2) are corresponding standard errors of E1 and E2.36
Sensitivity analyses were conducted by using 28-day maximum lag of temperature, 5 df for daily mean temperature, 8 df per year for time trend, and not control for relative humidity in the main model, respectively. In addition, the model included the linear terms of daily PM2.5, NO2, and SO2 concentrations individually to explore the confounding effect of air pollutants. Additional adjustment for wind speed and visibility was also examined. Data excluding patients aged less than 40 years (ie, 1285 patients (1.8%)) were re-analyzed to examine the robustness of the results.
All statistical analyses were performed in the R 3.6.2. The “dlnm” package was used for fitting DLNM model. All statistical tests were two-sided, and P<0.05 was considered statistically significant.
Results
Table 1 summarizes the COPD hospitalizations during 2013–2015 in Guangzhou, China. During the period, there were 71,070 COPD hospitalizations, including 22,682 (31.9%) emergency hospital admissions, with more patients among males (77.3%), people aged 65+ years (84.0%), unemployed (53.3%) and married people (94.7%). On average, there were 64.9 cases (range: 14 to 155) per day, and more COPD hospitalization happened during spring (73.4 per day, range: 26 to 139). The average medical cost per patient was RMB 17,272 yuan (ie, USD2446). The average duration of hospitalization was 11.7 days.
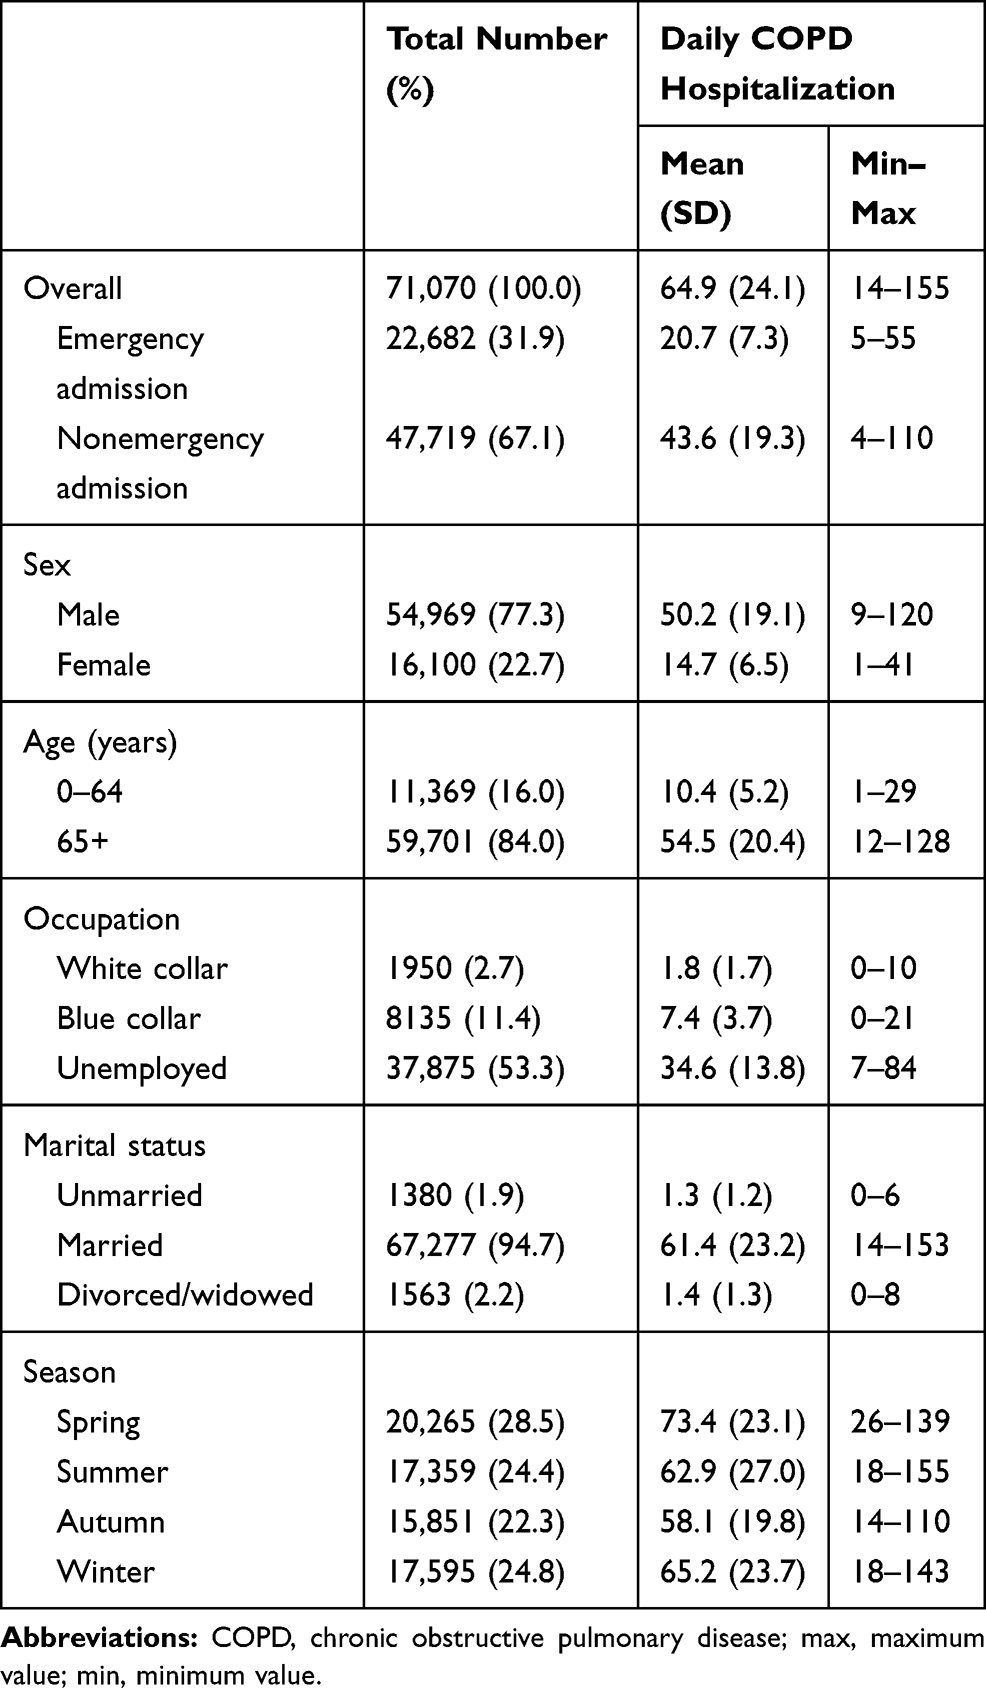 |
Table 1 Descriptive Statistics for Daily COPD Hospitalization During 2013–2015 in Guangzhou, China |
Table 2 shows the descriptive statistics of weather conditions during the study period. On average, daily mean temperature and relative humidity were 23.3°C and 73.5%, respectively. The highest temperature was 29.5°C in summer, and the lowest was 15.3°C in winter. The means (SD) of hourly TV and daily TV at lag 0–1 day were 2.5°C (0.8°C) and 4.2°C (1.3°C), respectively. TV in winter was the greatest among four seasons. The means (SD) of hourly TV derived from hourly temperature were consistently smaller than daily TV derived from daily minimum and maximum temperature. The means increased with the number of exposure days while the SD got smaller.
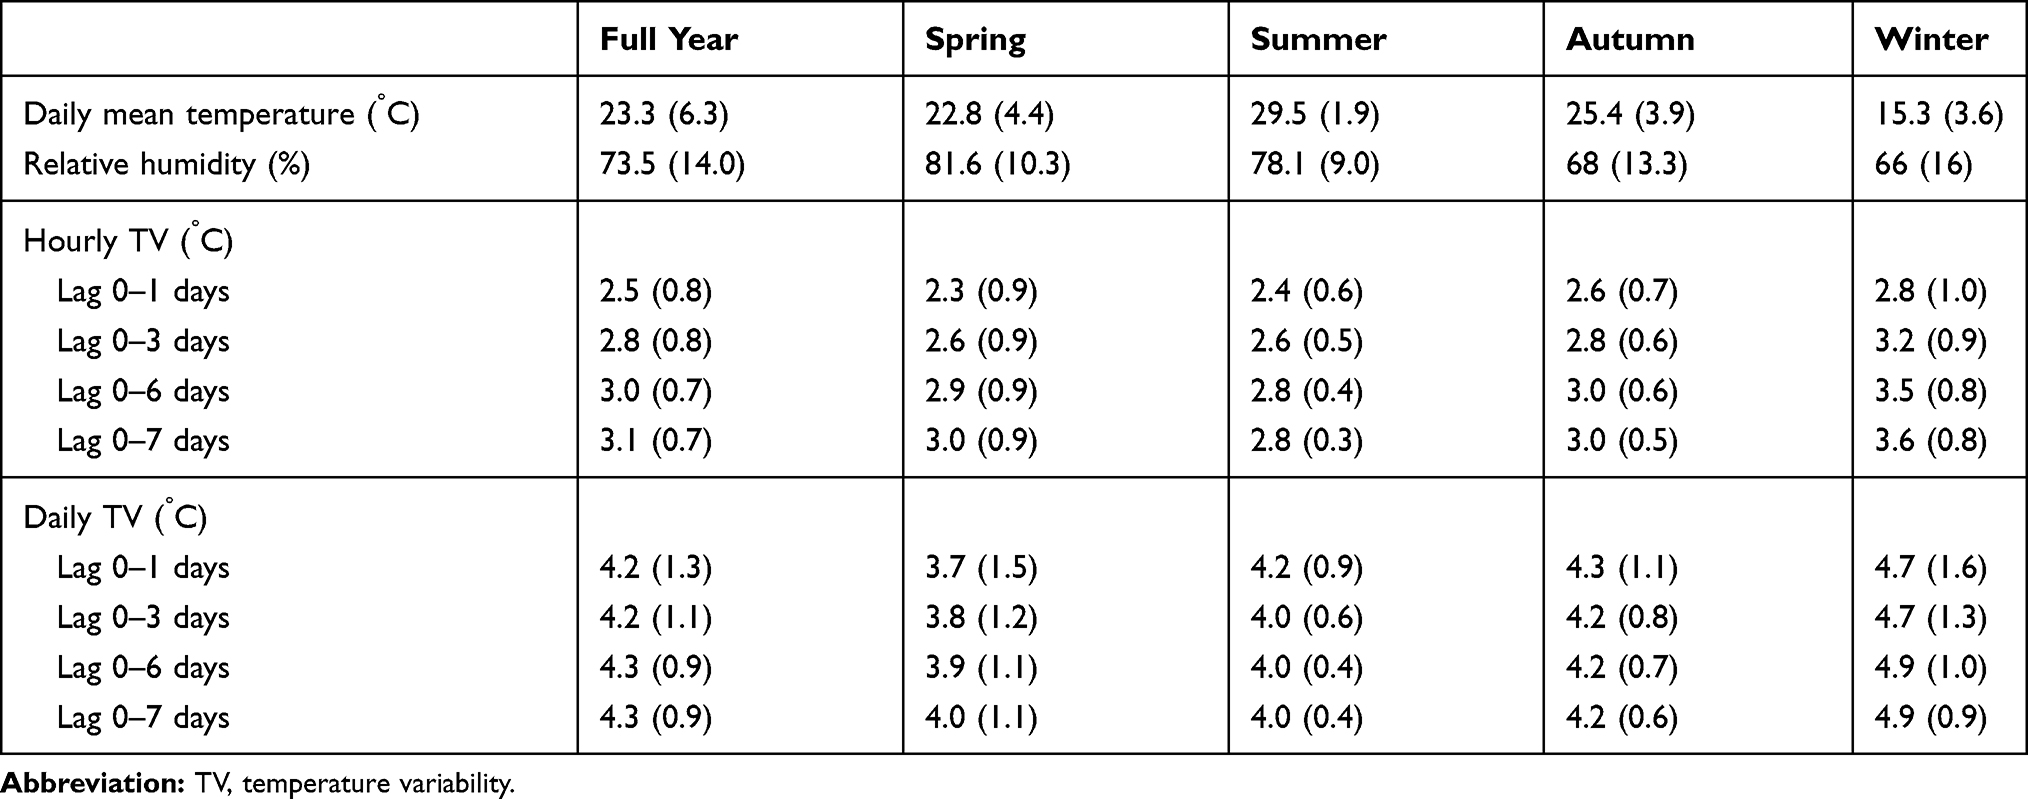 |
Table 2 The Average (SD) of Daily Temperature Variability, Weather Conditions During 2013–2015 in Guangzhou, China |
Hourly TV had narrower distribution range than daily TV, and the ranges changed slightly through exposure days (Supplementary Figure S1). The generally positive linear exposure-response relationship was consistently found for hourly TV and daily TV at various exposure days (Supplementary Figure S1). Therefore, we reported the linear effects in the subsequent results by only including a linear term of TV in the model.
Figure 1 presents the percentage changes of COPD hospitalization associated with a 1°C increase in TV across various exposure days. Estimated effects were similar between hourly TV and daily TV across all exposure days. The effects increased with the number of exposure days at the beginning, and reached the peak around the exposures at zero to six days. Therefore, we mainly reported the impact over lag zero to six days in the subsequent analyses.
 |
Figure 1 Percentage changes of COPD hospitalization with 1°C increase in temperature variability (TV) along various exposure days. The dots are estimated effects, and the error bars are the 95% confidence intervals. COPD is the chronic obstructive pulmonary disease. TV is temperature variability. TV01 is temperature variability at lag 0–1 day, and so on. |
Table 3 presents the TV-associated increase in COPD hospitalization over lag zero to six days for the whole population and subgroups. A 1°C increase in hourly TV and daily TV was associated with an increase of 4.3% (2.2–6.4) and 4.0% (2.3–5.8) in COPD hospitalization, respectively. Significant difference was observed among marital status, and there were difference between other subgroups although not significant. The effect estimates for a 1°C increase in hourly TV were greater among emergency admission (5.4%, 2.7–8.1), males (4.6%, 2.5–6.8), people aged 0–64 years (6.0%, 2.2–9.9), blue collar (7.7%, 3.3–12.2) and divorced/widowed people (8.8%, −0.2–18.7), respectively. The effect was greater in summer and winter. The daily TV showed similar estimates with hourly TV.
 |
Table 3 The Percentage Change (%) of Daily COPD Hospitalization Associated with 1°C Increase in TV Over Lag 0–6 Days for Subgroups |
Table 4 shows the number and fraction of COPD hospitalization attributable to temperature variability for subgroups during 2013–2015 in Guangzhou, China. During the study period, there were 8500 of COPD hospitalizations due to hourly TV over lag zero to six days, with more cases among nonemergency hospitalizations, male, people aged 65+ years, unemployed, married, summer and winter. The fraction of COPD hospitalizations attributable to hourly TV was 12.0%, with a greater fraction among emergency admission (14.6%), male (12.9%), people aged 0–64 years (16.1%), blue collar (20.1%), divorced/widowed (22.5%) and winter (13.4%), larger fraction was estimated using daily TV.
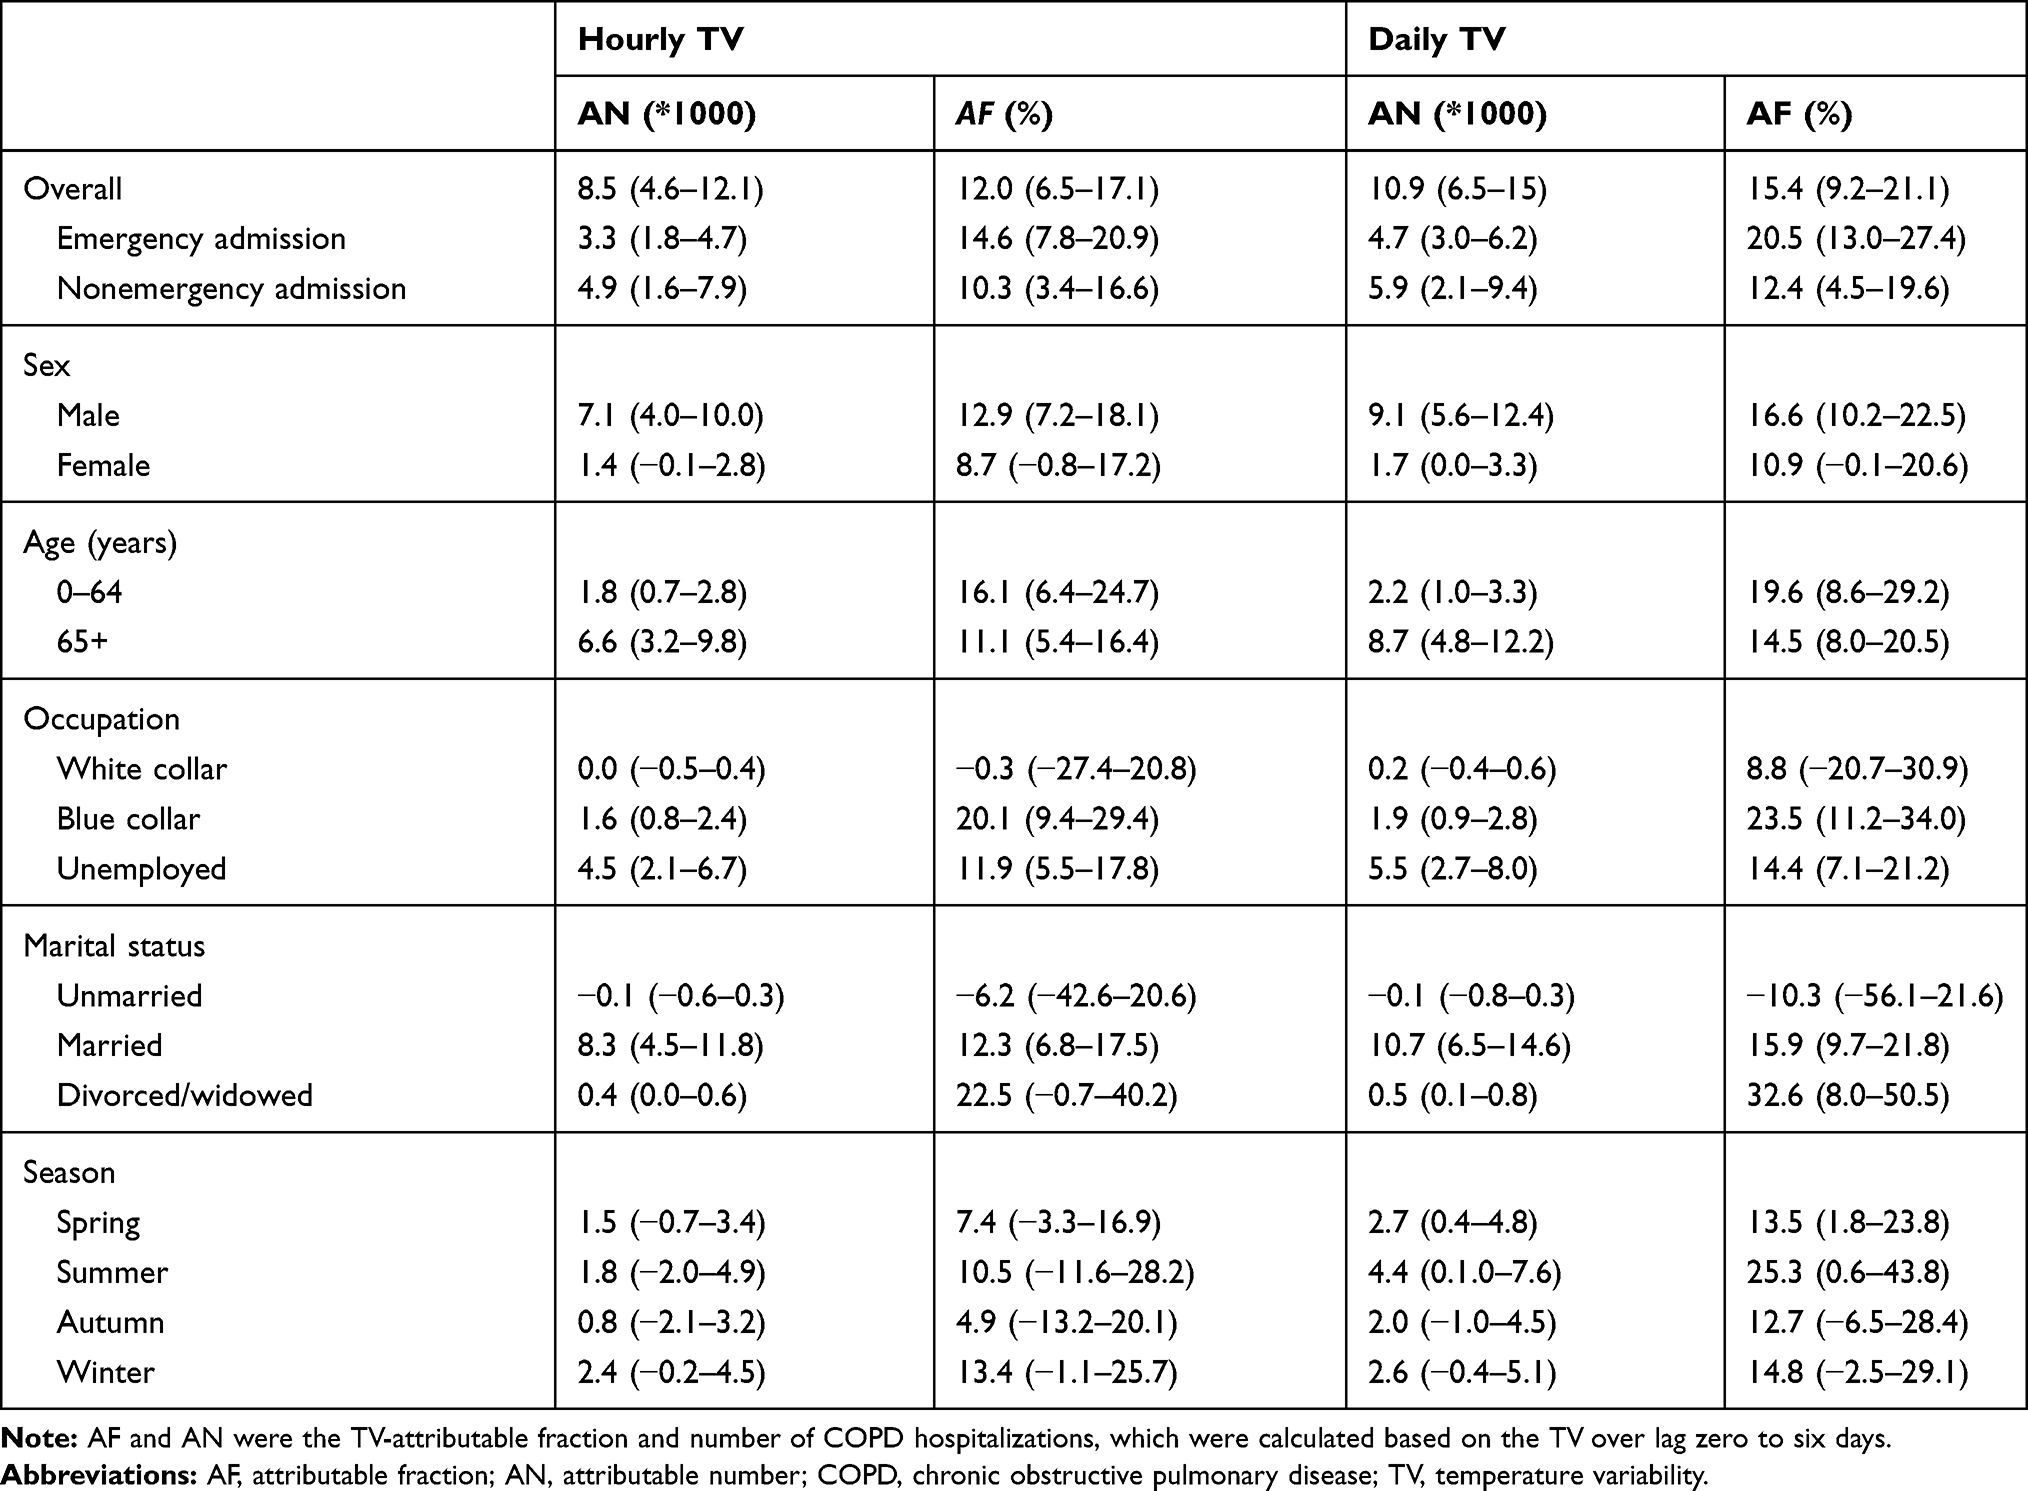 |
Table 4 COPD Burden Due to Temperature Variability During 2013–2015 in Guangzhou, China |
The results of sensitivity analyses showed that the relationship between TV–COPD hospitalization were not materially affected by using the alternative maximum lag days of temperature of 28 days, 5 df of temperature, 8 df of time, and not controlling for RH (Supplementary Figure S2). In addition, after controlling for four air pollutants, wind speed and visibility individually, the estimated effect of TV changed slightly and remained significant, ranging from 3.6% (1.7–5.5) to 4.6% (2.4–6.8) (Supplementary Table S1). The results based on data excluding patients with age less than 40 years remained robust (Supplementary Table S2).
Discussion
Based on the 71,070 COPD hospitalizations during 2013–2015 in Guangzhou, the largest subtropical city in southern China, this study has investigated the risk and burden of COPD hospitalization associated with short-term temperature variability, and examined the potential modifiers. We found a linear TV-COPD association, with similar estimates of relative risk for hourly TV and daily TV and larger estimates of absolute effect (ie excess number and attributable fraction) for daily TV. During the study period, hourly TV caused 8500 COPD hospitalizations with a direct medical cost of RMB 146.8 million (ie, USD 20.9 million). The relative risks and attributable fractions of COPD hospitalization due to TV were greater among emergency admissions, males, people aged 0–64 years old, blue collar, and divorced/widowed people.
We found a 1°C increment of hourly TV and daily TV at caused 4.3% (95%CI: 2.2–6.4) and 4.0% (2.3–5.8) increases in COPD hospitalization, respectively. Previously there was limited evidence on the TV-COPD hospitalization association. A cohort study on people older than 65 years in Hong Kong reported a greater effect, during winter a hazard ratio of 1.41 (1.15–1.71) for COPD emergency hospital admissions per 1°C increase of daily TV.25 This suggests that the short-term effect in our study may underestimate the long-term effect of TV. The COPD hospitalization risk was also found to be associated with intraday TV (ie, diurnal temperature range) in Taiwan and Changchun, China.16,17 In the literature on mortality risk, Yang et al22 have reported that a 1°C increment of daily TV was associated with a 0.54% (−0.11–1.20) increases in COPD mortality, and Hu et al26 reported a 2.1% (1.6–2.6) increases in respiratory mortality for each 1°C increase of hourly TV. It seems the effects of TV on COPD hospitalization were greater than on mortality. There is a possible explanation that sudden temperature changes could cause pathophysiological responses of the respiratory epithelium37 and a mild inflammatory reaction,16,38,39 which would deteriorate physical condition of people with COPD and cause hospitalization due to acute onset. In addition, people may not prepare well for this sudden temperature change with appropriate behavioral patterns,40,41 so they may feel uncomfortable and have an increased risk of having a cold because of sudden TV, exacerbating COPD.
Our findings on relative risks have identified males, people aged 0–64 years old, blue collar, and divorced/widowed people as potentially more vulnerable population, which may be beneficial to build up a targeted public health policy. There was scant evidence on the effect modification of TV-COPD hospitalization association. In the field of mortality risk, some studies reported that TV had greater risk among females,22,27 but Zhang et al42 found inconsistent results in Hubei province, China. The gender difference might be varied across location, population, living habits and social-economic status.26,27 A cohort study has reported that the effect of long-term TV on COPD admission was slightly greater among people aged 70 years or below than people aged above 70 years.25 We speculated that people below 64 years old were more frequently exposed to sudden temperature change, because they had more activities or duties outdoors despite bad weather conditions. In contrast, most people aged 65+ years old have retired, and under adverse weather conditions, they can stay indoor with stable temperatures with the help of air conditioning and heating. We identified blue collar, including farmers and workers, were more vulnerable to TV, and Ding et al38 consistently presented that farmers were more vulnerable to DTR. Farmers and workers are in a disadvantaged socioeconomic status (ie, poor living conditions, and limited access to health care), and are more likely to spend time outside being exposed to ambient temperature variability, which might be the reason. We also found divorced/widowed people were more vulnerable to TV, suggesting the important role of isolation in vulnerability to temperature variability in addition to old age causing weak body condition. Consistently, during the August 2003 heatwave in France, the mortality of widowed or divorced people was greater than that of married people.43
Attributable fraction, representing the burden due to a specific risk factor, is a more informative and policy-oriented measurement than relative risk. However, there are no data of the burden of COPD morbidity attributable to TV. A previous study reported 6.66% of COPD mortality was attributable to TV.26 In this study, we found that TV caused a heavier burden of COPD hospitalization with fractions of 12% and 15.4% attributable to hourly TV and daily TV, respectively. Notably, the fraction attributable was higher among males, people aged 0–64 years old, blue collar, and divorced/widowed people. We also found that the TV-attributable COPD burden was greater in summer and winter. There is no relevant evidence on seasonal patterns of TV effect on COPD morbidity, while a previous study found TV-mortality association was stronger in warm seasons in England and Wales.28 However, a multi-country study revealed the differences in the seasonal patterns of TV-mortality association among countries.19
Per 1°C increment in hourly TV and daily TV in our study showed similar estimated relative risk of COPD hospitalization, increasing with exposure days and being stable around zero to six days, similar with a study on mortality risk.20,21 In addition, we confirmed a notable result ever reported in a mortality study21 that using daily TV instead of hourly TV would result in greater excess number and attributable fraction. The TV based on hourly temperatures within several days could reduce exposure measurement error, which seems to reflect the actual temperature variability better, while daily TV based on fewer daily temperature values had narrow a confidence interval of estimation although it had wider ranges and bigger variations. Thus, in the future, more evidence is needed on the choice of hourly or daily TV for relevant studies.
There are several limitations of this study. First, the effects of individual characteristics including race/ethnicity, level of education and socioeconomic status have not been considered in this study, while these factors are time-invariant at the daily scale and therefore cannot bias the effect estimates of TV in the time-series analysis. Second, the TV–COPD hospitalization associations were estimated in a single city, so caution should be taken to generalize the effect estimates to other regions. Third, the definition of COPD hospitalization was identified based on discharge diagnosis in electronic medical records, which cannot avoid underreporting or misdiagnosing of COPD cases. Additionally, ambient temperature data from surface weather observation stations is not accurate temperature for individuals, which might introduce some inevitable exposure measurement errors, but the errors are likely to be random causing underestimated effects.
Conclusion
TV was an independent risk factor of COPD morbidity, contributing to 12.0% of COPD hospitalizations. Males, people aged 0–64 years old, blue collar, and divorced/widowed people tended to be more susceptible to TV. This study provided substantial evidence that temperature variability triggers the exacerbation of COPD, which would be helpful for improving targeted prevention and arrangement measures of exacerbation.
Data Sharing Statement
Raw data of medical records data and hourly metrological data were requested and obtained from the Guangzhou Health Information Center and the National Oceanic and Atmospheric Administration, respectively. Raw data will not be shared because the authors are not authorized to redistribute data. Hourly metrological data can be obtained freely from the National Oceanic and Atmospheric Administration (https://gis.ncdc.noaa.gov/maps/ncei/cdo/hourly).
Acknowledgments
We greatly thank the Guangzhou Health Information Center and the National Oceanic and Atmospheric Administration for providing medical records data and weather data, respectively.
Author Contributions
All authors made a significant contribution to the work reported, whether that is in the conception, study design, execution, acquisition of data, analysis and interpretation, or in all these areas; took part in drafting, revising or critically reviewing the article; gave final approval of the version to be published; have agreed on the journal to which the article has been submitted; and agree to be accountable for all aspects of the work.
Disclosure
The authors report no conflicts of interest in this work.
References
1. Roth GA, Abate D, Abate KH, et al. Global, regional, and national age-sex-specific mortality for 282 causes of death in 195 countries and territories, 1980–2017: a systematic analysis for the Global Burden of Disease Study 2017. The Lancet. 2018;392(10159):1736–1788. doi:10.1016/S0140-6736(18)32203-7
2. James SL, Abate D, Abate KH, et al. Global, regional, and national incidence, prevalence, and years lived with disability for 354 diseases and injuries for 195 countries and territories, 1990–2017: a systematic analysis for the Global Burden of Disease Study 2017. The Lancet. 2018;392(10159):1789–1858. doi:10.1016/S0140-6736(18)32279-7
3. Guarascio AJ, Ray SM, Finch CK, Self TH. The clinical and economic burden of chronic obstructive pulmonary disease in the USA. Clinicoecon Outcomes Res. 2013;5:235–245. doi:10.2147/CEOR.S34321
4. Woo L, Smith HE, Sullivan SD. The economic burden of chronic obstructive pulmonary disease in the asia-pacific region: a systematic review. Value Health Regional Issues. 2019;18:121–131. doi:10.1016/j.vhri.2019.02.002
5. Fang L, Gao P, Bao H, et al. Chronic obstructive pulmonary disease in China: a nationwide prevalence study. Lancet Respir Med. 2018;6(6):421–430. doi:10.1016/S2213-2600(18)30103-6
6. Mathers CD, Loncar D. Projections of global mortality and burden of disease from 2002 to 2030. PLoS Med. 2006;3(11):e442. doi:10.1371/journal.pmed.0030442
7. Lopez-Campos JL, Tan W, Soriano JB. Global burden of COPD. Respirology. 2016;21:14–23. doi:10.1111/resp.12660
8. Gasparrini A, Guo Y, Sera F, et al. Projections of temperature-related excess mortality under climate change scenarios. Lancet Planetary Health. 2017;1(9):e360–e367. doi:10.1016/S2542-5196(17)30156-0
9. Ding Z, Li L, Wei R, et al. Association of cold temperature and mortality and effect modification in the subtropical plateau monsoon climate of Yuxi, China. Environ Res. 2016;150:431–437. doi:10.1016/j.envres.2016.06.029
10. Chen R, Yin P, Wang L, et al. Association between ambient temperature and mortality risk and burden: time series study in 272 main Chinese cities. BMJ. 2018;363:k4306. doi:10.1136/bmj.k4306
11. Yang J, Yin P, Zhou M, et al. The burden of stroke mortality attributable to cold and hot ambient temperatures: epidemiological evidence from China. Environ Int. 2016;92–93:232–238. doi:10.1016/j.envint.2016.04.001
12. Lam HC, Chan EY, Goggins III WB. Comparison of short-term associations with meteorological variables between COPD and pneumonia hospitalization among the elderly in Hong Kong-a time-series study. Int J Biometeorol. 2018;62(8):1447–1460. doi:10.1007/s00484-018-1542-2
13. Luan G, Yin P, Wang L, Zhou M. Association between ambient temperature and chronic obstructive pulmonary disease: a population-based study of the years of life lost. Int J Environ Health Res. 2019;29(3):246–254. doi:10.1080/09603123.2018.1533533
14. Sama SR, Kriebel D, Gore RJ, DeVries R, Rosiello R. Environmental triggers of COPD symptoms: a case cross-over study. BMJ Open Respir Res. 2017;4(1):e000179. doi:10.1136/bmjresp-2017-000179
15. Sun S, Cao W, Mason TG, et al. Increased susceptibility to heat for respiratory hospitalizations in Hong Kong. Sci Total Environ. 2019;666:197–204. doi:10.1016/j.scitotenv.2019.02.229
16. Liang W, Liang W, Liu W, Liu W, Kuo H, Kuo H. Diurnal temperature range and emergency room admissions for chronic obstructive pulmonary disease in Taiwan. Int J Biometeorol. 2009;53(1):17–23. doi:10.1007/s00484-008-0187-y
17. Ma Y, Zhao Y, Zhou J, Jiang Y, Yang S, Yu Z. The relationship between diurnal temperature range and COPD hospital admissions in Changchun, China. Environ Sci Pollut R. 2018;25(18):17942–17949. doi:10.1007/s11356-018-2013-3
18. Zhan Z, Zhao Y, Pang S, Zhong X, Wu C, Ding Z. Temperature change between neighboring days and mortality in United States: A nationwide study. Sci Total Environ. 2017;584-585:1152–1161. doi:10.1016/j.scitotenv.2017.01.177
19. Guo Y, Gasparrini A, Armstrong BG, et al. Temperature variability and mortality: a multi-country study. Environ Health Perspect. 2016;124(10):1554–1559. doi:10.1289/EHP149
20. Cheng J, Xu Z, Bambrick H, Su H, Tong S, Hu W. The mortality burden of hourly temperature variability in five capital cities, Australia: time-series and meta-regression analysis. Environ Int. 2017;109:10–19. doi:10.1016/j.envint.2017.09.012
21. Zhang Y, Xiang Q, Yu C, et al. Mortality risk and burden associated with temperature variability in China, United Kingdom and United States: comparative analysis of daily and hourly exposure metrics. Environ Res. 2019;179:108771. doi:10.1016/j.envres.2019.108771
22. Yang J, Zhou M, Li M, et al. Vulnerability to the impact of temperature variability on mortality in 31 major Chinese cities. Environ Pollut. 2018;239:631–637. doi:10.1016/j.envpol.2018.04.090
23. Yaohua T, Hui L, Yaqin S, et al. Association between temperature variability and daily hospital admissions for cause specific cardiovascular disease in urban China: a national time- series study. PLoS Med. 2018;16(1):e1002738.
24. Zhao Q, Coelho M, Li S, et al. Spatiotemporal and demographic variation in the association between temperature variability and hospitalizations in Brazil during 2000-2015: a nationwide time-series study. Environ Int. 2018;120:345–353. doi:10.1016/j.envint.2018.08.021
25. Sun S, Laden F, Hart JE, et al. Seasonal temperature variability and emergency hospital admissions for respiratory diseases: a population-based cohort study. Thorax. 2018;73(10):951–958. doi:10.1136/thoraxjnl-2017-211333
26. Hu K, Guo Y, Yang X, et al. Temperature variability and mortality in rural and urban areas in Zhejiang province, China: an application of a spatiotemporal index. Sci Total Environ. 2019;647:1044–1051. doi:10.1016/j.scitotenv.2018.08.095
27. Luo K, Li R, Wang Z, Zhang R, Xu Q. Effect modification of the association between temperature variability and daily cardiovascular mortality by air pollutants in three Chinese cities. Environ Pollut. 2017;230:989–999. doi:10.1016/j.envpol.2017.07.045
28. Zhang Y, Yu Y, Peng M, Meng R, Hu K, Yu C. Temporal and seasonal variations of mortality burden associated with hourly temperature variability: a nationwide investigation in England and Wales. Environ Int. 2018;115:325–333. doi:10.1016/j.envint.2018.03.036
29. Zhao Y, Huang Z, Wang S, et al. Morbidity burden of respiratory diseases attributable to ambient temperature: a case study in a subtropical city in China. Environ Health. 2019;18(1):89. doi:10.1186/s12940-019-0529-8
30. National Health and Family Planning Commission of the People’s Republic of China [Internet]. Notice of the general office of the ministry of health on implementing the direct reporting work of the national health statistics network. Available from: http://www.nhc.gov.cn/zwgkzt/wsbysj/200806/36405.shtml. Accessed July 7, 2020.
31. Liu X, Kong D, Fu J, et al. Association between extreme temperature and acute myocardial infarction hospital admissions in Beijing, China: 2013–2016. PLoS One. 2018;13(10):e0204706. doi:10.1371/journal.pone.0204706
32. Chen J, Jiang H, Wu L, et al. Association of ischemic and hemorrhagic strokes hospital admission with extreme temperature in Nanchang, China—a case-crossover study. J Clin Neurosci. 2017;43:89–93. doi:10.1016/j.jocn.2017.04.044
33. Ma C, Yang J, Nakayama SF, Honda Y. The association between temperature variability and cause-specific mortality: evidence from 47 Japanese prefectures during 1972-2015. Environ Int. 2019;127:125–133. doi:10.1016/j.envint.2019.03.025
34. Vardoulakis S, Dear K, Hajat S, Heaviside C, Eggen B, McMichael AJ. Comparative assessment of the effects of climate change on heat- and cold-related mortality in the United Kingdom and Australia. Environ Health Persp. 2014;122(12):1285–1292. doi:10.1289/ehp.1307524
35. Cheng J, Xu Z, Bambrick H, Su H, Tong S, Hu W. Impacts of heat, cold, and temperature variability on mortality in Australia, 2000-2009. Sci Total Environ. 2019;651(Pt2):2558–2565. doi:10.1016/j.scitotenv.2018.10.186
36. Chen J, Yang J, Zhou M, et al. Cold spell and mortality in 31 Chinese capital cities: definitions, vulnerability and implications. Environ Int. 2019;128:271–278. doi:10.1016/j.envint.2019.04.049
37. Graudenz GS, Landgraf RG, Jancar S, et al. The role of allergic rhinitis in nasal responses to sudden temperature changes. J Allergy Clin Immun. 2006;118(5):1126–1132. doi:10.1016/j.jaci.2006.07.005
38. Ding Z, Li L, Xin L, et al. High diurnal temperature range and mortality: effect modification by individual characteristics and mortality causes in a case-only analysis. Sci Total Environ. 2016;544:627–634. doi:10.1016/j.scitotenv.2015.12.016
39. Lim YH, Reid CE, Mann JK, Jerrett M, Kim H. Diurnal temperature range and short-term mortality in large US communities. Int J Biometeorol. 2015;59(9):1311–1319. doi:10.1007/s00484-014-0941-2
40. Garrett AT, Rehrer NJ, Patterson MJ. Induction and decay of short-term heat acclimation in moderately and highly trained athletes. Sports Med. 2011;41(9):757–771. doi:10.2165/11587320-000000000-00000
41. Garrett AT, Goosens NG, Rehrer NJ, Patterson MJ, Cotter JD. Induction and decay of short-term heat acclimation. Eur J Appl Physiol. 2009;107(6):659–670. doi:10.1007/s00421-009-1182-7
42. Zhang Y, Yu C, Bao J, Li X. Impact of temperature variation on mortality: an observational study from 12 counties across Hubei Province in China. Sci Total Environ. 2017;587-588:196–203. doi:10.1016/j.scitotenv.2017.02.117
43. Fouillet A, Rey G, Laurent F, et al. Excess mortality related to the August 2003 heat wave in France. Int Arch Occ Env Hea. 2006;80(1):16–24. doi:10.1007/s00420-006-0089-4
 © 2020 The Author(s). This work is published and licensed by Dove Medical Press Limited. The full terms of this license are available at https://www.dovepress.com/terms.php and incorporate the Creative Commons Attribution - Non Commercial (unported, v3.0) License.
By accessing the work you hereby accept the Terms. Non-commercial uses of the work are permitted without any further permission from Dove Medical Press Limited, provided the work is properly attributed. For permission for commercial use of this work, please see paragraphs 4.2 and 5 of our Terms.
© 2020 The Author(s). This work is published and licensed by Dove Medical Press Limited. The full terms of this license are available at https://www.dovepress.com/terms.php and incorporate the Creative Commons Attribution - Non Commercial (unported, v3.0) License.
By accessing the work you hereby accept the Terms. Non-commercial uses of the work are permitted without any further permission from Dove Medical Press Limited, provided the work is properly attributed. For permission for commercial use of this work, please see paragraphs 4.2 and 5 of our Terms.