")
Back to Journals » Open Access Journal of Sports Medicine » Volume 8
Technologies for physical activity self-monitoring: a study of differences between users and non-users
Authors Åkerberg A, Söderlund A , Lindén M
Received 13 October 2016
Accepted for publication 27 January 2017
Published 27 February 2017 Volume 2017:8 Pages 17—26
DOI https://doi.org/10.2147/OAJSM.S124542
Checked for plagiarism Yes
Review by Single anonymous peer review
Peer reviewer comments 4
Editor who approved publication: Prof. Dr. Andreas Imhoff
Anna Åkerberg,1,2 Anne Söderlund,2 Maria Lindén1
1School of Innovation, Design and Engineering, 2School of Health, Care and Social Welfare, Mälardalen University, Västerås, Sweden
Background: Different kinds of physical activity (PA) self-monitoring technologies are used today to monitor and motivate PA behavior change. The user focus is essential in the development process of this technology, including potential future users such as representatives from the group of non-users. There is also a need to study whether there are differences between the groups of users and non-users. The aims of this study were to investigate possible differences between users and non-users regarding their opinions about PA self-monitoring technologies and to investigate differences in demographic variables between the groups.
Materials and methods: Participants were randomly selected from seven municipalities in central Sweden. In total, 107 adults responded to the Physical Activity Products Questionnaire, which consisted of 22 questions.
Results: Significant differences between the users and non-users were shown for six of the 20 measurement-related items: measures accurately (p=0.007), measures with high precision (p=0.024), measures distance (p=0.020), measures speed (p=0.003), shows minutes of activity (p=0.004), and shows geographical position (p=0.000). Significant differences between the users and non-users were also found for two of the 29 encouragement items: measures accurately (p=0.001) and has long-term memory (p=0.019). Significant differences between the groups were also shown for level of education (p=0.030) and level of physical exercise (p=0.037).
Conclusion: With a few exceptions, the users and the non-users in this study had similar opinions about PA self-monitoring technologies. Because this study showed significant differences regarding level of education and level of physical exercise, these demographic variables seemed more relevant to investigate than differences in opinions about the PA self-monitoring technologies.
Keywords: physical activity, technology, opinion, user, non-user
Introduction
Today, many lifestyle-related diseases are caused by risky behaviors. According to the World Health Organization (WHO),1 80% of diabetes, stroke, and heart disease cases can be prevented. Physical activity (PA) has a positive impact on the human body,2–6 is used as an important component for the treatment and prevention of several diseases,2,7 and can also reduce the risk of chronic diseases.8 PA is defined as “bodily movement produced by the muscles, which generates energy expenditure”.9 In contrast, sitting, lying down, or any waking activity characterized by low energy expenditure corresponds to a sedentary behavior.10 Being physically inactive is defined as performing only a small amount of PA or not being physically active enough to meet current recommendations.11
Technology has been used as a tool in interventions to promote PA.12,13 Currently, there are several technical devices available that aim to monitor and motivate change in PA behavior. Such devices include pedometers, accelerometers, activity trackers, heart rate monitors, and smartphone applications. These devices can be used separately or in combination with a computer, a smartphone, or an iPad when self-monitoring PA (PA self-monitoring technologies). According to Bandura,14 interactive technologies can increase the effects of health promotion efforts. However, using such technology in daily life requires a high level of acceptance among prospective users.15 The active involvement of users is also regarded as essential in health care device development.16–18 User-centered studies contribute important information to improve the fit between a user and a technology, and this information is essential for the acceptance and usability of a technical device.19 Additionally, when developing new technological interventions that aim to improve health, it is important to focus on the user perspective. Differences between users and non-users of health technology have been investigated, including the factors that influence the adoption of technology in general,20 the factors that influence the use of technology when exercising at a gym,21 and how opinions on telemedicine differ between users and non-users.22 Demographic variables have also been explored in relation to different types of technology.23,24 No studies were found that focused on investigating possible differences in the opinions regarding PA self-monitoring technologies between the groups of users and non-users. To develop and refine the PA self-monitoring technologies that future users need and accept for use to measure and encourage PA, it is essential to investigate whether such opinions differ between the two groups. The aims of the present study were to investigate possible differences between users and non-users regarding their opinions about PA self-monitoring technologies and to further investigate differences between users and non-users regarding demographic variables.
Materials and methods
This study had a cross-sectional design. The study was approved by the Regional Ethics Committee, Uppsala, Sweden (EPN, D-nr 2013/072). Data collection were performed during February–May 2015.
Study sample
The sample consisted of people who lived in central Sweden. Males and females were included in this study if they were aged between 18 and 84 years and if they were registered in one of the seven chosen municipalities in central Sweden. The parameters for random sampling were based on age, gender, and obtaining a proportional sample in relation to the size of the chosen municipality. In this study, statistical power was based on differences between users and non-users among the means of the studied variables. With an effect size of 0.30 and a significance level of p<0.05, a minimum sample of 174 respondents was required to achieve statistical power at the level of 0.80. When a dropout rate of 42% was included, a random sample size of ~300 respondents was needed. A total of 300 respondents were therefore asked to participate in the study. The random selection of the sample was achieved through the Swedish population and address register (SPAR), which includes all people who are listed in Sweden and is owned by the Swedish Taxes Office. The test leader (i.e., the first author) received the full names and addresses of the respondents. The sampling process is presented in Figure 1.
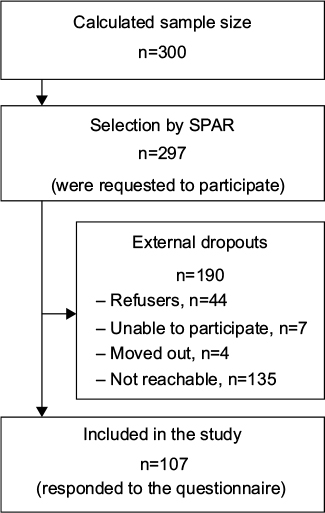 | Figure 1 Sampling process. Abbreviation: SPAR, Swedish population and address register. |
The total number of external dropouts was 190 individuals. The reasons for dropping out of the study included a lack of time and/or a lack of interest in participation (Figure 1). Additionally, we encountered individuals who were unable to participate because they did not speak or understand the Swedish language or had a disease or impairment that made it impossible for them to participate in the study. Another group that was not included consisted of individuals who had moved out of the selected municipalities in central Sweden. Finally, individuals who were not reachable because their addresses were unknown or because they had no registered telephone number (or were not reachable by phone) were not included due to a lack of response. In total, 107 individuals provided written consent to participate in the study (36% response rate), of which 51% were males and 49% females. The demographic data of the participants are presented in Table 1.
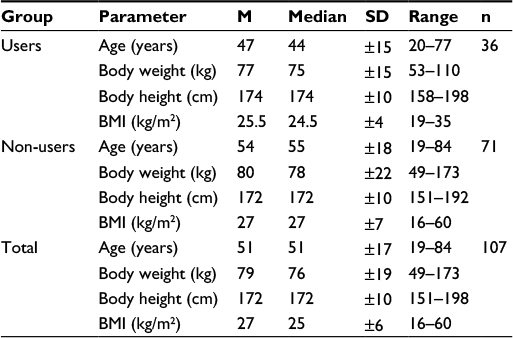 | Table 1 Demographic data of the participants Abbreviations: M, mean; SD, standard deviation; BMI, body mass index. |
Measures
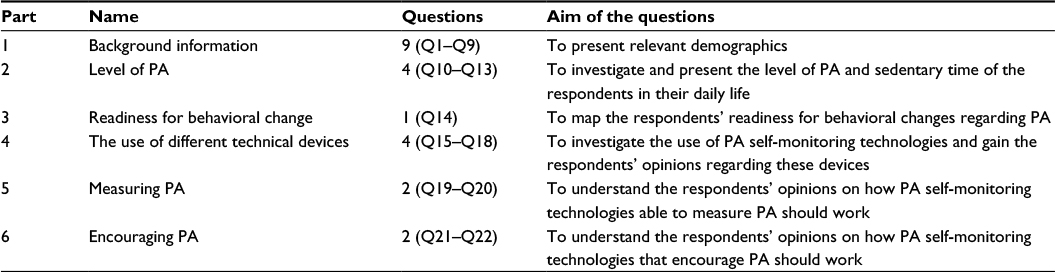
The Physical Activity Products Questionnaire (PHYS-PRO) was developed and designed for an adult population. The PHYS-PRO was partly based on other available questionnaires. The PHYS-PRO included 22 questions divided into six parts, as shown in Table 2.
 | Table 2 PHYS-PRO divided into six parts with the number of questions and aims of the questions for each part Note: In the “Questions” column, the first number describes the number of questions and the numbers in brackets indicate the question numbers. Abbreviations: PHYS-PRO, Physical Activity Products Questionnaire; PA, physical activity. |
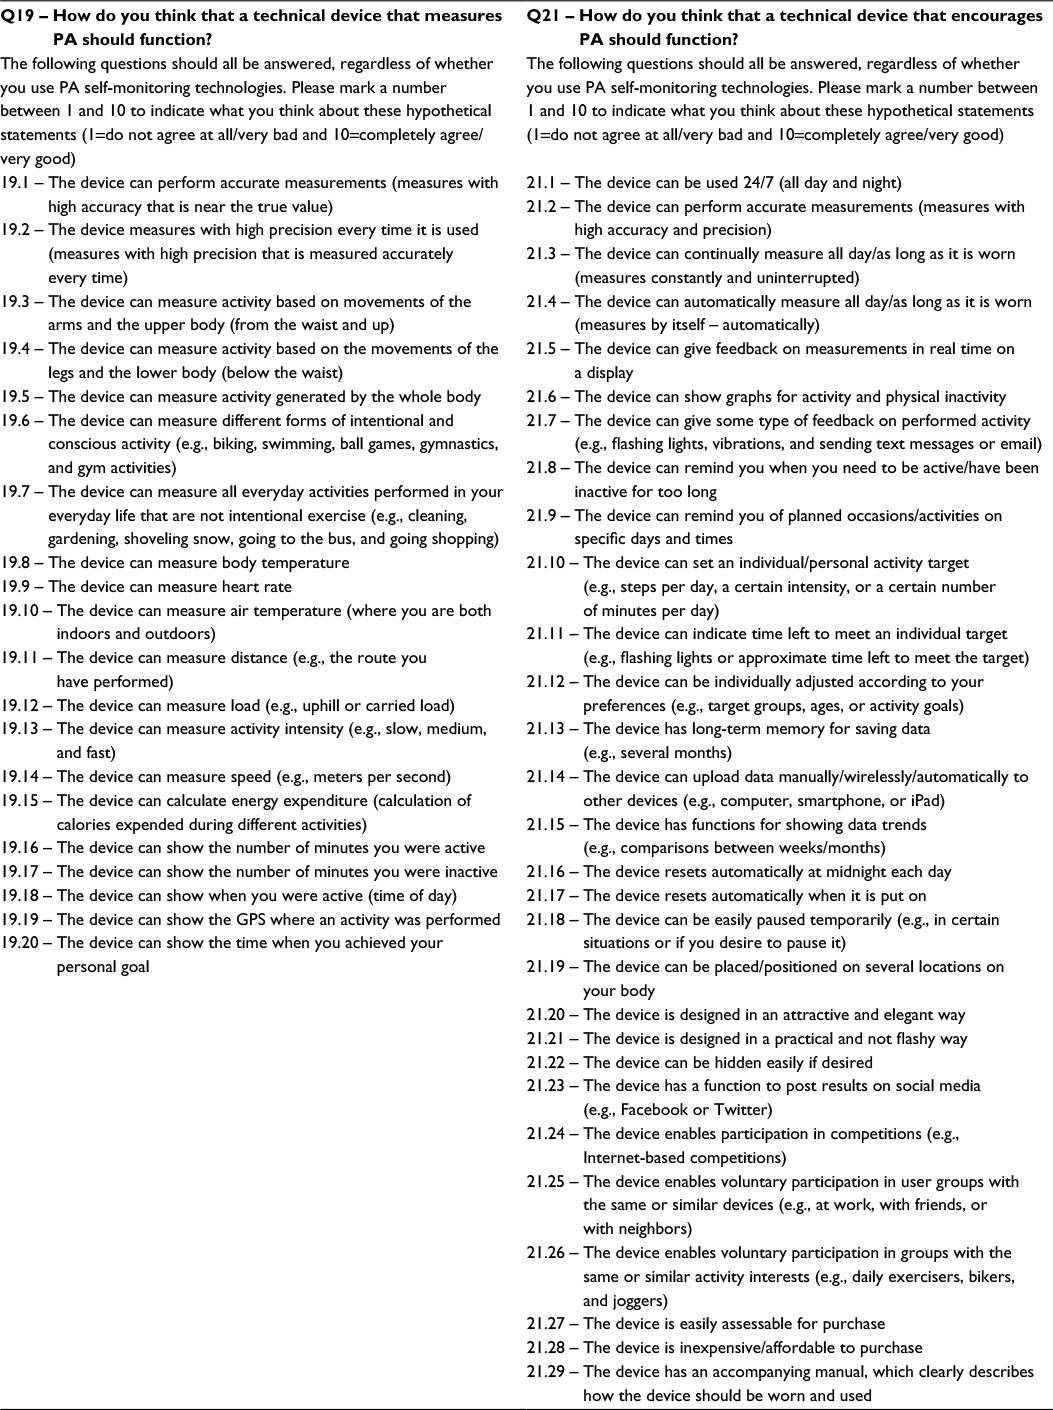
Part 1 – background information (Q1–Q9) – included questions regarding gender (Q1), age (Q2), housing condition (Q3), level of education (Q4), employment (Q5), perceived health condition (Q6), disease/disability status (Q7), body weight (Q8), and body height (Q9). All questions, except Q2 (age), were based on the “Health on Equal Terms – A Survey on Health and Living Conditions in Sweden in 2012”25 and the “Life and Health 2008”26 questionnaires. Some modifications were made to these questions. The participants were restricted to current conditions for two questions (Q6 and Q7). Additionally, the instructional text preceding questions Q4–Q9 and the response options for Q3 were modified to be clearer to the target group of the PHYS-PRO. Part 2 – level of PA (Q10–Q13) – included questions regarding level of everyday activity (Q10), level of physical exercise (Q11), level of sedentary behavior at work (Q12), and level of sedentary behavior during leisure time (Q13). All questions in part 2 were based on the WHO questionnaire “The Global Physical Activity Questionnaire” and the “Short Last 7 Days Telephone” version of the International Physical Activity Questionnaire (IPAQ)27 but were modified or divided into several questions to be suitable for the purposes of this study. Part 3 – readiness for behavioral change (Q14) – was presented as four statements regarding the PA of the respondent: 1) I am currently physically active; 2) I intend to become more physically active in the next 6 months; 3) I currently engage in regular PA; and 4) I have been regularly physically active for the past 6 months. This part was based on Marcus and Forsyth.28 The response options were no and yes, and the scoring method reported by Marcus and Forsyth28 was used to classify the stages of change (SOC). Part 4 – the use of different technical devices (Q15–Q18) – contained questions developed for this study regarding the use of PA self-monitoring technologies, reasons for using them, frequency of use, and opinions about them (Q15). The remaining three questions in this part were open-ended questions regarding the strengths (Q16) and weaknesses (Q17) of the devices and whether the participants had any further comments regarding the improvement of the devices (Q18). Part 5 – measuring PA (Q19–Q20) – and Part 6 – encouraging PA (Q21–Q22) – were both developed for the present study and focused on the user perspective. Parts 5 and 6 consisted of two tables with 20 (part 5) and 29 (part 6) hypothetical statements regarding how to measure (part 5) and encourage (part 6) PA. The hypothetical statements were based on earlier research and the authors’ ideas and experiences. The main question and the related items in Q19 (measuring PA) and Q21 (encouraging PA) are described in Table 3.
 | Table 3 The main questions and the related items in Q19 (measuring PA) and Q21 (encouraging PA) Note: n=32–34 (users) and n=63–66 (non-users). Abbreviations: PA, physical activity; GPS, geographical position. |
The respondents were asked to grade their level of agreement for each statement with a value between 1 and 10 (1 corresponded to do not agree at all/very bad and 10 corresponded to fully agree/very good). The tables for parts 5 and 6 were followed by an open-ended question requesting further comments on measuring PA and encouraging PA.
The PHYS-PRO was pilot tested twice before distribution. The first and second pilot tests were conducted with five and six individuals, respectively, and included males and females of different ages. The PHYS-PRO was revised for language comprehension, grammar, and spelling as a result of the pilot tests.
Procedure
The PHYS-PRO was distributed in Swedish as a letter by traditional post, but the respondents also had the option of answering the questionnaire through a web link as instructed in the paper version of the questionnaire. The letter also included information about the study purpose and a consent form. No incentive or reward was given to the respondents for participating in the study. All participants provided written consent. Data collection for the PHYS-PRO occurred from February to May 2015, by sending the questionnaire to the respondents’ home addresses. The first distribution was delivered during February, and reminders were sent thereafter by post. Respondents who answered the PHYS-PRO and left some questions unclear or unanswered were contacted by phone with a request to complete the questionnaire.
Data analyses
Descriptive statistics were presented as mean (M), standard deviation (SD), absolute frequency, and relative frequency. Body mass index (BMI) was calculated as kg/m2 and was categorized according to WHO guidelines as follows: underweight (BMI<18.5), normal weight (BMI 18.5–24.9), and overweight/obese (BMI≥25.0).29 The classification of users and non-users was made depending on how respondents answered Q15. A respondent was classified as a user if gave a positive answer (yes) on the item Q15 “Do you use any kind of technical device if or when you are physically active”? Using the Q14 answers, the respondents were divided into different SOC according to the algorithm recommended by Marcus and Forsyth.28 Pearson’s chi square test and the independent Mann–Whitney U test30 were used to study differences between users and non-users regarding demographic variables and opinions on PA self-monitoring technologies. A significance level of 0.05 was used in the analyses. Data were analyzed using IBM SPSS Statistics (v.22; IBM Corporation, Armonk, NY, USA).
Results
All respondents (N=107) were classified as users (n=36) or non-users (n=71). Furthermore, the users and non-users were divided into different SOC, as presented in Table 4.
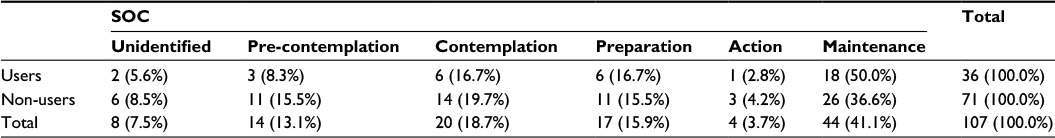 | Table 4 Classification of the users and non-users in different SOC, in absolute and relative frequencies Note: Unidentified=not possible to categorize. Abbreviation: SOC, stages of change. |
Regarding demographic variables, the chi-square tests showed no significant differences between users and non-users regarding gender, age, perceived health condition, disease/disability status, BMI, level of sedentary behavior at work, level of sedentary behavior during leisure time, or level of everyday PA. However, significant differences were seen between the users and non-users regarding level of education and level of physical exercise, as shown in Table 5.
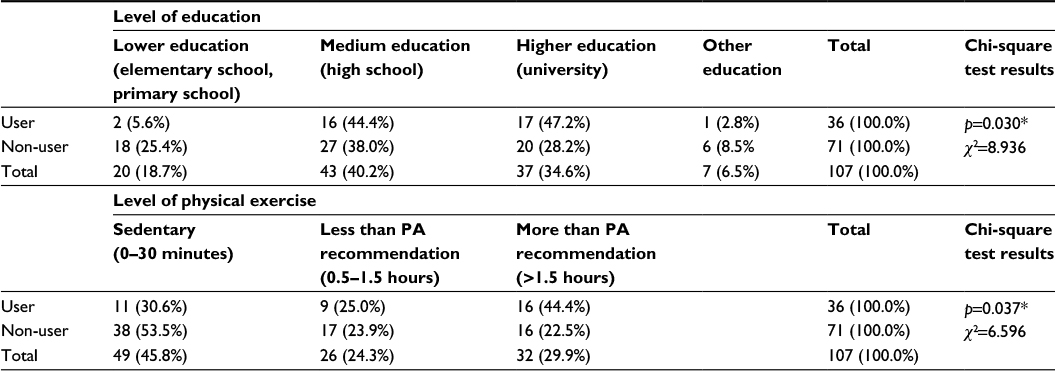 | Table 5 Absolute and relative frequencies and chi-square test results for the variables of level of education and level of physical exercise Note: *p<0.05. Abbreviation: PA, physical activity. |
Regarding the participants’ opinions of PA self-monitoring technologies (Q19 – measuring PA and Q21 – encouraging PA), the Mann–Whitney U test showed no significant differences between the users and non-users for 14 out of the 20 items in Q19 and 27 out of the 29 items in Q21. However, the remaining six items in Q19 and two items in Q21 showed significant differences between the two groups, as listed in Table 6. The items with significant differences are presented as mean, SD, and p-value.
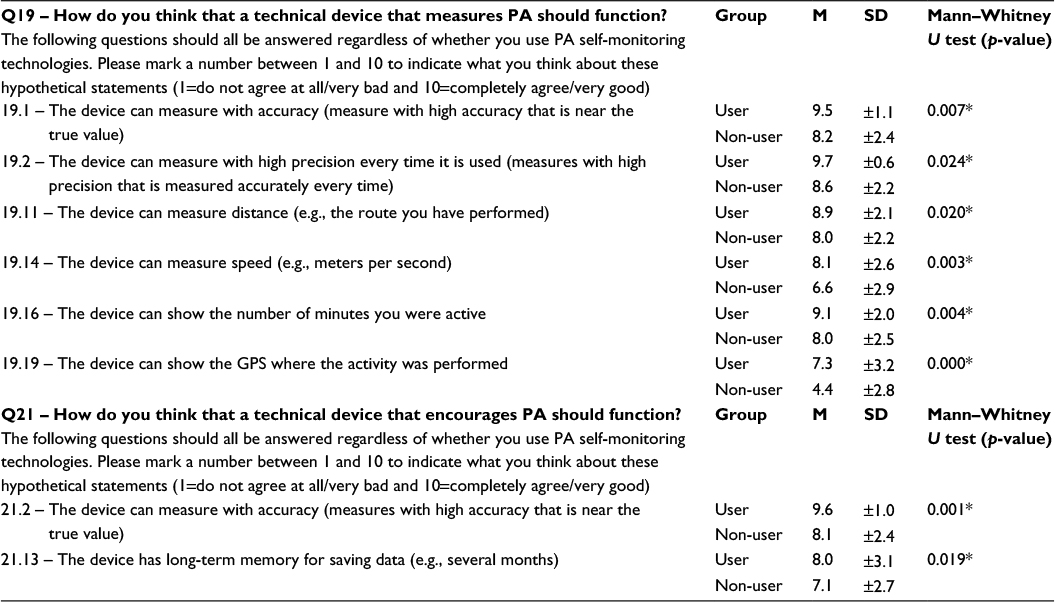 | Table 6 Descriptive statistics and Mann–Whitney U test results for significant items in Q19 and Q21 Notes: n=32–34 (users) and n=63–66 (non-users). The results are divided into user and non-user groups and described with M, SD, and p-value. *p<0.05. Abbreviations: PA, physical activity; M, mean; SD, standard deviation; GPS, geographical position. |
Discussion
The results implied that the users and non-users had similar opinions regarding PA self-monitoring technologies. Only a few significant differences between the users and non-users were found regarding their opinions on how a technical device that measures and encourages PA should work, i.e., whether a device should measure accurately/perform accurate measurements, measure with high precision, measure distance, and show number of active minutes. All participants rated their level of agreement regarding these items as very good; however, the users rated their level of agreement slightly higher compared to the non-users. There were also differences between the groups regarding desired device characteristics, i.e., measurement speed, the ability to show geographical position, and the inclusion of long-term memory. For these characteristics, the users rated their level of agreement as good and the non-users scored their level of agreement as medium, i.e., neither good nor bad. This study also showed that there were no significant differences between the groups among most of the items. Both users and non-users agreed that it was bad if a technical device had the following functions: measurement of body temperature, measurement of air temperature, automatic reset at midnight, automatic reset when the device is first put on, post results on social media, and enabled participation in web-based competitions and in groups with the same device or activity interests. Both users and non-users agreed that it was very good if a technical product was easy to buy, economical, and had an instruction manual. For all the remaining variables, both users and non-users rated their level of agreement as medium good, a value between good and bad. As both groups had similar opinions regarding PA self-monitoring technologies, other factors in addition to those studied here may influence the use of these technologies.
Existing research within the health technology field has focused mainly on device-related or technical aspects and substantially less on individual use or adoption-related challenges.31 However, opinions or attitudes regarding technology in general have been studied by others. For instance, Robinson and Martin32 investigated social attitude differences between Internet users and non-users with the General Social Survey. The study of Robinson and Martin32 mostly showed no significant differences in social attitudes between the Internet users and non-users, and the few significant differences that were found could be explained by other factors, e.g., level of education. Thus, the present study seems to agree with earlier research investigating differences between users and non-users regarding technology in general.
Czaja et al20 claimed that technology adoption was influenced by sociodemographic factors as well as attitudes and cognitive abilities, e.g., older adults are less likely than younger adults to use technology in general. According to Patel and O’Kane,21 individual values, motivations, and preferences, as well as the context or situation, can influence the use of technology. In our study, 33% of the participants who answered the PHYS-PRO were users of PA self-monitoring technologies, which probably meant that they used these devices because the devices matched their needs, expectations, and requests; this is an instance of technological transition. Geels33 described technological transition as the method by which technological innovations arise, how they will be integrated into society, and where a technology meets and fulfills consumer needs to ultimately become stable over time.
A significant difference was shown between the users and non-users regarding the educational level. Almost all users (91.6%) reported medium or higher education compared with 66.2% of the non-users. Similar results were found when Gattiker and Howg23 investigated the influence of demographic variables on employees’ attitudes toward the effects of information technologies on working life. Their results implied that level of education might be one of the demographic variables that could explain the differences in attitudes between the users and non-users of information technology. Additionally, Vroman et al24 investigated older adults’ dispositions toward information communication technology (ICT) and found that elderly people with higher education or who were living with a partner were more likely to use ICT. Thus, the results regarding education in our study were similar to those of previous technology studies.
In this study, the level of physical exercise also showed significant differences because the number of participants who exercised more than the recommended amount in the users group was twice that of the non-users group. More than half (53.5%) of the non-users were sedentary compared to 30.6% of the users. This was interesting because it implied that half of the non-users were not sedentary, which was good and positive for their health. The findings also indicated that one-third of the PA self-monitoring technology users were sedentary. The results also showed that the majority of the participants in this study were non-users. Previous studies have shown that the use of pedometers12 and electronic activity monitor systems34 has the ability to increase the level of PA. Litman et al35 showed that users of mobile exercise monitoring applications were more likely to perform leisure time exercise compared with those who were not using monitoring applications. Our study agreed with earlier studies that showed that users are associated with higher levels of PA or exercise.
The results of the PHYS-PRO provided important information about the opinions of users and non-users on PA self-monitoring technologies that is important in the process of developing self-monitoring technology to support PA behavioral change. Middelweerd et al36 found that mobile applications that promoted PA used an average of five out of 23 potential behavioral change technologies, and Painter et al37 claimed that only a small part of published health behavior research is based on theory. The SOC are one of the core constructs in the transtheoretical model (TTM), which describes an individual’s willingness to act on a new, healthier behavior. PA interventions, which are based on the SOC model, have been shown to increase PA levels among adults.38 Regarding the participants in this study and their tendency to change PA behavior, >10% of the users were classified in the action stage (stages 4–5) compared to the non-users. The SOC classification showed that several users had performed actions to change their PA behavior compared to the non-users. However, because the users in this study were significantly more physically active than the non-users, it seemed logical that more of the users were classified in action stages.
This cross-sectional study only represented the opinions of the respondents at a certain point in time. The responses to the PHYS-PRO were collected during the year 2015, from February to May, to avoid distribution in the beginning of the new year (when it is common to make a resolution to start physical exercise) and to avoid distribution in the middle of the summer or winter. Regarding the choice to use a questionnaire, it is important to note that self-reported measures of PA have shown both high and low reliabilities compared to direct PA measurement methods.39 Almost all studies that support the relationship between regular PA and chronic diseases are based on self-reports,40 and the questionnaire is the most frequently used method of measuring PA in epidemiological studies.41 However, it is essential to consider the measurement qualities of a questionnaire41 in relation to the aims of a study. Therefore, a questionnaire was regarded as a suitable method to collect data.
The selection process was mainly based on a random sample with the exception of the geographical requirement, which generated larger samples for larger municipalities. The geographically proportional sample ensured an accurate reflection of the population, which therefore can be seen as a strength of the study. However, if we had the resources, it would have been interesting to increase the sample size, which possibly could have helped us to draw conclusion on a more detailed level, especially investigating different categories of users and non-users. Examples of such categories are elderly, young people, low education, or other education, which in the present study have few people in each group. For example, different categories of individuals are in focus in several studies that have investigated the concept of motivation in relation to PA.42–44 Another strength of this study was that instead of choosing only cities, whole municipalities were selected in order to obtain a larger variation of participants and a representative sample of the population in central Sweden. Nevertheless, the results can only be generalized to the total population of the seven municipalities in central Sweden or possibly similar populations with similar preconditions.
The external dropout rate in the study could be considered high. Approximately 25% of the external dropouts were individuals who clearly stated their unwillingness to participate in the study. Among those who were approached to participate, a relatively small percentage had moved out of the region or stated health reasons for not participating. The majority of the external dropouts were individuals who were not reachable. It was not possible to determine whether these individuals made a choice not to answer, whether they were not interested, or whether they could not be contacted. One respondent clearly stated that he/she did not answer the questions because he/she did not need technology during PA. Several actions were made in order to minimize the dropout rate. The test leader had conversations with several participants who stated that they were not interested in the study because they had no technology interest. The test leader tried to inform them that their opinions were just as important as the respondents who were interested in technology. Some individuals did not want to participate because they were, according to their opinion, not physically active or had a sedentary lifestyle. In these cases, the test leader explained that their participation was important to gain their opinions about PA self-monitoring devices in general and to be able to compare the opinions between the two groups of users and non-users. The test leader also tried to inform them that their PA level was not the focus of the study. Most of these respondents changed their mind and accepted to participate. A reflection is, however, that the original written information regarding these issues should have been more detailed.
Generally, possible explanations for the relatively large dropout rate in this study might be a combination of lack of interest from the potential respondent in technology in general, PA self-monitoring technologies specifically, PA, or combinations of these. The internal dropout rate was also minimized by completing missing items by phone. However, the relatively high dropout rate can be regarded as a limitation and possibly affected the results of this study.
Furthermore, a possible limitation could be the PHYS-PRO questionnaire, which was specifically developed for the present study. Although several parts of the questionnaire were taken from existing questionnaires, many of the questions and statements were modified to match the purposes of the present study. Several questions and statements were also developed to meet the specific aims of the study. Van Poppel et al45 investigated available PA questionnaires and concluded that the best questionnaire could not be determined. Therefore, they recommended selecting a PA-measuring questionnaire based on the purposes of the study. The Quality Assessment of Physical Activity Questionnaire (QAPAQ) checklist is a tool to determine measurement properties of PA questionnaires. The QAPAQ checklist includes nine quality properties: purpose, target population, setting, construct, recall period, justification, format, interpretability, and ease of use.46 The purpose and target population of the PHYS-PRO were clearly described in the instructions. The questions regarding PA (Q10–Q11) were not fully clear about the settings; however, the questions about sedentary behavior (Q12–Q13) were clear. The recall periods were fully described in all PA questions (Q10–Q13). To include all the participants’ opinions, new questions were developed (Q15–Q22); therefore, the development of the PHYS-PRO could be justified. Regarding the format, the number of questions and response options in the PHYS-PRO can be regarded as relevant. The web version of the PHYS-PRO was developed to be as similar as possible to the paper version. Some of the respondents stated that the questionnaire was difficult and somewhat “heavy” to answer and therefore the design of it can be reformed. If the PHYS-PRO is used in the future, then it should be revised. For example, improving the integration and design of the difficult parts (Q19–Q21) may make it simpler to answer. Thus, according to the quality assessment by Terwee et al,46 the PHYS-PRO fulfilled some criteria for high quality, but unfortunately not all. Therefore, psychometric studies are needed for the PHYS-PRO questionnaire before further use in the future.
Conclusion
This study indicated that users and non-users of PA self-monitoring technologies, with a few exceptions, have similar opinions regarding the functions of these technologies. However, the results showed significant differences regarding the levels of education and physical exercise between the users and the non-users. Therefore, differences in these demographic variables seemed more important to investigate than differences in opinions about the PA self-monitoring technologies between the two groups. This study also showed that a considerable number of the participants were non-users and that half of the non-users were also physically inactive. Because this relatively large group of individuals contained potential future users of PA self-monitoring technologies, the non-users’ opinions should be a focus for future studies. Studying this group would also be beneficial from a public health perspective.
Acknowledgment
This study was supported by the research profile Embedded Sensor Systems for Health (ESS-H), Mälardalen University, Västerås, Sweden, founded by the Knowledge Foundation (KKS), Sweden.
Disclosure
The authors report no conflicts of interest in this work.
References
World Health Organization. Preventing Chronic Diseases, a Vital Investment. Geneva: WHO; 2005. Available from: http://apps.who.int/iris/bitstream/10665/43314/1/9241563001_eng.pdf. Accessed May 10, 2015. | ||
World Health Organization. Global Strategy on Diet, Physical Activity and Health. Geneva: WHO; 2004. Available from: http://www.who.int/dietphysicalactivity/strategy/eb11344/strategy_english_web.pdf. Accessed May 11, 2015. | ||
Van Praag H. Neurogenesis and exercise: past and future directions. Neuromolecular Med. 2008;10(2):128–140. | ||
Nieman DC, Henson DA, Austin MD, Sha W. Upper respiratory tract infection is reduced in physically fit and active adults. Br J Sports Med. 2010;45(12):987–992. | ||
Hillman CH, Erickson KI, Kramer AF. Be smart, exercise your heart: effects on brain and cognition. Nat Rev Neurosci. 2008;9:58–65. | ||
Sibley BA, Etnier JL. The relationship between physical activity and cognition in children. A meta-analysis. Pediatr Exer Sci. 2003;15:243–256. | ||
U.S. Department of Health and Human Services. Physical Activity and Health: A Report from the Surgeon General. Atlanta, GA: Center for Disease Control and Prevention, National Center for Chronic Disease Prevention and Health Promotion; 1996. Available from: http://www.cdc.gov/nccdphp/sgr/pdf/sgrfull.pdf. Accessed June 1, 2016. | ||
International Society for Physical Activity and Health. The Toronto Charter for Physical Activity: A Global Call for Action. Toronto, ON: ISPAH; 2010. Available from: http://www.interamericanheart.org/images/PHYSICALACTIVITY/TorontoCharterPhysicalActivityENG.pdf. Accessed May 1, 2016. | ||
Caspersen CJ, Powell KE, Christenson GM. Physical activity, exercise and physical fitness: definitions and distinctions for health-related research. Public Health Rep. 1985;100(2):126–131. | ||
Barnes J, Behrens TK, Benden ME, et al. Sedentary behaviour research network: letter to the editor: standardized use of the terms “sedentary” and “sedentary behaviours”. Appl Physiol Nutr Metab. 2012;37:540–542. | ||
Dishman RK, Washburn RA, Heath G. Physical Activity Epidemiology. Champaign, IL: Human Kinetics; 2004. | ||
Bravata DM, Smith-Spangler C, Sundaram V, et al. Using pedometers to increase physical activity and improve health: a systematic review. JAMA. 2007;298(19):2296–2304. | ||
Tudor-Locke C, Williams JE, Reis JP, Pluto D. Utility of pedometers for assessing physical activity: convergent validity. Sports Med. 2002;32(12):795–808. | ||
Bandura A. Health promotion by social cognitive means. Health Educ Behav. 2004;31(2):143–164. | ||
Wilkowska W, Ziefle M. Privacy and data security in E-health: requirements from the user’s perspective. Health Informatics J. 2012;18(3):191–201. | ||
Shah SG, Robinson I. Benefits of and barriers to involving users in medical device technology development and evaluation. Int J Technol Assess Health Care. 2007;23(1):131–137. | ||
Bridgelal RM, Grocott PR, Weir HC. Issues and challenges of involving users in medical device development. Health Expect. 2008;11(1):63–71. | ||
Bitterman N. Design of medical devices – a home perspective. Eur J Intern Med. 2011;22(1):39–42. | ||
Van der Weegen S, Verwey R, Spreeuwenberg M, Tange H, van der Weijden T, de Witte L. The development of a mobile monitoring and feedback tool to stimulate physical activity of people with a chronic disease in primary care: a user-centered design. JMIR Mhealth Uhealth. 2013;1(2):e8. | ||
Czaja SJ, Charness N, Fisk AD, et al. Factors predicting the use of technology: findings from the Center for Research and Education on Aging and Technology Enhancement (CREATE). Psychol Aging. 2006;21(2):333–352. | ||
Patel M, O’Kane A. Contextual influences on the use and non-use of digital technology while exercising at the gym. In: Proceedings of the 33rd Conference on Human Factors in Computing Systems (CHI-2015); April 18–23, 2015; Seoul, Republic of Korea. New York, NY: ACM; 2015. | ||
Barton PL, Brega AG, Devore PA, et al. Specialist physicians’ knowledge and beliefs about telemedicine: a comparison of users and nonusers of the technology. Telemed J E Health. 2007;13(5):487–499. | ||
Gattiker UE, Howg LW. Information technology and quality of work life: comparing users with non-users. J Bus Psychol. 1990;5:2. | ||
Vroman KG, Arthanat S, Lysack C. “Who over 65 is online?” Older adults’ dispositions toward information communication technology. Comput Human Behav. 2015;43:156–166. | ||
Public Health Institute. Health on Equal Terms, A Survey about Health and Living Conditions in Sweden. Public Health Institute; 2012. Available from: http://www.lul.se/Global/LLK/H%C3%A4lsa%20p%C3%A5%20lika%20villkor%202012.pdf. Accessed January 5, 2015. | ||
CDUST municipalities (the municipalities of Sörmland, Uppsala, Värmland, Västmanland and Örebro). Life and Health 2008 – A Study on Health, Lifestyles and Living Conditions. CDUST; 2008. Available from: http://www.landstingetsormland.se/PageFiles/35424/Enk%C3%A4t%20-%20Liv%20och%20h%C3%A4lsa%202008.pdf. Accessed January 4, 2015. | ||
Armstrong T, Bull F. Development of the World Health Organization Global Physical Activity Questionnaire (GPAQ). J Public Health. 2006;14:66–70. | ||
Marcus BH, Forsyth LH. Motivating People to be Physically Active. Champaign, IL: Human Kinetics; 2003. | ||
euro.who.int [webpage on the Internet]. Body Mass Index – BMI. Geneva: World Health Organization website. Available from: http://www.euro.who.int/en/health-topics/disease-prevention/nutrition/a-healthy-lifestyle/body-mass-index-bmi. Accessed June 1, 2016. | ||
Field A. Discovering Statistics using IBM SPSS Statistics. 4th ed. London: Sage Publications; 2013. | ||
Shih PC, Han K, Poole ES, Rosson MB, Carroll, JM. Use and adoption challenges of wearable activity trackers. In: Proceedings of the iConference 2015; March 24–27, 2015; Newport Beach, CA, USA. | ||
Robinson JP, Martin SP. Social attitude differences between internet users and non-users. Inform Comm Soc. 2009;12(4):508–524. | ||
Geels FW. Technological transitions as evolutionary reconfigurations processes: a multi-level perspective and a case-study. Res Policy. 2002;31:1257–1274. | ||
Lewis HZ, Lyons EJ, Jarvis JM, Baillargeon J. Using an electronic activity monitor system as an intervention modality: a systematic review. BMC Public Health. 2015;15:583. | ||
Litman L, Rosen Z, Spierer D, Weinberger-Litman S, Goldshein A, Robinson J. Mobile exercise apps and increased leisure time exercise activity: a moderated mediation analysis of the role of self-efficacy and barriers. J Med Internet Res. 2015;17(8):e195. | ||
Middelweerd A, Mollee JS, van der Wal CN, Brug J, te Velde SJ. Apps to promote physical activity among adults: a review and content analysis. Int J Behav Nutr Phys Act. 2014;11:97. | ||
Painter JE, Borba CPC, Hynes M, Mays D, Glanz K. The use of theory in health behavior research from 2000 to 2005: a systematic review. Ann Behav Med. 2008;35(3):358–362. | ||
Marcus BH, Lewis BA. Physical activity and the stages of motivational readiness for change model. Res Digest. 2003;4(1):2–10. | ||
Prince SA, Adamo KB, Hamel M, Hardt J, Gorber SC, Tremblay M. A comparison of direct versus self-report measures for assessing physical activity in adults: a systematic review. Int J Behav Nutr Phy Act. 2008;5:56. | ||
Haskell WL. Physical activity by self-report: a brief history and future issues. J Phys Act Health. 2012;9(suppl 1):S5–S10. | ||
Pols MA, Peeters PH, Kemper HC, Grobbee DE. Methodological aspects of physical activity assessment in epidemiological studies. Eur J Epidemiol. 1998;14(1):63–70. | ||
Gavin J, Keough M, Abravanel M, Moudrakovski T, Mcbrearty M. Motivations for participation in physical activity across the lifespan. Int J Wellbeing. 2014;4(1):46–61. | ||
Kilpatrick M, Hebert E, Bartholomew J. College students’ motivation for physical activity: differentiating men’s and women’s motives for sport participation and exercise. J Am Coll Health. 2005;54(2):87–94. | ||
Park C-H, Elavsky S, Koo K-M. Factors influencing physical activity in older adults. J Exerc Rehabil. 2014;10(1):45–52. | ||
Van Poppel MN, Chinapaw MJ, Mokkink LB, van Mechelen W, Terwee CB. Physical activity questionnaires for adults: a systematic review of measurement properties. Sports Med. 2010;40(7):565–600. | ||
Terwee CB, Mokkink LB, van Poppel MN, Chinapaw MJ, van Mechelen W, de Vet HC. Qualitative attributes and measurement properties of physical activity questionnaires: a checklist. Sports Med. 2010;40(7):525–537. |
 © 2017 The Author(s). This work is published and licensed by Dove Medical Press Limited. The full terms of this license are available at https://www.dovepress.com/terms.php and incorporate the Creative Commons Attribution - Non Commercial (unported, v3.0) License.
By accessing the work you hereby accept the Terms. Non-commercial uses of the work are permitted without any further permission from Dove Medical Press Limited, provided the work is properly attributed. For permission for commercial use of this work, please see paragraphs 4.2 and 5 of our Terms.
© 2017 The Author(s). This work is published and licensed by Dove Medical Press Limited. The full terms of this license are available at https://www.dovepress.com/terms.php and incorporate the Creative Commons Attribution - Non Commercial (unported, v3.0) License.
By accessing the work you hereby accept the Terms. Non-commercial uses of the work are permitted without any further permission from Dove Medical Press Limited, provided the work is properly attributed. For permission for commercial use of this work, please see paragraphs 4.2 and 5 of our Terms.