")
Back to Journals » International Journal of Nanomedicine » Volume 17
TAT&RGD Peptide-Modified Naringin-Loaded Lipid Nanoparticles Promote the Osteogenic Differentiation of Human Dental Pulp Stem Cells
Authors Zheng CY, Chu XY, Gao CY, Hu HY, He X, Chen X, Yang K , Zhang DL
Received 21 April 2022
Accepted for publication 15 July 2022
Published 28 July 2022 Volume 2022:17 Pages 3269—3286
DOI https://doi.org/10.2147/IJN.S371715
Checked for plagiarism Yes
Review by Single anonymous peer review
Peer reviewer comments 2
Editor who approved publication: Dr Yan Shen
Chun-Yan Zheng,1,* Xiao-Yang Chu,2,* Chun-Yan Gao,1 Hua-Ying Hu,3 Xin He,1 Xu Chen,1 Kai Yang,4 Dong-Liang Zhang1
1Department of Orthodontics, Beijing Stomatological Hospital, Capital Medical University School of Stomatology, Capital Medical University, Beijing, People’s Republic of China; 2Department of Stomatology, Fifth Medical Center of Chinese PLA General Hospital, Beijing, People’s Republic of China; 3Birth Defects Prevention and Control Technology Research Center, Medical Innovation Research Division of Chinese PLA General Hospital, Beijing, People’s Republic of China; 4Prenatal Diagnosis Center, Beijing Obstetrics and Gynecology Hospital, Capital Medical University, Beijing, People’s Republic of China
*These authors contributed equally to this work
Correspondence: Dong-Liang Zhang, Department of Orthodontics, Beijing Stomatological Hospital, Capital Medical University School of Stomatology, Capital Medical University, 11 Xilahutong Road, Beijing, 100040, People’s Republic of China, Email [email protected]
Background: Naringin is a naturally occurring flavanone that promotes osteogenesis. Owing to the high lipophilicity, poor in vivo bioavailability, and extensive metabolic alteration upon administration, the clinical efficacy of naringin is understudied. Additionally, information on the molecular mechanism by which it promotes osteogenesis is limited.
Methods: In this study, we prepared TAT & RGD peptide-modified naringin-loaded nanoparticles (TAT-RGD-NAR-NPs), evaluated their potency on the osteogenic differentiation of human dental pulp stem cells (hDPSCs), and studied its mechanism of action through metabolomic analysis.
Results: The particle size and zeta potential of TAT-RGD-NAR-NPs were 160.70± 2.05 mm and – 20.77± 0.47mV, respectively. The result of cell uptake assay showed that TAT-RGD-NAR-NPs could effectively enter hDPSCs. TAT-RGD-NAR-NPs had a more significant effect on cell proliferation and osteogenic differentiation promotion. Furthermore, in metabolomic analysis, naringin particles showed a strong influence on the glycerophospholipid metabolism pathway of hDPSCs. Specifically, it upregulated the expression of PLA2G3 and PLA2G1B (two isozymes of phospholipase A2, PLA2), increased the biosynthesis of lysophosphatidic acid (LPA).
Conclusion: These results suggested that TAT-RGD-NPs might be used for transporting naringin to hDPSCs for modulating stem cell osteogenic differentiation. The metabolomic analysis was used for the first time to elucidate the mechanism by which naringin promotes hDPSCs osteogenesis by upregulating PLA2G3 and PLA2G1B.
Keywords: nanoparticles, TAT, RGD, hDPSCs, osteogenic differentiation
Introduction
Naringin (4’, 5, 7-trihydroxy flavanone-7-rhamnoglucoside) is a flavanone glycoside found in grape fruit and other citrus fruits and exhibits many pharmacological activities.1 It exists as a mixture of chiral isomers and is mixture of chiral isomers and is associated with fruit maturation and purification.2 Naringin is also used in traditional Chinese medical regimens for the treatment of osteoporosis.3 The anti-inflammatory, antioxidant, and anti-apoptotic properties of naringin were demonstrated in preclinical in vitro and in vivo models of atherosclerosis,4 cardiovascular disease,5 various cancers,6,7 diabetes mellitus,8 neurodegenerative conditions,9 osteoporosis,10 and rheumatic diseases.11 Naringin promotes the secretion of bone morphogenetic proteins (BMPs) and enhances the proliferation and osteoblast differentiation of BMSCs (bone marrow stromal cells), thus improving bone strength and bone mineral density.12
Naringin is highly lipophilic and accumulates more in the stomach and less in the brain due to the blood-brain barrier.2 However, as the in vivo bioavailability of naringin is poor and it causes extensive metabolic alterations, its clinical efficacy is limited.13 The main solvents for administering naringin in vivo and in vitro are DMSO (dimethyl sulfoxide) alcohols that have high cytotoxicity and poor cellular uptake and highly restrict the efficacy of naringin.14 Researches on the method to prepare naringin were very limited, and there was no targeted modification of nanoparticles. For example, naringin-loaded micelles15 were prepared with the aim to augment its pro-osteogenic effect in human adipose-derived stem cells (hASCs). Naringin nano micellar formulations attained a higher pro-osteogenic effect than that of free drug, but the internalization efficiency was unsatisfactory. Naringin was added directly into gelatin methacryloyl (GelMA) film16 or metal-organic frameworks (MOFs)17 to control drug release. Peptide nanobiotechnology18 has experienced a long and enduring development and plays an important role in drug delivery.19,20 The nanoparticles modified with functional peptides can increase biocompatibility, cellular interactions, and receptor targeting.21
To address these limitations, in this study, we prepared the naringin-loaded liposome nanoparticles modified with TAT & RGD peptides (TAT-RGD-NAR-NPs) and evaluated their osteogenic differentiation effects on human dental pulp stem cells (hDPSCs). The arginine-glycine-aspartate (RGD) tripeptides are conjugated to nanoparticles to enhance their ability to target ligands that can bind specific receptors on the cell membrane, such as αvβ3 integrin, and are also responsible for adhering cells to the extracellular matrix.22 RGD peptides have been used extensively in biomedical research.23 Integrins are a group of transmembrane receptors that mediate interactions between cells and components of the extracellular matrix.24 Integrinαvβ3 are prominent receptors associated with the adhesion and osteogenic differentiation of osteoblasts and mesenchymal stem cells (MSCs) but are usually expressed at low levels.25 Naringin is highly lipophilic with poor drug solubility and low cellular uptake and thus, cannot enter the membrane and the nucleus efficiently. To overcome this problem, cell-penetrating peptides (CPPs), derived from the transactivator of transcription (TAT), which facilitate cellular uptake of various molecular cargos, were covalently or non-covalently attached to nanoparticles.26 The results indicated that the TAT&RGD-modified naringin-loaded nanoparticles internalized more drugs in the cells than that achieved by the same concentration of free naringin.
Metabolomics is a very powerful research tool in the field of natural and life sciences for elucidating biological perturbations in response to internal or external stimuli.27 We performed metabolomic analysis by conducting ultra-performance liquid chromatography combined with quadrupole time-of-flight tandem mass spectrometry (LC-MS/MS) to investigate the mechanism by which naringin promotes the osteogenic differentiation of hDPSCs. We used the non-targeted approach to detect the overall profile in a single analysis and combined it with multivariate statistics to identify biomarkers that were different from the control. These findings provided an insight into the mechanism by which naringin influences osteogenic differentiation of DPSCs, and thus, this study might provide a scientific basis for the clinical application of naringin. The schematic illustrations of TAT-RGD-NAR-NPs and their cellular behavior are shown in Figure 1.
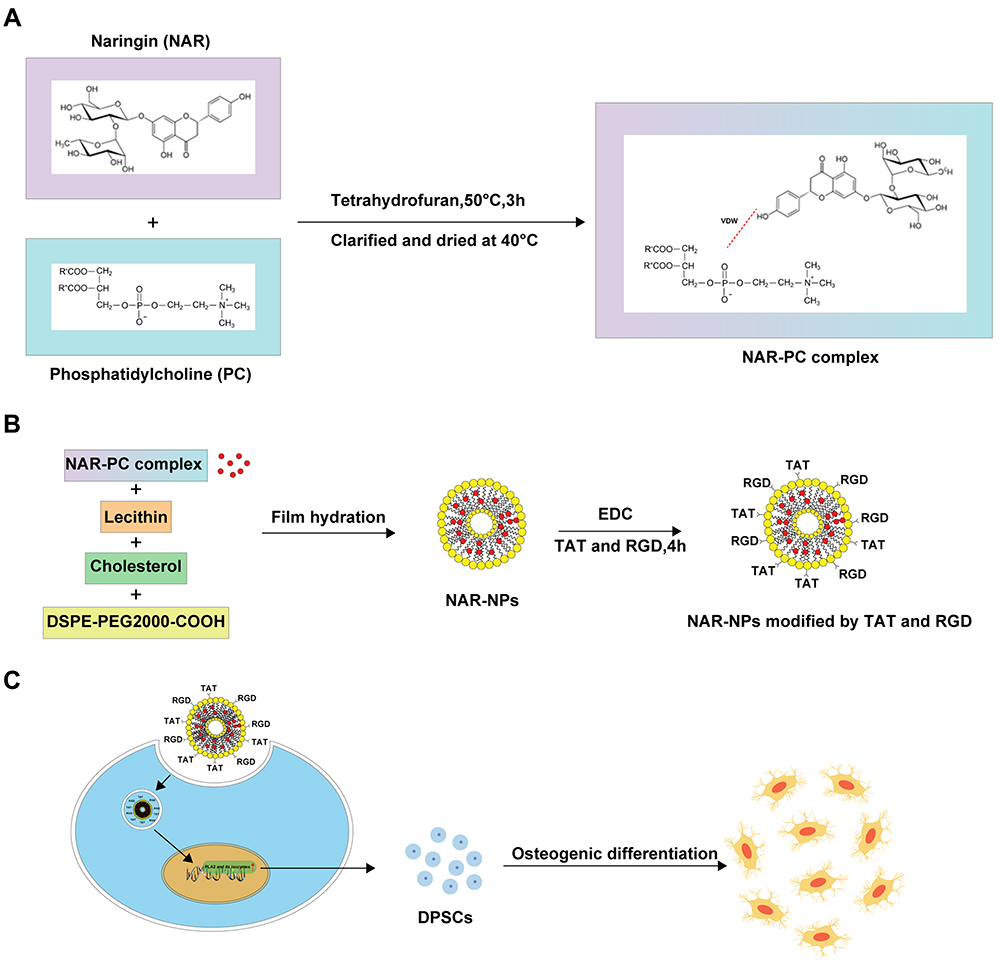 |
Figure 1 Schematic diagram of the process of this study. (A) Synthesis of NAR-PC complex. (B) Modification process of NAR-NPs. (C) A schematic diagram of the mechanism by which modified NAR-NPs promote osteogenic differentiation of hDPSCs. Abbreviations: NAR, naringin; NPs, nanoparticles. |
Experimental procedures
Materials
Naringin was purchased from J&K Scientific Co., Ltd. (Purity 98%, Beijing, P. R. China). The peptides TAT (YGRKKRRQRRR, Purity 98.53%) and RGD (Purity 98.88%) were synthesized by China Peptides Co., Ltd. (Suzhou, P. R. China). Phosphatidylcholine, DSPE-PEG2000-COOH, and cholesterol were purchased from Sunlipo Biotechnology Co., Ltd. (Shanghai, P. R. China). Coumarin (C6) was purchased from Beijing Perenley Biotechnology Co., Ltd.(Beijing, P. R. China). The fluorescein isothiocyanate/propidium iodide (FITC/PI) apoptosis detection kit and the cell counting kit-8 (CCK-8) were bought from Dojindo Laboratories (Kumamoto, Japan). 5-diphenyltetrazolium bromides (MTTs) were purchased from Sigma Aldrich (St Louis, MO, USA). Fetal bovine serum (FBS) and theα-MEM medium were provided by Thermo Fisher Scientific (Waltham, MA, USA). Trypsin-EDTA (0.25%), the penicillin/streptomycin solution and the PBS buffer were provided by Bairui Biotechnology Co., Ltd.(Nanjing, P. R. China).
All regular chemicals were of reagent grade and were purchased from Sigma-Aldrich unless otherwise stated.
Synthesis and Formulation of TAT &RGD-Modified Naringin-Loaded Nanoparticles (TAT-RGD-NAR-NPs)
The naringin-loaded liposomes were prepared before the synthesis of the TAT-RGD-NAR-NPs. Naringin (NAR) and phosphatidylcholine (PC) (molar ratio: 1.2:1) were placed in a triangular flask containing 100 mL of tetrahydrofuran. After stirring the mixture for 3h in a water bath at 50℃, the tetrahydrofuran was clarified and dried at 40℃ under reduced pressure. Free naringin was removed by passing the solution through a membrane (0.22 µm) after the NAR-PC was dissolved in petroleum ether. The filtrate was evaporated by reducing the pressure, and the purified NAR-PC was collected.
Next, 1.5mg of NAR-PC, 5.5mg of lecithin, 2mg of cholesterol, and 1mg of DSPE-PEG2000-COOH were dissolved in 2mL anhydrous methanol. A lipid film formed at the bottom of the eggplant-shaped bottle by vacuum distillation. Then, 5mL PBS solution (pH = 7) was added, and the nanoliposome-loaded naringin was obtained by extrusion filtration with 400 nm, 200 nm, 100 nm, and 80 nm filter membrane and stored at 4℃. The blank NPs were prepared by the same method as the control particles.
The pH of the naringin liposome solution was adjusted to 6 by adding disodium hydrogen phosphate solution. The carboxyl group of the NAR-NPs was activated by EDC (0.1mg/mL), and then the solution was incubated for 4 h with the peptides TAT and RGD (5mg/mL, respectively). The unattached polypeptide was removed from the Sephadex-25 gel column after 4 h of incubation. The NAR-NPs were modified by the TAT and RGD peptides. The solution was concentrated using an ultrafiltration centrifugation column and stored at 4℃.
Physicochemical Characterization
The particle size and zeta potential of the NPs were measured by dynamic light scattering and electrophoretic light scattering (Mastersizer 3000; Malvern Instruments Ltd., Malvern, UK). The morphological characteristics of the NPs were observed under a transmission electron microscope (JEOL2010; Japan Electronics Co., Ltd., Japan).
Drug Loading and in vitro Drug Release
The NAR-NPs were broken down thoroughly by ultrasound for 10 min after the NAR-NPs (10µL) were dissolved in methanol (90µL). Then, 50µL of the supernatant from the centrifuged solution was diluted to 1mL with the mobile phase (acetonitrile: water =20:80). Finally, the concentration of naringin was determined at 283nm using an HPLC system (LC-16; Shimadzu Corporation, Japan). The column used was Zorbax SB-C18 (5µm, 4.6mm×200mm), the mobile phase was acetonitrile: water (20:80), the injection volume of the sample was 20µL, the flow rate was 1mL/min, and the column was maintained at 25℃. The percentage of drug loading (DL%) of naringin in the NAR-NPs was calculated as follows:

The in vitro release of naringin of TAT-RGD-NAR-NPs was evaluated with the dialysis diffusion technique.15 Briefly, the samples of TAT-RGD-NAR-NPs solution (0.5mL, 0.5mg/mL) and naringin solution (0.5mL, 0.5mg/mL) were added into a dialysis bag (12kDa). The bags were immersed in 30mL sodium salicylate solution (1 M, pH7.4) and shacked at 100rpm, 37℃. A measured quantity of 0.5mL sodium salicylate solution was taken out and replaced with 0.5mL fresh solution at each time interval. The content of naringin in each sample was detected by the above established HPLC method after being centrifuged (12,000 rpm, 10 minutes). Finally, the accumulative release of naringin was calculated and plotted.
Cell Line and Cell Culture
Human dental pulp stem cells (hDPSCs) were used for the in vitro experiments. The tooth surface was sterilized with 75% ethanol, and the pulp was removed in a sterile environment. The pulp was washed with PBS and cut into 1.0mm3 pieces in the α-MEM medium. Then, 0.3% type I collagenase and 0.4% neutral protease (0.5mL each) were added to the culture medium. The centrifuge tube was gently shaken to allow the pulp pieces to thoroughly mix with the digestive medium for 30 min at 37℃. An equal volume of α-MEM, containing 20% fetal bovine serum (FBS), was added to terminate digestion. The cell precipitate and tissue mass were gently blown and centrifuged (1100rpm for 6min). The supernatant was discarded, and the α-MEM medium containing 20% fetal bovine serum was added. The cell precipitate was gently blown to form a mixture of single-cell suspension and loose tissue mass and cultured in culture bottles (25cm2) at 37℃ in a 5% carbon dioxide incubator. The medium was changed once a week before cell growth and then once every three days. The cells were cultured in an α-MEM medium containing 15% FBS, 1% penicillin, and 1% glutamine after the cell density reached 80%. The third-generation dental pulp cells were used for the experiment. The expression of CD44, CD90, CD105, CD11b, CD34, CD45, and CD14 of hDPSCs was detected by flow cytometry.
Cellular Uptake Analysis
Naringin in the NAR-NPs and TAT-RGD-NAR-NPs was replaced by coumarin-6 (C6) to observe and analyze the cellular uptake and localization of the NAR-NPs and TAT-RGD-NAR-NPs. The uptake of the NPs in the hDPSCs was initially evaluated by confocal laser scanning microscopy (CLSM, TCS SP8, Leica, Germany). The cells were cultured in a fresh medium containing C6-loaded NPs, C6-loaded TAT-RGD-NPs, or free C6 (1μg/mL) for 5, 15, 30, and 60 min. The cells were finally observed through CLSM. Besides analyzing the CLSM data, the uptake of C6-loaded NPs, C6-loaded TAT-RGD-NPs, or free C6 in the hDPSCs was quantitatively analyzed through flow cytometry (FCM, Becton Dickinson, Franklin Lakes, NJ, USA).
Cell Viability Assay
The effective concentration of naringin in hDPSCs was determined by performing the MTT assay. The hDPSCs were used in this assay and seeded in 96-well plates (2×10⁴ cells/mL, 100µL/well). The cells were treated with different concentrations of naringin (blank, 10, 50, or 100μg/mL) and incubated for 1d, 3d, and 7d. Subsequently, the hDPSCs were incubated with the MTT solution for 4 h, and then 150μL DMSO was added to dissolve the intracellular formazan crystals. The OD was recorded by a microplate reader (Rayto RT-6000, Shenzhen, China) at 595nm.
The cytotoxicity of the NPs copolymer and the proliferation effect of NPs in vitro were determined by performing theCCK-8 assay. Briefly, the hDPSCs (2×10⁴cells/mL, 100µL/well) were cultured for 24h for attachment in the 96-well plates, and then, they were treated and cultured with the blank, free naringin, TAT-RGD-NPs, NAR-NPs, and TAT-RGD-NAR-NPs with 100μg/mL naringin or an equal concentration of the other carriers for 1d, 3d, 5d, 7d, and 9d. Following the instructions provided in the CCK-8 kit, the cells were cultured in the CCK-8 reagent for 4 h and analyzed at 450nm using a microplate reader. The morphological changes in the cells of each group were observed using an inverted microscope (IX71, OLYMPUS, Germany) at each time point.
The viability of the hDPSCs was further examined by performing a staining assay of the living and dead cells after 7d. The cells were stained and incubated for 20 min at room temperature in the dark and observed through CLSM. Living cells were stained green, and the dead cells were stained red.
Cell Apoptosis Assay
The apoptosis of the hDPSCs caused by free naringin, TAT-RGD-NPs, NAR-NPs, and TAT-RGD-NAR-NPs was quantitatively analyzed by the Annexin V-FITC/PI double staining assay. The hDPSCs were seeded in six-well plates (1.5×10⁵/well) and cultured for 24h. The cells in each well were washed twice after treatment with a culture medium containing a solution of naringin, TAT-RGD-NPs, NAR-NPs, and TAT-RGD-NAR-NPs (100μg/mL naringin) for 7d, collected and centrifuged, dispersed in a binding buffer, and treated following the Annexin V-FITC and PI staining protocol provided by the manufacturer. The samples were analyzed by FCM.
Cell Cycle Analysis
The effect of naringin, TAT-RGD-NPs, NAR-NPs, and TAT-RGD-NAR-NPs on the cell cycle of the hDPSCs was analyzed by FCM. The hDPSCs were seeded in a six-well plate and incubated at 37℃ for 24h to adhere. Then, the cells were cultured with the culture medium containing a solution of naringin, TAT-RGD-NPs, NAR-NPs, and TAT-RGD-NAR-NPs (100μg/mL naringin) for 7d. The cells were harvested and transferred to 70%ethanol (cold) for 24h at –20℃. The fixed cells were washed with PBS twice and resuspended in 0.5mL cell cycle staining solution for 20 min at room temperature. The samples were quickly analyzed by FCM.
Determination of VEGF by Real-Time PCR
The expression of VEGF RNA in the hDPSCs cultured with the solution containing naringin, TAT-RGD-NPs, NAR-NPs, and TAT-RGD-NAR-NPs (100μg/mL naringin) for 7d was tested by real-time PCR. The RNA was extracted using the RNA simple Total RNA Kit (Yuduo Biotechnology Co., Ltd., Shanghai, China) following the manufacturer’s protocol. The primer sequences and the amplification program are summarized in Table 1. The amplification reactions were performed in duplicate, and the amount of cDNA in the reactions was normalized by using an internal control, which was the constitutively expressed gene GAPDH. The expression of the VEGF mRNA in each group was calculated.
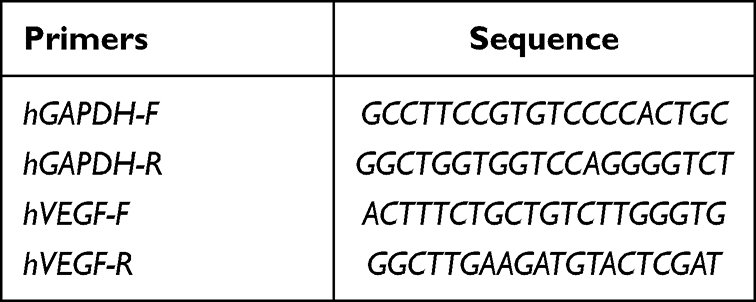 |
Table 1 The Details of the Primer Sequences for hVEGF and Control |
Pro-Osteogenic Activity in hDPSCs
Alkaline Phosphatase (ALP) Staining
The ALP activity in the hDPSCs, cultured with the solution containing naringin, TAT-RGD-NPs, NAR-NPs, and TAT-RGD-NAR-NPs (100μg/mL naringin) for 7d and 14d, was preliminarily observed by ALP staining. The cells were treated with the alkaline phosphatase calcium cobalt staining kit (KeyGEN BioTECH Co. Ltd., Jiangsu, China) following the manufacturer’s protocol. The stained cells were observed and photographed by an inverted microscope and detected by the microplate reader at 450nm.
Expression of the ALP, OCN, RUNX2, BSP, and OSX Genes
The expression of osteogenesis-related genes (ALP, OCN, RUNX2, BSP, and OSX) in the hDPSCs cultured with the solution containing naringin, TAT-RGD-NPs, NAR-NPs, and TAT-RGD-NAR-NPs (100μg/mL naringin) for 14d and 21d was evaluated by conducting real-time PCR. The RNA was extracted using the RNA simple Total RNA Kit. The sequences and the amplification program of the primers are summarized in Table 2. The relative level of expression of each gene was calculated.
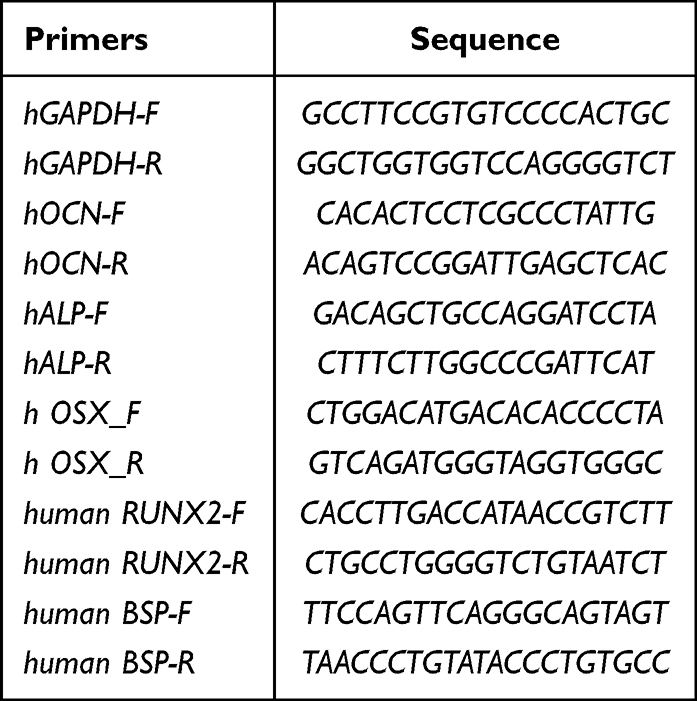 |
Table 2 The Details of the Primer Sequences for a Set of Osteogenic Markers and Control |
Mineralization
To evaluate the mineralization effect of naringin, TAT-RGD-NPs, NAR-NPs, and TAT-RGD-NAR-NPs on the hDPSCs, we performed Alizarin Red S staining to determine the deposition of calcium nodes in the mineralized cell monolayer. The hDPSCs were cultured for 14d and 21d in each group, fixed in 4% formaldehyde for 30 min and stained with the Alizarin Red S stain (Leagene Biotech Co. Ltd., Beijing, China) following the manufacturer’s protocol. The stained cells were observed and photographed using an inverted microscope and then were decolorized and detected using a microplate reader at 490nm.
Metabolomic Analysis
Non-target metabolomic analysis of the hDPSCs treated with TAT-RGD-NPs, naringin, NAR-NPs, and TAT-RGD-NAR-NPs was performed with non-treated hDPSCs as the control group (n=3). Briefly, all cells in each group were collected, and 1000µL of the extract solution (acetonitrile: methanol: water = 2:2:1) was added. The cell solution was mixed thoroughly for 5 min by vortexing, incubated for 1h at −20℃, centrifuged at 12,000 rpm for 15min, and the supernatant was collected and vacuum dried. The obtained substance was redissolved with 100µL of acetonitrile and tested. Liquid chromatography-tandem mass spectrometry was performed using an ultrahigh-performance liquid chromatography system (Nexera X2 system; Shimadzu Corporation, Japan) with an Agilent ZORBAX Eclipse Plus C18 column (2.1×100 mm, 3.5µm) coupled to a mass spectrometer (Triple TOF 5600+, AB SCIEX Corporation; USA). The mobile phase consisted of A: H2O (0.1% Formic Acid), B: Acetonitrile (0.1% Formic Acid); gradient elution was performed, the injection volume of the sample was 3µL, the flow rate was 0.5mL/min, and the column was maintained at 35℃.
The mass spectrometer with ionization mode of positive and negative ions was controlled by the acquisition software (Analyst TF 1.6, Marker View 1.2.1, AB SCIEX Corporation, USA). The ion source temperature was 120℃, the desolvation temperature was 500℃, the desolvation nitrogen flow was 600L/h, and the cone gas flow was 50L/h. The capillary ionization voltages of positive and negative ion modes were 3.0kV and 4.5kV, respectively, the sampling cone voltage was 27eV, the extraction cone was 4eV, and the quadrupole scanning range was 50–1500m/z. The data were analyzed using MetaboAnalyst 5.0.
Statistical Analysis
Statistical analysis was conducted using SPSS 22 (IBM Corporation, Armonk, NY, USA). The results are shown as the mean±SD. The differences among the groups were determined by performing ANOVA. The Student’s t-test was performed to evaluate significant differences between groups with *P<0.05, **P<0.01, and ***P<0.001.
Results
Preparation and Characterization of TAT-RGD-NAR-NPs
The NAR-NPs were prepared according to the method described above. Free naringin was removed by passing the solution through a membrane (0.22µm) after NAR-PC was dissolved in petroleum ether. NAR-PC was collected by evaporating petroleum ether.
The morphological characteristics of the blank NPs, NAR-NPs, and TAT-RGD-NAR-NPs were observed under a transmission electron microscope (TEM), and the NPs appeared spherical (Figure 2A). The particle size and zeta potential of the blank NPs, NAR-NPs, and TAT-RGD-NAR-NPs were measured by dynamic light scattering and electrophoretic light scattering (Table 3, Figure 2B and C). The particle size of the blank NPs, NAR-NPs, and TAT-RGD-NAR-NPs were 126.07±0.42nm, 155.57±0.64nm, and 160.70±2.05 mm, respectively. The zeta potentials of the blank NPs, NAR-NPs, and TAT-RGD-NAR-NPs were –26.80±0.56mV, –31.17±0.65mV, and –20.77±0.47mV, respectively. The TEM showed that the nanoparticles were successfully prepared and were less than 200 nm in diameter. The size and surface potential changes confirmed the successful conjugation of the peptides TAT and RGD to the nanoparticles.
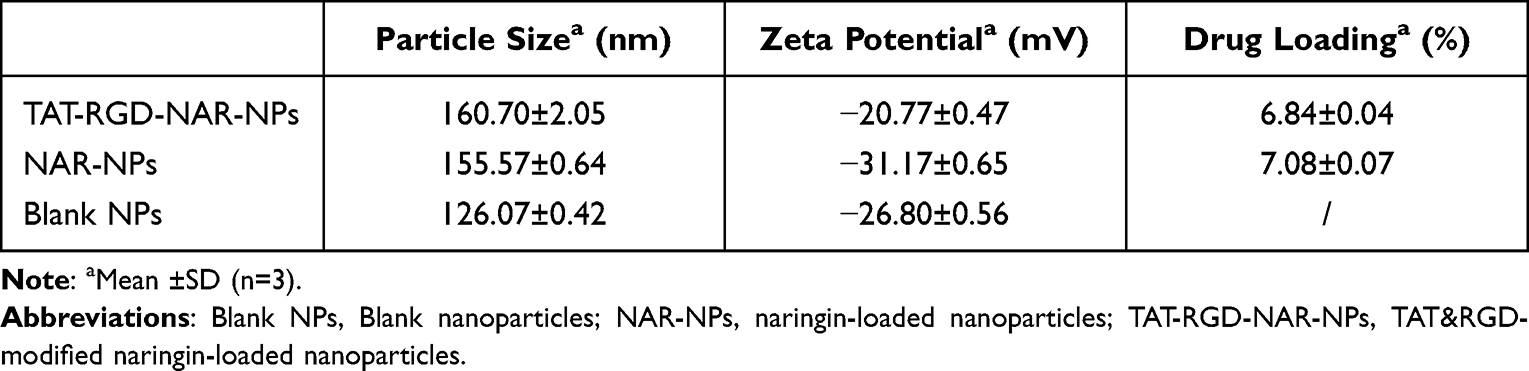 |
Table 3 Physicochemical Characterization of the Nanoparticles |
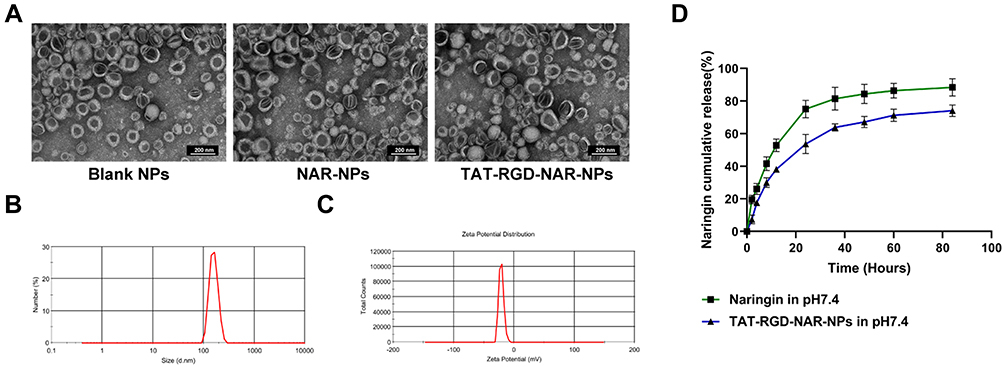 |
Figure 2 Characterization of the TAT-RGD-NAR-NPs. (A) TEM images of the Blank NPs, NAR-NPs, and TAT-RGD-NAR-NPs (scale bar: 200 nm). (B) The size distribution of the TAT-RGD-NAR-NPs. (C) The zeta potential of the TAT-RGD-NAR-NPs. (D) The study of release behavior of TAT-RGD-NAR-NPs in vitro. The release of naringin from TAT-RGD-NAR-NPs at pH7.4 compared with naringin solution. Abbreviations: Blank NPs, Blank nanoparticles; NAR-NPs, naringin-loaded nanoparticles; TAT-RGD-NAR-NPs, TAT&RGD-modified naringin-loaded nanoparticles; TEM, transmission electron microscopy. |
The size and encapsulation are important factors for drug-loaded NPs to function properly. We prepared a high entrapment of NAR using a film hydration method. The DL% of the NAR-NPs (7.01%) and the TAT-RGD-NAR-NPs (6.82%) were calculated by performing HPLC.
The in vitro release profile of naringin from TAT-RGD-NAR-NPs was investigated by the dialysis method (Figure 2D). This study was performed in PBS buffer (pH7.4) to simulate physiological conditions. The release of naringin from naringin group reached 52.9±3.8% at 12h, 81.4±7.0% at 36h, and the drug release from TAT-RGD-NAR-NPs was 38.1±1.8% and 63.9±2.2%, respectively.
Cellular Uptake
The uptake of the NPs in the hDPSCs was initially evaluated by performing confocal laser scanning microscopy. The cells were cultured with a fresh medium containing C6-loaded NPs, C6-loaded TAT-RGD-NPs, or free C6 (1μg/mL) for 5, 15, 30, and 60 min. The blue and green fluorescence signals indicated that the cell nuclei were stained with DAPI and C6, respectively (Figure 3A). The signals of C6 were more conspicuous after incubation with the C6-loaded TAT-RGD-NPs for 5 min compared to the visibility of the cells incubated with free C6 or C6-loaded NPs, and the signal strength increased at 15, 30, and 60 min. Besides analyzing the CLSM data, the cellular uptake of the C6-loaded NPs, C6-loaded TAT-RGD-NPs, or free C6 in the hDPSCs was quantitatively analyzed by performing flow cytometry. The results of FCM confirmed the results of confocal laser scanning microscopy (Figure 3B and C).
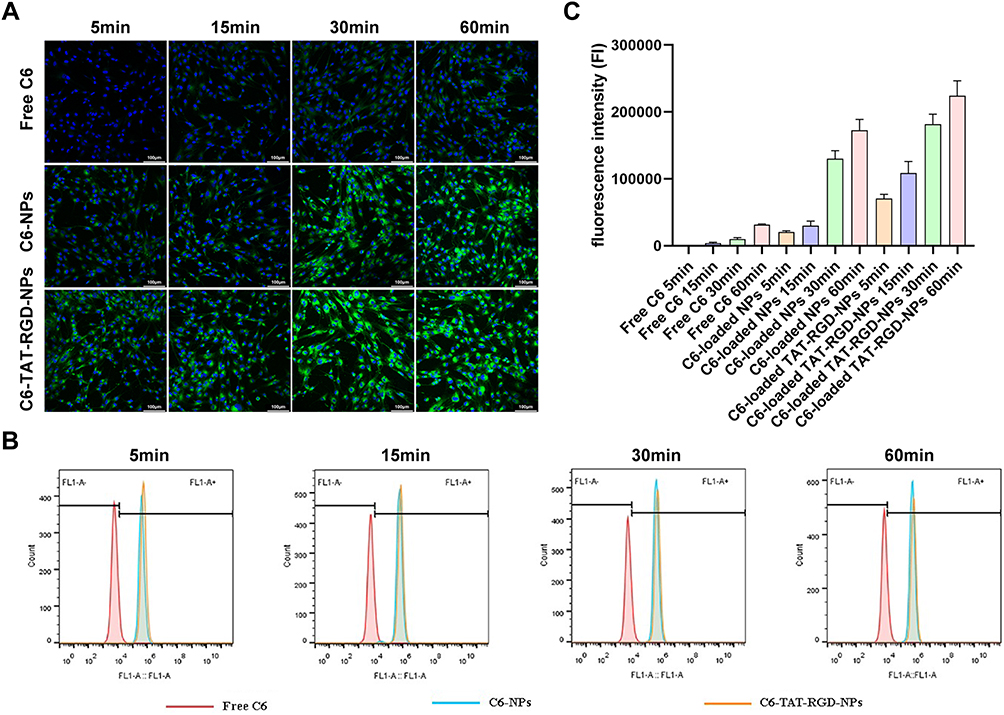 |
Figure 3 The cellular uptake studies of free C6, C6-loaded NPs, or C6-loaded TAT-RGD-NPs. (A) Observation of the hDPSCs by confocal microscopy after treatment with free C6, C6-loaded NPs, or C6-loaded TAT-RGD-NPs for 5, 15, 30, and 60 min. (B and C) Quantitative analysis of the uptake of free C6, C6-loaded NPs, or C6-loaded TAT-RGD-NPs by flow cytometry after incubation with free C6, C6-loaded NPs, or C6-loaded TAT-RGD-NPs for 5, 15, 30, and 60 min. Abbreviations: C6, coumarin-6; C6-loaded NPs, C6-loaded nanoparticles; C6-loaded TAT-RGD-NPs, C6-loaded TAT and RGD-modified nanoparticles. |
Cellular Viability and Proliferation Assays
We performed the MTT assay to determine the effective concentration of naringin in hDPSCs (Figure 4A). The cells were treated with different concentrations of naringin (blank, 10, 50, and 100μg/mL) and incubated for 1d, 3d, and 7d. CCK-8 assay was performed to determine the cytotoxicity of the NPs or the TAT-RGD-NPs copolymer and the proliferation effect of NPs or the TAT-RGD-NPs in vitro (Figure 4B). The hDPSCs were treated and cultured in the blank, free naringin, TAT-RGD-NPs, NAR-NPs, and TAT-RGD-NAR-NPs with 100μg/mL naringin or an equal concentration of the other carriers for 1d, 3d, 5d, 7d, and 9d. The results suggested that free naringin promoted cell proliferation to a certain extent. Although the CCK-8 assay showed that naringin, TAT-RGD-NPs, NAR-NPs, and TAT-RGD-NAR-NPs could promote the proliferation of hDPSCs to varying degrees and showed no detectable cytotoxicity, to further confirm the cytotoxicity of nanoparticles and drugs under the microscope, the viability of the hDPSCs was examined by performing the live and dead staining assay after 7d of culture (Figure 4C). Viable cells exhibit green fluorescence, while dead cells exhibit red fluorescence.28 No dead cells were observed, which further indicated that the drug and the materials were not cytotoxic.
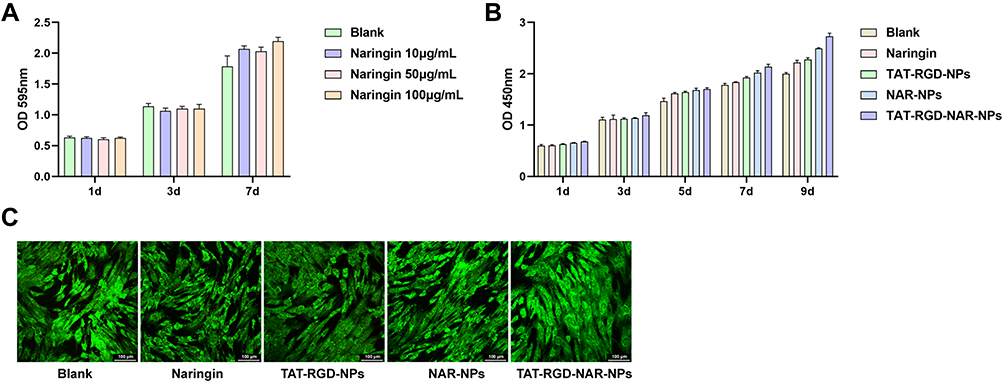 |
Figure 4 The cell viability and proliferation assays of hDPSCs treated with free naringin, TAT-RGD-NPs, NAR-NPs, and TAT-RGD-NAR-NPs. (A) MTT assay was performed to analyze the effective concentration of naringin (blank, 10, 50, and 100μg/mL) in the hDPSCs incubated for 1d, 3d, and 7d. (B) The CCK-8 assay was performed to analyze the cytotoxicity of the NPs in the hDPSCs cultured in the blank, free naringin, TAT-RGD-NPs, NAR-NPs, and TAT-RGD-NAR-NPs with 100μg/mL naringin or an equal concentration of the other carriers for 1d, 3d, 5d, 7d, and 9d. (C) The hDPSCs were examined by performing the live and dead staining assay by confocal microscopy after treatment with naringin, TAT-RGD-NPs, NAR-NPs, and TAT-RGD-NAR-NPs for 7d. Abbreviations: Blank NPs, Blank nanoparticles; NAR-NPs, naringin-loaded nanoparticles; TAT-RGD-NPs, TAT&RGD-modified nanoparticles; TAT-RGD-NAR-NPs, TAT&RGD-modified naringin-loaded nanoparticles. |
Cell Apoptosis Assay
The rate of apoptosis was quantitatively analyzed by performing the apoptosis assay with annexin V-FITC/propidium iodide double staining (Figure 5A and B) after treatment with free naringin, TAT-RGD-NPs, NAR-NPs, and TAT-RGD-NAR-NPs for 7d. The hDPSCs cultured in a cell culture medium and TAT-RGD-NPs showed apoptotic rates of 4.05±0.15 and 4.05±0.10 (Q2+Q3), respectively, with no statistical difference. The results suggested that the TAT-RGD-NPs were not cytotoxic and could not induce apoptosis. The apoptotic rates of the cells in the free naringin, NAR-NPs, and TAT-RGD-NAR-NPs groups were 3.24±0.15, 2.53±0.13, and 2.06±0.09, respectively.
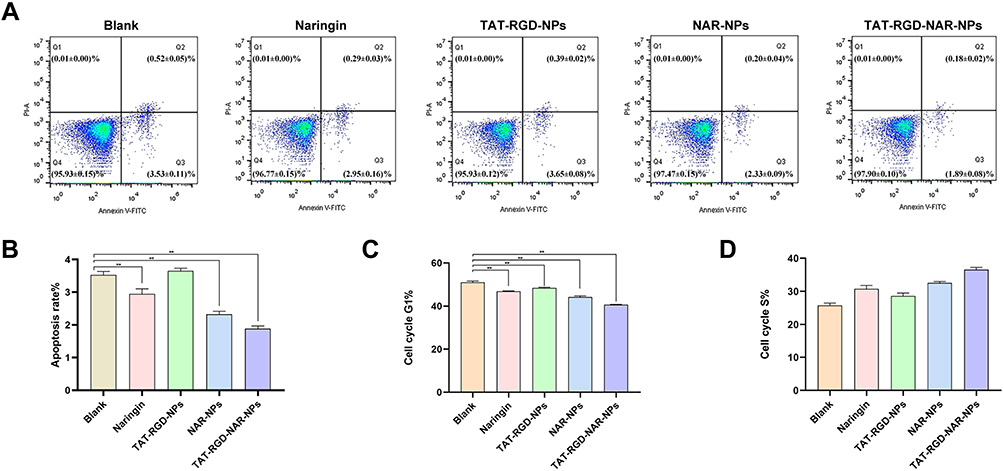 |
Figure 5 The apoptosis and cell cycle analyses were performed by flow cytometry. (A and B) The apoptosis ratio of the hDPSCs, after treatment with free naringin, TAT-RGD-NPs, NAR-NPs, and TAT-RGD-NAR-NPs (100μg/mL naringin) for 7d, was quantitatively analyzed by flow cytometry; blank represents the cells that were not administered any treatment. (C and D) The effect on the cell cycle of hDPSCs treated with free naringin, TAT-RGD-NPs, NAR-NPs, and TAT-RGD-NAR-NPs (100μg/mL naringin) for 7d was determined by flow cytometry. **P<0.01 vs Blank. Abbreviations: Blank NPs, Blank nanoparticles; NAR-NPs, naringin-loaded nanoparticles; TAT-RGD-NPs, TAT&RGD-modified nanoparticles; TAT-RGD-NAR-NPs, TAT &RGD-modified naringin-loaded nanoparticles. |
Cell Cycle Analysis
The effect of naringin, TAT-RGD-NPs, NAR-NPs, and TAT-RGD-NAR-NPs on the cell cycle of the hDPSCs was analyzed by FCM. The results showed that the cells in the S phase increased in the naringin, NAR-NPs, and TAT-RGD-NAR-NPs groups, while G1 phase decreased after seven days of treatment (Figure 5C and D).
VEGF Expression
To determine the effect of naringin on VEGF expression in hDPSCs, the cells were cultured in the solution containing naringin, TAT-RGD-NPs, NAR-NPs, and TAT-RGD-NAR-NPs (100μg/mL naringin) for 7d and were analyzed by real-time PCR (Figure 6A). The expression of VEGF in the hDPSCs, which also increased with an increase in the uptake of naringin by the cells.
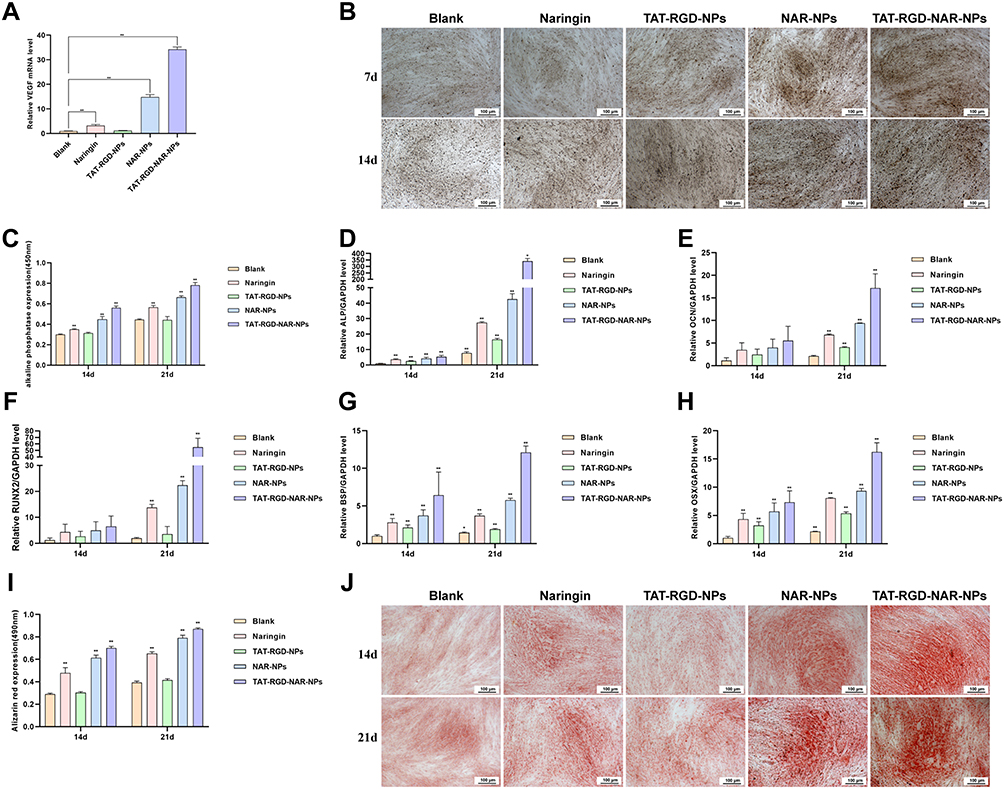 |
Figure 6 Analysis of VEGF expression and pro-osteogenic activity. (A) The expression of VEGF in the hDPSCs, cultured for 7d in a solution containing naringin, TAT-RGD-NPs, NAR-NPs, and TAT-RGD-NAR-NPs (100μg/mL naringin), was determined by real-time PCR. (B and C) ALP staining and ALP activity in the hDPSCs cultured in a solution for 14d and 21d containing naringin, TAT-RGD-NPs, NAR-NPs, and TAT-RGD-NAR-NPs (100μg/mL naringin). (D–H) The real-time PCR results of the expression of the ALP, OCN, RUNX2, BSP, and OSX genes in the hDPSCs cultured in a solution containing naringin, TAT-RGD-NPs, NAR-NPs, and TAT-RGD-NAR-NPs (100μg/mL naringin) for 14d and 21d. (I and J) Alizarin red S (ARS) staining. **P<0.01 vs Blank. *P<0.05 vs Blank. Abbreviations: Blank NPs, Blank nanoparticles; NAR-NPs, naringin-loaded nanoparticles; TAT-RGD-NPs, TAT&RGD-modified nanoparticles; TAT-RGD-NAR-NPs, TAT&RGD-modified naringin-loaded nanoparticles; ALP, Alkaline phosphatase. |
Pro-Osteogenic Activity of the TAT-RGD-NAR-NPs
Alkaline Phosphatase (ALP) Staining
Assessing the ALP activity in hDPSCs cultured in a solution containing naringin, TAT-RGD-NPs, NAR-NPs, and TAT-RGD-NAR-NPs (100μg/mL naringin) for 14d and 21d confirmed the differentiation of the hMSCs towards an osteogenic lineage. First, the alkaline phosphatase calcium cobalt staining kit was used. The stained cells were observed and photographed by an inverted microscope (Figure 6B) and detected by a microplate reader at 450nm (Figure 6C). The NAR-NPs and TAT-RGD-NAR-NPs groups showed a significantly higher level of ALP expression compared to the ALP expression in the other groups on day 14.
Expression of the ALP, OCN, RUNX2, BSP, and OSX Genes
To determine the effect of osteoblastic differentiation on the nanoparticles, we evaluated the expression of the ALP, OCN, RUNX2, BSP, and OSX genes in hDPSCs by performing real-time PCR. The results are shown in (Figure 6D–H). The gene expression in the TAT-RGD-NAR-NPs group was significantly higher than that in the other groups on day 14 and 21, which indicated that an increase in the intracellular uptake of naringin through the NPs effectively promoted the expression of genes related to osteogenesis.
Mineralization
We used ARS staining and calcium deposit quantification to evaluate the mineralization effect in hDPSCs caused by naringin, TAT-RGD-NPs, NAR-NPs, and TAT-RGD-NAR-NPs. The cells were cultured in different groups of treatment for 14d and 21d. A darker color of the ARS stain suggests more mineralized nodules and indicates a higher degree of mineralization of the hDPSCs (Figure 6I and J). In the TAT-RGD-NAR-NPs group, many mineralized nodules were found after 21d of culture.
Metabolites and the Associated Results
The KEGG database was used for pathway analysis of differential compounds, and the significance of the enrichment of differential compounds in each pathway entry was calculated by conducting statistical tests (Figure 7A). The results provided a p-value associated with the enrichment significance. A small p-value indicated that the differential compounds were enriched in the pathway. The path analysis affected the results. Through the path analysis of different compounds, we determined the path entries that enriched different compounds and also determined the pathways that the different compounds of different samples might be related to. The p-value of glycerophospholipid metabolism was only 0.010002 (Table 4), which was the smallest p-value among all groups, indicating that the differential compounds were enriched in the glycerophospholipid metabolism pathway. The impact of glycerophospholipid metabolism was 0.21631, which was the highest value among all groups. The largest red dot close to the point at the upper right corner of the chart (Figure 7B) represents the glycerophospholipid metabolism pathway. A more significant enrichment suggests a stronger role of the compound in the pathway. A comparative analysis of PLA2 and its isozymes, such as PLA2G3, PLB1, PLA2G4A, PLA2G10, PLA2G12A, PLA2G1B, PLA2G6, and PLA2G4C is shown in (Figure 7C).
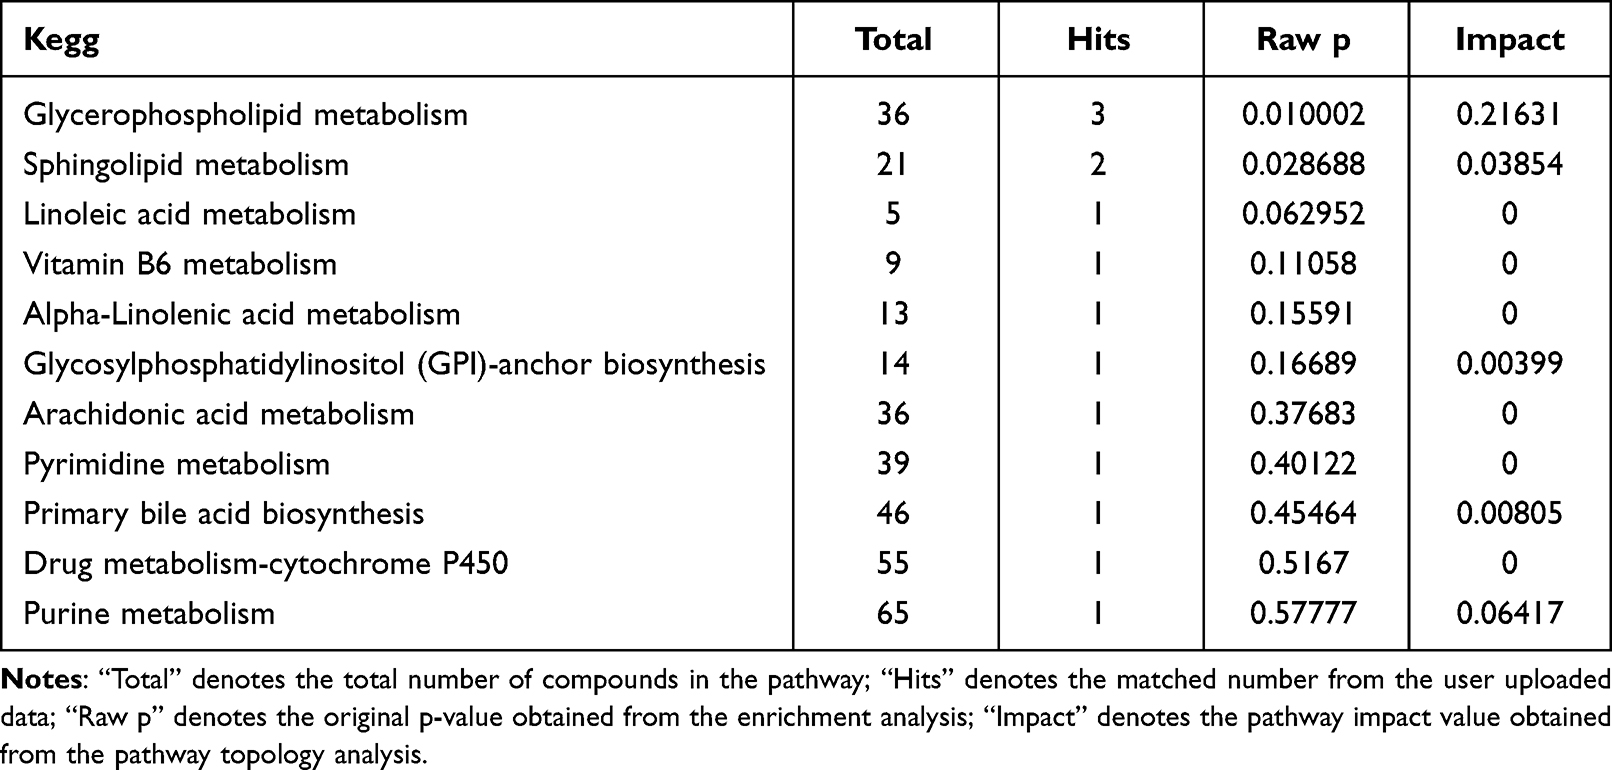 |
Table 4 Differential Metabolite Pathway Analysis |
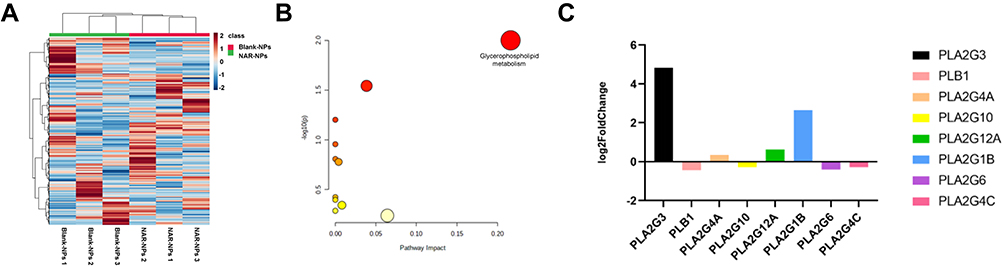 |
Figure 7 The metabolomic analysis. (A) Cluster diagram. The abscissa represents the number of samples and the ordinate represents the M/Z of each metabolite. (B) Signal path analysis diagram. Each point represents a pathway, the X-axis represents the important value of the compound in the pathway, and the Y-axis represents the negative logarithm of the p-value with the base of 10. Points (compounds) that are closer to the upper right corner are enriched more significantly and play a stronger role in the pathway. (C) Comparative analysis of PLA2 and its isozymes. |
Discussion
NAR-PC was synthesized to improve drug entrapment efficiency and to increase the stability of the NAR-NPs. The in vitro drug release study suggested the NPs provide a more sustained drug release in comparison with the free drug. During the cellular uptake of NAR-NPs and TAT-RGD-NAR-NPs in the hDPSCs, NAR in the NPs was replaced by the fluorescent probe C6 to prepare C6-loaded NPs and C6-loaded TAT-RGD-NPs by the same method as that followed to synthesize the control particles. The results suggested that the cellular uptake of TAT-RGD-NPs was more efficient than that of the free drug or the NPs. The results confirmed that the TAT-modified nanoparticles were taken up by the cells more effectively. Thus, NAR could be delivered to the cells by the NPs or the TAT-RGD-NPs. The intracellular efficiency of the TAT-RGD-NPs and NPs were considerably higher than that of free C6. The mean fluorescence intensity of the TAT-RGD-NPs reached a high level, while the fluorescence intensity of the free C6 group was very low. The fluorescence intensity increased by 7.8-fold and 6.0-fold in the TAT-RGD-NPs and NPs groups, respectively, after 60 min of incubation. The difference between the TAT-RGD-NPs and NPs groups was statistically significant. These results highlighted the internalization capacity of the TAT-RGD-NPs and NPs in the hDPSCs, thus indicating that the intracellular delivery of bioactive molecules through these carriers is promising.
Naringin is relatively nontoxic in various cell lines when administered in the range of 1–200µg/mL.29 As different cells can safely take up different concentrations of naringin, evaluating the effect of naringin on the viability of hDPSCs is important and a prerequisite for conducting studies on osteogenesis induction. MTT assay showed that naringin was not cytotoxic at any concentration. Moreover, it promoted cell proliferation after seven days. The group to which 100µg/mL naringin was administered had the best cell proliferation response. Therefore, 100µg/mL of naringin was used in this study. Naringin can significantly enhance cell proliferation of osteoprogenitor cells, as determined previously by the MTT and the cell CCK-8 assays.30,31 CCK-8 assay showed that the TAT-RGD-NPs also promoted cell proliferation; the RGD peptide could promote cell proliferation, while the nanoparticles could promote cellular uptake and facilitate the RGD peptide to function more efficiently. The polymer materials used for preparing nanoparticles were not cytotoxic. The effect of the RGD peptide on cell proliferation was also evident,32 considering that the TAT-RGD-NPs were more effective than the NAR-NPs on cell proliferation. The TAT-RGD-NPs showed the strongest effect on cell proliferation, especially after seven days of culture. While the results of the cell apoptosis assay indicated that the TAT and RGD peptides had no significant effect on the apoptosis of the hDPSCs, but naringin decreased the apoptosis of the hDPSCs, which was due to a higher cellular uptake of naringin associated with the nanoparticles and the TAT transmembrane peptide-modified nanoparticles.
The effect of naringin, TAT-RGD-NPs, NAR-NPs, and TAT-RGD-NAR-NPs on the cell cycle study of the hDPSCs was analyzed by FCM. The results showed that the cells in the S phase increased in the naringin, NAR-NPs, and TAT-RGD-NAR-NPs groups, which indicated that naringin could increase the proliferative potential. Cytometry can be applied in the field of cell necro biology to quantify apoptotic cells and determine the mechanisms associated with the predisposition of cells to apoptosis and the mechanism behind cell death.33 The DNA content is a marker of cellular maturity in the cell cycle, where cells in the G0/G1 phase have 1 unit of DNA, cells in the S phase duplicate DNA and increase the DNA content as the phase progresses, and upon entering the G2 phase and later M phase, the DNA content is twice (2 units) that of the G0/G1 phase. An increase in the frequency of cells in the S and G2/M phases indicates an increase in the proliferative potential.33
We found that treatment with naringin improved the expression of VEGF in the hDPSCs, which also increased with an increase in the uptake of naringin by the cells. Some studies, however, have shown that flavonoid treatment can inhibit the expression of VEGF in vitro, indicating that naringin is an effective inhibitor of cancer cell proliferation and providing evidence for the anticancer properties of naringin.34,35 Several studies have found that naringin can effectively improve the expression of VEGF.36,37 The reasons for these differences might be that tumor cells are abnormal, and hence, the reaction mechanism of naringin in tumor cells might be different from that in normal cells. These differences need to be studied further, and the molecular mechanism of action of naringin in cells needs to be studied urgently.
This is one of the few studies to determine the osteogenic potential and the molecular mechanism of action of naringin in hDPSCs. The hDPSCs are extracted from the human dental pulp and are valuable sources of cells for regenerative therapy. Naringin promotes the osteogenic differentiation of hDPSCs, but the mechanism is not clear. Osteogenic differentiation of the hDPSCs in vitro could be divided into three stages. In the first stage (days 1–4), the cells proliferated, and the number of cells peaked.38 Then, in the second stage (days 5–14), early cell differentiation occurred, characterized by transcription and protein expression, for example, of ALP.39 High expression of osteocalcin followed by calcium and phosphate deposition was observed in the last stage (days 14–28).38 Bone formation is highly regulated and involves the differentiation of mesenchymal progenitor cells into preosteoblasts, then into the osteoblast lineage, and finally, into osteocytes.40 Osteoblast differentiation is regulated by different transcription factors and signaling proteins, including the Indian hedgehog, Runx2, OSX, and the Wnt signaling pathway.41
Alkaline phosphatase (ALP) is a primary phenotypic indicator secreted by osteoblasts. ALP is upregulated during early osteogenesis. In the ALP Staining results, the ALP activity of TAT-RGD-NAR-NPs was lower than that of NAR-NPs on day 21. This was probably because the hDPSCs absorbed more naringin from the TAT-modified nanoparticles, which induced the cells to differentiate into osteoblasts earlier. Since ALP generally appears in the early stages of osteogenesis, and the TAT-RGD-NAR-NPs group showed osteogenic differentiation earlier, ALP decreased earlier. The ALP value gradually increased and appeared later in the other groups than TAT-RGD-NAR-NPs group at the beginning of osteogenic differentiation.
To estimate the progression of osteogenic differentiation by measuring transcriptional activity, we selected the ALP, OCN, RUNX2, BSP, and OSX genes, and ALP was monitored. The osteogenic differentiation of stem cells can be detected and quantified in several ways. Researchers have performed quantitative real-time PCR and microarray analysis in many studies to measure osteogenesis.42 However, due to post-translational modifications and many other factors, the activity and function of synthetic proteins may not accurately reflect the measured gene expression level. The enhanced expression of ALP and extracellular matrix mineralization could precisely indicate the occurrence of osteogenic differentiation. Alizarin Red S (ARS) staining is widely used to evaluate calcium-rich deposits in cells in vitro.43 Thus, mineralization can be assessed by ARS staining as ARS chelates with calcium cations.
ALP, OCN, and Runx2 are markers of osteoblast maturation, differentiation, bone matrix formation, and mineralization at different stages.44–46 As an early marker of calcification, the expression and activity of ALP increase considerably in the initial stages of mineralization, which is closely associated with osteoblast activity and osteogenic specificity.47 OCN is a non-collagenous protein found in the extracellular matrix produced by osteoblasts and is a late osteoblast differentiation marker.48 Runx2 is an osteoblast-specific transcription factor essential for early osteoblastic differentiation.49 Runx2 is required for the differentiation of mesenchymal cells into preosteoblasts.49 OSX is an osteoblast-specific transcription factor required for bone formation and osteoblast differentiation. It is a downstream gene of Runx2 and is required for the differentiation of preosteoblasts into mature osteoblasts and is expressed in all osteoblasts.50 Mature osteoblasts strongly express osteoblast marker genes required later for producing certain proteins, such as osteocalcin and BSP. BSP is a sulfated and phosphorylated glycoprotein that is expressed almost exclusively in mineralized connective tissues.51 BSP is a member of the small integrin-binding ligand, N-linked glycoprotein (SIBLING) gene family, whose members play multiple and distinct roles in the development, turnover, and mineralization of bone and dentin.51 Expression of BSP is associated with the differentiation of osteoblasts and the onset of mineralization. BSP is selectively expressed in differentiated osteoblasts and plays a role in the initial mineralization of bones.52
The expression of ALP, which is an early marker of calcification, in the TAT-RGD-NAR-NPs group was significantly higher than that in the blank group on day 14 and was 10 times higher than the ALP expression in the blank group on day 21. However, the expression of Runx2, another essential factor for early osteoblastic differentiation, was similar between the groups on day 14 but showed significant differences on day 21. Runx2 did not change significantly on days 14 and 21 in the blank group and the TAT-RGD-NPs group but changed significantly in the three groups treated with naringin. Next, we investigated the reasons for this difference to determine the role of naringin. OCN is a late osteoblast differentiation marker, and the naringin-treated groups did not show any significant difference in OCN expression on day 14, but showed differences on day 21 compared to that in the blank and the TAT-RGD-NPs groups. The gene expression of OSX and BSP showed a similar trend in all the groups on days 14 and 21. Hence, OSX could stimulate BSP promoter activity, and the promoter of BSP was responsible for OSX activation.52 ChIP assays demonstrated the association of endogenous OSX with native BSP promoters in primary osteoblasts.52 Our observations confirmed the relationship between OSX and BSP and the reason behind a similar expression trend.
The results of the metabolomics analysis, the characteristics of the glycerophospholipid metabolism pathway, and the effect of LPA suggested that naringin affects the osteogenic differentiation of the hDPSCs by affecting the glycerophospholipid metabolism pathway and the amount of LPA. In the glycerophospholipid metabolism pathway, the phospholipases catalyze the conversion of glycerophospholipid (PL) to phosphatidic acid (PA) and lysophosphatidic acid (LPA).53 LPA is a potent bioactive phospholipid present at low levels in the plasma (~100nM).54 It is a key extracellular signal molecule that can regulate various cellular processes, such as proliferation, differentiation, apoptosis, chemotaxis, etc. LPA participates in several pathophysiological processes and plays an important role in the development of the nervous system, angiogenesis, inflammation, wound healing, and cancer.55 The actions of osteoclasts (bone-resorbing cells) and osteoblasts (bone-forming cells) are vital for skeletal development and remodeling.56 Studies have shown that besides having profound effects on skeletal development, LPA participates in the coordination of osteoblast and osteoclast activity.57 Briefly, LPA induces osteoblastic cells to synthesize cytokines that regulate osteoclast behavior.58 Osteoblasts are a source of LPA in the bone and regulate osteoclast functions and contribute to the pathogenesis of bone diseases. LPA acts as a mediator linking osteoblasts to osteoclasts in healthy and disease states.57 LPA can significantly upregulate the expression of alkaline phosphatase (ALP) in BMSCs through the LPA1 receptor and intracellular calcium mobilization.57 ALP is an important marker of the early differentiation of osteoblasts. Researchers confirmed that LPA can directly act on BMSCs and promote their differentiation into osteoblasts.57
To determine the mechanism behind the effect of naringin on glycerophospholipid metabolism and LPA, we analyzed the content of various substances, molecules, and metabolites in cells in the NAR-NPs group, with the Blank-NPs group as the control. The conversion of phosphatidic acid (PA) to LPA is catalyzed by phospholipase. Phospholipase A2 (PLA2) plays an important role in many cellular reactions, including phospholipid digestion and metabolism, host defense, and signal transduction.59 Recent advances in molecular biology and cell biology have enhanced the understanding of the molecular properties, possible functions, and the regulation of various PLA2 isozymes.59 Mammalian tissues and cells usually contain several enzymes, and each enzyme is independently regulated and plays different functions.59 The results showed that the PLA2G3 and PLA2G1B, known as PLA2 isozymes, levels were significantly higher in the NAR-NPs group.
Naringin modulates signaling through numerous molecular pathways critical to cellular differentiation.60 Administration of naringin increases activation of the Wnt/β-catenin and expression of bone morphogenetic proteins (BMPs), thereby promoting osteoblastic proliferation and differentiation from stem cell precursors for bone formation.61,62 T-cell factor/lymphoid enhancer factor (TCF/LEF) transcription factors are the major endpoint mediators of Wnt signaling throughout metazoans.63 When Wnt signal is absent, TCF/LEFs can inhibit the expression of target genes, while the Wnt signal is present, they can recruit β-Catenin to activate the target gene.64 TCF-4E of TCFs family is PLA2G3 transcription factor. Therefore, we speculate that naringin can promote the osteogenic differentiation of hDPSCs mainly by regulating the expression of PLA2G3 through Wnt/TCF-4E signal pathway, thus improving the expression and functional regulation of PLA2, and then regulating the expression of BMP2, so as to promote the osteogenic differentiation of stem cells. This requires further verification.
Conclusion
In this study, TAT-RGD-NAR-NPs were successfully prepared and evaluated for their potency on the osteogenic differentiation of hDPSCs. The results indicated that drug delivery of TAT-RGD-NAR-NPs into hDPSCs was more efficient without obvious cytotoxicity. Also, TAT-RGD-NAR-NPs had a more significant effect on cell proliferation and osteogenic differentiation promotion. It is more worth mentioning that in metabolomic analysis naringin promoted the production of PLA2G3 and PLA2G1B in hDPSCs, and then enhanced the conversion of PA to LPA. An increase in the biosynthesis of LPA promoted the osteogenic differentiation of DPSCs. Future study will focus on mechanism of naringin on osteogenic differentiation.
Ethics Approval and Consent to Participate
This study was approved by the ethics committee of Beijing Stomatological Hospital, Capital Medical University School of Stomatology, and was in accordance with the Declaration of Helsinki. Informed consent was obtained from all participants.
Acknowledgment
The work was supported by “The Belt and Road” international health cooperation and WHO Cooperation Center preferential support project funded by Beijing Municipal Commission of health (No. 200705).
Disclosure
All authors declare that they have no conflicts of interest.
References
1. Pang WY, Wang XL, Mok SK, et al. Naringin improves bone properties in ovariectomized mice and exerts oestrogen-like activities in rat osteoblast-like (UMR-106) cells. Br J Pharmacol. 2010;159(8):1693–1703. doi:10.1111/j.1476-5381.2010.00664.x
2. Bharti S, Rani N, Krishnamurthy B, Arya DS. Preclinical evidence for the pharmacological actions of naringin: a review. Planta Med. 2014;80(6):437–451. doi:10.1055/s-0034-1368351
3. Li F, Sun X, Ma J, et al. Naringin prevents ovariectomy-induced osteoporosis and promotes osteoclasts apoptosis through the mitochondria-mediated apoptosis pathway. Biochem Biophys Res Commun. 2014;452(3):629–635. doi:10.1016/j.bbrc.2014.08.117
4. Wang F, Zhao C, Tian G, et al. Naringin alleviates atherosclerosis in ApoE(-/-) mice by regulating cholesterol metabolism involved in gut microbiota remodeling. J Agric Food Chem. 2020;68(45):12651–12660. doi:10.1021/acs.jafc.0c05800
5. Heidary Moghaddam R, Samimi Z, Moradi SZ, Little PJ, Xu S, Farzaei MH. Naringenin and naringin in cardiovascular disease prevention: a preclinical review. Eur J Pharmacol. 2020;887:173535. doi:10.1016/j.ejphar.2020.173535
6. Cheng H, Jiang X, Zhang Q, et al. Naringin inhibits colorectal cancer cell growth by repressing the PI3K/AKT/mTOR signaling pathway. Exp Ther Med. 2020;19(6):3798–3804.
7. Aroui S, Fetoui H, Kenani A. Natural dietary compound naringin inhibits glioblastoma cancer neoangiogenesis. BMC Pharmacol Toxicol. 2020;21(1):46. doi:10.1186/s40360-020-00426-1
8. Subramanian M, Thotakura B, Chandra Sekaran SP, Jyothi AK, Sundaramurthi I. Naringin ameliorates streptozotocin-induced diabetes through forkhead box M1-mediated beta cell proliferation. Cells Tissues Organs. 2018;206(4–5):242–253. doi:10.1159/000499480
9. Nday CM, Eleftheriadou D, Jackson G. Naringin nanoparticles against neurodegenerative processes: a preliminary work. Hell J Nucl Med. 2019;22(Suppl):32–41.
10. Wei M, Yang Z, Li P, Zhang Y, Sse WC. Anti-osteoporosis activity of naringin in the retinoic acid-induced osteoporosis model. Am J Chin Med. 2007;35(4):663–667. doi:10.1142/S0192415X07005156
11. Apostu D, Lucaciu O, Mester A, et al. Systemic drugs with impact on osteoarthritis. Drug Metab Rev. 2019;51(4):498–523. doi:10.1080/03602532.2019.1687511
12. Zhang J, Gao W, Liu Z, Zhang Z, Liu C. Systematic analysis of main constituents in rat biological samples after oral administration of the methanol extract of fructus aurantii by HPLC-ESI-MS/MS. Iran J Pharm Res. 2014;13(2):493–503.
13. Cassidy A, Minihane AM. The role of metabolism (and the microbiome) in defining the clinical efficacy of dietary flavonoids. Am J Clin Nutr. 2017;105(1):10–22. doi:10.3945/ajcn.116.136051
14. Ho PC, Saville DJ, Wanwimolruk S. Inhibition of human CYP3A4 activity by grapefruit flavonoids, furanocoumarins and related compounds. J Pharm Pharm Sci. 2001;4(3):217–227.
15. Lavrador P, Gaspar VM, Mano JF. Bioinstructive naringin-loaded micelles for guiding stem cell osteodifferentiation. Adv Healthc Mater. 2018;7(19):e1800890. doi:10.1002/adhm.201800890
16. Shao Y, You D, Lou Y, et al. Controlled release of naringin in geLMA-incorporated rutile nanorod films to regulate osteogenic differentiation of mesenchymal stem cells. ACS Omega. 2019;4(21):19350–19357. doi:10.1021/acsomega.9b02751
17. Yu M, You D, Zhuang J, et al. Controlled release of naringin in metal-organic framework-loaded mineralized collagen coating to simultaneously enhance osseointegration and antibacterial activity. ACS Appl Mater Interfaces. 2017;9(23):19698–19705. doi:10.1021/acsami.7b05296
18. Chan KH, Tay JJJ. Advancement of peptide nanobiotechnology via emerging microfluidic technology. Micromachines. 2019;10(10):627. doi:10.3390/mi10100627
19. Chan KH, Lee WH, Ni M, Loo Y, Hauser CAE. C-terminal residue of ultrashort peptides impacts on molecular self-assembly, hydrogelation, and interaction with small-molecule drugs. Sci Rep. 2018;8(1):17127. doi:10.1038/s41598-018-35431-2
20. Tesauro D, Accardo A, Diaferia C, et al. Peptide-based drug-delivery systems in biotechnological applications: recent advances and perspectives. Molecules. 2019;24(2):351. doi:10.3390/molecules24020351
21. Hersh J, Broyles D, Capcha JMC, et al. Peptide-modified biopolymers for biomedical applications. ACS Appl Bio Mater. 2021;4(1):229–251. doi:10.1021/acsabm.0c01145
22. Wu D, Zhang Y, Xu X, et al. RGD/TAT-functionalized chitosan-graft-PEI-PEG gene nanovector for sustained delivery of NT-3 for potential application in neural regeneration. Acta Biomater. 2018;72:266–277. doi:10.1016/j.actbio.2018.03.030
23. Ruoslahti E. Peptides as targeting elements and tissue penetration devices for nanoparticles. Adv Mater. 2012;24(28):3747–3756. doi:10.1002/adma.201200454
24. Wang F, Chen L, Zhang R, Chen Z, Zhu L. RGD peptide conjugated liposomal drug delivery system for enhance therapeutic efficacy in treating bone metastasis from prostate cancer. J Control Release. 2014;196:222–233. doi:10.1016/j.jconrel.2014.10.012
25. Mas-Moruno C, Fraioli R, Rechenmacher F, Neubauer S, Kapp TG, Kessler H. alphavbeta3- or alpha5beta1-integrin-selective peptidomimetics for surface coating. Angew Chem Int Ed Engl. 2016;55(25):7048–7067. doi:10.1002/anie.201509782
26. Baoum AA, Middaugh CR, Berkland C. DNA complexed with TAT peptide and condensed using calcium possesses unique structural features compared to PEI polyplexes. Int J Pharm. 2014;465(1–2):11–17. doi:10.1016/j.ijpharm.2014.01.040
27. Ribbenstedt A, Ziarrusta H, Benskin JP. Development, characterization and comparisons of targeted and non-targeted metabolomics methods. PLoS One. 2018;13(11):e0207082. doi:10.1371/journal.pone.0207082
28. Pedroni ACF, Sarra G, de Oliveira NK, Moreira MS, Deboni MCZ, Marques MM. Cell sheets of human dental pulp stem cells for future application in bone replacement. Clin Oral Investig. 2019;23(6):2713–2721. doi:10.1007/s00784-018-2630-8
29. Lavrador P, Gaspar VM, Mano JF. Bioinspired bone therapies using naringin: applications and advances. Drug Discov Today. 2018;23(6):1293–1304. doi:10.1016/j.drudis.2018.05.012
30. Yu GY, Zheng GZ, Chang B, et al. Naringin stimulates osteogenic differentiation of rat bone marrow stromal cells via activation of the notch signaling pathway. Stem Cells Int. 2016;2016:7130653. doi:10.1155/2016/7130653
31. Li L, Zeng Z, Cai G. Comparison of neoeriocitrin and naringin on proliferation and osteogenic differentiation in MC3T3-E1. Phytomedicine. 2011;18(11):985–989. doi:10.1016/j.phymed.2011.03.002
32. Fouzi M, Thimma M, BinSabt M, Husain AA, Aouabdi S. Stem cell growth and proliferation on RGD bio-conjugated cotton fibers. Biomed Mater Eng. 2021;32(1):39–52. doi:10.3233/BME-201115
33. Darzynkiewicz Z, Bedner E, Smolewski P. Flow cytometry in analysis of cell cycle and apoptosis. Semin Hematol. 2001;38(2):179–193. doi:10.1016/S0037-1963(01)90051-4
34. Schindler R, Mentlein R. Flavonoids and vitamin E reduce the release of the angiogenic peptide vascular endothelial growth factor from human tumor cells. J Nutr. 2006;136(6):1477–1482. doi:10.1093/jn/136.6.1477
35. Luo H, Jiang BH, King SM, Chen YC. Inhibition of cell growth and VEGF expression in ovarian cancer cells by flavonoids. Nutr Cancer. 2008;60(6):800–809. doi:10.1080/01635580802100851
36. Rong W, Wang J, Liu X, et al. Naringin treatment improves functional recovery by increasing BDNF and VEGF expression, inhibiting neuronal apoptosis after spinal cord injury. Neurochem Res. 2012;37(8):1615–1623. doi:10.1007/s11064-012-0756-7
37. Cheng L, Chen T, Tu Q, et al. Naringin improves random skin flap survival in rats. Oncotarget. 2017;8(55):94142–94150. doi:10.18632/oncotarget.21589
38. Huang Z, Nelson ER, Smith RL, Goodman SB. The sequential expression profiles of growth factors from osteoprogenitors [correction of osteroprogenitors] to osteoblasts in vitro. Tissue Eng. 2007;13(9):2311–2320. doi:10.1089/ten.2006.0423
39. Aubin JE. Regulation of osteoblast formation and function. Rev Endocr Metab Disord. 2001;2(1):81–94. doi:10.1023/A:1010011209064
40. Franceschi RT, Ge C, Xiao G, Roca H, Jiang D. Transcriptional regulation of osteoblasts. Cells Tissues Organs. 2009;189(1–4):144–152. doi:10.1159/000151747
41. Zhang C, Dai H, de Crombrugghe B. Characterization of Dkk1 gene regulation by the osteoblast-specific transcription factor Osx. Biochem Biophys Res Commun. 2012;420(4):782–786. doi:10.1016/j.bbrc.2012.03.073
42. Zajdel A, Kalucka M, Kokoszka-Mikolaj E, Wilczok A. Osteogenic differentiation of human mesenchymal stem cells from adipose tissue and Wharton’s jelly of the umbilical cord. Acta Biochim Pol. 2017;64(2):365–369. doi:10.18388/abp.2016_1488
43. Gregory CA, Gunn WG, Peister A, Prockop DJ. An Alizarin red-based assay of mineralization by adherent cells in culture: comparison with cetylpyridinium chloride extraction. Anal Biochem. 2004;329(1):77–84. doi:10.1016/j.ab.2004.02.002
44. Lu K, Zeng D, Zhang Y, et al. BMP-2 gene modified canine bMSCs promote ectopic bone formation mediated by a nonviral PEI derivative. Ann Biomed Eng. 2011;39(6):1829–1839. doi:10.1007/s10439-011-0276-7
45. Liu P, Baumgart M, Groth M, et al. Dicer ablation in osteoblasts by Runx2 driven cre-loxP recombination affects bone integrity, but not glucocorticoid-induced suppression of bone formation. Sci Rep. 2016;6:32112. doi:10.1038/srep32112
46. Dong M, Jiao G, Liu H, et al. Biological silicon stimulates collagen type 1 and osteocalcin synthesis in human osteoblast-like cells through the BMP-2/Smad/RUNX2 signaling pathway. Biol Trace Elem Res. 2016;173(2):306–315. doi:10.1007/s12011-016-0686-3
47. Halling Linder C, Ek-Rylander B, Krumpel M, et al. Bone alkaline phosphatase and tartrate-resistant acid phosphatase: potential co-regulators of bone mineralization. Calcif Tissue Int. 2017;101(1):92–101. doi:10.1007/s00223-017-0259-2
48. Noth U, Tuli R, Seghatoleslami R, et al. Activation of p38 and Smads mediates BMP-2 effects on human trabecular bone-derived osteoblasts. Exp Cell Res. 2003;291(1):201–211. doi:10.1016/S0014-4827(03)00386-0
49. Franceschi RT, Xiao G. Regulation of the osteoblast-specific transcription factor, Runx2: responsiveness to multiple signal transduction pathways. J Cell Biochem. 2003;88(3):446–454. doi:10.1002/jcb.10369
50. Nakashima K, Zhou X, Kunkel G, et al. The novel zinc finger-containing transcription factor osterix is required for osteoblast differentiation and bone formation. Cell. 2002;108(1):17–29. doi:10.1016/S0092-8674(01)00622-5
51. Ogata Y. Bone sialoprotein and its transcriptional regulatory mechanism. J Periodontal Res. 2008;43(2):127–135. doi:10.1111/j.1600-0765.2007.01014.x
52. Yang Y, Huang Y, Zhang L, Zhang C. Transcriptional regulation of bone sialoprotein gene expression by Osx. Biochem Biophys Res Commun. 2016;476(4):574–579. doi:10.1016/j.bbrc.2016.05.164
53. Panupinthu N, Rogers JT, Zhao L, et al. P2X7 receptors on osteoblasts couple to production of lysophosphatidic acid: a signaling axis promoting osteogenesis. J Cell Biol. 2008;181(5):859–871. doi:10.1083/jcb.200708037
54. Hosogaya S, Yatomi Y, Nakamura K, et al. Measurement of plasma lysophosphatidic acid concentration in healthy subjects: strong correlation with lysophospholipase D activity. Ann Clin Biochem. 2008;45(Pt 4):364–368. doi:10.1258/acb.2008.007242
55. Taniguchi R, Inoue A, Sayama M, et al. Structural insights into ligand recognition by the lysophosphatidic acid receptor LPA6. Nature. 2017;548(7667):356–360. doi:10.1038/nature23448
56. Teti A. Bone development: overview of bone cells and signaling. Curr Osteoporos Rep. 2011;9(4):264–273. doi:10.1007/s11914-011-0078-8
57. Sims SM, Panupinthu N, Lapierre DM, Pereverzev A, Dixon SJ. Lysophosphatidic acid: a potential mediator of osteoblast-osteoclast signaling in bone. Biochim Biophys Acta. 2013;1831(1):109–116. doi:10.1016/j.bbalip.2012.08.001
58. Blackburn J, Mansell JP. The emerging role of lysophosphatidic acid (LPA) in skeletal biology. Bone. 2012;50(3):756–762. doi:10.1016/j.bone.2011.12.002
59. Murakami M, Nakatani Y, Atsumi GI, Inoue K, Kudo I. Regulatory functions of phospholipase A2. Crit Rev Immunol. 2017;37(2–6):127–195. doi:10.1615/CritRevImmunol.v37.i2-6.20
60. Yu KE, Alder KD, Morris MT, et al. Re-appraising the potential of naringin for natural, novel orthopedic biotherapies. Ther Adv Musculoskelet Dis. 2020;12:1759720X20966135. doi:10.1177/1759720X20966135
61. Wang D, Ma W, Wang F, et al. Stimulation of Wnt/beta-catenin signaling to improve bone development by naringin via interacting with AMPK and Akt. Cell Physiol Biochem. 2015;36(4):1563–1576. doi:10.1159/000430319
62. Yang C, Liu W, Zhang X, Zeng B, Qian Y. Naringin increases osteoprotegerin expression in fibroblasts from periprosthetic membrane by the Wnt/beta-catenin signaling pathway. J Orthop Surg Res. 2020;15(1):600. doi:10.1186/s13018-020-02145-z
63. Cadigan KM, Waterman ML. TCF/LEFs and Wnt signaling in the nucleus. Cold Spring Harb Perspect Biol. 2012;4(11):a007906–a007906. doi:10.1101/cshperspect.a007906
64. Cheng J, Tsuda M, Okolotowicz K, et al. Small-molecule probe reveals a kinase cascade that links stress signaling to TCF/LEF and Wnt responsiveness. Cell Chem Biol. 2021;28(5):625–635 e5. doi:10.1016/j.chembiol.2021.01.001
 © 2022 The Author(s). This work is published and licensed by Dove Medical Press Limited. The full terms of this license are available at https://www.dovepress.com/terms.php and incorporate the Creative Commons Attribution - Non Commercial (unported, v3.0) License.
By accessing the work you hereby accept the Terms. Non-commercial uses of the work are permitted without any further permission from Dove Medical Press Limited, provided the work is properly attributed. For permission for commercial use of this work, please see paragraphs 4.2 and 5 of our Terms.
© 2022 The Author(s). This work is published and licensed by Dove Medical Press Limited. The full terms of this license are available at https://www.dovepress.com/terms.php and incorporate the Creative Commons Attribution - Non Commercial (unported, v3.0) License.
By accessing the work you hereby accept the Terms. Non-commercial uses of the work are permitted without any further permission from Dove Medical Press Limited, provided the work is properly attributed. For permission for commercial use of this work, please see paragraphs 4.2 and 5 of our Terms.