")
Back to Journals » Hepatic Medicine: Evidence and Research » Volume 8
Targeted transplantation of mitochondria to hepatocytes
Received 10 July 2016
Accepted for publication 24 September 2016
Published 29 November 2016 Volume 2016:8 Pages 115—134
DOI https://doi.org/10.2147/HMER.S116852
Checked for plagiarism Yes
Review by Single anonymous peer review
Peer reviewer comments 3
Editor who approved publication: Dr Gerry Lake-Bakaar
Nidhi Gupta, Catherine H Wu, George Y Wu
Department of Medicine, Division of Gastroenterology–Hepatology, University of Connecticut Health Center, Farmington, CT, USA
Background: Mitochondrial defects in hepatocytes can result in liver dysfunction and death. Hepatocytes have cell-surface asialoglycoprotein receptors (AsGRs) which internalize AsGs within endosomes. The aim of this study was to determine whether mitochondria could be targeted to hepatocytes by AsGR-mediated endocytosis.
Materials and methods: An AsG, AsOR, was linked to polylysine to create a conjugate, AsOR-PL, and complexed with healthy and functional mitochondria (defined by normal morphology, cytochrome c assays, and oxygen-consumption rates). Huh7 (AsGR+) and SK Hep1 (AsGR–) cells were treated with a mitochondrial toxin to form Huh7-Mito– and SK Hep1-Mito– cells, lacking detectable mitochondrial DNA. An endosomolytic peptide, LLO, was coupled to AsOR to form AsOR-LLO. A lysosomal inhibitor, amantadine, was used in mitochondria-uptake studies as a control for nonspecific endosomal release.
Results: Coincubation of complexed mitochondria and AsOR-LLO with Huh7-Mito– cells increased mitochondrial DNA to >9,700-fold over control at 7 days (P<0.001), and increased mitochondrial oxygen-consumption rates to >90% of control by 10 days.
Conclusion: Rescue of mitochondria-damaged hepatocytes can be achieved by targeted uptake of normal mitochondria through receptor-mediated endocytosis.
Keywords: mitochondrial toxicity, mitochondria–protein complex, receptor-mediated uptake, endosomal escape, targeted delivery
Introduction
Mitochondria are intracellular organelles, which function as powerhouses of mammalian cells.1 Metabolically active tissues, such as liver, require large numbers of mitochondria to meet high-energy requirements.2,3 Consequently, the liver is particularly susceptible to agents that cause mitochondrial damage.4 Many drug-induced, alcohol-induced, and other metabolic liver diseases involve mitochondrial damage, and can result in liver failure and death.5 Aside from liver transplantation, there is currently no way to replace dysfunctional mitochondria.6
In the past, biologically active small molecules have been targeted to mammalian hepatocytes.6–8 based on the presence of hepatocyte-specific cell-surface receptors – asialoglycoprotein receptors (AsGRs). These receptors can bind glycoproteins that have exposed terminal galactose residues –AsGs.9,10 Binding of AsGs to AsGRs triggers invagination of the cell membrane and internalization of AsGR-AsG complexes within membrane-limited vesicles – endosomes. Endosomes subsequently fuse with lysosomes, resulting in degradation of endosomal contents. Figure S1 shows a proposed pathway for endosomal escape of mitochondria targeted to liver cells. The aim of this study was to determine whether mitochondria could be targeted specifically to hepatocytes and remain functional.
Materials and methods
Protein preparation
Orosomucoid was isolated from human serum (American Red Cross) as described previously,11 desialylated with neuraminidase (Sigma-Aldrich, St Louis, MO, USA)12 to make asialoorosomucoid (AsOR), and labeled with DyLight 650, a fluorescent label, using an N-hydroxysuccinimide ester reaction (Thermo Fisher Scientific, Waltham, MA, USA) according to the manufacturer’s instructions. AsOR and fluorescence-labeled AsOR (Fl-AsOR) were separately reacted with a carbodiimide cross-linker (Sigma-Aldrich) followed by addition of poly-l-lysine (PL; Sigma-Aldrich) in 1 mL of 0.1 M 2-(N-morpholino)ethanesulfonic acid, pH 6, for 24 hours at 25°C. Excess PL was removed using an exclusion column (10,000 molecular weight cutoff; EMD Millipore, Billerica, MA, USA). Fluorescence intensities of Fl-AsOR and Fl-AsOR-PL were measured by an XFluor 4 Safire II version 4.62n spectrophotometer.
Mass spectrometry
AsOR, Fl-AsOR, and Fl-AsOR-PL were diluted to 1, 0.1, 0.025, and 0.001 mg/mL, respectively. The matrix, 3,5-dimethoxy-4-hydroxycinnamic acid (sinapic acid), (Sequazym peptide mass standards kit; Thermo Fisher Scientific) was mixed with various concentrations of proteins with or without controls according to the manufacturer’s instructions and submitted for mass spectrophotometry (Voyager MALDI) using standard negative-ion linear-mode matrix-assisted laser desorption/ionization.
Purification of mitochondria
Mitochondria were isolated from HTC or Huh7 cells using a mitochondria-isolation kit for mammalian cells (Thermo Fisher Scientific), according to the manufacturer’s instructions. The mitochondrial pellets were washed and kept in the isolation kit’s reagent C on ice until further use.
Preparation and stability of Fl-AsOR-PL–mitochondria complexes
Rat (HTC) cell mitochondria, 800 µL (1.6 µg/µL total mitochondria protein) were incubated with 100 µg of Fl-AsOR-PL or Fl-AsOR protein (in 52 µL phosphate-buffered saline [PBS]) on ice for 45 minutes. Samples were repeatedly spun at 4,000 rpm for 8–10 minutes at 4°C and resuspended in the reagent C. After each spin, mitochondrial pellets and supernatants were collected and fluorescence measured at 685 nm. Experiments were conducted in triplicate. Results are expressed as means ± standard error of arbitrary fluorescence units per equal cell numbers.
Preparation of listeriolysin
LLO was purified from Listeria monocytogenes, (DA Portnoy, Stanford University), as described previously.13 Supernatants were passed through a DEAE-Sephacel column, and purified LLO was desalted with PD-10 columns (Sephadex G-25 medium; GE Healthcare, Little Chalfont, UK). Purified LLO was stored at –20°C until further use. AsOR-LLO conjugates were synthesized using an SPDP cross-linker (Thermo Fisher Scientific) according to the manufacturer’s instructions. LLO-SPDP was reduced with dithiothreitol. Reduced LLO-SPDP was mixed with AsOR-SPDP and incubated for 18 hours at 4°C to form AsOR-LLO conjugate. Purity and size of proteins were determined by 10% sodium dodecyl sulfate polyacrylamide-gel electrophoresis.
Cell culture
Human hepatocellular carcinoma cells, Huh7 AsGR+, SK Hep1 AsGR– (American Type Culture, Manassas, VA, USA), and rat HTC cells (American Type Culture) were maintained in Dulbecco’s modified Eagle’s medium (DMEM) supplemented with antibiotic–antimycotic solution and 10% fetal bovine serum (FBS; Thermo Fisher Scientific).14 To create GFP-labeled mitochondria, HTC cells were transfected with pAcGFP1-Mito plasmid (Takara Bio, Kyoto, Japan) using Lipofectamine (Thermo Fisher Scientific) according to manufacturer’s instructions. Fluorescence-activated cell sorting was used to separate GFP-labeled cells. HTC-Mito-GFP cells were maintained in DMEM supplemented with 1.5 mg/mL G418 (EMD Millipore). GFP labeling was determined using MitoTracker Red FM (Thermo Fisher Scientific) according to the manufacturer’s instructions. Cells were fixed with 4% paraformaldehyde and mounted in ProLong® Gold reagent (Thermo Fisher Scientific) for fluorescent microscopy imaging.
Preparation of Mito– cells
Huh7 (20% confluent) and SK Hep1 cells were exposed to 10 µM 2’,3’-dideoxycytidine (ddC; Sigma-Aldrich) for 3 weeks.15 After 3 weeks, ddC was removed from media, and cells were maintained in DMEM supplemented with antibiotic–antimycotic solution, 10% dialyzed FBS, 2 mM l-glutamine, 100 mg/mL sodium pyruvate, and 50 mg/mL uridine (Sigma-Aldrich).16 Mitochondrial DNA levels were determined by quantitative polymerase chain reaction (qPCR) at various time points, and cells lacking detectable mitochondrial DNA were designated Mito–. Huh7-Mito– and SK Hep1-Mito– cells were frozen at –80°C until needed.
AsGR-uptake assay
Cells were plated on tissue-culture plates or sterile coverslips 2–3 days before assay. When 95% confluent, cells were washed with PBS (Mg2+- and Ca2+-free) and maintained in phosphate-free DMEM (Thermo Fisher Scientific) for 16 hours. Mitochondria were isolated from donor cells (HTC, Huh7, or HTC-Mito-GFP cells) using a mitochondria-isolation kit (Thermo Fisher Scientific) according to the manufacturer’s instructions. Uptake assays were conducted at 37°C or 4°C in DMEM (2.8 mM Ca2+),17 to which was added either 20 µg/mL mitochondria alone, 4 µg/mL Fl-AsOR-PL alone, 25 µL/mL Fl-AsOR-PL–mitochondria complex, 25 µL/mL Fl-AsOR-PL–mitochondria complex + 0.15 µg/mL AsOR-LLO conjugate, 25 µL/mL Fl-AsOR-PL–mitochondria complex + 200 µg/mL AsOR (100-fold molar excess added 4 minutes prior to uptake), or 25 µL/mL Fl-AsOR-PL-mitochondria complex + 0.15 µg/mL AsOR-LLO conjugate + 200 µg/mL AsOR (100-fold molar excess added 4 minutes prior to uptake). Cells were washed with 10 mM ethylenediaminetetraacetic acid (EDTA) in ice-cold PBS (Mg2+- and Ca2+-free), followed by ice-cold PBS at each time point or at 2 hours for extended experiments. Cells were either trypsinized with 0.05% trypsin–EDTA (Thermo Fisher Scientific) and collected by centrifugation at 800 rpm for 4 minutes at 4°C or lysed with 200 µL lysis buffer (Buffer A, mitochondria-isolation kit; Thermo Fisher Scientific). Fluorescence intensity of Fl-AsOR-PL in lysed cells was measured using the spectrophotometer. Cell lysates were used to determine and quantify donor mitochondrial DNA levels by qPCR. Experiments were conducted in triplicate, and mean ± standard error are expressed as arbitrary fluorescence units per equal cell numbers.
Inhibitors of endocytosis
Cells were incubated with colchicine 1 µM for 2 hours prior to uptake and during the uptake assay.18 Uptake studies were performed at 4°C using ice-cold phosphate- and bicarbonate-free DMEM for low-temperature studies. Cells were treated with 20 µM amantadine (Sigma-Aldrich) for 1 hour prior to and during uptake for 2 hours to assess effects of lysosomal inhibitors.19
Quantitative PCR
To measure uptake of mitochondria, primers (Table S1) were designed to distinguish donor from host-cell mitochondria using Primer320 and Primer-BLAST,21 and specifically amplifying human Huh7 mitochondrial DNA or rat liver (HTC) mitochondrial DNA. Primer specificity was determined by PCR using DNA extracted from Huh7 cells and HTC cells with a QIAamp DNA minikit (Qiagen NV, Venlo, the Netherlands) according to the manufacturer’s instructions.
For uptake studies, whole-cell DNA was isolated using the QIAamp DNA minikit (Qiagen), and mitochondrial DNA levels were quantified by qPCR with Power SYBR Green PCR Master Mix (Thermo Fisher Scientific) according to the manufacturer’s instructions. Human LDHA DNA levels (nuclear gene) were quantified using human LDHA-specific primers, and the results were used to normalize mitochondrial DNA levels (Table S1). The qPCR conditions were one cycle of 2 minutes at 50°C, 10 minutes at 95°C, 40 cycles of 15 seconds at 95°C, and 1 minute at 60°C, followed by one cycle of 10 minutes at 55°C. Melt curves were obtained following each qPCR, and the specificity of the reaction analyzed under the following conditions: 15 seconds at 95°C, 15 seconds at 60°C, and 15 seconds at 95°C. Assays were repeated with three independent replicates, and the results are expressed as mean ± standard error of fold change of mitochondrial DNA levels in cells compared to untreated controls and estimates of mitochondrial DNA copies per cell.
Cell-proliferation assay
Cells were maintained in DMEM supplemented with antibiotic–antimycotic solution and 1% dialyzed FBS after uptake for 2 hours. DNA levels were determined at each time point with a CyQuant cell-proliferation assay kit (Thermo Fisher Scientific) according to the manufacturer’s instructions. Experiments were conducted in triplicate and repeated twice.
Confocal microscopy
AsOR-PL-Mito-GFP complex, Mito-GFP, and AsOR-PL-Mito-GFP complex + AsOR-LLO conjugate was incubated separately with cells for 2 hours at 37°C. Cells were washed with EDTA-PBS and maintained in DMEM supplemented with antibiotic–antimycotic solution and 10% FBS for 6 hours. Cells were fixed with 4% paraformaldehyde and permeabilized with 0.25% Triton X-100 (Sigma-Aldrich) in PBS for 10 minutes, followed by blocking solution (1% goat serum, 5% BSA, 0.3 M glycine) for 1 hour at 25°C. Cells were incubated with anti-EEA1 antibody (1G11, early endosome marker; Abcam, Cambridge, UK) overnight at 4°C. Alexa Fluor 594 goat antimouse (Thermo Fisher Scientific) secondary antibody was added for 1 hour. Nuclei were stained with 4’,6-diamidino-2-phenylindole (DAPI) for 20 minutes. Cells were mounted and imaged under confocal microscopy, and images were analyzed with ImageJ. Cells without first antibody served as controls. To determine the localization of endosomes and mitochondria in the Z-plane, four areas were randomly selected on the images taken by confocal microscopy, and GFP and Alexa Fluor 594 intensities were measured from each slice of Z-stacks of the image. Intensities were plotted against slice numbers. High-fluorescence intensity of both GFP and Alexa Fluor 594 in close proximity was taken to represent colocalization of HTC mitochondria and early endosomes in the Z-plane. After uptake of Fl-AsOR-PL for 1 hour at 37°C, cells were fixed with 4% paraformaldehyde and stained with DAPI for 20 minutes. Cells were mounted and imaged under fluorescence microscopy and are presented as single-wavelength and merged-wavelength images.
Electron microscopy
AsOR-PL-Mito-GFP complex and AsOR-PL-Mito-GFP complex + AsOR-LLO conjugate were incubated separately with Huh7 cells for 2 hours at 37°C. Cells were washed with EDTA-PBS and maintained in DMEM supplemented with antibiotic–antimycotic solution and 10% FBS for 6 hours. Cells were fixed with 2.5% glutaraldehyde in 0.1 M sodium cacodylate buffer for 10 minutes and permeabilized with 0.25% Triton X-100 for 10 minutes.22 Cells were incubated with anti-EEA1 (1G11-early endosomal marker) overnight at 4°C. Chicken anti-GFP (10 nm gold) and rabbit anti-EEA (15 nm gold) secondary antibodies were added for 1 hour. Cells were washed three times with 0.1 M sodium cacodylate buffer and embedded in 3% agarose. Pellets were postfixed in OsO4, dehydrated in ethanol, and embedded in Poly/Bed 812. Ultrathin 70 nm sections were mounted on 300-mesh Cu grids, stained with uranyl acetate and lead citrate, and examined with a Hitachi H-7650 transmission electron microscope at 25,000× magnification.
Mitochondrial respiration assay
Cells were plated in XF24 cell-culture microplates (Agilent Technologies, Santa Clara, CA, USA) 2 days before uptake assays. Complexed mitochondria and controls were incubated with cells for 2 hours. Cells were washed and maintained in DMEM supplemented with antibiotic–antimycotic solution and 1% dialyzed FBS for respiration assays performed using an XF Cell Mito stress kit (Agilent) at various time points according to the manufacturer’s instructions. Oxygen-consumption rates (OCRs) per well normalized to DNA levels were determined. Assays were performed in triplicate, and results are expressed as mean ± standard error of OCR per group in units of pmol/min/DNA level at each time point.
Results
Asialoglycoprotein-conjugate binding to mitochondria
AsOR was fluorescently labeled (Fl-AsOR) and covalently linked to PL, creating Fl-AsOR-PL. Mass-spectrometry data showed that an average of two fluorescent tags and two PL chains were bound per Fl-AsOR-PL molecule (Figure S2). An agarose gel showed that AsOR and Fl-AsOR were negatively charged. However, Fl-AsOR-PL was positively charged (data not shown).
Cytochrome C assays on isolated HTC mitochondria showed that there was minimal or no damage to the outer membrane of mitochondria23 (data not shown). Isolated HTC mitochondria were mixed with Fl-AsOR-PL to form complexes. The stability of Fl-AsOR-PL–mitochondria complexes was determined by repeated centrifugation and resuspension of the complexes in fresh medium. As shown in Figure 1A, the fluorescence of Fl-AsOR-PL associated with the pelleted mitochondria decreased by about 15% after the second spin, and then remained constant at approximately 27,000 units through three spins. In contrast, mitochondria pellet-associated fluorescence after mixing of mitochondria with Fl-AsOR (lacking PL) was significantly less, 4,000 units. The supernatant contained >90% of fluorescence of the Fl-AsOR alone after the first spin, but was no longer detected in pelleted mitochondria after the second and third spins (Figure 1A). Fluorescence in the supernatants of Fl-AsOR-PL mixed with mitochondria decreased to 24% from 32,000 to 7,900 units in supernatant after the first spin and remained low in subsequent spins (Figure 1B). These data suggest that (as expected) electrostatic interaction between positively charged Fl-AsOR-PL and negatively charged mitochondria resulted in binding of Fl-AsOR-PL to mitochondria, and that the binding was stable under the conditions of resuspension and centrifugation.
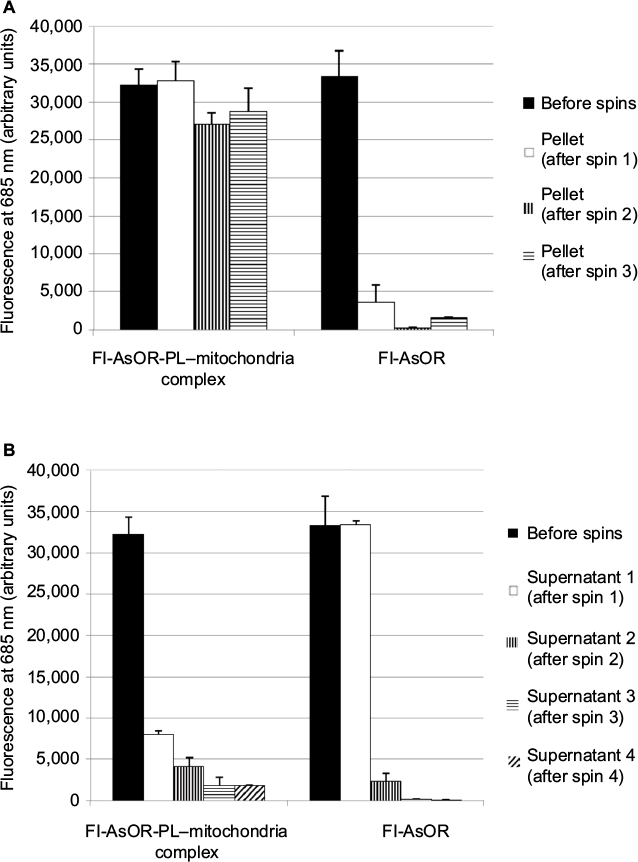 | Figure 1 Stability of Fl-AsOR-PL–mitochondria complexes. Notes: Freshly isolated rat mitochondria were incubated with Fl-AsOR-PL or Fl-AsOR, and repeatedly centrifuged and resuspended in fresh medium. Bars correspond to mean ± standard error of arbitrary fluorescence units of three independent experiments repeated in triplicate. Fluorescence associated with (A) pelleted mitochondria and (B) supernatants. Abbreviation: Fl-AsOR-PL, fluorescence-labeled asialoorosomucoid polylysine. |
Targeting of mitochondria specifically to hepatocytes by AsGR
To determine whether complexed mitochondria could be recognized by AsGR, Huh7 cells and SK Hep1 cells were incubated separately with Fl-AsOR-PL–mitochondria complex, mitochondria alone, Fl-AsOR protein alone, or Fl-AsOR-PL–mitochondria complex with excess AsOR at 37°C. Fluorescence levels in Huh7 AsGR+ cells incubated with Fl-AsOR alone were approximately 15,000 units at 15 minutes and increased significantly (P<0.001) to more than 20,000 units at 60 minutes (Figure 2A). Similarly, fluorescence in Huh7 cells incubated with Fl-AsOR-PL–mitochondria complex was 20,000 units at 15 minutes and increased significantly (P<0.001) to more than 35,000 units at 60 minutes. No fluorescence was detected in Huh7 cells after incubation of mitochondria alone. A large molar excess of AsOR with Fl-AsOR-PL–mitochondria complex decreased fluorescence levels to less than 2,500 units at both 15 and 60 minutes in Huh7 cells (Figure 2A). Fluorescence in SK Hep1 AsGR– cells was barely detectable under any condition (Figure 2B).
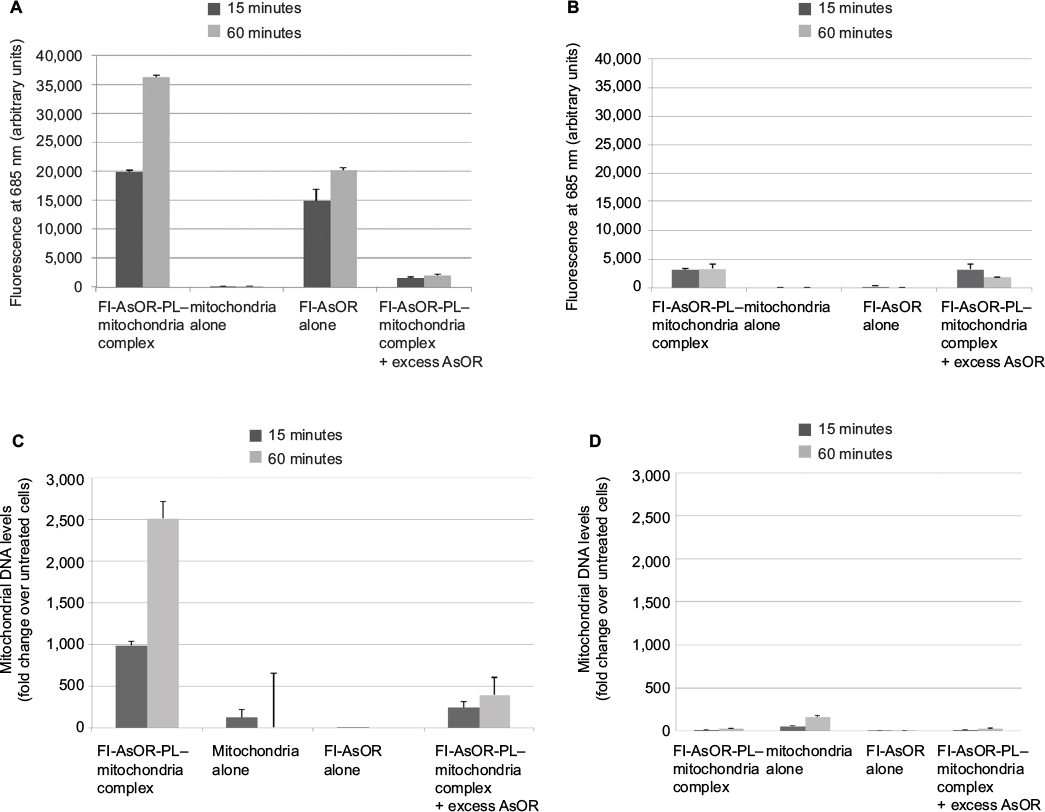 | Figure 2 Uptake of Fl-AsOR-PL–mitochondria complexes by Huh7 and SK Hep1 cells, as measured by fluorescence and qPCR. Notes: Cells were incubated separately with mitochondria alone, Fl-AsOR alone, Fl-AsOR-PL–mitochondria complex, or complexed mitochondria + excess AsOR for 1 hour and collected for analysis at various time points. (A) Fluorescence levels in Huh7 cells; (B) SK Hep1 cells incubated with complexed mitochondria or controls. Mitochondrial DNA levels after incubation with (C) Huh7 cells; (D) SK Hep1 cells. Abbreviations: Fl-AsOR-PL, fluorescence-labeled asialoorosomucoid polylysine; qPCR, quantitative polymerase chain reaction. |
However, because the fluorescent tag was only on the Fl-AsOR-PL carrier, it is possible that the carrier alone, without mitochondria, was internalized. To determine whether complexed mitochondria were taken up by Huh7 cells, primers were designed (Table S1), and were shown specifically to distinguish rat from Huh7 mitochondrial DNA (Figure S3). Huh7 cells incubated with Fl-AsOR-PL–mitochondria complex resulted in a significant (P<0.004) increase, 990-fold, over HTC mitochondrial DNA levels, approximately six to 14 HTC mitochondria per cell (based on reported copies of mitochondrial DNA/mitochondrion) compared to untreated cells at 15 minutes, and increased to more than double (approximately 14–36 HTC mitochondria per cell) (P<0.001) at 60 minutes (Figure 2C). Huh7 cells incubated with either mitochondria alone or Fl-AsOR alone had no significant HTC mitochondrial DNA levels. Exposure of Huh7 cells to Fl-AsOR-PL–mitochondria complex with excess free AsOR resulted in HTC mitochondrial DNA levels in Huh7 cells that were 76% (P<0.001) lower than complexes without excess AsOR. In contrast, HTC mitochondrial DNA levels in SK Hep1 cells were barely detectable under any condition (Figure 2D). The data suggested that complexed mitochondria were taken up by Huh7 cells specifically mediated by the AsGR.
Endosomolytic agents and cytoplasmic delivery of mitochondria in hepatocytes
AsGR-mediated endocytosis is a degradative pathway. Therefore, mitochondria internalized by Huh7 cells would be expected to be digested by lysosomal enzymes. To inhibit lysosomal degradation, cells were treated with amantadine. Levels of mitochondrial DNA after exposure to complexed mitochondria increased in the presence of amantadine, but became undetectable by 24 hours after withdrawal of the agent (Figure S4).
To facilitate endosomal escape of internalized mitochondria into cytoplasm prior lysosomal digestion, advantage was taken of a bacterial protein, LLO, which produces pores in endosomal membranes under conditions that exist in endosomes. Such pores result in rupture of endosomes, releasing the contents into cytoplasm. In order to target LLO to hepatocyte endosomes, an AsOR-LLO conjugate (AsOR was chemically coupled to LLO using a disulfide linker) to allow cleavage under reducing conditions of endosomes. Using hemolysis as a measure of membrane-disruptive activity, LLO alone at pH 5.6 resulted in hemolysis of 32.8% of red blood cells, and this increased significantly (P<0.001) to 88.6% in the presence of a reducing agent: dithiothreitol (data not shown).
To determine whether the AsOR-LLO conjugate could enhance intracytoplasmic delivery of mitochondria to hepatocytes, uptake assays of complexed mitochondria were performed using Huh7 cells and SK Hep1 cells with or without AsOR-LLO conjugates. After incubation with Fl-AsOR-PL–mitochondria complex alone, fluorescence levels in Huh7 cells were 13,400 units at 15 minutes and increased to more than 30,000 units at 120 minutes (Figure 3A). However, coadministration of AsOR-LLO conjugate with complexed mitochondria significantly (P<0.001) increased fluorescence levels in Huh7 cells from 13,000 units at 15 minutes to approximately 50,000 units at 120 minutes. Preincubation of a large molar excess of AsOR resulted in a >90% decrease in fluorescence in Huh7 cells exposed to complexed mitochondria with and without AsOR-LLO. In contrast, SK Hep1 cells did not have significant levels of fluorescence under any condition or time point (Figure 3B). Coadministration of AsOR-LLO conjugate with complexed mitochondria also resulted in significantly increased HTC mitochondrial DNA levels in Huh7 cells from 110-fold (approximately one to two HTC mitochondria per cell) at 15 minutes to approximately 23,800-fold (approximately 140–340 HTC mitochondria per cell) over untreated controls (P<0.001) at 120 minutes (Figure 3C). Incubation of Fl-AsOR-PL–mitochondria complex alone led to significantly increased, but lower HTC mitochondrial DNA levels: from 690-fold (P<0.004; approximately four to ten HTC mitochondria per cell) at 15 minutes to 7,500-fold (approximately 40–110 HTC mitochondria per cell) over untreated controls at 120 minutes in Huh7 cells (P<0.001). Incubation with excess AsOR decreased HTC mitochondrial DNA levels by 75% in Huh7 cells exposed to complexed mitochondria with or without AsOR-LLO. No significant levels of HTC mitochondrial DNA were found in SK Hep1 cells under any condition (Figure 3D).
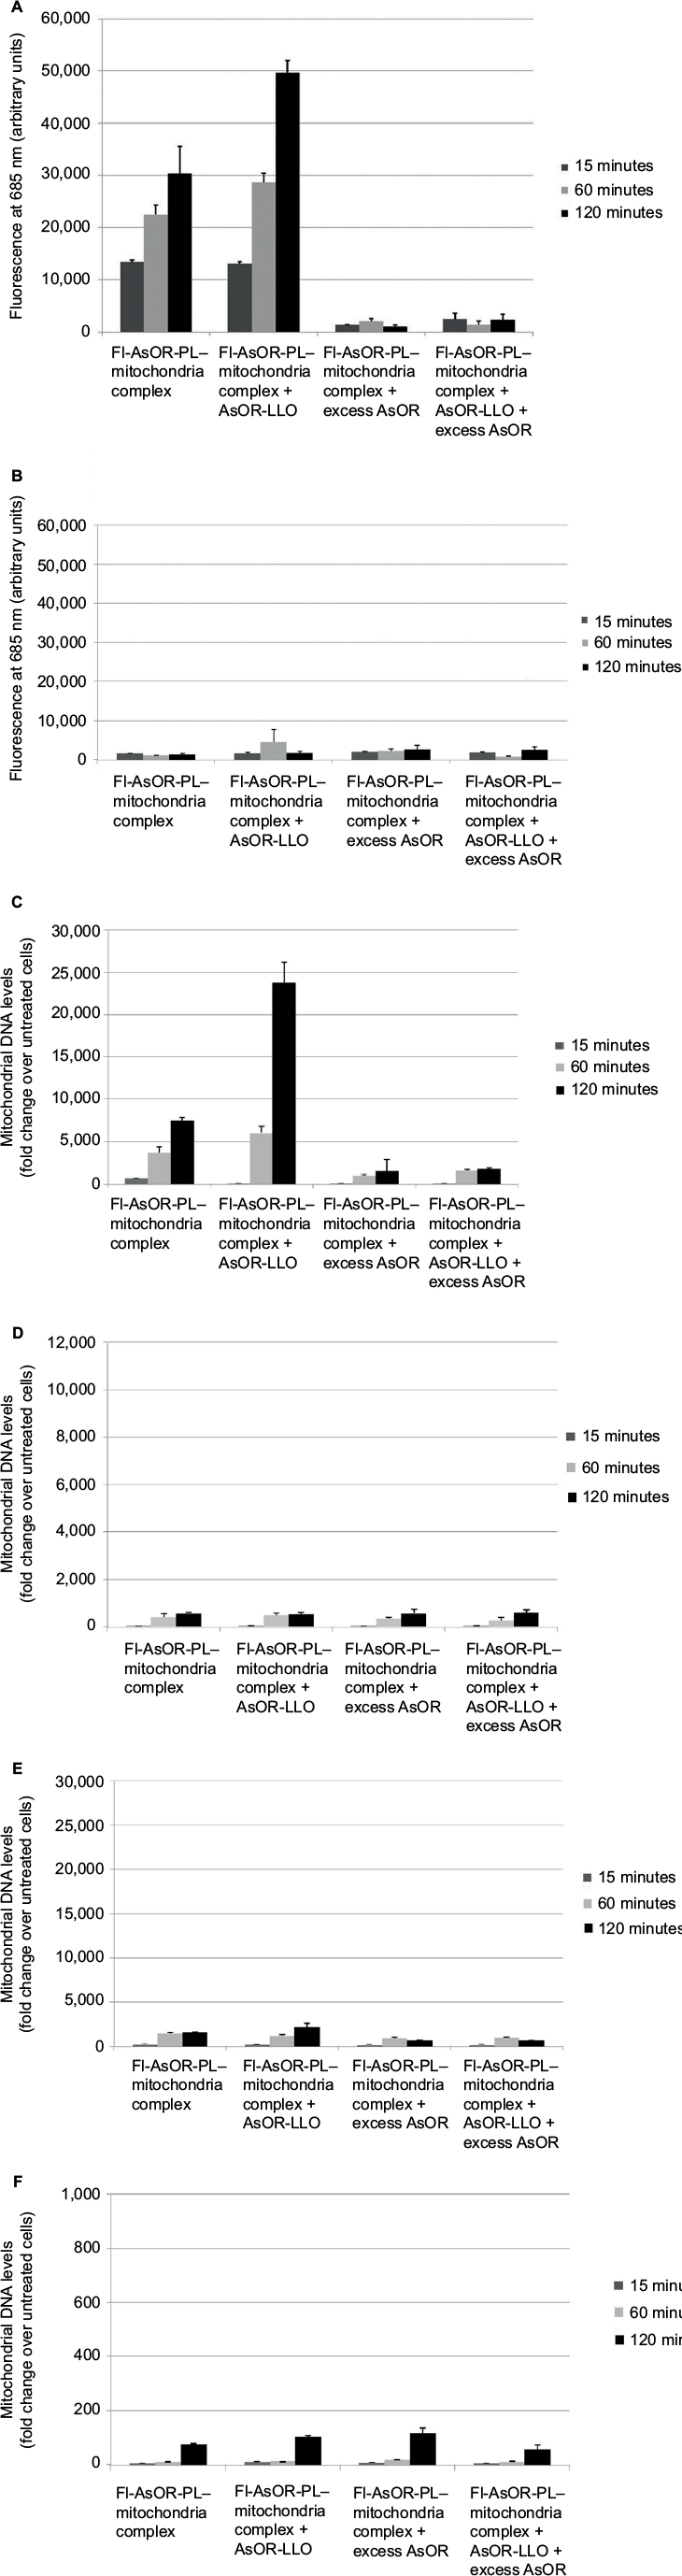 | Figure 3 Uptake of Fl-AsOR-PL–mitochondria complexes by Huh7 and SK Hep1 cells in the presence of AsOR-LLO conjugate, as measured by fluorescence and qPCR. Notes: Cells were incubated separately with Fl-AsOR-PL–mitochondria complex, complexed mitochondria and AsOR-LLO, complexed mitochondria + excess AsOR, or complexed mitochondria + AsOR-LLO + excess AsOR for 2 hours and collected for analysis at various time points. (A) Fluorescence levels in Huh7 cells; (B) SK Hep1 cells incubated with complexed mitochondria or controls. Mitochondrial DNA levels after incubation of AsOR-LLO conjugate with (C) Huh7 cells; (D) SK Hep1 cells; (E) Huh7 cells treated with colchicine; or (F) incubated at 4°C. Abbreviations: Fl-AsOR-PL, fluorescence-labeled asialoorosomucoid polylysine; qPCR, quantitative polymerase chain reaction. |
For further confirmation that the observed levels of HTC mitochondrial DNA in Huh7 cells had been due to receptor-mediated endocytosis, cells were pretreated with colchicine for 120 minutes. The amount of HTC mitochondrial DNA associated with these cells was 2,100-fold that of untreated controls at 120 minutes (approximately ten to 30 HTC mitochondria per cell, Figure 3E), which was significantly (P<0.001) lower than that in Huh7 cells not treated with colchicine. No significant levels of HTC mitochondrial DNA were measured in Huh7 cells at 4°C (Figure 3F).
Localization of internalized mitochondria
To determine intracellular distribution of complexed mitochondria, a cell line stably expressing GFP-labeled mitochondria, HTC-Mito-GFP, was used as the source of mitochondria for uptake experiments. Huh7 cells were incubated with complexes and controls for 120 minutes, washed with EDTA-PBS, and maintained in DMEM 10% FBS. Six hours later, cells were stained with an early endosomal marker (EEA1, Alexa Fluor 594). Huh7 cells incubated with GFP-labeled HTC mitochondria alone showed endosomal (red) staining (Figure 4A), but no GFP staining (Figure 4B). This suggests that mitochondria alone were not internalized significantly by phagocytosis or any other mechanism that did not involve the AsGR (Figure 4D). Cells incubated with AsOR-PL–mitochondria complex showed endosomal staining (Figure 4A) and hardly any GFP fluorescence (Figure 4B). Those GFP-stained structures that were present revealed overlapping (yellow) GFP and Alexa Fluor 594 in the merged view (Figure 4D). This suggests that binding of the AsG component of complexed mitochondria to AsGR resulted in internalization of AsOR-PL–mitochondria complexes within endosomes – colocalization. That GFP and Alexa Fluor 594 on AsOR were colocalized was further supported by fluorescence-plot intensity in the z-axis of cell images from random fields (Figure S5). Cells incubated with both AsOR-PL–mitochondria complex and AsOR-LLO conjugate also showed endosomal (Figure 4A) and some overlapping GFP (Figure 4B) and Alexa Fluor 594 staining (Figure 4D). However, there were also large quantities of nonoverlapped GFP surrounding nuclei (Figure 4D) in the merged view. Under acidic and reducing conditions in lysosomes, LLO has been shown previously to aggregate to form multimers and insert itself into membranes to form pores. Influx of water results in lysis of endosomes.24 Figure 4C shows nuclei stained with DAPI.
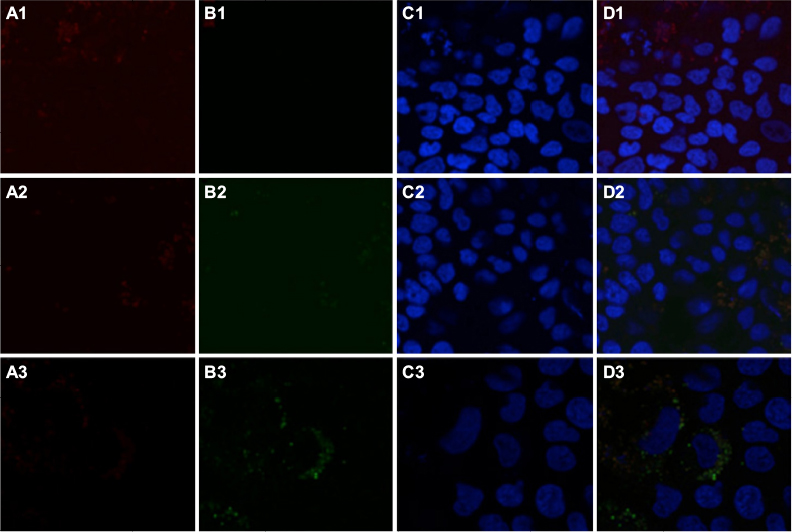 | Figure 4 Localization of early endosomes and GFP-labeled HTC mitochondria by confocal fluorescence microscopy. Notes: Huh7 cells were stained for early endosome marker EEA1 after uptake for 2 hours and removal of media containing additives, and imaged under a confocal fluorescence microscope 6 hours later. Column A, endosomal marker (anti-EEA1–Alexa Fluor 594, red); column B, GFP (green); column C, DAPI nuclei (blue); and column D, merged. Additives to the media were 1, mitochondria alone; 2, complexed mitochondria alone; and 3, complexed mitochondria plus AsOR-LLO conjugate. Abbreviations: Fl-AsOR-PL, fluorescence-labeled asialoorosomucoid polylysine; DAPI, 4’,6-diamidino-2-phenylindole. |
The presence of mitochondrial GFP not associated (unmerged) with endosomes at 6 hours after removal of mitochondria from the media is consistent with endosomal rupture and release of internalized GFP-labeled mitochondria in cytoplasm. Absence of GFP in cells incubated with mitochondria alone provided additional evidence that internalization was due to receptor-mediated endocytosis, and not some nonspecific uptake mechanism.
To determine the structural integrity of internalized mitochondria by Huh7 cells, cells were incubated with AsOR-PL-Mito-GFP with and without AsOR-LLO for 2 hours followed by staining with an early endosomal marker (EEA1) after 6 hours. Cells were labeled with anti-GFP (10 nm gold) and anti-EEA (15 nm gold) to determine the location of early endosomes and internalized GFP-labeled mitochondria using electron microscopy. Positive controls, HTC-Mito-GFP cells labeled with the same antibodies, showed intact mitochondria and endosomal membrane (Figure S6A). Huh7 cells incubated with AsOR-PL-Mito-GFP complexes alone showed GFP labeling mixed with endosomal labels in apparently disintegrated structures, together with normal unlabeled host (Huh7)-cell mitochondria (Figure S6B). In contrast, cells coincubated with AsOR-PL-Mito-GFP and AsOR-LLO showed GFP labels on intact mitochondria (Figure S6C). The internalized HTC mitochondria appeared indistinguishable from those in donor HTC cells (Figure S6A). The data support the conclusion that the structure of transplanted mitochondria was similar to that of normal mitochondria at the level of electron microscopy.
Changes in AsG-associated fluorescence and mitochondrial DNA levels after exposure of complexed mitochondria to Mito– cells
Huh7-Mito– and SK Hep1-Mito– cells lacking mitochondrial DNA were used as models of cells with mitochondrial damage. Figure S7A shows that in Huh7-Mito– and SK Hep1-Mito– cells had no detectable mitochondrial DNA, were dysfunctional, and could be used as a model of mitochondrial damage. These cells required supplemental medium containing compensatory nutrients to survive. Removal of supplemental cell-culture media resulted in decreased cellular DNA in Huh7-Mito– and SK Hep1-Mito– cells with time, whereas parental Huh7 and SK Hep1 cells showed increased cellular DNA (Figure S7B), demonstrating that Mito– cells required supplemental media for survival.
Administration of complexed Huh7-derived mitochondria alone to Huh7-Mito– cells resulted in fluorescence levels that significantly (P<0.01) increased from 6,400 units at 60 minutes to more than 11,000 units at 120 minutes. After coadministration of complexed mitochondria with AsOR-LLO conjugate, fluorescence levels in Huh7-Mito– cells significantly (P<0.001) increased from 14,000 units at 60 minutes to more than 30,000 units at 120 minutes. These fluorescence levels decreased >90% after incubation with excess AsOR (Figure 5A). However, fluorescence levels were not stable in Huh7-Mito– cells and continued to decrease from 7,000 units at 12 hours to 300 units by 7 days. Coadministration of complexed mitochondria and AsOR-LLO conjugate resulted in fluorescence levels that decreased from 27,000 units at 12 hours to 11,000 units at 10 days (Figure 5B). Excess AsOR resulted in no significant levels of fluorescence in Huh7-Mito– cells after exposure to complexed mitochondria with or without AsOR-LLO conjugate. There was no significant fluorescence in SK Hep1-Mito– cells under any condition (Figure 5C and D).
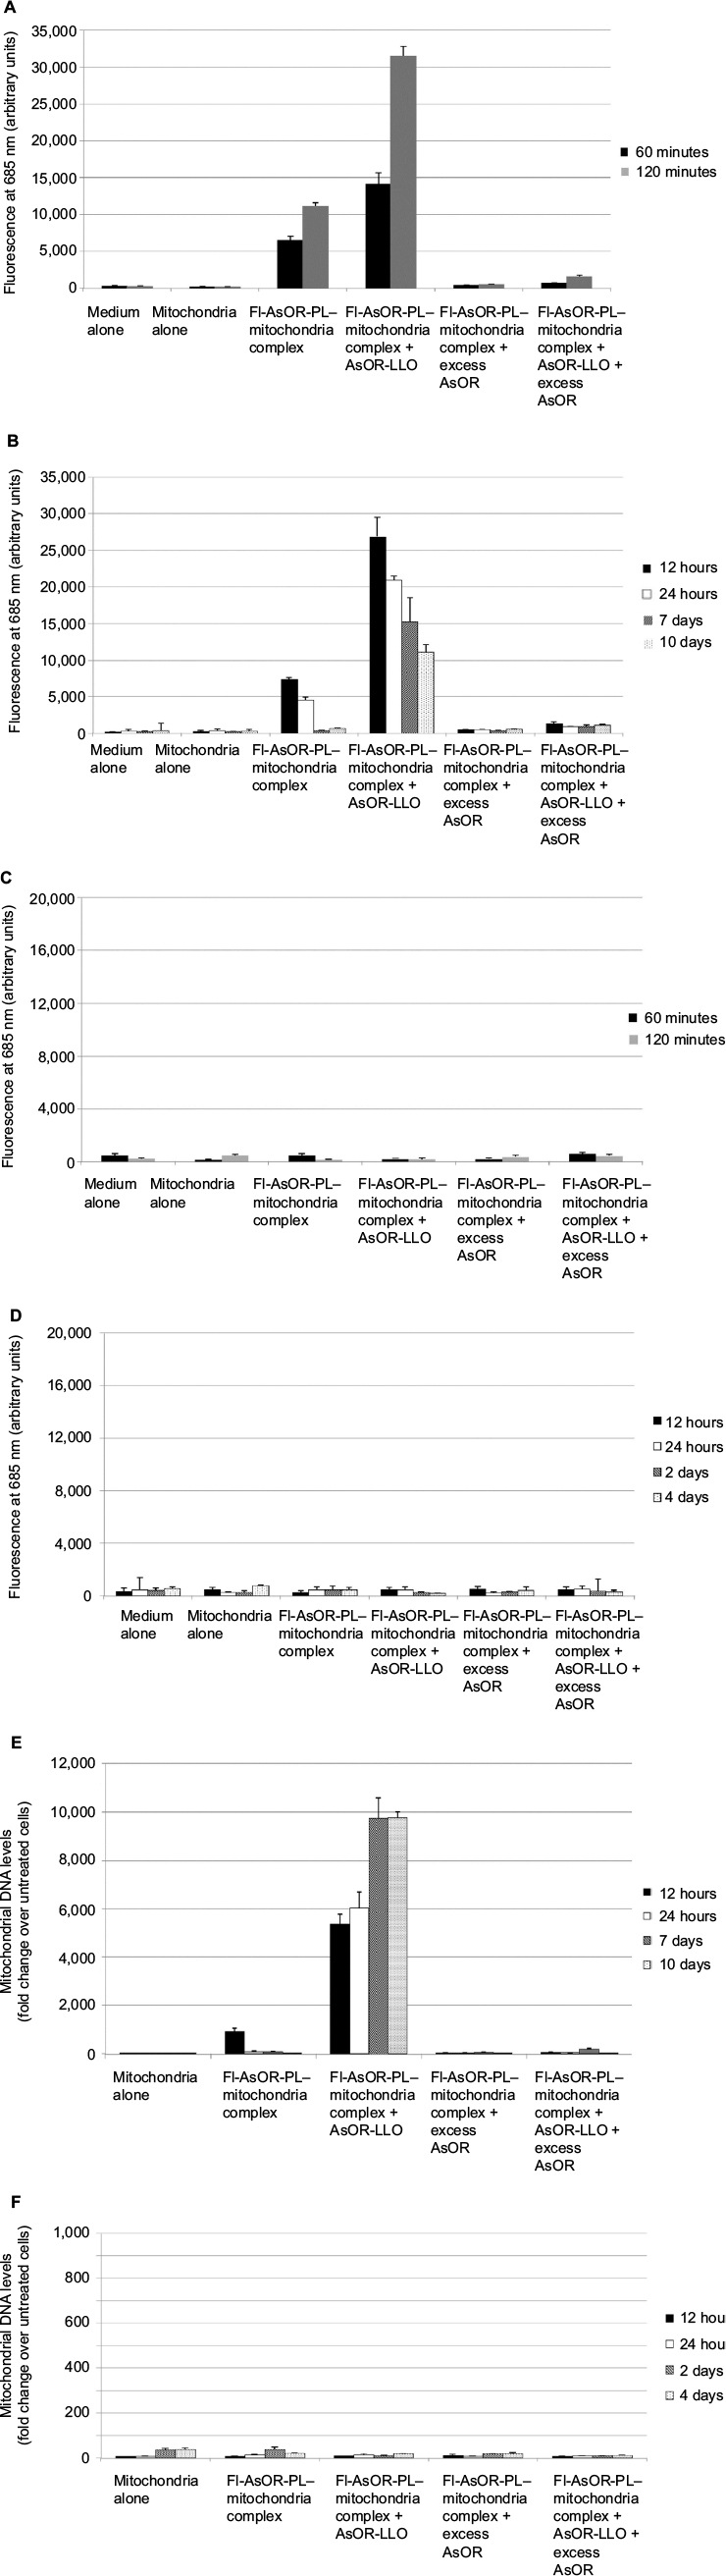 | Figure 5 Coadministration of complexed mitochondria and controls in Huh7-Mito– and SK Hep1-Mito– cells, as measured by fluorescence and qPCR. Notes: Cells were incubated separately with media alone, mitochondria alone, Fl-AsOR-PL–mitochondria complex, complexed mitochondria plus AsOR-LLO, complexed mitochondria plus excess AsOR, or complexed mitochondria plus AsOR-LLO plus excess AsOR at 37°C for 2 hours and maintained in supplement-free cell-culture media. (A) Fluorescence levels in Huh7-Mito– cells at 120 minutes and (B) 10 days; and (C) SK Hep1-Mito– cells at 120 minutes and (D) 4 days. Mitochondrial DNA levels in (E) Huh7-Mito– cells at 10 days and (F) SK Hep1-Mito– cells at 4 days. Bars correspond to mean ± standard error of arbitrary fluorescence units per equal number of cells. Abbreviations: qPCR, quantitative polymerase chain reaction; Fl-AsOR-PL, fluorescence-labeled asialoorosomucoid polylysine. |
To determine whether mitochondrial DNA levels declined in a manner similar to the fluorescence, Huh7 mitochondrial DNA levels were assayed by qPCR. In contrast to the fluorescence data, complexed mitochondria coadministered with AsOR-LLO conjugate to Huh7-Mito– cells resulted in a significant (P<0.001) increase in mitochondrial DNA levels from 5,300-fold (30–70 mitochondria per cell) over control at 12 hours to more than 9,700-fold (60–140 mitochondria per cell) (P<0.001) over control at 7 day, and remained stable up to 10 days in supplement-free media. Exposure to complexed mitochondria in the absence of AsOR-LLO conjugate resulted in mitochondrial DNA levels 900-fold (five to ten mitochondria per cell) over control at 12 hours and barely detectable levels at 24 hours (Figure 5E). Mitochondrial DNA levels in SK Hep1-Mito– cells were barely detectable under any condition (Figure 5F). The fact that the protein marker decreased while mitochondrial DNA levels increased after coadministration of complexed mitochondria and AsOR-LLO conjugate indicates that intracellular fates of protein carrier and internalized mitochondria were different, probably due to separation of the two components some time within 8 hours after internalization.
Cell proliferation and aerobic respiration in Mito– cells exposed to complexed mitochondria
To determine whether uptake of mitochondria by Mito– cells affected cell proliferation in supplement-free media, cell numbers were assayed by cellular DNA as a function of time after exposure to complexed mitochondria. Figure 6A shows that coadministration of complexed mitochondria and AsOR-LLO conjugate resulted in a significant increase in cell DNA to 3.5-fold (P<0.001) over baseline by 10 days. In contrast, in untreated cells, DNA decreased to 0.03-fold over baseline (P<0.004). SK Hep1-Mito– cell numbers decreased under all conditions (Figure 6B). The data suggested that coadministration of complexed mitochondria and AsOR-LLO conjugate to Huh7-Mito– cells increased cell numbers in supplement-free media. Rescued Huh7-Mito– cells proliferated and were passaged in supplement-free media for at least 8 weeks (data not shown).
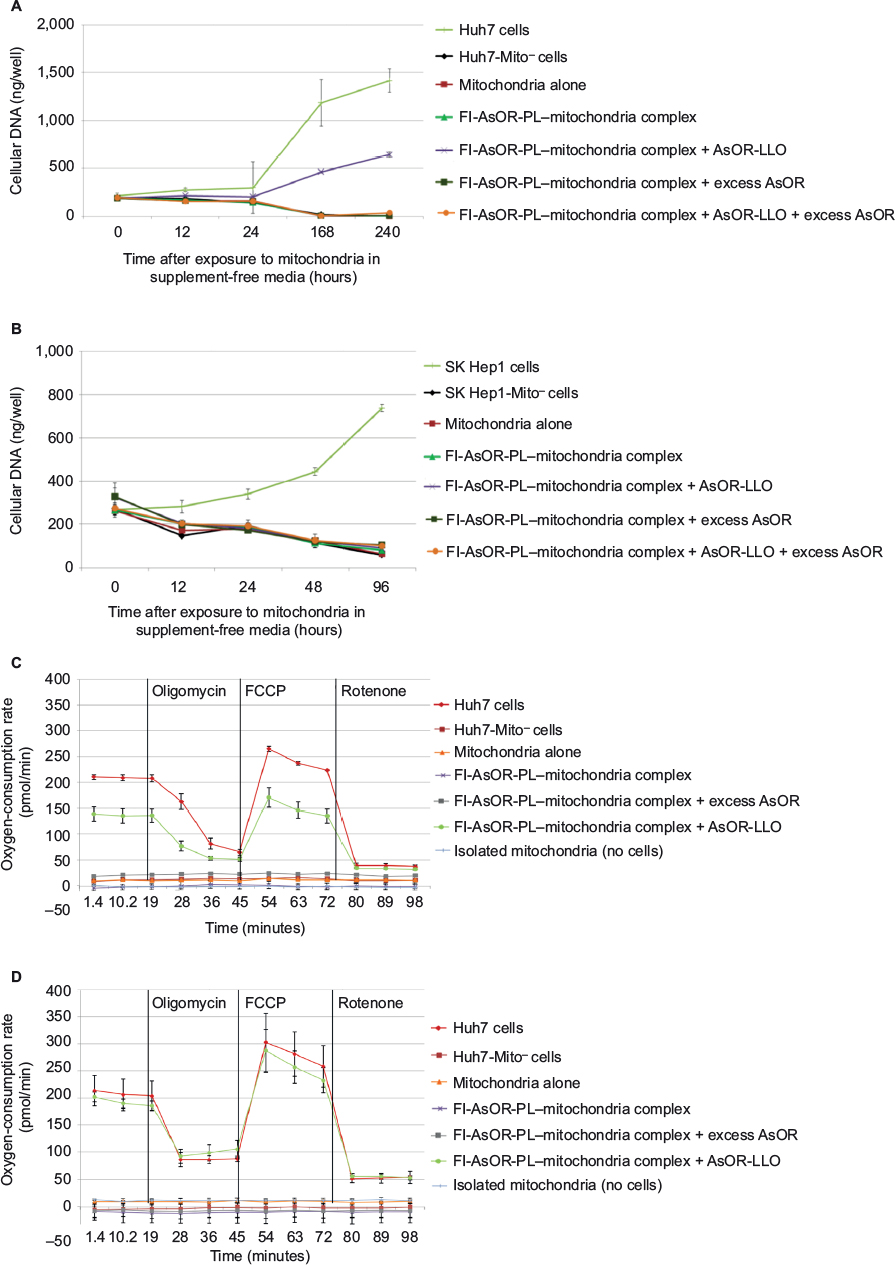 | Figure 6 Effects of transplanted mitochondria on Mito– cells. Notes: Cellular DNA levels in Mito– cells after coadministration of complexed mitochondria and controls in (A) Huh7-Mito– and (B) SK Hep1-Mito– cells. Total cellular DNA in cells after incubation with mitochondria alone, Fl-AsOR-PL–mitochondria complex, complexed mitochondria plus AsOR-LLO conjugate, complexed mitochondria plus excess AsOR, or complexed mitochondria plus AsOR-LLO conjugates plus excess AsOR at 37°C for 2 hours. Oxygen-consumption rates and effects of inhibitors of mitochondrial respiration in Huh7-Mito– cells after coadministration of complexed mitochondria or controls at (C) 12 hours and (D) 10 days. Abbreviations: Fl-AsOR-PL, fluorescence-labeled asialoorosomucoid polylysine; FCCP, carbonyl cyanide-p-trifluoromethoxyphenylhydrazone. |
The OCR was measured to quantify mitochondrial respiration levels in cells with transplanted mitochondria. While Huh7-Mito– and SK Hep1-Mito– cells showed no measurable mitochondrial respiration, Huh7 and SK Hep1 cells showed high basal OCRs, which changed with addition of oligomycin, carbonyl cyanide-p-trifluoromethoxyphenylhydrazone and rotenone, consistent with mitochondrial respiration (Figure S8). Twelve hours after coadministration of complexed mitochondria and AsOR-LLO conjugate to Huh7-Mito– cells, there was an increase in OCR to 70% compared to parental Mito+ cells. This increase was blocked by excess AsOR (Figure 6C). Ten days after coadministration of complexed mitochondria and AsOR-LLO conjugate, Huh7-Mito– cells had levels of mitochondrial respiration comparable to (>90%) parental Huh7 cells (Figure 6D).
Discussion
This report is the first to show that mitochondria can be targeted for uptake by a specific cell type, and that cointernalization of an endosomolytic protein can result in intracellular release of functional mitochondria. That the observed internalization of mitochondria was not simply due to phagocytosis is indicated by the fact that exposure of AsGR+ cells to isolated mitochondria alone and exposure of complexed mitochondria to AsGR– cells both failed to result in internalization under identical conditions. The data on targeted transplantation of mitochondria into AsGR+-Mito– cells showed that those cells were not only able to survive in supplement-free media, but were able to proliferate.
The use of a targeted endosomolytic protein to release substances cointernalized in endosomes has been shown previously.25 However, mitochondria are enveloped in a dual-membrane shell, of which the outer membrane closely resembles that of mammalian plasma membrane in terms of cholesterol content.26 Exposure of mitochondria to LLO conjugate at low pH did not cause significant mitochondrial membrane damage in the absence of reducing conditions (data not shown). The fact that cointernalization of complexed mitochondria and LLO conjugate resulted in internalized mitochondria with normal oxygen consumption suggests that if damage to targeted mitochondria had occurred, the effects were not sufficient to prevent those mitochondria from meeting the energy requirements of host cells.
The use of ddC served as a model for actual drug-induced mitochondrial toxicity. ddC is an agent that had been originally approved by the US Food and Drug Administration27 and used clinically, until substantial side effects due to mitochondrial damage were observed, greatly limiting its use currently.28 The fact that targeted mitochondrial transplantation was able to rescue cells with no detectable preexisting mitochondrial DNA suggests that targeted mitochondrial transplantation in cells with less extreme toxicity might result in similar rescue from the effects of drug-induced mitochondrial toxicity. Successful transplantation of mitochondria in liver cells may be helpful in cases of drug-induced mitochondrial damage to liver cells. In future, we plan to confirm that internalized mitochondria can rescue host cells containing damaged mitochondria, by characterizing mitochondrial respiration using specific metabolic reagents.
It is possible that cells with specific mitochondrial disorders may also be generated by transplantation of diseased mitochondria to Mito– cells. Such cell types may create model systems for genotypic and phenotypic studies on genetic mitochondrial diseases. Additionally, we plan to study transplantation of mitochondria in animals to determine the effects of transplantation of mitochondria in models more closely analogous to clinical conditions.
In summary, the current data support the conclusion that cointernalization of complexed mitochondria and targeted endosomolytic agents by hepatocytes in culture can result in internalization of functional mitochondria capable of rescuing cells whose mitochondria are damaged by drug toxicity. Such a transplantation system might be useful in the study of regulation of mitochondrial proliferation and function in pathological states.
Acknowledgment
We gratefully acknowledge the support of the Herman Lopata Chair in Hepatitis Research, which made this work possible.
Disclosure
The authors report no conflicts of interest in this work.
References
Hayashi J, Takemitsu M, Goto Y, Nonaka I. Human mitochondria and mitochondrial genome function as a single dynamic cellular unit. J Cell Biol. 1994;125(1):43–50. | ||
Westermann B. Bioenergetic role of mitochondrial fusion and fission. Biochim Biophys Acta. 2012;1817(10):1833–1838. | ||
Alberts B, Johnson A, Lewis J, Raff M, Roberts K, Walter P. Molecular Biology of the Cell. 4th ed. New York: Garland Science; 2002. | ||
Lee WS, Sokol RJ. Liver disease in mitochondrial disorders. Semin Liver Dis. 2007;27(3):259–273. | ||
Labbe G, Pessayre D, Fromenty B. Drug-induced liver injury through mitochondrial dysfunction: mechanisms and detection during preclinical safety studies. Fundam Clin Pharmacol. 2008;22(4):335–353. | ||
Dimauro S, Rustin P. A critical approach to the therapy of mitochondrial respiratory chain and oxidative phosphorylation diseases. Biochim Biophys Acta. 2009;1792(12):1159–1167. | ||
Wu GY, Wu CH. Receptor-mediated gene delivery and expression in vivo. J Biol Chem. 1988;263(29):14621–14624. | ||
Wu GY, Wu CH. Evidence for targeted gene delivery to Hep G2 hepatoma cells in vitro. Biochemistry. 1988;27(3):887–892. | ||
Yang DY, Ouyang CH, Lu FG, Liu XW, Huang LQ. Targeting specificity and pharmacokinetics of asialoorosomucoid a specific ligand for asialglycoprotein [sic] receptor on hepatocyte. J Dig Dis. 2007;8(2):89–95. | ||
Ashwell G, Morell AG. The role of surface carbohydrates in the hepatic recognition and transport of circulating glycoproteins. Adv Enzymol Relat Areas Mol Biol. 1974;41:99–128. | ||
Whitehead PH, Sammons HG. A simple technique for the isolation of orosomucoid from normal and pathological sera. Biochim Biophys Acta. 1966;124(1):209–211. | ||
Stockert RJ, Becker FF. Diminished hepatic binding protein for desialylated glycoproteins during chemical hepatocarcinogenesis. Cancer Res. 1980;40(10):3632–3634. | ||
Walton CM, Wu CH, Wu GY. A method for purification of listeriolysin O from a hypersecretor strain of Listeria monocytogenes. Protein Expr Purif. 1999;15(2):243–245. | ||
Choi J, Lee KJ, Zheng Y, Yamaga AK, Lai MM, Ou JH. Reactive oxygen species suppress hepatitis C virus RNA replication in human hepatoma cells. Hepatology. 2004;39(1):81–89. | ||
Chariot P, Drogou I, de Lacroix-Szmania I, et al. Zidovudine-induced mitochondrial disorder with massive liver steatosis myopathy lactic acidosis and mitochondrial DNA depletion. J Hepatol. 1999;30(1):156–160. | ||
Hashiguchi K, Zhang-Akiyama QM. Establishment of human cell lines lacking mitochondrial DNA. Methods Mol Biol. 2009;554:383–391. | ||
Hui E, Johnson CP, Yao J, Dunning FM, Chapman ER. Synaptotagmin-mediated bending of the target membrane is a critical step in Ca(2+)-regulated fusion. Cell. 2009;138(4):709–721. | ||
Piasek A, Thyberg J. Effects of colchicine on endocytosis and cellular inactivation of horseradish peroxidase in cultured chondrocytes. J Cell Biol. 1979;81(2):426–437. | ||
Seguin SJ, Morelli FF, Vinet J, et al. Inhibition of autophagy lysosome and VCP function impairs stress granule assembly. Cell Death Differ. 2014;21(12):1838–1851. | ||
Untergasser A, Cutcutache I, Koressaar T, et al. Primer3: new capabilities and interfaces. Nucleic Acids Res. 2012;40(15):e115. | ||
Ye J, Coulouris G, Zaretskaya I, Cutcutache I, Rozen S, Madden TL. Primer-BLAST: a tool to design target-specific primers for polymerase chain reaction. BMC Bioinformatics. 2012;13:134. | ||
Perkins GA, Sun MG, Frey TG. Chapter 2: Correlated light and electron microscopy/electron tomography of mitochondria in situ. Methods Enzymol. 2009;456:29–52. | ||
Cai J, Yang J, Jones DP. Mitochondrial control of apoptosis: the role of cytochrome C. Biochim Biophys Acta. 1998;1366(1–2):139–149. | ||
Mathew E, Hardee GE, Bennett CF, Lee KD. Cytosolic delivery of antisense oligonucleotides by listeriolysin O-containing liposomes. Gene Ther. 2003;10(13):1105–1115. | ||
Beauregard KE, Lee KD, Collier RJ, Swanson JA. pH-dependent perforation of macrophage phagosomes by listeriolysin O from Listeria monocytogenes. J Exp Med. 1997;186(7):1159–1163. | ||
Raffy S, Teissié J. Control of lipid membrane stability by cholesterol content. Biophys J. 1999;76(4):2072–2080. | ||
Saravolatz LD, Winslow DL, Collins G, et al. Zidovudine alone or in combination with didanosine or zalcitabine in HIV-infected patients with the acquired immunodeficiency syndrome or fewer than 200 CD4 cells per cubic millimeter. N Engl J Med. 1996;335(15):1099–1106. | ||
Benbrik E, Chariot P, Bonavaud S, et al. Cellular and mitochondrial toxicity of zidovudine (AZT) didanosine (ddI) and zalcitabine (ddC) on cultured human muscle cells. J Neurol Sci. 1997;149(1):19–25. |
Supplementary materials
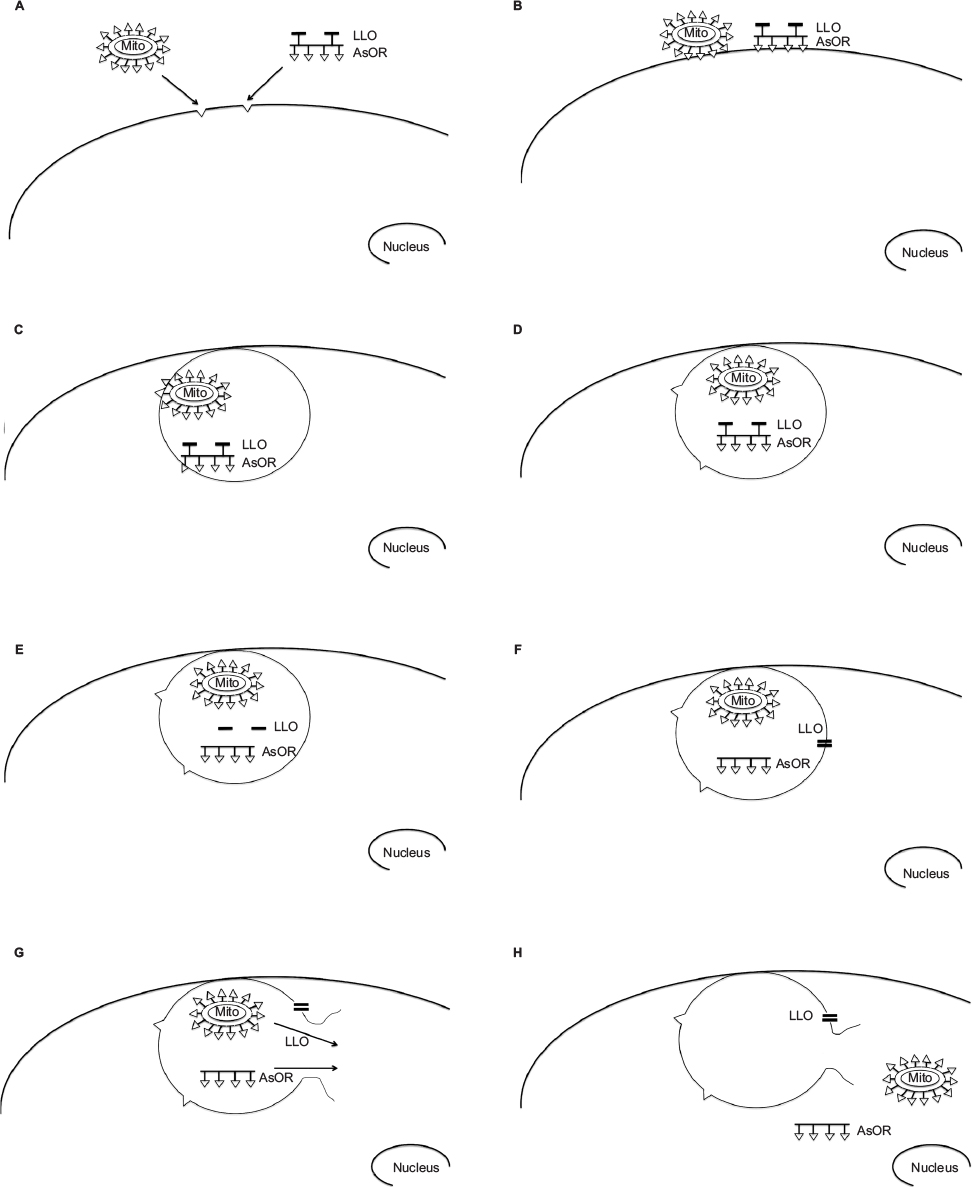 | Figure S1 Proposed pathway of targeted transplantation of mitochondria to hepatocytes. Notes: (A) Coadministration of mitochondria complexed to AsOR-PL conjugate and AsOR-LLO conjugate to asialoglycoprotein (AsG) receptors on hepatocytes. Triangles represent exposed terminal galactose residues recognized by AsG receptors. (B) Binding of complexed mitochondria and AsOR-LLO conjugate to AsG receptors on hepatocyte plasma membranes. (C) Cointernalization of complexed mitochondria and AsOR-LLO conjugate into the same endosome. (D) Dissociation of mitochondria complex and AsOR-LLO conjugate during acidification of the endosome. (E) Release of LLO from AsOR-LLO conjugate by cleavage of disulfide bonds under reducing conditions present in endosomes. (F) Aggregation of released LLO and insertion into endosomal membrane, forming a pore. (G) Entry of water into LLO pores results in rupture of endosomal membrane by osmotic pressure. (H) Release of endosomal contents including mitochondria into the cytoplasm. Abbreviation: AsOR, asialoorosomucoid. |
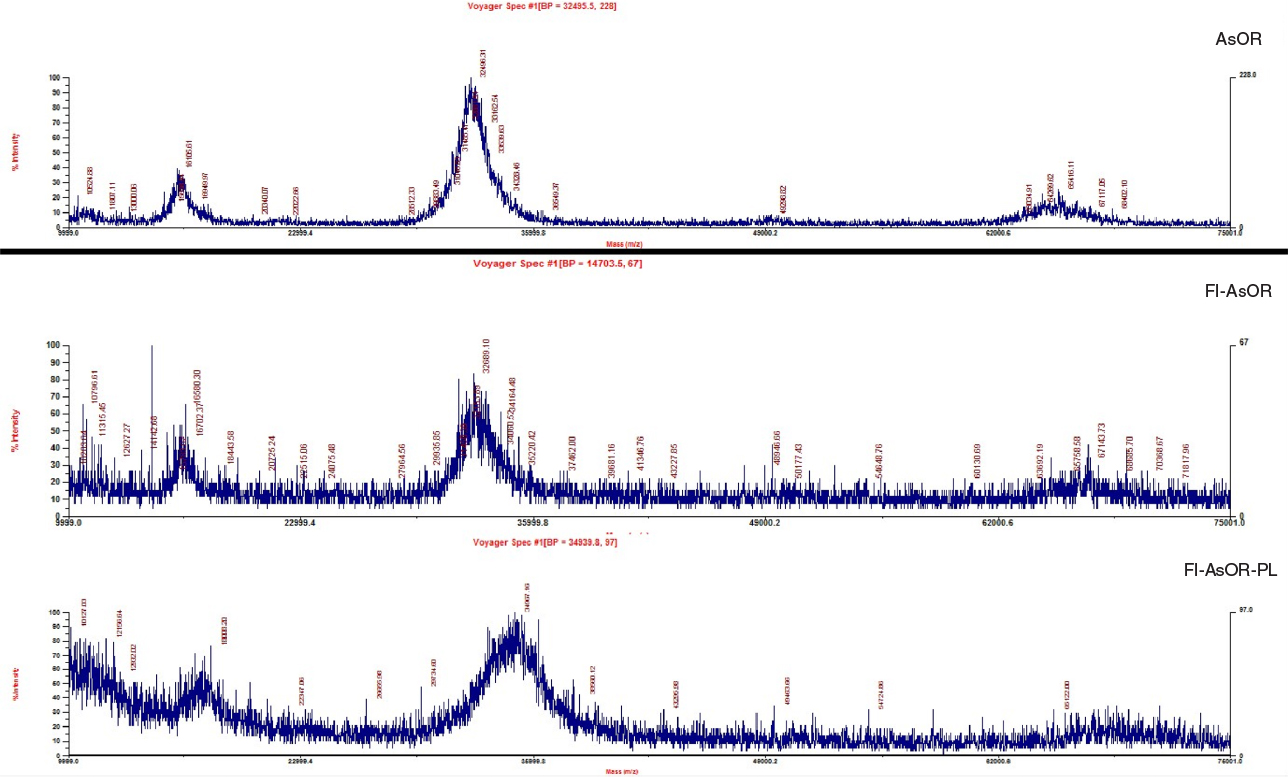 | Figure S2 Mass-spectrometry data. Notes: Purified AsOR, Fl-AsOR, and Fl-AsOR-PL with or without internal controls (lysozyme and bovine serum albumin) were mixed with a sinapic acid matrix, and loaded on a mass-spectrometry plate to determine masses. Spectral peaks were calibrated using lysozyme and bovine serum albumin as internal and external controls. Abbreviation: Fl-AsOR-PL, fluorescence-labeled asialoorosomucoid polylysine. |
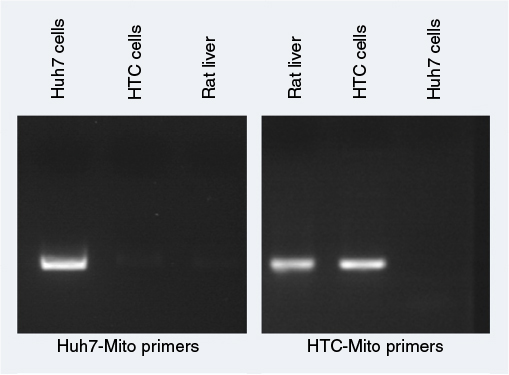 | Figure S3 Primer specificity for mitochondrial DNA by amplification. Notes: Primers were designed using Primer3 and Primer-BLAST to amplify Huh7 mitochondrial DNA or HTC and rat liver mitochondrial DNA specifically. Huh7 and HTC cell mitochondrial DNA and rat liver-cell DNA were used to determine the specificity of primers. PCR-amplified products on gels showed that Huh7 mitochondrial primers and HTC mitochondrial primers specifically amplified only Huh7 mitochondrial DNA and HTC (rat) mitochondrial DNA, respectively. Abbreviation: PCR, polymerase chain reaction. |
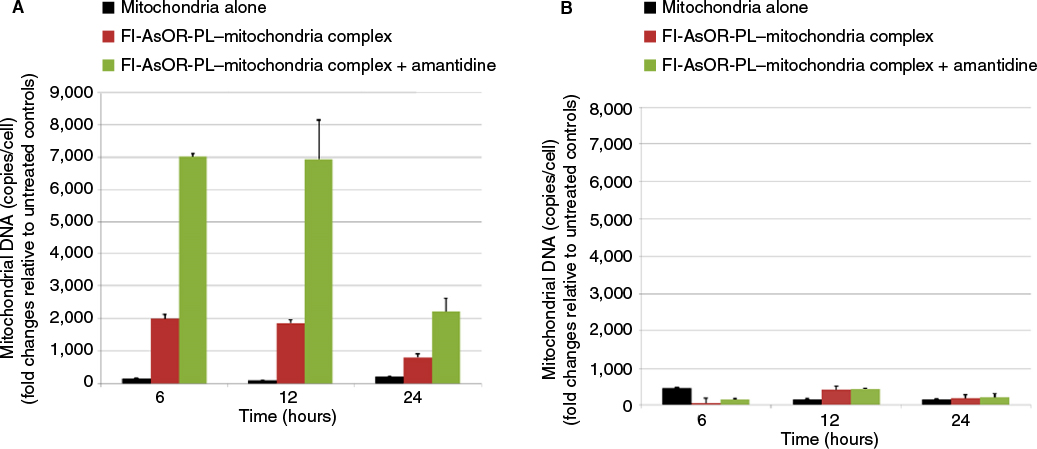 | Figure S4 Effects of a lysosomal inhibitor on internalization of targeted mitochondria. Notes: Cells were treated with 20 µM amantadine for 1 hour prior to and during the uptake assay for 2 hours. Cells were collected to measure mitochondrial DNA levels with qPCR and compared to untreated controls at various time points. (A) HTC mitochondrial DNA levels in Huh7 cells; (B) HTC mitochondrial DNA levels in SK Hep1 cells. Abbreviations: qPCR, quantitative polymerase chain reaction; Fl-AsOR-PL, fluorescence-labeled asialoorosomucoid polylysine. |
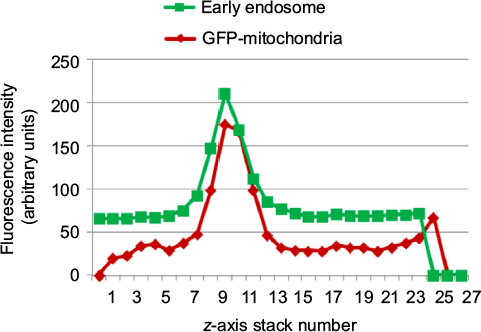 | Figure S5 Fluorescence intensities of confocal microscopy images versus stack number. Notes: Fluorescence intensities of early endosomal marker EEA1 and GFP mitochondria were plotted according to depth and stack number of confocal microscopy images of Huh7 cells at 6 hours postincubation with AsOR-PL–Mito-GFP complexes at 37°C. Abbreviation: AsOR-PL, asialoorosomucoid polylysine. |
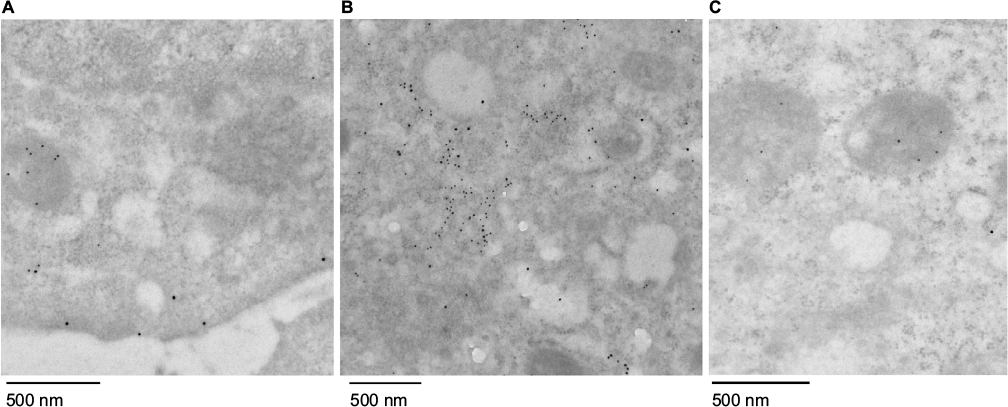 | Figure S6 Electron microscopy characterization of internalized mitochondria. Notes: Huh7 cells were stained with gold-labeled antibodies for Mito-GFP (10 nm) and early endosome marker EEA1 (15 nm) after uptake for 2 hours and removal of media-containing additives. Samples were imaged under electron microscopy 6 hours later. (A) HTC-Mito-GFP cells; (B) Huh7 cells incubated with AsOR-PL-Mito-GFP; (C) Huh7 cells coincubated with AsOR-PL-Mito-GFP and AsOR-PL. Abbreviation: AsOR-PL, asialoorosomucoid polylysine. |
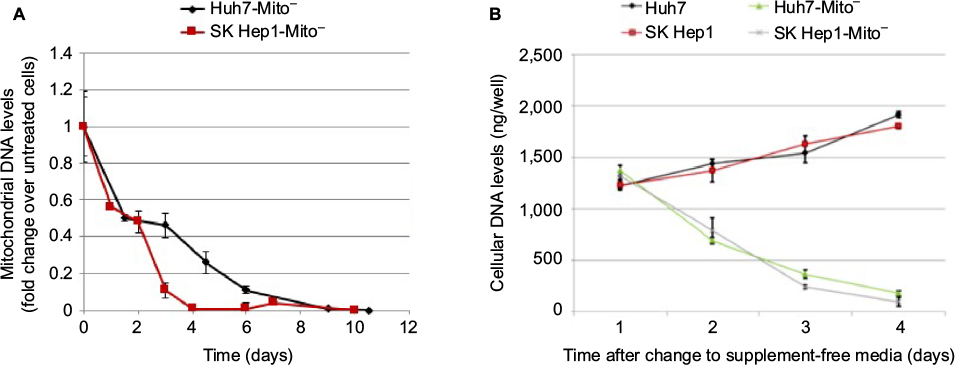 | Figure S7 Preparation of Mito– cells. Notes: Huh7 and SK Hep1 cells were exposed to 10 µM ddC for 3 weeks and thereafter were maintained in DMEM with supplements. (A) Mitochondrial DNA levels determined by qPCR at various time points in ddC-treated cells; (B) cellular DNA levels determined by qPCR in cells maintained in supplement-free media. Abbreviations: ddC, 2’,3’-dideoxycytidine; DMEM, Dulbecco’s modified Eagle’s medium; qPCR, quantitative polymerase chain reaction. |
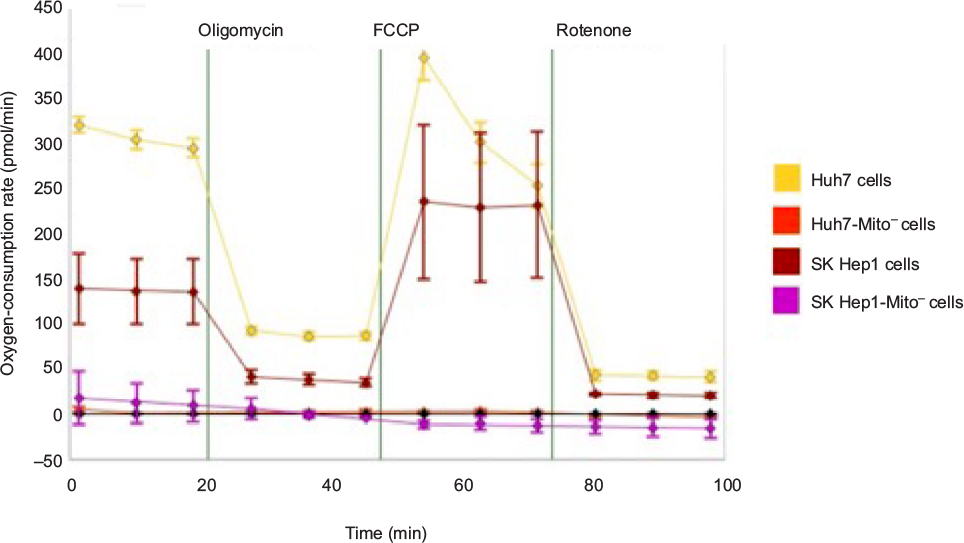 | Figure S8 Characterization of mitochondrial respiration. Notes: Cells were plated in XF24 cell-culture microplates 1 day before mitochondrial respiration measurements. Oxygen-consumption rates were measured with a Seahorse XFe analyzer to determine mitochondrial respiration in Huh7-Mito–, SK Hep1-Mito–, and parental Huh7 and SK Hep1 cells. Oxygen-consumption rates were measured after sequential addition of oligomycin, carbonyl cyanide-p-trifluoromethoxyphenylhydrazone (FCCP), or rotenone to evaluate mitochondrial respiration in cells. Abbreviation: min, minutes. |
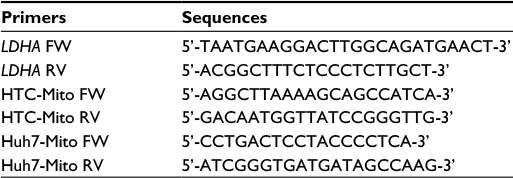 | Table S1 Sequences of primers used for quantification Abbreviations: FW, forward; RV, reverse. |
 © 2016 The Author(s). This work is published and licensed by Dove Medical Press Limited. The full terms of this license are available at https://www.dovepress.com/terms.php and incorporate the Creative Commons Attribution - Non Commercial (unported, v3.0) License.
By accessing the work you hereby accept the Terms. Non-commercial uses of the work are permitted without any further permission from Dove Medical Press Limited, provided the work is properly attributed. For permission for commercial use of this work, please see paragraphs 4.2 and 5 of our Terms.
© 2016 The Author(s). This work is published and licensed by Dove Medical Press Limited. The full terms of this license are available at https://www.dovepress.com/terms.php and incorporate the Creative Commons Attribution - Non Commercial (unported, v3.0) License.
By accessing the work you hereby accept the Terms. Non-commercial uses of the work are permitted without any further permission from Dove Medical Press Limited, provided the work is properly attributed. For permission for commercial use of this work, please see paragraphs 4.2 and 5 of our Terms.