")
Back to Journals » International Journal of Nanomedicine » Volume 11
Targeted polyethylene glycol gold nanoparticles for the treatment of pancreatic cancer: from synthesis to proof-of-concept in vitro studies
Authors Spadavecchia J , Movia D , Moore C, Manus Maguire C, Moustaoui H, Casale S, Volkov Y, Prina-Mello A
Received 1 October 2015
Accepted for publication 9 December 2015
Published 26 February 2016 Volume 2016:11 Pages 791—822
DOI https://doi.org/10.2147/IJN.S97476
Checked for plagiarism Yes
Review by Single anonymous peer review
Peer reviewer comments 3
Editor who approved publication: Dr Thomas Webster
Jolanda Spadavecchia,1,2,* Dania Movia,3,* Caroline Moore,3,4 Ciaran Manus Maguire,3,4 Hanane Moustaoui,2 Sandra Casale,1 Yuri Volkov,3,4 Adriele Prina-Mello3,4
1Laboratoire de Réactivité de Surface, Sorbonne Universités, UPMC Univ Paris VI, Paris, 2Centre National de la recherche française, UMR 7244, CSPBAT, Laboratory of Chemistry, Structures, and Properties of Biomaterials and Therapeutic Agents, Université Paris 13, Sorbonne Paris Cité, Bobigny, France; 3AMBER Centre, CRANN Institute, 4Department of Clinical Medicine, School of Medicine, Trinity College, Dublin, Ireland
*These authors contributed equally to this work
Abstract: The main objective of this study was to optimize and characterize a drug delivery carrier for doxorubicin, intended to be intravenously administered, capable of improving the therapeutic index of the chemotherapeutic agent itself, and aimed at the treatment of pancreatic cancer. In light of this goal, we report a robust one-step method for the synthesis of dicarboxylic acid-terminated polyethylene glycol (PEG)-gold nanoparticles (AuNPs) and doxorubicin-loaded PEG-AuNPs, and their further antibody targeting (anti-Kv11.1 polyclonal antibody [pAb]). In in vitro proof-of-concept studies, we evaluated the influence of the nanocarrier and of the active targeting functionality on the anti-tumor efficacy of doxorubicin, with respect to its half-maximal effective concentration (EC50) and drug-triggered changes in the cell cycle. Our results demonstrated that the therapeutic efficacy of doxorubicin was positively influenced not only by the active targeting exploited through anti-Kv11.1-pAb but also by the drug coupling with a nanometer-sized delivery system, which indeed resulted in a 30-fold decrease of doxorubicin EC50, cell cycle blockage, and drug localization in the cell nuclei. The cell internalization pathway was strongly influenced by the active targeting of the Kv11.1 subunit of the human Ether-à-go-go related gene 1 (hERG1) channel aberrantly expressed on the membrane of pancreatic cancer cells. Targeted PEG-AuNPs were translocated into the lysosomes and were associated to an increased lysosomal function in PANC-1 cells. Additionally, doxorubicin release into an aqueous environment was almost negligible after 7 days, suggesting that drug release from PEG-AuNPs was triggered by enzymatic activity. Although preliminary, data gathered from this study have considerable potential in the application of safe-by-design nano-enabled drug-delivery systems (ie, nanomedicines) for the treatment of pancreatic cancer, a disease with a poor prognosis and one of the main current burdens of today’s health care bill of industrialized countries.
Keywords: PEGylated gold nanoparticles, doxorubicin, potassium channel targeting, hERG1, pancreatic cancer, antibody-drug conjugate
Corrigendum for this paper has been published.
Introduction
Chronic diseases, such as cancer, are a major contributor of the current health care costs of industrialized countries, amounting to around €700 billion in Europe alone.1 Risk factors like an aging population2 indicate that the incidence of such chronic diseases will keep rising. Looking to the future, countries therefore need to find solutions to pressing demographic challenges, such as increased incidence of cancer,3 that are impacting the health and social spending. Despite regulatory issues and technical/scientific challenges,4 cancer nanomedicine – for instance miniaturized delivery systems – aiming at improving the therapeutic efficacy of currently available chemotherapeutic agents represents one of the most promising opportunities for driving a positive balance between health care spending austerity and excellent care. Very recently, the first nanomedicine – nanoparticle albumin-bound paclitaxel, named nab-PTX – received approval as the first-line treatment of advanced pancreatic cancer in combination with gemcitabine.5,6
Gold nanoparticles (AuNPs) are attracting considerable interest as viable materials for cancer nanomedicine.7,8 Aurimune (CYT-6091)9 is the most famous example of gold nano-enabled product currently used in clinical settings for cancer treatment. It consists of PEGylated (polyethylene glycol) AuNPs that safely drive the delivery of tumor necrosis factor-alpha, a potent vascular disruptive agent, to tumor site. Phase-I clinical trial of Aurimune has provided encouraging data on its safety and efficient accumulation to tumor site.10 Phase II clinical trials have been announced (http://www.cytimmune.com/user/register#pipeline).11 Several other gold-chemotherapy agents, such as Auroshell12,13 and Aurimune, are under clinical trials or seeking approval.9,10,12–14 Noteworthy, at the beginning of 2013, the international pharmaceutical company AstraZeneca in partnership with CytImmune focused on developing a cancer nanomedicine based on AuNPs.15
The successful application of AuNPs as tools for cancer treatment is mainly associated to their unique physicochemical properties and acceptable biocompatibility.16,17 The chemical properties of AuNPs surface are among the many advantages of AuNPs over other organic and inorganic nano-counterparts. The functionalization of AuNPs surface is in fact easy and highly controllable; thus, the surface chemistry and hydrodynamic diameter of AuNPs, as well as their pharmacokinetics and biodistribution, can be appropriately tailored through a safe-by-design approach.11,16,18,19 The use of biomolecules to tune the surface properties and assembly of AuNPs is also a very attractive approach that has received considerable attention. For instance, biomolecule- and/or biopolymer-conjugated AuNPs are widely used for biomarkers’ detection,20 delivery systems,8 and theranostics21 in medicine/pharmaceutical fields, as well as components of cosmetic products.22 Similarly, the safety profile of AuNPs can be finely tuned by modifying the size and/or composition of the gold nanocarrier. Studies on AuNPs showed that these nanomaterials do not accumulate in the liver and do not elicit long-term hepatic dysfunction in animal models.23,24 Data on the clearance of PEGylated gold nanomaterials also showed that once accumulated, gold nanocarriers were gradually cleared from the body.24 In addition, as recently demonstrated by some of the authors of this study,16 gold nanocarriers can be degraded within the cells. Finally, gold nanomaterials have enormous potential as multimodal agents. AuNPs are in fact excellent labels for real-time in vivo imaging and/or probes for photothermal therapy.
Currently, despite the broad interest and efforts surrounding gold-based nanomedicines, their clinical translation rate does not comply with predictive market studies. This is indeed linked to the technical challenges associated with the synthesis and formulation of gold nanomedicine. In the past decades, many synthetic strategies have been developed to prepare colloidal AuNPs in organic or aqueous solvent.7,25 One of the most common methods employed for the synthesis of gold nanomaterials involves the use of cetyl-tetra ammonium bromide, a cationic surfactant.26,27 In parallel to cetyl-tetra ammonium bromide, a variety of stabilizers have been employed for the synthesis of AuNPs to date.17,27–29 Stabilizers can be usefully exploited to prevent particles aggregation while tuning the functional properties of the nanomaterial produced. Nevertheless, most of these stabilizers are toxic, which is a matter of concern for clinical applications and regulatory requirements. Removal of excess stabilizer causes, on the other side, unwanted aggregation of the particles, thus negatively influencing the stability and bioavailability of the nanomedicines synthesized. Recently, some authors reported a one-step synthesis approach to prepare polymer-modified AuNPs using dicarboxylic polyethylene glycol (PEG) as stabilizer.30 As a significant development of such study, in this work, we report a robust strategy for synthesizing stable PEG-AuNPs loaded with an anticancer drug associated with dose-limiting severe side effects (doxorubicin, DOX) and decorated with an anti-Kv11.1 polyclonal antibody (anti-Kv11.1-pAb) as active targeting functionality (Figure 1). The anti-Kv11.1-pAb specifically recognizes surface biomarkers (namely human ether-à-go-go related gene 1 [hERG1] K+ channels) aberrantly expressed on the cell membrane of pancreatic ductal adenocarcinoma (PDAC) cells.31 Given that inter- and intra-tumor variability can affect the architecture of the tumor vascularization/microenvironment and, consequently, the passive targeting efficacy,32 the active targeting strategy exploited herein through anti-Kv11.1-pAb is envisaged to capitalize on the full potential benefit of the nanomedicine developed. Although it is accepted that the enhanced permeation and retention (EPR) effect aids to nanoparticles’ passive targeting of tumors, the effectiveness of such targeting strategy can be affected by several factors.33 The particularly abundant desmoplastic stroma of PDAC34,35 has been recognized as a key player in acting as a physical barrier to drug diffusion36 (from the blood vessels to the cancer cells) and as a mechanical barrier to drug perfusion37 (through blood vessels), thus hindering chemotherapy delivery to PDAC cells. In light of this, the working hypothesis behind this study focused on an active targeting strategy.
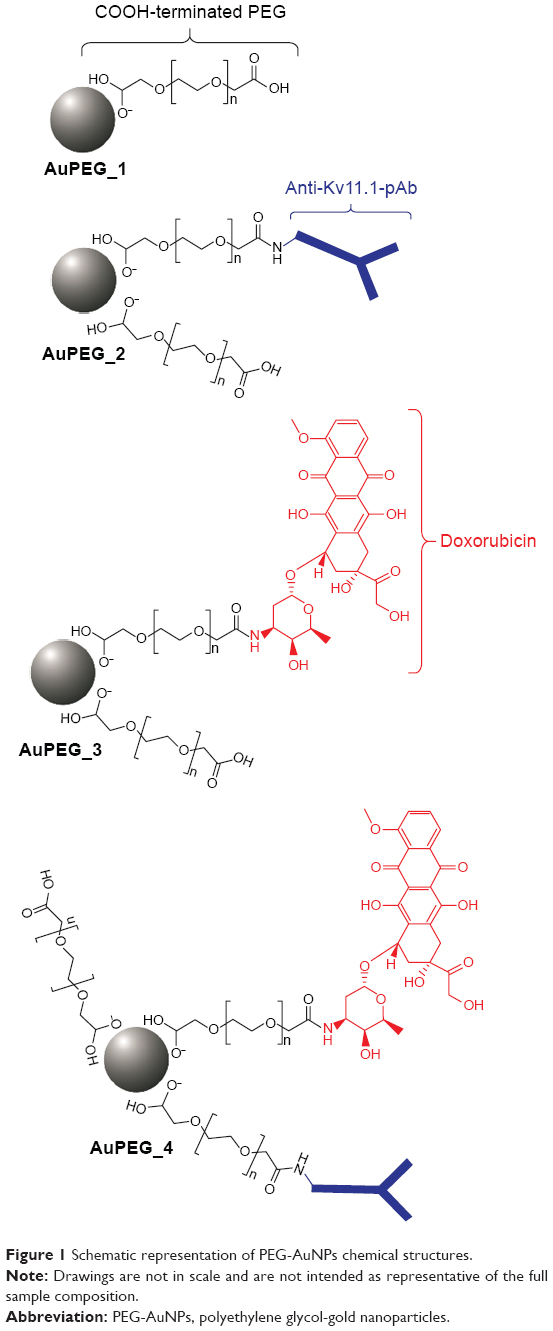 | Figure 1 Schematic representation of PEG-AuNPs chemical structures. |
Assembly and functionalization of PEG-AuNPs, as well as antibody grafting, were monitored by a combination of a wide range of spectroscopic and physicochemical techniques. In parallel, toxicity and therapeutic indexes of PEG-AuNPs were evaluated in proof-of-concept (PoC) in vitro studies by means of a high throughput screening based on flow cytometry. A high throughput screening approach, coupled to laser scanning confocal microscopy (LSCM), was also used to identify the pathways involved in the cell internalization of PEG-AuNPs. Our results demonstrated that the synthetic procedure proposed herein can be successfully used for producing a gold nanomedicine of the highest quality with potential clinical application in PDAC treatment.
Materials and methods
Materials
Tetrachloroauric acid (HAuCl4), sodium borohydride (NaBH4), N-hydroxysuccinimide (NHS), 1-(3-dimethylaminopropyl)-N′-ethylcarbodiimidehydrochloride (EDC), cysteamine (CYS), ethanol (Normapur 99%), phosphate-buffered solution (PBS), PEG-600 diacid, doxorubicin hydrochloride, and anti-Kv11.1 extracellular pAb were purchased from Sigma-Aldrich (St Louis, MO, USA). All solvents were reagent-grade and used without any further purification. Experiments were carried out at room temperature if not specified otherwise.
Synthesis of PEG-AuNPs
Synthesis of AuPEG_1
Colloids of COOH-terminated PEG-coated AuNPs (AuPEG_1) were prepared according to previously described procedure (Figure 2).38 Briefly, 20 mL of chloroauric acid (HAuCl4) aqueous solution (2.5×10⁻⁴ M) was added to 0.25 mL of dicarboxylic PEG and mixed by magnetic stirring for 10 minutes at room temperature. To this solution, 6 mL of aqueous 0.01 M NaBH4 was added at once. The color of the dispersion indeed instantly changed from yellow to red when sodium borohydride was added to a solution of gold precursor in the presence of PEG-diacid polymer, confirming the formation of AuPEG_1 in the solution. The as-prepared PEG-Au NP solution was purified by centrifugation and dialysis to remove excess of non-conjugated dicarboxylic PEG.39 Centrifugation was carried out at 15,000 rpm for 26 minutes for three times and then the supernatant was discarded. The residue was redispersed in an equivalent amount of PBS (pH=7). This was repeated twice.
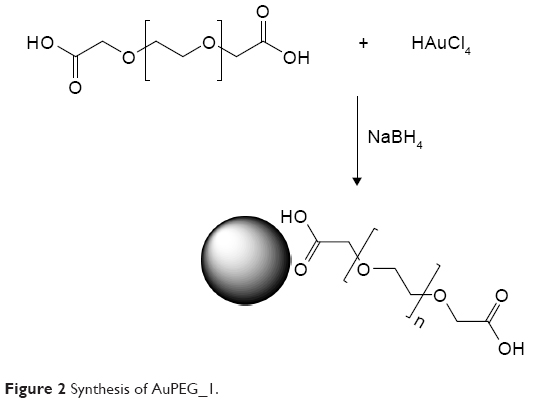 | Figure 2 Synthesis of AuPEG_1. |
Doxorubicin loading onto AuPEG_1 and formation of AuPEG_3
Conjugation of DOX to AuPEG_1 surface was carried out as from previous published work,38,40,41 using a carbodiimide-based conjugation of the carboxylic-terminated polymer and forming AuPEG_3. Briefly, 20 μL of EDC/NHS (80/20 mg ratio) aqueous solution was added to 5 mL of AuPEG_1. After 2 hours, DOX (1 mL, 1.72×10⁻⁴ M) was added and aged for 2 hours. The reaction mixture was then centrifuged three times and redispersed in PBS to remove any unbound DOX. The encapsulation efficiency (percentage of DOX bound to nanoparticles) was calculated as the difference between the initial drug content and the amount of free DOX in the filtrate after separation of the nanoparticles by ultrafiltration (Ultrafree MC centrifugal filter units, 30,000 NMWL; Merck Millipore, Darmstadt, Germany). The reaction efficiency was equal to 80%.
Anti-Kv11.1-pAb immobilization onto AuPEG_1 and AuPEG_3 surface
The binding of anti-Kv11.1-pAb onto PEG-AuNPs was performed at pH 7.4 in PBS. Briefly, 20 μL of EDC/NHS (80/20 mg ratio) aqueous solution was added to 5 mL of AuPEG_1 or AuPEG_3 dispersions. After 2 hours, 50 μL (0.1 ng/mL) of anti-Kv11.1-pAb in PBS was added to 2 mL of the reaction mixture and stirred for 2 hours at room temperature. The PEG-AuNPs thus obtained were centrifuged two times at 9,000 rpm for 30 minutes and dried under nitrogen. Figure 3 depicts the synthetic procedure for the conjugation of anti-Kv11.1-pAb onto PEG-AuNPs surface. Successful grafting of anti-Kv11.1-pAb was monitored by dynamic light scattering (Figure S1).
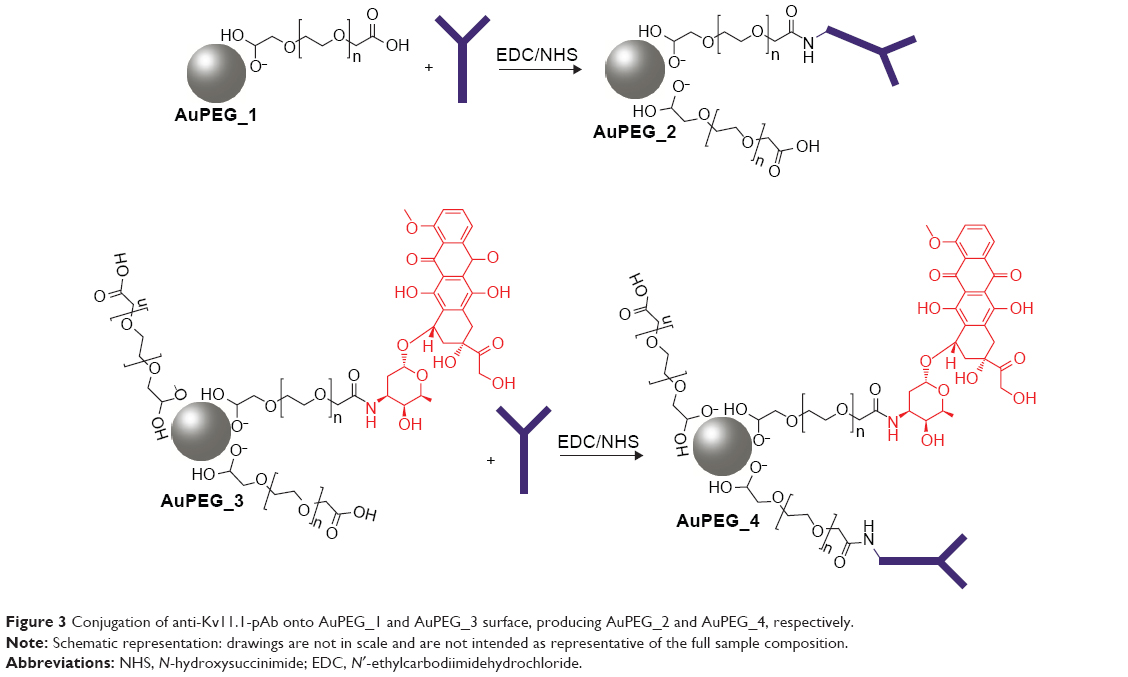 | Figure 3 Conjugation of anti-Kv11.1-pAb onto AuPEG_1 and AuPEG_3 surface, producing AuPEG_2 and AuPEG_4, respectively. |
Physicochemical characterization of PEG-AuNPs
All the measurements were performed in duplicate in order to validate the reproducibility of the synthetic procedure.
UV–vis absorption spectroscopy
Absorption spectra were recorded using a double-beam Varian Cary 500 UV–Vis spectrophotometer (Agilent, Les Ulis, France). Absorption spectra of the PEG-AuNPs were recorded water at a concentration of 10−4 M in the 350–900 nm spectral range.
X-ray photoelectron spectroscopy
Gold surfaces were used as a support for the immobilization of AuPEG_1 to verify the better orientation of antibody before DOX binding. The schematic diagram showing the chemical immobilization method is reported in Figure S2. The chemical procedure used for the surface immobilization of PEG-AuNPs, based on self-assembled monolayer of cysteamine in absolute EtOH, was previously described.30 Briefly, the freshly cleaned gold substrate was immersed in an unstirred 10 mM ethanol solution of β-mercaptoethylamine (cysteamine) at room temperature in the dark for 6 hours. The gold substrate was then washed with EtOH and milli-Q water to remove the excess of thiol. A total of 2 mL of PEG-AuNPs was suspended in 2 mL of buffer solution (PBS, pH=7), in which 0.5 mEq of EDC/NHS was added and stirred for 2 hours (preactivation). The colloidal solution was deposited on cysteamine-gold-coated surface for 12 hours at room temperature.
X-ray photoelectron spectroscopy (XPS) analysis was performed using a SPECS (Phoibos MCD 150) spectrometer (SPECS, Berlin, Germany) equipped with a monochromatized Al X-ray source (hν=1,486.6 eV) and a Phoibos 150 hemispherical energy analyzer. Pass energies of 20 eV was used for the survey scan and 10 eV for narrow scans.
X-ray diffraction
The X-ray diffraction (XRD) spectra of AuPEG_1 powder samples were recorded by means of a Siemens D500 diffractometer and a Bruker D8 diffractometer (Bruker Corporation, France) using Cu Kα radiation (1.5418 Å). This analysis was carried out at 40 kV and 100 mA; the scan step size was set at 0.0500° and the scan step time was 10 seconds. Theoretical diffraction patterns of gold and PEG components were extrapolated from the literature data for the corresponding crystal structures.
Electron microscopy
Scanning electron microscopy (SEM) images were carried out by a SEM FEG Hitachi SU-70 scanning electron microscope (Hitachi, Tokyo, Japan) with a low voltage of 1 kV and distance of 1.5–2 mm; the second electron detector was used. A total of 50 μL of colloidal solution was deposited onto a clean gold substrate and dried at room temperature for the SEM measurements.
Transmission electron microscopy (TEM) images were recorded with a JEOL JEM 1011 microscope operating (JEOL, Tokyo, Japan) at an accelerating voltage of 100 kV. TEM specimens were prepared after separating the surfactant from the metal particles by centrifugation. Typically, 1 mL of PEG-AuNPs was centrifuged for 20 minutes at a speed of 14,000 rpm. The upper part of the colorless solution was removed and the solid portion was redispersed in 1 mL of water. A total of 2 μL of this redispersed particle suspension was placed on a carbon-coated copper grid manufactured by Smethurst High-Light Ltd (Elektron Technology, Cambridge, UK) and marketed exclusively by Agar Scientific (Essex, UK) and dried at room temperature.
Polarization modulation-infrared reflection-adsorption spectroscopy
Polarization modulation-infrared reflection-adsorption spectroscopy (PM-IRRAS) spectra were acquired by a Thermo Nexus spectrometer (Les Ulis, France). Self-assembled monolayer of cysteamine followed by PEG-AuNPs grafting, as described in the previous sections, was used to immobilize AuPEG_2 and AuPEG_4 on gold surfaces. The external beam was focused on the sample with a mirror, at an optimal incident angle of 80°. ZnSe grid polarizer and ZnSe photoelastic modulator improve the incident beam between p- and s-polarizations (HINDS Instruments; Thermo Fischer Scientific Inc., Waltham, MA, USA), PEM 90, modulation frequency =37 kHz, were placed prior to the sample. The light reflected at the sample was then focused onto a nitrogen-cooled Mercury-Cadmium-Telluride detector. The presented spectra result from the sum of 128 scans recorded with an 8 cm−1 resolution.
Zeta potential measurements
The zeta potential of PEG-AuNPs dispersed in water was measured using the electrophoretic mode of a Zetasizer NANOZS (Malvern Instruments Ltd, Malvern, UK).
Nanoparticle tracking analysis
PEG-AuNPs average hydrodynamic diameters in complex dispersal media were characterized using nanoparticle tracking analysis (NTA) developed by NanoSight (Malvern Instruments Ltd). This equipment utilizes the properties of light scattering and Brownian motion to obtain particle size distributions of samples in liquid suspension.42 PEG-AuNPs were diluted in PBS and fetal bovine serum (FBS), as well as in complete cell culture medium (ie, Dulbecco’s Modified Eagle’s Medium [DMEM] supplemented with 10% FBS). The latter was included in order to evaluate potential interactions between PEG-AuNPs and the environment used in in vitro PoC studies. NTA was conducted at time 0 (directly after dispersion in the complex media) and following 24 hours of incubation at 37°C. NTA was carried out by means of a NS500 system equipped with a 405 nm laser, with NTA version 3.0. Six by sixty seconds videos were recorded at an NP concentration sufficient to obtain a minimum of 200 completed tracks per video for statistical significance. NTA data are reported as mode ± standard deviation.
Cell culture
PANC-1 cells, a human pancreatic carcinoma cell line aberrantly expressing hERG1 K+ channel,43 were obtained from the American Tissue Culture Collection (ATCC). No ethical approval was needed for these experiments as the cell line used is commercially available and was not originated in the lab from human tissue samples. PANC-1 cells were cultured in DMEM (Gibco, Bio-Sciences Ltd, Ireland) supplemented with 10% FBS (Sigma-Aldrich) in a humidified atmosphere at 37°C and 5% CO2. Cells were seeded at a density of 8×10⁴ cells/mL (4×10⁴ cells/well; 500 μL/well) in a 24-well plate (growth area =1.9 cm2; Nunc®; Fisher Scientific, Dublin, Ireland) or in four-well glass slides (growth area =1.7 cm2; BD Biosciences, Franklin Lakes, NJ, USA). Cells were incubated for 24 h at 37°C and 5% CO2 to allow the cells to adhere to the substrate. Seeding concentrations of 3.5×10⁴ cells/mL (7×10³ cells/well; 200 μL/well) and 105 cells/mL (2×10⁵ cells/well; 2 mL/well) were used when utilizing 96-well plates (growth area =0.32 cm2; Nunc; Fisher Scientific) or six-well plates (growth area =9.5 cm2; Nunc; Fisher Scientific) in order to keep the cell density consistent among experiments.
LC50 and EC50 determination
PANC-1 cells were exposed to a series of PEG-AuNPs dilutions in complete media (concentrations ranging from 0 to 2.5×10⁻⁴ M; 500 μL/well) or DOX (concentrations ranging from 0 to 8 μM) for 24 hours in 24-well plates. Untreated cells (negative control) and cells exposed to 70% acetone for 30 minutes (positive control), as well as cells treated with diacid PEG (67.1 μg/mL) for 24 hours, were also included in the experimental design. After 24-hours exposure to PEG-AuNPs, PANC-1 cells were washed with PBS, detached from the wells using 200 μL/well TrypLE™ Select (Gibco, Bio-sciences), and transferred to Eppendorf tubes containing 600 μL media. Cell counting was then carried out on the cell suspensions by means of BD Accuri® C6 flow cytometer (Becton Dickinson Biosciences, Oxford, UK), keeping constant the counting time among samples. Cell population analysis was performed as per the supplier’s protocol.44 Briefly, the cells were visualized using the FSC-A versus FSC-H scatter plot and a gate was applied (P1) to exclude debris at lower scatter intensities and cell aggregates via doublet discrimination. A minimum of 10,000 events was collected in the (P1) gate for the negative control. Measurements for each sample were carried out in triplicate and are presented as average ± standard deviation. Dose–response curves were fitted to such data, by applying a dose–response equation for inhibition (normalized response) (Prism; Graph-Pad Software Inc., La Jolla, CA, USA). Since the logarithmic function of 0 is undefined, the zero concentration (negative control) was approximated to 10−8 M for PEG-AuNPs and 0.06 μM for DOX, that is, approximately two log units below the lowest “real” log(x) value. Data were normalized to percent of maximal response based on the negative control (corresponding to the 100% value). The minimum y value, corresponding to the 0% value, corresponded to the positive control reading. Half-maximal lethal concentration (LC50) data for PEG-AuNPs and half-maximal effective concentration (EC50) of DOX were extrapolated from the curves thus obtained.
Cell cycle analysis
PANC-1 cells cultured in 24-well plates were exposed to PEG-AuNPs for 24 hours at two concentrations that resulted to be sub-cytotoxic for AuPEG_1, as determined by LC50 determination experiments. In detail, the concentrations tested were as follows: 1.3×10⁻⁵ and 1.9×10⁻⁵ M for AuPEG_1; 1.4×10⁻⁶ and 2×10⁻⁶ M for AuPEG_2; 2.5×10⁻⁸ and 4×10⁻⁸ M for AuPEG_3 and AuPEG_4. Untreated cells (negative control) and cells exposed to 1.5 μM DOX (positive control) were also included in the experimental design. Possible cell cycle effects caused by exposure to the DOX loaded onto AuPEG_3 and AuPEG_4, and/or by the AuPEG_1 and AuPEG_2 themselves, were evaluated using the BD Cycletest™ Plus DNA Reagent Kit (Becton Dickinson Biosciences). Briefly, after 24-hours exposure, cells were harvested using TrypLE™ Select (200 μL/well), transferred to Eppendorf tubes containing 600 μL media, and centrifuged at 4,000 rpm for 5 minutes. Supernatants were removed after centrifugation and 1 mL of lysis buffer was added, followed by vortexing of each sample (this wash step was completed twice). Cell cycle assay was then performed according to the manufacturer’s protocol. Stained cells were analyzed using BD Accuri® C6 flow cytometer (Becton Dickinson Biosciences). Briefly, the stained nuclei were visualized using the SSC-H versus FSC-H scatter plot and a gate was applied (P1) to exclude debris at lower scatter intensities. Aggregate exclusion gating (P2 in P1) via doublet discrimination was then performed on the P1 population using the FL2-H versus FL2-A scatter plot. A minimum of 10,000 events was collected in the (P2 in P1) gate and visualized on the FL2-A histogram. Analysis of cell cycle stage for G0/G1, S, and G2/M phase was made by manual gating on the FL2-A histogram. Representative FL2-A histograms are shown as percentage (%) cell population in (P2 in P1). Mean values are also reported as average ± standard deviation (ntest=2) in Table S1.
Drug delivery – mechanism
Cellular internalization of AuPEG_3 and AuPEG_4 and colocalization into lysosomes
PANC-1 cells cultured on four-well glass slides were exposed to AuPEG_3 (6.5×10⁻⁸ M) or to AuPEG_4 (4.25×10⁻⁸ M) for 24 hours. PANC-1 cells were then washed with prewarmed PBS, fixed with 3.7% PFA for 10 minutes at room temperature, and permeabilized with 0.1% TritonX-100 for 5 minutes. After incubation in blocking buffer (1% bovine serum albumin) for 1 hour at room temperature, specimens were stained for glycosylated lysosomal-associated membrane protein-1 (LAMP-1) with LAMP-1 (D2D11) XP® Rabbit pAb (1:200) (Cell Signalling Technology Inc., Danvers, MA, USA) overnight at 4°C. Cells were then washed with PBS and incubated with anti-rabbit IgG (H+L), F(ab′)2 fragment (Alexa Fluor 488® Conjugate) (1:1,000) (Cell Signalling Technology Inc.) and Hoechst 33342 (Invitrogen, Bio-sciences, Dublin, Ireland) for nuclei counterstain for 2 hours in the dark at room temperature. After washing with PBS, specimens were mounted in transparent mounting medium (VECTASHIELD; Vector Laboratories Inc., Burlingame, CA, USA) prior to LSCM analysis by a ZEISS LSM 510 Meta confocal microscope equipped with a Zeiss Zen software (Carl Zeiss, Oberkochen, Germany). DOX delivery and release was evaluated by monitoring the red fluorescence within the cells’ body,45 while PEG-AuNPs were imaged in reflectance mode at λexc=561 nm as previously described.16 In reflectance mode, the scattered light is collected under single laser wavelength excitation using a confocal microscope. The high scattering cross-sections of AuNPs,46–51 together with their superior photostability as compared to organic dyes, make their imaging extremely easy and accurate.52 LSCM imaging was used as a qualitative technique. The colocalization of LAMP-1 expression and PEG-AuNPs was evaluated by using the colocalization function of the ZEN software (Carl Zeiss), according to the manufacturer’s guidelines.53 Briefly, colocalization analysis was performed on a pixel-by-pixel basis. Every pixel in the image was plotted in a scatter diagram based on its intensity level, where LAMP-1 intensity was selected on the x-axis and PEG-AuNPs reflectance intensity was on the y-axis. Crosshairs were placed on the scatter diagram so that only pixels with intensity levels above 50 au in both channels were considered to be colocalized. To set the crosshairs, negative (untreated) controls were imaged with the same microscope settings as the cells exposed to PEG-AuNPs, to ensure that any colocalized pixels were due to significant intensity levels of both channels and not from changes in the sample preparation or acquisition settings. Images masked on colocalized pixels are reported.
Cell lysis and Western immunoblotting of LAMP-1 protein expression
PANC-1 cells cultured on six-well plates were exposed to AuPEG_3 (6.5×10⁻⁸ M) or AuPEG_4 (4.25×10⁻⁸ M) for 24 hours. PANC-1 cells were then washed with prewarmed PBS and lyzed, followed by the addition of 200 μL/well of RIPA lysis buffer system (Santa Cruz Biotechnology Inc., Dallas, USA) and incubated for 30 minutes on ice. Lysis solution was prepared as per supplier’s instructions. Cells were scraped from wells, transferred to Eppendorf tubes, and centrifuged at 13,000 rpm for 10 minutes at 4°C. Protein determination of each lysate sample was determined by Pierce BCA Protein Assay Kit (Product no 23227; Thermo Scientific) as per supplier’s protocol. The required amount of lysate to load 20 μg of protein was transferred to a fresh Eppendorf tube and incubated with 1 mL of ice-cold acetone for 30 minutes on ice for protein precipitation. Samples were then centrifuged at 13,000 rpm for 10 minutes at 4°C. After the removal of the supernatant, protein pellets were boiled in 2× Laemmli sample buffer for 5 minutes and resolved on NuPAGE 4%–12% Bis–Tris Gel (Novex®; Life Technologies, Fisher Scientific, Dublin, Ireland). Molecular weight markers and separated proteins were electrophoretically transferred to polyvinylidene difluoride membranes by wet transfer for 30 minutes at 500 mAmh. Polyvinylidene difluoride membranes were blocked in 5% nonfat dry milk in PBST (0.1% Tween 20 in PBS) for 1 hour at room temperature with gentle agitation. Three wash steps (5 minutes each) were carried out before incubation with a primary antibody against nonglycosylated and glycosylated LAMP-1 protein (LAMP-1 [C54H11] rabbit mAb, Cell Signalling, Brennan & Company, Dublin, Ireland) diluted in 5% bovine serum albumin in PBST (1:1,000). Incubation was carried out overnight at 4°C with gentle agitation. The membrane was then washed three times and incubated with anti-rabbit IgG HRP-linked secondary antibody (Cell Signalling, Brennan & Company) in blocking buffer (1:2,000) for 1 hour at room temperature. After triple washing in PBST, the selected bands were developed using SuperSignal® West Pico Chemiluminescent Substrate (Thermo Scientific). Exposure to Kodak light-sensitive film allowed the bands located at 40 kDa (nonglycosylated LAMP-1) and 100 kDa (glycosylated LAMP-1) to be visualized. Results shown are representative of two independent experiments (ntests=2 and nreplicates=3).
Endocytosis pathway
To determine by which transport route(s) AuPEG_3 and AuPEG_4 were internalized into cells, PANC-1 cells were seeded in 96-well plates and exposed to PEG-AuNPs in the presence of 1) an inhibitor of the cellular energy-dependent mechanisms of uptake (0.1% sodium azide [NaN3]; 1.5 mM; 3 hours pretreatment), 2) an inhibitor of the receptor-mediated endocytosis (RME), that is, cells cultured at 4°C, 3) inhibitors of clathrin-dependent (Pitstop® 2; 12 μM) or caveolae-dependent (Filipin III; 5 μg/mL; 30 minutes pretreatment) endocytosis, or 4) an inhibitor of the protein transport from the endoplasmic reticulum to the Golgi apparatus (Brefeldin A; 500 ng/mL), thus hindering the maturation of the hERG1 channels (Figure 4). With exception of the experiments at 4°C, where cells were exposed to PEG-AuNPs for 4 hours, AuPEG_3 and AuPEG_4 were incubated with cells for 6 hours. Since AuPEG_3 and AuPEG_4 effect on the cell count was shown to be time-dependent (Figure S3), a concentration equal to two times the LC50 (corresponding to 2.6×10⁻⁷ M for AuPEG_3 and 1.7×10⁻⁷ M for AuPEG_4) was tested to ensure that a significant decrease in cell count would be detectable in the absence of inhibitors after 6 hours. Negative controls (NT), consisting of PANC-1 cells exposed to supplemented cell medium or the inhibitors alone, were included in the experimental design. Following exposure, PANC-1 cells were washed with prewarmed PBS, fixed with 3.7% paraformaldehyde (10 minutes, room temperature) and stained with Hoechst 33342 for nuclei (Invitrogen, Bio-sciences) for 30 minutes at room temperature in the dark. After washing with PBS, cells were counted by means of high-content screening and analysis (HCSA) based on the analysis by In Cell Analyzer 1000, as previously described.16 Data are reported as average (ntests=3 and nreplicates=3) ± standard error of the mean and normalized on the corresponding NT. This normalization was applied to highlight how – when the internalization pathway was inhibited – the therapeutic effect of PEG-AuNPs (detected as a drop in cell viability) was not detectable.
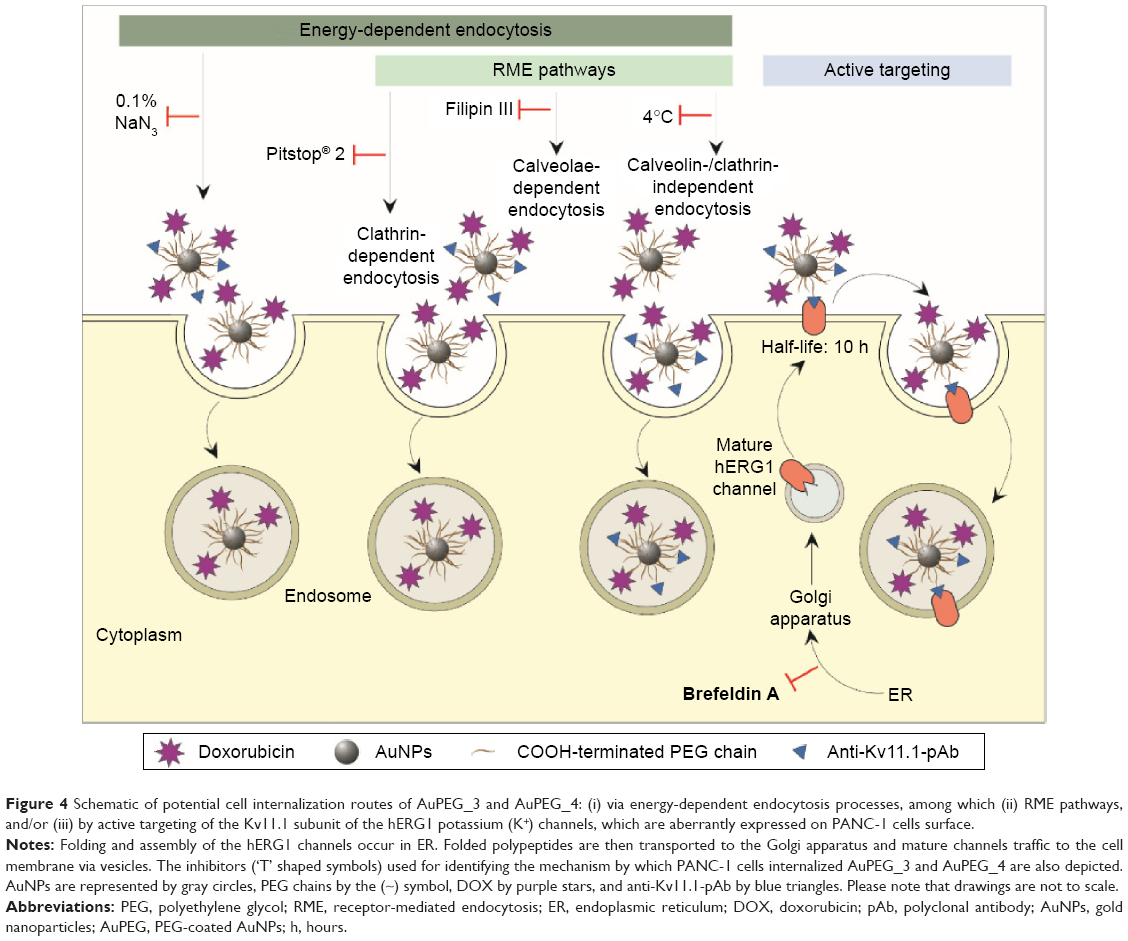 | Figure 4 Schematic of potential cell internalization routes of AuPEG_3 and AuPEG_4: (i) via energy-dependent endocytosis processes, among which (ii) RME pathways, and/or (iii) by active targeting of the Kv11.1 subunit of the hERG1 potassium (K+) channels, which are aberrantly expressed on PANC-1 cells surface. |
Results
In this study, the synthesis and physicochemical characterization of PEG-AuNPs (AuPEG_1) loaded with DOX (AuPEG_3) and targeted with anti-Kv11.1-pAb (AuPEG_4) were carried out. Targeted PEG-AuNPs with no drug payload (AuPEG_2) were also prepared for comparison.
In vitro PoC data were acquired at the second stage of the study to gain an insight into the toxicity (LC50) and therapeutic (EC50) indexes of PEG-AuNPs as nanomedicine with application in the PDAC treatment. An in-depth investigation of the endocytosis pathway driving AuPEG_3/AuPEG_4 internalization and drug release was also carried out.
Synthesis of PEG-AuNPs
Formation of AuPEG_1 and AuPEG_3
AuPEG_1 and AuPEG_3 were synthesized as described in the “Materials and methods” section.
Active targeting
AuPEG_1 and AuPEG_3 were used as a support for the conjugation of the targeting moiety (anti-Kv11.1-pAb). The anti-Kv11.1-pAb was selected as it specifically recognizes the Kv11.1 protein, which is an essential subunit of the potassium ion channel encoded by the human hERG1. hERG1 K+ channels are overexpressed in several types of human cancers,31,54 including PDAC.43 Anti-Kv11.1-pAb molecules were immobilized on the surface of activated nanoparticles through the formation of amide links between the COOH groups decorating the surface of the PEG-AuNPs and the NH2 groups of the pAb (Figure 3).
Physicochemical characterization of PEG-AuNPs
UV–vis absorption spectroscopy
The interaction between anti-Kv11.1-pAb and AuPEG_1 was monitored by detecting changes in the localized surface plasmon (LSP) band typical of the UV–Vis absorption spectra of PEG-AuNPs. Figure 5A displays the LSP band of PEG-AuNPs before (AuPEG_1) and after (AuPEG_2) immobilization of the anti-Kv11.1-pAb. AuPEG_1 (Figure 5A, black line) showed an LSP band centered at ~520 nm, typical of AuNPs.27,40 This indeed demonstrated that AuNPs were formed following the reduction of AuCl4−.40 After immobilization of anti-Kv11.1-pAb onto AuPEG_1 (Figure 5A, red line), the resulting solution was colorless and was characterized by a broad LSP peak at 812 nm, which could be attributed to the change of localized refractive index of PEG-AuNPs. It is commonly accepted that the peak intensity and position of the LSP band are dependent on the size, agglomeration, and shape of AuNPs.55 The significant red-shift in the LSP position with peak broadening in the AuPEG_2 spectra suggested a linear increase in particle size consequent with the modification of the nanoparticles surface.55,56 Based on the UV–Vis spectrum of AuPEG_2, we suggest that such increase could be associated to the successful functionalization of the AuNPs surface with anti-Kv11.1-pAb and the subsequent AuNPs aggregation associated to the formation of classical van der Waals inter-protein interactions.57
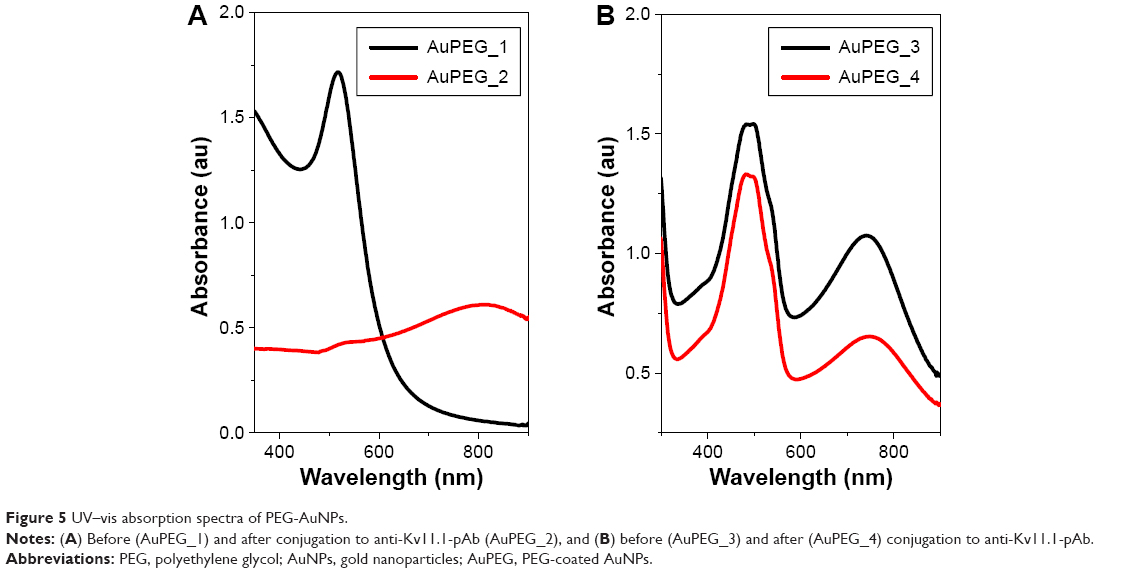 | Figure 5 UV–vis absorption spectra of PEG-AuNPs. |
The UV–Vis absorption spectrum of AuPEG_3 (Figure 5B, black line) displayed an intense band at 483 nm and two small peaks at 470 and 533 nm, in good agreement with the optical characteristics of the molecular DOX.58 A strong resonance band at around 748 nm was also detected, corresponding to longitudinal plasmon oscillation.59 After the conjugation of AuPEG_3 to anti-Kv11.1-pAb (AuPEG_4), the resulting solution was colorless, with a decrease in the UV–Vis spectrum intensity (Figure 5B, red line) and a red-shift of around 20 nm (from 748 to 761 nm) of the LSP band. This phenomenon could be attributed to the change of localized refractive index near the nanoparticles surface, indicating that the anti-Kv11.1-pAb was successfully conjugated to the PEG-AuNPs surface.
X-ray photoelectron spectroscopy
XPS analysis clearly evidenced the presence of PEG molecules onto PEG-AuNPs surface (Figure S4), as an intense contribution of the C1s peak at 286 eV, characteristic of carbon in single C–O bonds, was detected. The small peak, at 289 eV, was associated to the carbon atoms in the terminal COOH groups of the conjugated PEG molecules.60 The single O1s peak, at 533 eV, could be correlated to oxygen in the C–O–C bonds typical of the PEG polymer. Finally, the strong decrease in the nitrogen peak was due to the PEG layer formation. The full screening of the sulfur contribution also suggested the formation of a PEG layer having an average thickness of the order of 10 nm. Peaks were assigned based on previous calibration, before and after PEGylation.
X-ray diffraction
The crystallinity of AuPEG_1 was confirmed by XRD (Figure S5). The XRD pattern of AuPEG_1 was associated to a crystal structure with a face-centered cubic nature.
Electron microscopy
SEM images (Figure S6) demonstrated that AuPEG_1 had well-defined and homogeneous shape and size.
Representative TEM images of the colloidal solutions characterized by absorption spectroscopy are shown in Figure 6. PEG-AuNPs were well dispersed in size and shape, with an average size of 6.7±0.5 nm for AuPEG_1 and equal to 12.5±0.5 nm for AuPEG_3, as estimated from 350 particles on a given TEM image. However, some of the particles displayed a somewhat faceted shape as a result of their nanocrystalline nature.
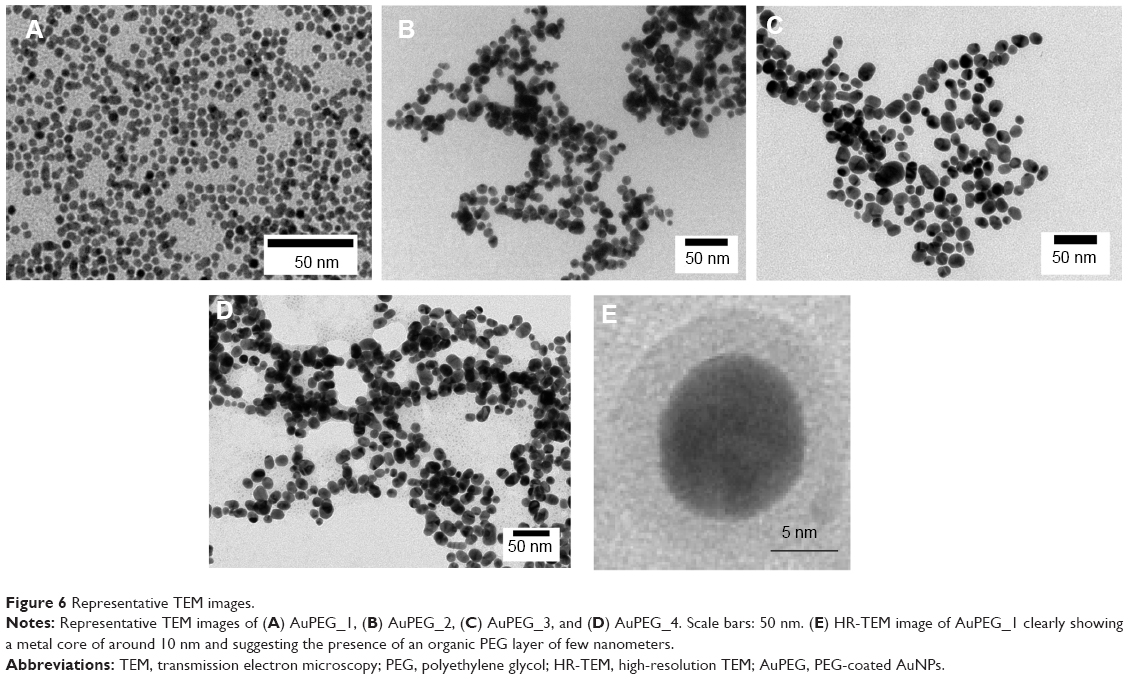 | Figure 6 Representative TEM images. |
Following anti-Kv11.1-pAb conjugation, AuPEG_2 formed highly clustered aggregates (Figure 6B), probably due to electrostatic and steric forces among the pAb proteins linked to the PEG-chain grafted onto the nanoparticles’ surface, thus validating the data obtained by UV–Vis spectroscopy. Similarly, AuPEG_4 (Figure 6D) showed characteristic linear chain likely due to the preferential location of PEG or antibody molecules onto the particles, with a probable steric arrangement of anti-Kv11.1-pAb. It should be noted, however, that agglomeration could also be associated to artifacts arising during the preparation of TEM specimens, for example, due to solvent evaporation. The morphology of the anti-Kv11.1-pAb-targeted PEG-AuNPs (AuPEG_2 and AuPEG_4) (Figure 6B and D respectively), as revealed by TEM, was spherical and well defined with AuNPs of homogeneous shape.
Polarization modulation-infrared reflection-adsorption spectroscopy
PM-IRRAS analysis was performed on PEG-AuNPs immobilized on a gold surface. The PM-IRRAS spectra of AuPEG_2 and AuPEG_4 (Figure 7) showed the characteristic vibration band of the PEG molecules (C–O–C) at 1,100 cm−1 together with the νC–O/νCOO stretching modes of the carboxylate groups at 1,415 cm−1. The νC=O stretching mode of the carboxylic group expected at 1,725 cm−1 and a band at 1,247 cm−1 were attributed to C–OH of DOX. The intense amide bands at 1,650 and 1,550 cm−1 confirmed the successful grafting of pAb to the PEG-AuNPs surface. In particular, PM-IRRAS spectra of PEG-AuNPs interacting with anti-Kv11-pAb (Figure 7B) showed a shift of the amide bond bands, probably due to a rearrangement of the system in the presence of the antibody. Moreover, AuPEG_4 showed a relevant enhancement of the intensity of the amide bond bands with respect to AuPEG_2 spectrum (Figure 7A). The area of the amide bond bands was integrated in both cases and was found equal to 7.6 au and 20.8 au for AuPEG_2 and AuPEG_4, respectively. These results suggested that DOX loaded onto PEG-AuNPs played a key role in the steric arrangement of anti-Kv11.1-pAb.
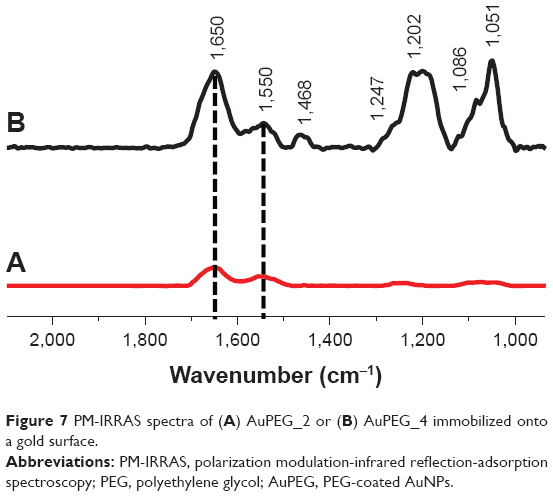 | Figure 7 PM-IRRAS spectra of (A) AuPEG_2 or (B) AuPEG_4 immobilized onto a gold surface. |
Zeta potential
The zeta potential of AuPEG_1 was found to be equal to −13.8±2.0 mV, suggesting the presence of free negatively charged carboxylic acid functions on the surface of the nanoparticles. A complete list of the zeta potential of all PEG-AuNPs used in this study is reported in Table S2. Notably, all PEG-AuNPs samples were colloidally stable.
Nanoparticle tracking analysis
With the exception of PEG-AuNPs dispersed in FBS at time 0 hour, NTA showed a linear relationship between the increase in PEG-AuNPs hydrodynamic diameters and the amount of functionalities added onto the PEG-AuNPs surface, with an increase in hydrodynamic diameter developing from nonfunctionalized AuPEG_1 to targeted, DOX-loaded AuPEG_4 (Table 1 and Figure S7). However, this trend was not detected in FBS at time 0 hour, probably due the formation of a “proteincorona” around nonfunctionalized PEG-AuNPs. Here it is thought that proteins present in FBS absorb onto and dissociate randomly from the surface of the AuPEG_1 nanoparticle (“protein corona” formation), shielding the differences in size among functionalized and nonfunctionalized AuNPs. NTA measurements for dispersing media (ie, PBS, FBS, or DMEM supplemented with 10% FBS) without PEG-AuNPs demonstrated that these did not interfere with the analysis of PEG-AuNPs dispersions (Figure S8).
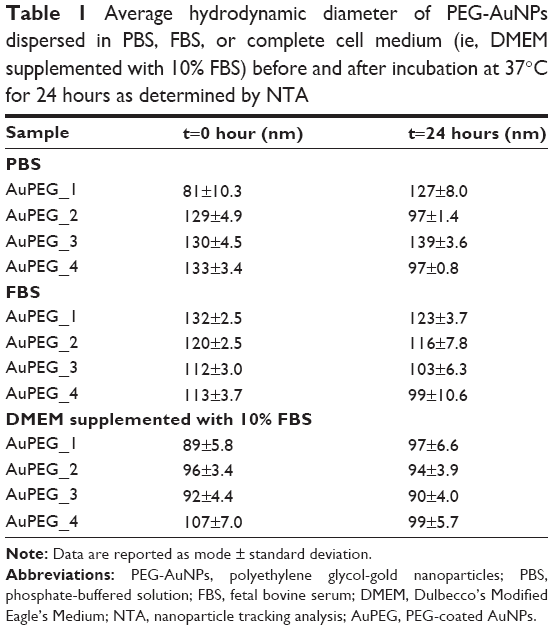 | Table 1 Average hydrodynamic diameter of PEG-AuNPs dispersed in PBS, FBS, or complete cell medium (ie, DMEM supplemented with 10% FBS) before and after incubation at 37°C for 24 hours as determined by NTA |
In general, no significant aggregation was evidenced over time. As regards the changes in hydrodynamic diameter over time in PBS, a number of possible explanations exist. In the case of AuPEG_1, it is most likely due to the aggregation of the particles over time in the high salt-containing PBS solution. The exact reason for the apparent reduction in AuPEG_2 and AuPEG_4 hydrodynamic diameter over time in PBS is, however, unknown. Here we suggest that ions in the PBS may be coordinating to the antibody over time, creating areas where the electrostatic charges cause the formation of slipping planes and subsequent nanoparticle repulsion and the observed decrease in hydrodynamic diameter.61 On the contrary, changes in hydrodynamic diameter detected over time in FBS were deemed to be nonsignificant (Figure S7).
Interestingly, PEG-AuNPs suspensions in complete cell media proved to be the most stable after 24 hours of incubation at 37°C compared to the suspensions in PBS or FBS (Figure S7). In complete cell medium, a hydrodynamic diameter ranging between ~90 and 110 nm characterized PEG-AuNPs.
LC50 and EC50 determination
Flow cytometry was used to evaluate changes in the percentage (%) of live cells following 24 hours of exposure to various concentrations of PEG-AuNPs (ranging from 0 to 2.5×10⁻⁴ M). Human PDAC cells (PANC-1 cell line) were used in this study.
The dose–response curves obtained (Figure 8A and Figure S9A–D) clearly show that the LC50 values decreased when PEG-AuNPs were loaded with DOX (LC50=1.0×10⁻⁴ M for AuPEG_1; LC50=1.3×10⁻⁷ M for AuPEG_3). Such decrease in LC50 was even more evident when PEG-AuNPs were actively targeted with anti-Kv11.1-pAb (LC50=8.4×10⁻⁸ M approximately for AuPEG_4) (Figure 8C and Figure S9E–H). Based on UV–Vis optical studies (Figure S10), it was estimated that 10 μg of DOX was loaded onto 5×10⁻⁸ mol of AuPEG_3, and 10.3 μg of DOX were present instead in 5×10⁻⁸ mol of AuPEG_4. By extrapolating the amount of DOX present in the PEG-AuNPs samples at a concentration equal to their LC50, it was estimated that the EC50 for DOX delivered by AuPEG_3 and AuPEG_4 was equal to ~45 and 29 nM, respectively.
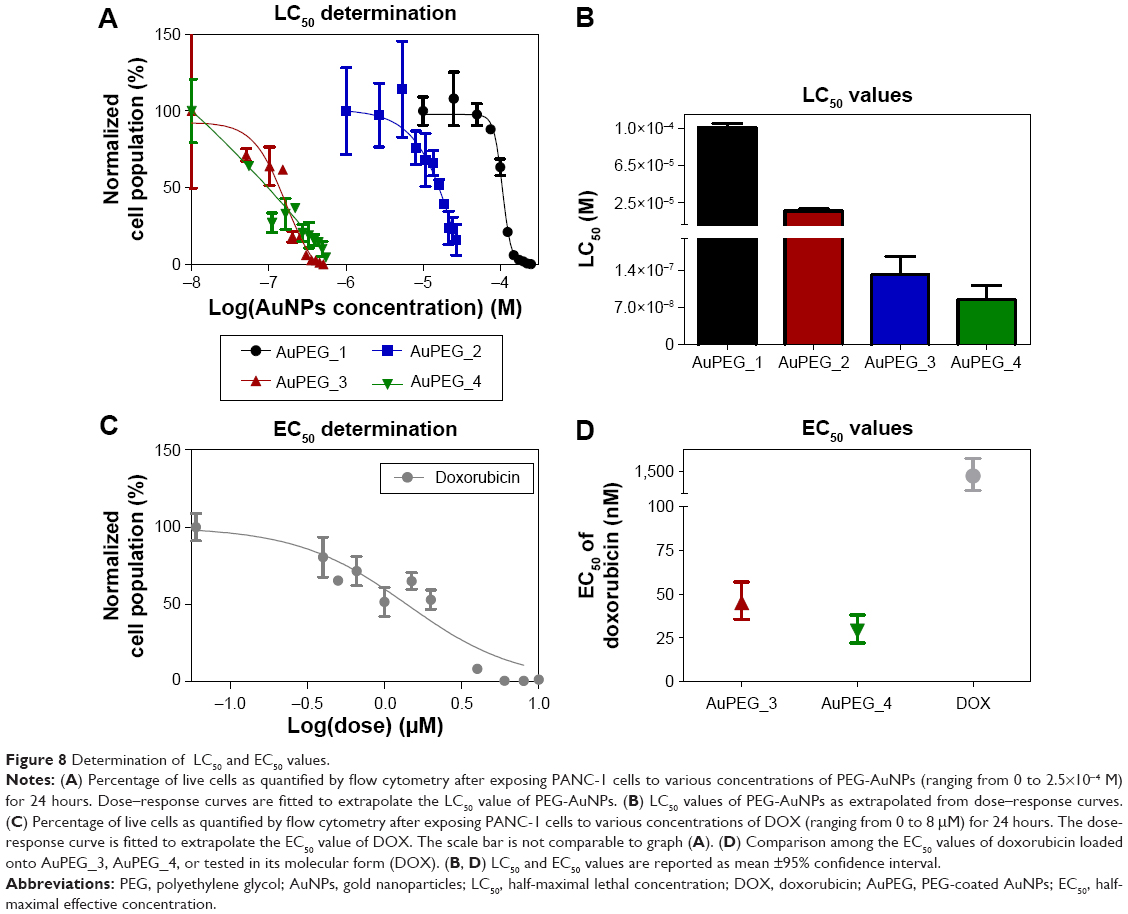 | Figure 8 Determination of LC50 and EC50 values. |
As a proof-of-principle experiment, molecular DOX was tested (Figure 8B) and its EC50 (equal to 1.4±0.7 μM) was compared to that of DOX delivered by AuPEG_3 and AuPEG_4. Such comparison (Figure 8D) showed that the PEG-AuNPs increased the chemotherapeutic effect of DOX against pancreatic cancer cells more than 30 times, while the in vitro anti-tumor efficacy of DOX was 48 times higher when PEG-AuNPs were actively targeted with anti-Kv11.1-pAb.
Notably, the COOH-terminated PEG constituting the organic component of PEG-AuNPs did not show any significant cytotoxicity at concentration of 67.1 μg/mL after 24 hours of exposure (Figure S11). Since the amount of diacid PEG600 loaded onto AuPEG_1 was equal to 9 μg/mL, the control concentration tested for COOH-terminated PEG was more than seven times higher than that loaded on PEG-AuNPs, thus demonstrating that such organic coating did not influence the toxic impact of the nanocarrier itself.
Cell cycle
Flow cytometry was used to evaluate whether the in vitro activity of the DOX toward PDAC cells was maintained when delivered by PEG-AuNPs (Figure 9). Doxorubicin is an anticancer drug that interacts with DNA, causing a G2-/M-phase cell-cycle arrest.62 Exposure of PANC-1 cells to AuPEG_3 clearly showed a shift in the cell population toward G2/M phase at both the concentrations tested. These results demonstrated that cell death triggered by AuPEG_3 was indeed linked to DOX activity. This was correlated with a null or negligible change in the cell population composition when PANC-1 cells were exposed to AuPEG_1 and AuPEG_2. Interestingly, exposure to AuPEG_4 was associated with a further small increase in the number of cells entering G2/M phase. Indeed, these data supported the EC50 determination findings and evidenced the therapeutic efficacy of the DOX delivered by AuPEG_3 and AuPEG_4.
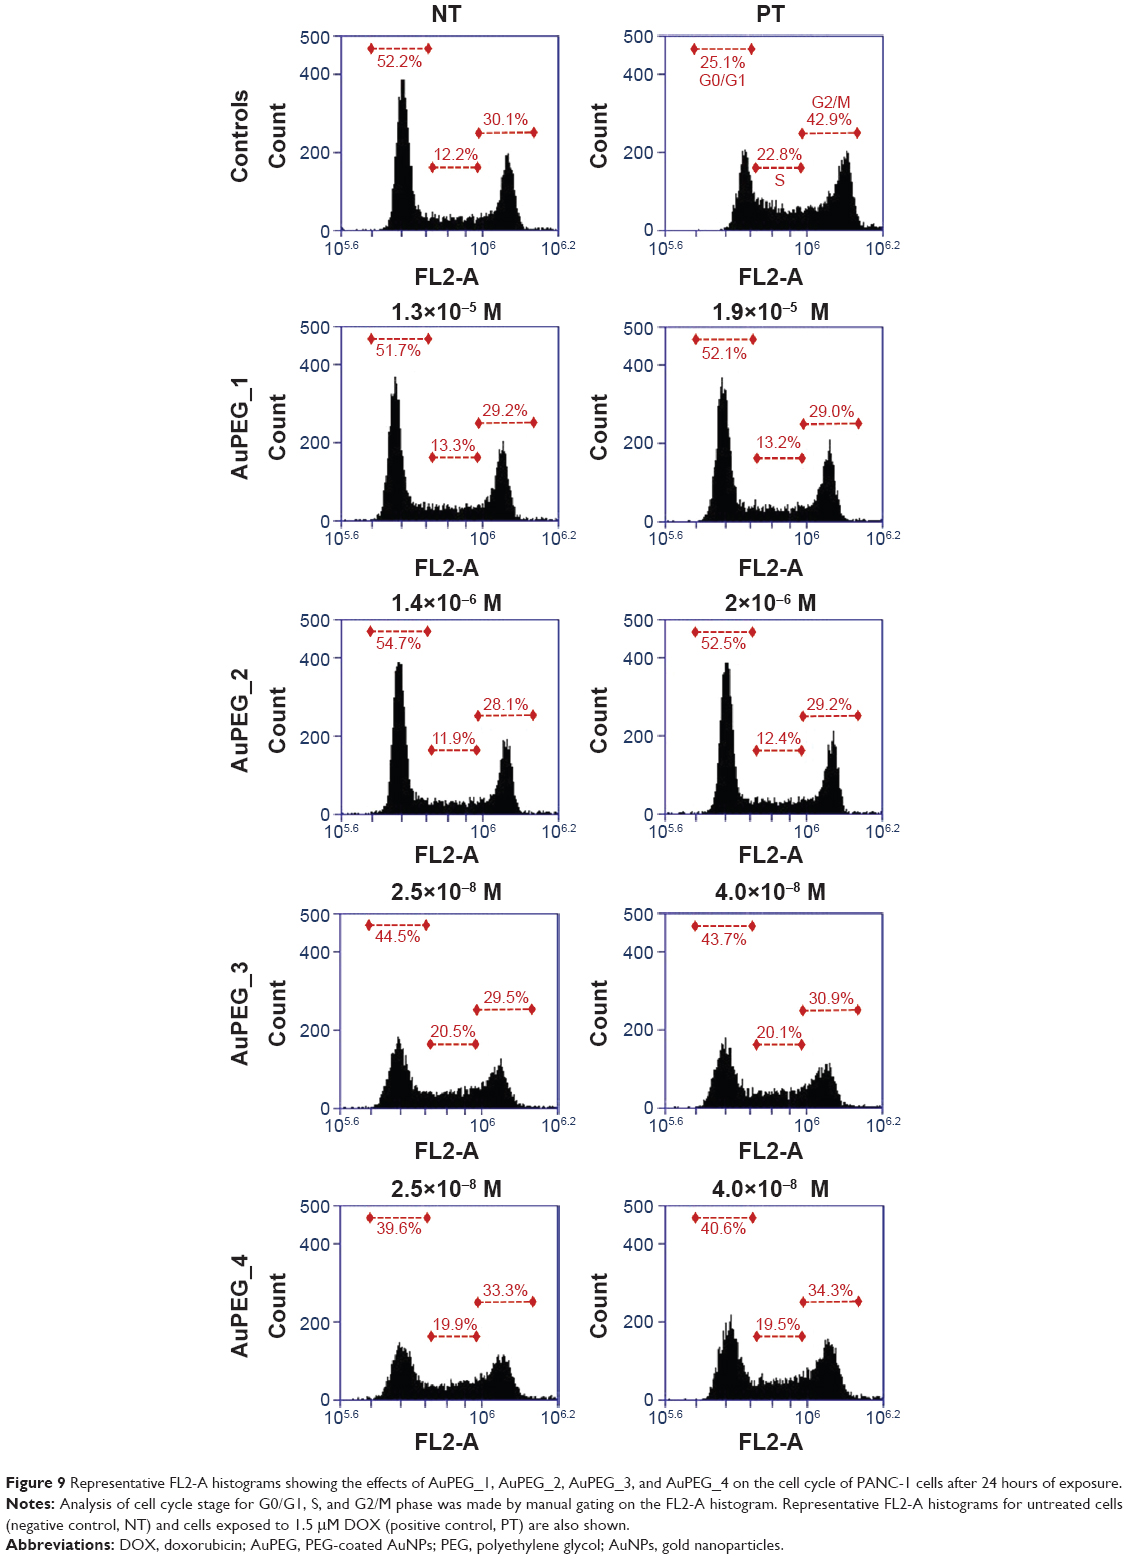 | Figure 9 Representative FL2-A histograms showing the effects of AuPEG_1, AuPEG_2, AuPEG_3, and AuPEG_4 on the cell cycle of PANC-1 cells after 24 hours of exposure. |
Drug delivery – mechanism
Cellular internalization of AuPEG_3 and AuPEG_4 and colocalization into lysosomes
LSCM was used as a qualitative technique to define the internalization of the gold nanocarriers (AuPEG_3 and AuPEG_4) into PDAC cells and the release of DOX within the cells. After 24 hours of exposure, AuPEG_3 and AuPEG_4 could be detected within the PANC-1 cells (Figure 10). In particular, numerous PEG-AuNPs were colocalized with the glycosylated LAMP-1 expression. LAMP-1 is estimated to contribute, together with LAMP-2, to ~50% of all proteins of the lysosome membrane.63 Thus, the expression of LAMP-1 was used within this study as marker for identifying lysosomes.64 Indeed, comparison of the PEG-AuNPs detection images with the images showing the colocalized nanoparticles evidenced that not all the PEG-AuNPs were found within the lysosomes.
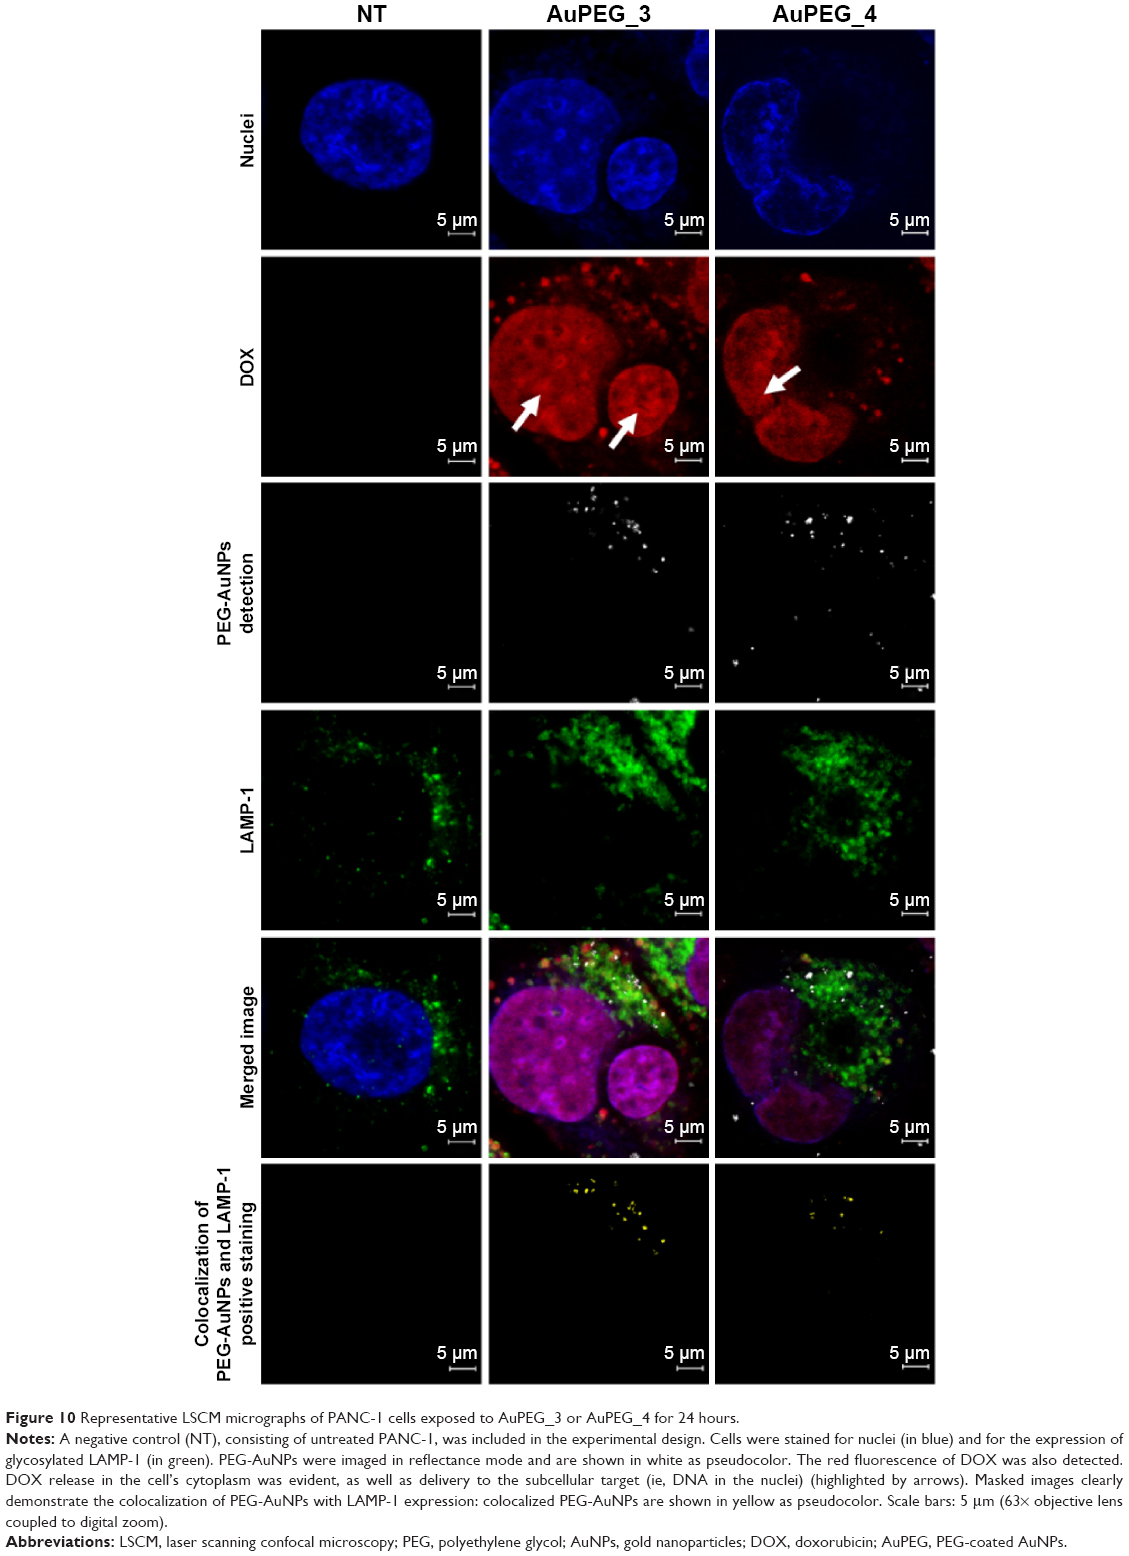 | Figure 10 Representative LSCM micrographs of PANC-1 cells exposed to AuPEG_3 or AuPEG_4 for 24 hours. |
The presence of red fluorescent DOX molecules within the cell’s body was also evaluated by LSCM analysis. The red fluorescence from DOX molecules was clearly detected within the cells (Figure 10), thus suggesting effective drug delivery and release by PEG-AuNPs. Red fluorescence from DOX molecules (not detectable in the untreated specimens, NT) appeared to be scattered not only throughout the cytoplasm but also over the entire cell nuclei.
Cell lysis and Western blotting of LAMP-1 protein expression
To further establish if the internalized PEG-AuNPs were indeed trafficked to the lysosomes, PANC-1 cells were exposed to AuPEG_3 and AuPEG_4 for 24 hours, lyzed, and cell lysates were electrophoretically separated and probed with LAMP-1 antibody (Figure 11). Two distinct protein bands, corresponding to nonglycosylated and glycosylated LAMP-1, were detected in the lysates of untreated PANC-1 cells (NT). A significant decrease in the expression of nonglycosylated LAMP-1protein was shown following exposure to AuPEG_3 or AuPEG_4.
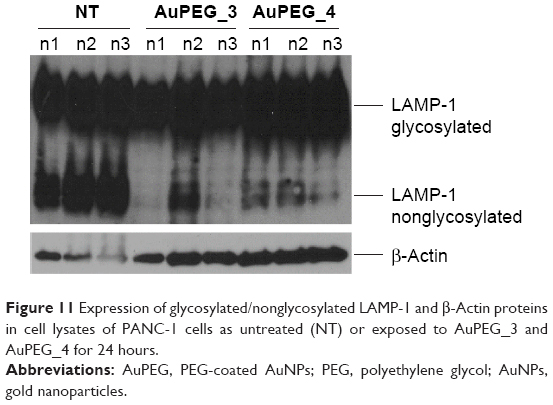 | Figure 11 Expression of glycosylated/nonglycosylated LAMP-1 and β-Actin proteins in cell lysates of PANC-1 cells as untreated (NT) or exposed to AuPEG_3 and AuPEG_4 for 24 hours. |
Endocytosis pathway
To define the mechanism by which PEG-AuNPs were internalized into PDAC cells, we investigated whether the cellular uptake of AuPEG_3 and AuPEG_4 was mediated by 1) an energy-dependent mechanism, 2) an RME, and/or 3) by the active targeting of the Kv11.1 subunits of hERG1 K+ channels. A cartoon schematically reporting on the internalization routes of AuPEG_3 and AuPEG_4 tested is shown in Figure 4.
PANC-1 cells were exposed to AuPEG_3 or AuPEG_4 for 6 hours, following pretreatment with 0.1% NaN3 for 3 hours. NaN3 is commonly used in vitro to inhibit cytochrome-C oxidase, the last enzyme in the mitochondrial electron transport chain, producing a drop in intracellular ATP concentration and inhibiting energy-dependent endocytosis.16,65,66 Changes in the cytotoxic profile triggered by PEG-AuNPs internalization (measured as changes in cell count) were recorded and quantified by HCSA (Figure 12). Results were then compared to those obtained from PANC-1 cells cultured in the absence of endocytosis inhibitors (−), with or without PEG-AuNPs, or to PANC-1 cells exposed to the inhibitor only. PANC-1 cells exposed to AuPEG_3 showed a significant increase in cell count after pretreatment with NaN3; conversely, there was no detectable change in the PEG-AuNPs cytotoxicity when NaN3 pretreated PANC-1 cells were incubated with AuPEG_4.
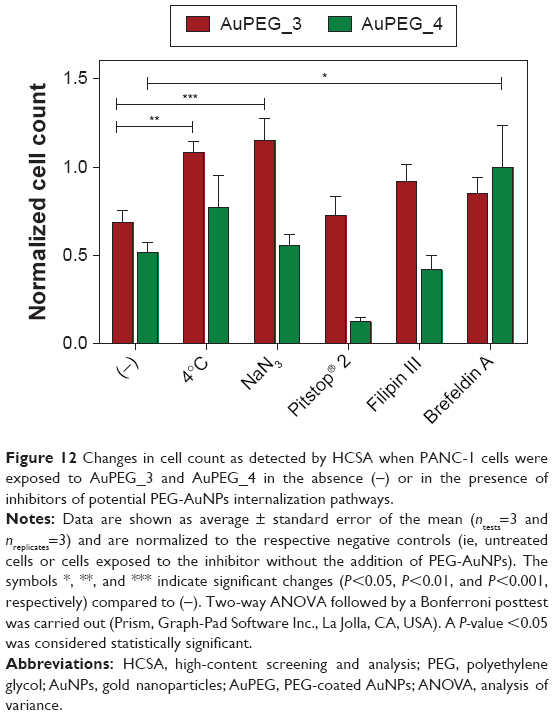 | Figure 12 Changes in cell count as detected by HCSA when PANC-1 cells were exposed to AuPEG_3 and AuPEG_4 in the absence (−) or in the presence of inhibitors of potential PEG-AuNPs internalization pathways. |
Similar trend was also seen when PANC-1 cells were incubated at 4°C in the presence of AuPEG_3, resulting in an increase in cell count, compared to the same reading at 37°C (−). Whereas the same experiment in the presence of AuPEG_4 did not exhibit any significant change in the cell viability of 4°C-treated test group compared to the (−) control (Figure 12). A low temperature was used here to inhibit RME, as an inverse relationship correlates the culturing temperature to RME effectiveness.67
Subsequent experimental testing with both PEG-AuNPs showed no influence, on the cell cytotoxicity response, of the incubation with, or pretreatment with, inhibitors of clathrin- (Pitstop® 2) and caveolae- (Filipin III) dependent endocytosis (Figure 12), which are two of the main RME pathways. Clathrin-coated pits are the primary plasma membrane specialization involved in the uptake of a wide variety of molecules by endocytosis.68 Inhibition of clathrin-dependent endocytosis was achieved in this study by Pitstop® 2. Although limitations are associated to its use due to the reported nonspecificity of its mode of action,69 Pitstop® 2 causes profound inhibition of the clathrin-dependent endocytosis pathway.69,70 Filipin III is known in cellular biology as an inhibitor of the caveolae-mediated endocytosis pathway in mammalian cells.71
Finally, Brefeldin A was used as an indirect inhibitor of the hERG1 K+ channel maturation, as it hinders the anterograde protein transport from the ER to the Golgi apparatus.72,73 As expected, a significant increase in the cell count was detected only when Brefeldin A–treated PANC-1 cells were exposed to anti-Kv11.1-pAb targeted PEG-AuNPs (AuPEG_4) (Figure 12).
One important aspect to consider when inhibiting endocytosis is to leave unaffected the F-actin cytoskeleton of the cell, since reorganization of the actin filaments can impact on cellular uptake processes,74 leading to multiple effects occurring simultaneously. In our study, the F-actin filaments maintained their overall morphology and distribution when PANC-1 cells were treated with various inhibitors (Figure S12). In addition, incubation with the various inhibitors used in this study did not cause any significant change in cell viability, as quantified by HCSA (Figure S13).
Discussion
DOX remains the first line of treatment for various cancers ever since its discovery in 1971. However, the severe side effects associated with the administration of this chemotherapeutic agent (such as cardiotoxicity and nephrotoxicity) have triggered the development of DOX nanocarriers and liposomal DOX (eg, Doxil®) for passive targeting of tumors. Although the therapeutic profile of DOX is appreciably improved by these formulations, their success is often dulled by the appearance of newer toxicity signs like palmar-plantar erythrodysesthesia, commonly referred as hand foot syndrome.75 Thus, the search and design of engineered DOX nanocarriers with high specificity for cancer cells is still under research.
In this study, PEG-capped AuNPs were synthesized (AuPEG_1) and further conjugated to DOX (AuPEG_4) as therapeutic payload and anti-Kv11.1-pAb (AuPEG_2) for active targeting of PDAC cells, as shown in Figure 1. Pancreatic cancer and its most frequent form, the PDAC, still carry a dismal prognosis with a 5-year survival rate below 6%.76 Unlike other cancer diseases, where significant advances have been made and new treatment modalities developed, promising research consistently fails to translate new chemotherapies against PDAC into the clinical setting.77 This study aimed at the development and PoC in vitro testing of PEG-AuNPs that overcome such therapeutic gap in clinical oncology.
hERG1 channels were selected as biomarker based on increasing scientific evidence that indicates that aberrant hERG1 expression may be exploited for therapy purposes.31,43,54,78 Major limitation of hERG1-based tumor therapy in humans is the potential cardiotoxicity that many hERG1 blockers exert. However, a promising first-in-class compound to attempt oncologic therapy without cardiotoxicity, based on targeting the Kv11.1 subunit of the hERG1 channel, has been recently reported,79 thus supporting the targeting strategy exploited in our study.
Based on their chemical design, the PEG-AuNPs developed within this study have been categorized as nanomedicines in which the drug payload is directly attached to the nanoparticle surface via a degradable covalent bond.80 The amide group linking the PEG chains to the DOX molecules was designed so that it could be cleaved under the desired conditions, that is, by a specific enzyme present in the cell’s lysosomes.81,82 Nowadays, it is acknowledged that the efficacy of chemotherapeutic drugs is in many cases hindered not only by dose-limiting side effects but also by poor bioavailability at the disease site. In the specific case of DOX, the chemical structure of this chemotherapeutic agent presents a primary amine with a basic pKa. This reduces the cellular uptake of DOX in an acidic environment such as that of the tumor tissue. Indeed, the uptake of DOX at pH 6.6 is only half of that at neutral pH, preventing the interaction of the drug with its subcellular target – the DNA in the cell nuclei. Consequently, the only approach by which nanocarriers such as PEG-AuNPs could effectively enhance DOX efficacy or, more precisely, could decrease the drug EC50 is by releasing the drug directly into the cytoplasm. The use of stimuli–responsive nanomedicines, such as the ones developed in this study, not only ensures DOX stability during transport but it also allows for the efficient release of the drug payload only when the nanocarrier reaches the target tissue and is internalized into the cells,83,84 thus reducing systemic side effects in vivo.
AuPEG_1 was produced following previously reported protocols that allowed controlling the nucleation and growth processes via the amphiphilic (dual-nature) character of the dicarboxylic acid–terminated PEG polymer included in the synthetic steps.25,85 Applying the successful concept used for producing Aurimune9 as template for designing our gold nanocarrier, the size of PEG-AuNPs was engineered to obtain a delivery platform with an organic/inorganic core bigger than 8 nm (Figure 6D), thus avoiding rapid clearance from the kidneys following intravenous administration.86 A PEG layer was also introduced to 1) prolong the nanocarrier circulation time, 2) avoid the reticulo–endothelial system clearance,75 and 3) enhance the absorption and clearance of AuNPs when administered through intravenous injection.19 In addition, the gold core was kept below 20 nm, as PEGylated AuNPs in this size range have showed significantly higher tumor extravasation.87
As expected, low aggregation levels of AuNPs_1 were observed as a result of the repulsive interactions between the PEG chains present at the surface of the nanoparticles (Figure 5A and Table 1). The significant red-shift and broadening of the LSP band in the UV–Vis spectra of AuPEG_2 (Figure 5A) confirmed an increase in particle size consequent to the surface modification of PEG-AuNPs with pAb,88 as well as an antibody-particle interaction. The successful pAb grafting and the covalent conjugation of DOX onto PEG-AuNPs, via a covalent linkage with EDC/NHS groups, were also confirmed by PM-IRRAS (Figure 7).59 The formation of an amide bond is in fact evidenced by the presence of broad band at 1,675 cm−1 and an additional one at 1,636 cm−1 (amide II). The AuPEG_2 colloidal solution obtained was homogenously dispersed (Figure 6C). Taking into account that the size of the anti-Kv11.1-pAb is ~15 nm,78 we can estimate that the antibody stabilized the inter-particle distance via a double combination of electrostatic and steric repulsions among the various pAb proteins linked to the PEG-chain grafted onto the nanoparticles’ surface. It is worth noting that all experiments were carried out at pH 7.4, a value at which the amino acids constituting the anti-Kv11.1-pAb (pI=6.2–6.5) are equally charged. Indeed, the conjugation of DOX onto the PEG-AuNPs further stabilized the colloidal solution. This phenomenon was confirmed by TEM images analysis, by means of which the size of AuPEG_3 and AuPEG_4 as well as the presence of aggregates were evaluated (Figure 6). In particular, it was observed that AuPEG_4 were uniformly dispersed, confirming that the amphiphilic anti-Kv11.1-pAb-DOX-PEG layer attached to the gold core of the nanoparticles stabilized the nanoparticles’ suspension and prevented aggregation.
In general, the hydrodynamic diameters of PEG-AuNPs, measured by NTA, were bigger (Table 1) than their sizes as quantified from TEM imaging analysis (Figures 5 and 6), both in PBS and in complex biological media such as FBS and cell culture medium. In PBS, the quite large hydrodynamic diameters (ranging from 80 to 90 nm) were most likely associated with the presence of a swollen organic PEG coating around the gold core of the nanoparticles. Such a large hydrodynamic diameter indeed suggested that although the intracellular uptake of the PEG-AuNPs into PDAC cells should be triggered by the specific active targeting of the Kv11.1 subunit of the hERG1 K+ channels and subsequent immobilization on the cell surface, PEG-AuNPs internalization could not occur by diffusion through the pores of the targeted K+ channel. The diffusion of big molecules to the cell cytoplasm across the K+ channels is in fact prevented by a narrowing of the pore allowing only the passage of permeant ions,89 the size of which does not exceed 152 pn.90 When moving in complex dispersing media, the large hydrodynamic diameter was attributed to the formation of a “protein corona” (Table 1), that is, the formation of a layer of proteins adsorbed onto the PEG-AuNPs that continuously exchange with the proteins in the environment. It should be noted that the formation of a “protein corona” can significantly impact on 1) the stability in circulation, 2) the extravasation rate of nanomedicines across tumor vasculature (EPR effect),86 3) the efficacy of the nanocarrier to be internalized into the cancer cells, driving the success of the active-targeted delivery,91 and 4) the carrier degradation/dissolution and drug release.92 NTA results confirmed that no significant aggregation occurred in complex biological dispersing media following 24 hours of incubation at 37°C (Table 1), thus suggesting that PEG-AuNPs may be stable in in vivo circulation following intravenous administration. Our data on the hydrodynamic diameter, showing values below 200 nm in all the conditions tested (Table 1), also suggested that PEG-AuNPs carriers have optimal physicochemical properties to effectively cross leaky vasculature via the EPR effect,86 thus maximizing the accumulation in the tumor tissue and enabling the active targeting of the PDAC cells via anti-Kv11.1-pAb.
PoC in vitro data acquired by flow cytometry (Figures 8 and 9) demonstrated that PEG-AuNPs effectively exerted their therapeutic activity. The EC50 of the DOX delivered by PEG-AuNPs resulted in fact more than 30-fold lower than that of the molecular drug (Figure 8D). In particular, the G2-/M-phase cell-cycle arrest detected in PANC-1 cells exposed to AuPEG_3 and AuPEG_4 indicated that DOX was released from the nanocarrier and reached its subcellular target (intranuclear DNA). Active targeting by anti-Kv11.1-pAb moieties induced an increase in PEG-AuNPs cytotoxic effect (Figure 8) and triggered an enhanced G2-/M-phase cell-cycle arrest (Figure 9), which was not detected following exposure to AuPEG_1 or AuPEG_2.
Noteworthy, the difference in LC50 between AuPEG_1 and drug-loaded PEG-AuNPs (AuPEG_3 and AuPEG_4) was quite large, spanning from three to almost four orders of magnitude (Figure 8). In nanomedicine, when nanomaterials are used for the delivery of cytotoxic drugs, for example, chemotherapeutic agents, by active targeting, their own cytotoxicity is less important when compared to other factors such as delivery efficiency and drug-release profiling. Similarly to other pharmaceuticals, the clinical potential of the nanocarrier is evaluated based on a risk–benefit ratio analysis.93 Nonetheless, our flow cytometry data suggested that if PEG-AuNPs were to be used in vivo as nanocarriers, no severe cytotoxicity should be elicited by either the nanomaterial itself or its organic PEG coating in the pancreas. This resulted to be in line with the nanocarrier safe-by-design approach16 adopted.
From the therapeutic point of view, the internalization of PEG-AuNPs in the diseased cells of interest was of critical importance in order to exert effectively their therapeutic activity. LSCM data (Figure 10) demonstrated not only that PEG-AuNPs were internalized into PANC-1 cells but also that AuPEG-3 and AuPEG_4 were translocated into the lysosomes. Additionally, LAMP-1 protein detection and quantification by cell lysis and Western blotting (Figure 11) demonstrated that exposure to drug-loaded PEG-AuNPs was accompanied by changes in the levels of LAMP-1 glycosylation, which is known to protect the protein itself and the lysosomal membranes from intracellular proteolysis.94 Such changes could, therefore, be associated to an increased lysosomal function in PANC-1 cells following exposure to AuPEG_3 and AuPEG_4. The LSCM and Western blotting results indeed suggested that DOX could be released as a result of the enzymatic cleavage of the amide bond, in agreement with the current scientific literature.81,84 The scattered localization of red fluorescent DOX molecules within the cells’ cytoplasm and nuclei (Figure 10) further supported this hypothesis. As an additional experimental evidence of the proposed mechanism, the DOX release profile of AuPEG_3 was evaluated at pH 7.2 and pH 4.2 (Figure S14). Experiments at pH 4.2 were used to simulate the acidic environment typical of the tumor tissue. DOX release into aqueous environment (PBS) was almost negligible at both pH. An initial release of DOX (2%) was detected after 3 hours; it remained almost unchanged even after 170 hours (7 days). The percentage of DOX released after 7 days was equal to 2.35% at pH 4.2 and 2.18% at pH 7.2. Since after 24-hours incubation at 37°C, the hydrodynamic diameters of AuPEG_3 and AuPEG_4 were comparable among the complex dispersing media tested (Table 1 and Figure S7), one could hypothesize that the hydrodynamic diameter of PEG-AuNPs did not influence the release of the drug payload in the in vitro experiments. In order to further prove this hypothesis, the DOX release was evaluated in DMEM supplemented with 10% FBS to mimic the in vitro environment (Figure S14). DOX release in DMEM was comparable to that in PBS. These results confirmed once again that to achieve significant DOX release from PEG-AuNPs, enzymatic activity would be necessary.
Depending on which mechanisms the cell uses to internalize the nanocarrier, its compartmentalization may vary, as does its biological fate and the drug release. The cell type and physico-chemical properties of the nanocarrier, such as size, shape, or surface functionalities, can affect the endocytosis mechanism.95,96 A selective and strategic use of endocytosis inhibitors was the method selected in this study to 1) determine the route of PEG-AuNPs internalization into PDAC cells and to 2) validate the hypothesis that DOX was released from the gold nanocarriers in the lysosomes. Our results showed that AuPEG_3 was internalized by clathrin-/caveolae-independent endocytosis (Figure 12A), which has been previously reported as a potential internalization pathway for objects with size around 90 nm,80 such as AuPEG_3 (Table 1). Although this pathway is less well understood than other RME mechanisms, it is known that clathrin-/caveolae-independent endocytosis results in the formation of endosomes, which eventually merge with lysosomes for degradation.97,98 Thus, this result was in good agreement with the LSCM results (Figure 10) showing colocalization of PEG-AuNPs with LAMP-1 expression, and with our hypothesis that DOX was released from the nanocarriers in the lysosomes. Interestingly, active targeting via anti-Kv11.1-pAb induced PEG-AuNPs to be internalized by a completely different mechanism. AuPEG_4 internalization into PANC-1 cells was inhibited in fact only by incubation with Brefeldin A (Figure 12B), which was used to indirectly hinder the maturation of hERG1 K+ channels. During biogenesis, hERG1 polypeptides are folded and assembled in the ER, from where they are trafficked to the Golgi apparatus. Brefeldin A hinders such transport. Our HCSA results (Figure 12) showed that impeding hERG1 K+ channels maturation and, therefore, modifying the expression levels of such channels on the PANC-1 cell surface inhibited AuPEG_4 efficacy. This indeed suggested that the active targeting of the Kv11.1 subunit of the hERG1 channels played a key role in triggering AuPEG_4 internalization into PANC-1 cells. Again, this is in agreement with the safe-by-design approach to nanomedicine development.18 Since mature hERG1 K+ channels remain at the plasma membrane with a half-life of ~10 hours,99,100 we hypothesize that in our 24-hour experiments AuPEG_4 immobilized onto the cell membrane by active targeting of the Kv11.1 subunit were internalized into the cells during hERG1 channels degradation. In this phase, hERG1 channels are internalized in endocytic vesicles, tagged with ubiquitin, and then degraded in lysosomes,89,101 thus making possible DOX to be released enzymatically from its nanocarrier. A cartoon presenting the proposed mechanisms of internalization of AuPEG_3 and AuPEG_4 compared to molecular DOX is shown in Figure 13.
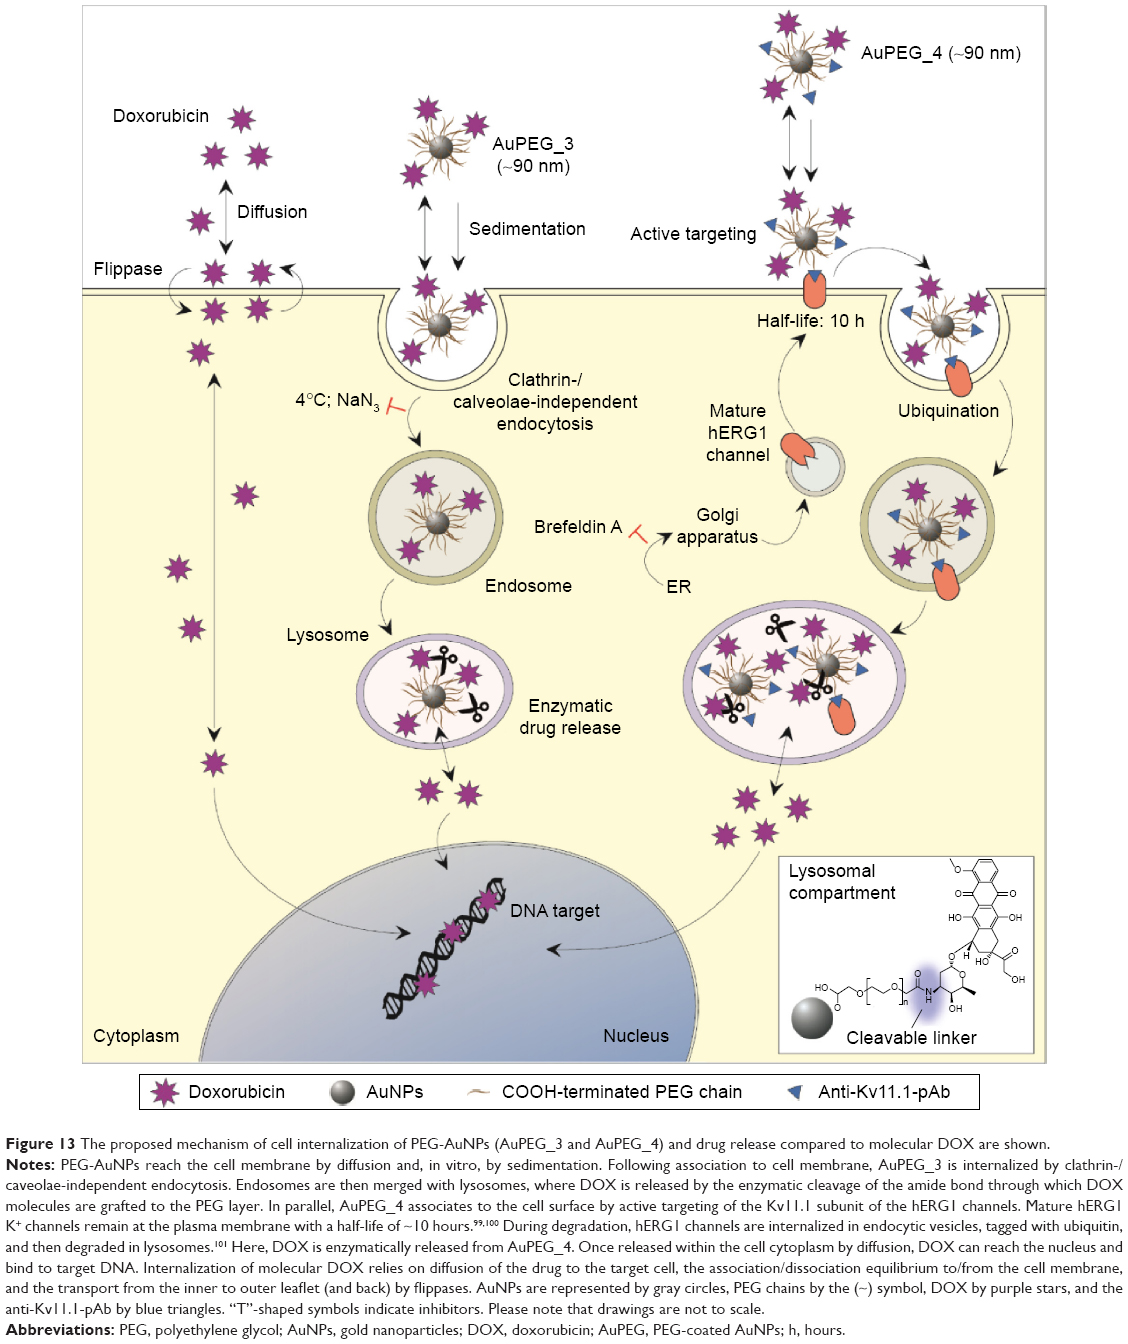 | Figure 13 The proposed mechanism of cell internalization of PEG-AuNPs (AuPEG_3 and AuPEG_4) and drug release compared to molecular DOX are shown. |
Conclusion
Prized for their versatility, optical properties, and safety, AuNPs are by far among the most advanced nanomaterials exploited for nanomedicine applications. In this study, we have shown by PoC studies that the synthesized PEG-AuNPs could be successfully employed as nanocarriers for delivering, in a stimuli–responsive manner, an effective dose of DOX to PDAC cells via an innovative active targeting strategy. More importantly, the delivery of DOX by nanocarriers caused its EC50 to drop by more than 30 times as compared to the free drug.
Although in vivo studies are needed to the evaluate potential adverse events that would occur following intravenous administration of PEG-AuNPs, as well as to define their biodistribution and bioavailability profiles, this work offers an excellent opportunity to develop nanomedicines featuring innovative targeting capability against PDAC, a disease for which few or no effective treatment options exist.
Acknowledgments
We would like to thank Dr C Méthivier (LRS-UPMC-Paris) for technical assistance and discussion about XPS analysis. This work was partially supported by the EU FP7 MULTIFUN project (contract # 262943), QualityNano project Transnational Access (TCD-TAF-344 and TCD-TAF-456), and Science Foundation Ireland under the AMBER centre research (grant #SFI/12/RC/2278).
Disclosure
The authors report no conflicts of interest in this work.
References
The Economist Intelligence Unit. The Future of Healthcare in Europe. Available from: http://www.janssen.pt/sites/default/files/The-Future-Of-Healthcare-In-Europe.pdf. 2012. Accessed August 1, 2015. | ||
European Commission. The 2015 Ageing Report. Available from: http://ec.europa.eu/economy_finance/publications/european_economy/2014/pdf/ee8_en.pdf. 2015. Accessed August 1, 2015. | ||
Stewart BW, Christopher P, Wild CP, editors. World Cancer Report 2014. IARC publication, distributed by WHO Press; 2014. | ||
Bregoli L, Movia D, Gavigan-Imedio JD, Lysaght J, Reynolds J, Prina-Mello A. Nanomedicine applied to translational oncology: a future perspective on cancer treatment. Nanomedicine. Epub 2015 Sep 11. | ||
Von Hoff DD, Ervin T, Arena FP, et al. Increased survival in pancreatic cancer with nab-paclitaxel plus gemcitabine. New Engl J Med. 2013;369(18):1691–1703. | ||
Kimura K, Tanaka S, Iwamoto M, et al. Safety of nanoparticle albumin-bound paclitaxel administered to breast cancer patients with clinical contraindications to paclitaxel or docetaxel: four case reports. Oncol Lett. 2013;6(4):881–884. | ||
Muddineti OS, Ghosh B, Biswas S. Current trends in using polymer coated gold nanoparticles for cancer therapy. Int J Pharm. 2015;484(1–2):252–267. | ||
Patra CR, Bhattacharya R, Mukhopadhyay D, Mukherjee P. Fabrication of gold nanoparticles for targeted therapy in pancreatic cancer. Adv Drug Deliv Rev. 2010;62(3):346–361. | ||
Cythlmmune [webpage on the Internet]. Aurimune: A nanomedicine platform. Available from: http://www.cytimmune.com/. Accessed August 2015. | ||
Libutti SK, Paciotti GF, Byrnes AA, et al. Phase I and pharmacokinetic studies of CYT-6091, a novel PEGylated colloidal gold-rh TNF nanomedicine. Clin Cancer Res. 2010;16(24):6139–6149. | ||
Li SD, Huang L. Pharmacokinetics and biodistribution of nanoparticles. Mol Pharm. 2008;5(4):496–504. | ||
Gad SC, Sharp KL, Montgomery C, Payne JD, Goodrich GP. Evaluation of the toxicity of intravenous delivery of auroshell particles (gold-silica nanoshells). Int J Toxicol. 2012;31(6):584–594. | ||
Schwartz JA, Shetty AM, Price RE, et al. Feasibility study of particle-assisted laser ablation of brain tumors in orthotopic canine model. Cancer Res. 2009;69(4):1659–1667. | ||
ClinicalTrials.gov. Available from: https://clinicaltrials.gov/. Accessed August 2015. | ||
Available from: http://www.cytimmune.com/#pipeline. Accessed August 2015. | ||
Movia D, Gerard V, Maguire CM, et al. A safe-by-design approach to the development of gold nanoboxes as carriers for internalization into cancer cells. Biomaterials. 2014;35(9):2543–2557. | ||
Wei G, Wang L, Sun L, et al. Type I collagen-mediated synthesis and assembly of UV-photoreduced gold nanoparticles and their application in surface-enhanced Raman scattering. J Phys Chem C. 2007;111(5):1976–1982. | ||
Movia D, Poland C, Tran L, Volkov Y, Prina-Mello A. Multilayered nanoparticles for personalized medicine: translation into clinical markets. In: Bawa R, Audette GF, Rubinstein I, editors. Handbook of Clinical Nanomedicine: Nanoparticles, Imaging, Therapy, and Clinical Applications. Singapore: Pan Stanford Publishing; 2015. | ||
Kudgus RA, Walden CA, McGovern RM, Reid JM, Robertson JD, Mukherjee P. Tuning pharmacokinetics and biodistribution of a targeted drug delivery system through incorporation of a passive targeting component. Sci Rep. 2014;4:5669. | ||
Eck W, Craig G, Sigdel A, et al. PEGylated gold nanoparticles conjugated to monoclonal F19 antibodies as targeted labeling agents for human pancreatic carcinoma tissue. ACS Nano. 2008;2(11):2263–2272. | ||
Chen W, Ayala-Orozco C, Biswal NC, et al. Targeting pancreatic cancer with magneto-fluorescent theranostic gold nanoshells. Nanomedicine. 2014;9(8):1209–1222. | ||
Cui R, Liu C, Shen J, Gao D, Zhu J-J, Chen H-Y. Gold nanoparticle–colloidal carbon nanosphere hybrid material: preparation, characterization, and application for an amplified electrochemical immunoassay. Adv Funct Mater. 2008;18(15):2197–2204. | ||
Razzak R, Zhou J, Yang X, et al. The biodistribution and pharmacokinetic evaluation of choline-bound gold nanoparticles in a human prostate tumor xenograft model. Clin Invest Med. 2013;36(3):E133–E142. | ||
You J, Zhou J, Zhou M, et al. Pharmacokinetics, clearance, and biosafety of polyethylene glycol-coated hollow gold nanospheres. Part Fibre Toxicol. 2014;11:26. | ||
Ray D, Aswal VK, Kohlbrecher J. Synthesis and characterization of high concentration block copolymer-mediated gold nanoparticles. Langmuir. 2011;27(7):4048–4056. | ||
Connor EE, Mwamuka J, Gole A, Murphy CJ, Wyatt MD. Gold nanoparticles are taken up by human cells but do not cause acute cytotoxicity. Small. 2005;1(3):325–327. | ||
Li C, Fan F, Yin B, Chen L, Ganguly T, Tian Z. Au+-cetyltrimethylammonium bromide solution: a novel precursor for seed-mediated growth of gold nanoparticles in aqueous solution. Nano Res. 2013;6(1):29–37. | ||
Guerrero-Martínez A, Pérez-Juste J, Carbó-Argibay E, Tardajos G, Liz-Marzán LM. Gemini-surfactant-directed self-assembly of monodisperse gold nanorods into standing superlattices. Angew Chem Int Ed Engl. 2009;48(50):9484–9488. | ||
Liao H-G, Jiang Y-X, Zhou Z-Y, Chen S-P, Sun S-G. Shape-controlled synthesis of gold nanoparticles in deep eutectic solvents for studies of structure–functionality relationships in electrocatalysis. Angew Chem Int Ed Engl. 2008;47(47):9100–9103. | ||
Spadavecchia J, Moreau J, Hottin J, Canva M. New cysteamine based functionalization for biochip applications. Sensor Actuat B Chem. 2009;143(1):139–143. | ||
Lastraioli E, Lottini T, Bencini L, Bernini M, Arcangeli A. hERG1 potassium channels: novel biomarkers in human solid cancers. BioMed Res Int. 2015;2015:9. | ||
Prabhakar U, Maeda H, Jain R, et al. Challenges and key considerations of the enhanced permeability and retention effect for nanomedicine drug delivery in oncology. Cancer Res. 2013;73(8):2412–2417. | ||
Maeda H, Nakamura H, Fang J. The EPR effect for macromolecular drug delivery to solid tumors: improvement of tumor uptake, lowering of systemic toxicity, and distinct tumor imaging in vivo. Adv Drug Deliv Rev. 2013;1:71–79. | ||
Luo G, Long J, Zhang B, et al. Stroma and pancreatic ductal adenocarcinoma: an interaction loop. Biochim Biophys Acta. 2012;1826(1):170–178. | ||
Ghaneh P, Costello E, Neoptolemos JP. Biology and management of pancreatic cancer. Gut. 2007;56(8):1134–1152. | ||
Chauhan VP, Jain RK. Strategies for advancing cancer nanomedicine. Nature Mat. 2013;12(11):958–962. | ||
Provenzano PP, Cuevas C, Chang AE, Goel VK, Von Hoff DD, Hingorani SR. Enzymatic targeting of the stroma ablates physical barriers to treatment of pancreatic ductal adenocarcinoma. Cancer Cell. 2012;21(3):418–429. | ||
Spadavecchia J, Perumal R, Barras A, et al. Amplified plasmonic detection of DNA hybridization using doxorubicin-capped gold particles. Analyst. 2014;139(1):157–164. | ||
You J, Zhang G, Li C. Exceptionally high payload of doxorubicin in hollow gold nanospheres for near-infrared light-triggered drug release. ACS Nano. 2010;4(2):1033–1041. | ||
Boisselier E, Astruc D. Gold nanoparticles in nanomedicine: preparations, imaging, diagnostics, therapies and toxicity. Chem Soc Rev. 2009;38:1759–1782. | ||
Pippa N, Pispas S, Demetzos C, Sivolapenko G. Advanced nanocarriers for an antitumor peptide. J Nanopart Res. 2013;15(2062):1–13. | ||
Hole P, Sillence K, Hannell C, et al. Interlaboratory comparison of size measurements on nanoparticles using nanoparticle tracking analysis (NTA). J Nanopart Res. 2013;15(12):1–12. | ||
Lastraioli E, Perrone G, Sette A, et al. hERG1 channels drive tumour malignancy and may serve as prognostic factor in pancreatic ductal adenocarcinoma. Br J Cancer. 2015;112(6):1076–1087. | ||
BD Biosciences. A guide to absolute counting using the BD Accuri™ C6 flow cytometer. Available from: http://static.bdbiosciences.com/documents/accuri/Accuri-TB-Guide-to-Absolute-Counting.pdf. Accessed August 2015. | ||
Kang B, Afifi MM, Austin LA, El-Sayed MA. Exploiting the nanoparticle plasmon effect: observing drug delivery dynamics in single cells via Raman/fluorescence imaging spectroscopy. ACS Nano. 2013;7(8):7420–7427. | ||
Jain PK, Lee KS, El-Sayed IH, El-Sayed MA. Calculated absorption and scattering properties of gold nanoparticles of different size, shape, and composition: applications in biological imaging and biomedicine. J Phys Chem B. 2006;110(14):7238–7248. | ||
Lee KS, El-Sayed MA. Dependence of the enhanced optical scattering efficiency relative to that of absorption for gold metal nanorods on aspect ratio, size, end-cap shape, and medium refractive index. J Phys Chem B. 2005;109(43):20331–20338. | ||
Lee KS, El-Sayed MA. Gold and silver nanoparticles in sensing and imaging: sensitivity of plasmon response to size, shape, and metal composition. J Phys Chem B. 2006;110(39):19220–19225. | ||
Yguerabide J, Yguerabide EE. Light-scattering submicroscopic particles as highly fluorescent analogs and their use as tracer labels in clinical and biological applications. Anal Biochem. 1998;262(2):157–176. | ||
Aslan K, Lakowicz JR, Geddes CD. Nanogold plasmon resonance-based glucose sensing. 2. Wavelength-ratiometric resonance light scattering. Anal Chem. 2005;77(7):2007–2014. | ||
Orendorff CJ, Sau TK, Murphy CJ. Shape-dependent plasmon-resonant gold nanoparticles. Small. 2006;2(5):636–639. | ||
Huang X, El-Sayed MA. Gold nanoparticles: optical properties and implementations in cancer diagnosis and photothermal therapy. J Adv Res. 2010;1(1):13–28. | ||
Carl Zeiss Microimaging, LLC. Colocalization analysis in AIM and ZEN. Available from: http://www.ecu.edu/cs-dhs/bsomresearchgradstudies/CoreImagingCenter/upload/Colocalization_AIM_ZEN.pdf. Accessed August 2015. | ||
D’Amico M, Gasparoli L, Arcangeli A. Potassium channels: novel emerging biomarkers and targets for therapy in cancer. Recent Pat Anticancer Drug Discov. 2013;8:53–65. | ||
Link S, El-Sayed MA. Optical properties and ultrafast dynamics of metallic nanocrystals. Ann Rev Phys Chem. 2003;54:331–366. | ||
Jiang W KB, Rutka JT, Chan WCW. Nanoparticle-mediated cellular response is size-dependent. Nat Nanotech. 2008;3:145–150. | ||
Orendorff CJ, Hankins PL, Murphy CJ. pH-triggered assembly of gold nanorods. Langmuir. 2005;21(5):2022–2026. | ||
Gu YJ CJ, Man CW, Wong WT, Cheng SH. Gold-doxorubicin nanoconjugates for overcoming multidrug resistance. Nanomedicine. 2012;8(2):204–211. | ||
Spadavecchia J, Perumal R, Barras A, et al. Amplified plasmonic detection of DNA hybridization using doxorubicin-capped gold particles. Analyst. 2014;139(1):157–164. | ||
Politi J, De Stefano L, Longobardi S, et al. The amphiphilic hydrophobin Vmh2 plays a key role in one step synthesis of hybrid protein-gold nanoparticles. Colloids Surf B Biointerfaces. 2015;136: 214–221. | ||
Bagwe RP, Hilliard LR, Tan W. Surface modification of silica nanoparticles to reduce aggregation and nonspecific binding. Langmuir. 2006;22(9):4357–4362. | ||
Ling YH, el-Naggar AK, Priebe W, Perez-Soler R. Cell cycle-dependent cytotoxicity, G2/M phase arrest, and disruption of p34cdc2/cyclin B1 activity induced by doxorubicin in synchronized P388 cells. Mol Pharmacol. 1996;49(5):832–841. | ||
Eskelinen EL, Tanaka Y, Saftig P. At the acidic edge: emerging functions for lysosomal membrane proteins. Trends Cell Biol. 2003;13(3):137–145. | ||
Fukuda M. Lysosomal membrane glycoproteins. Structure, biosynthesis, and intracellular trafficking. J Biol Chem. 1991;266(32):21327–21330. | ||
Mohamed BM, Verma NK, Prina-Mello A, et al. Activation of stress-related signalling pathway in human cells upon SiO2 nanoparticles exposure as an early indicator of cytotoxicity. J Nanobiotechnol. 2011;9:29. | ||
Kim JS, Yoon TJ, Yu KN, et al. Cellular uptake of magnetic nanoparticle is mediated through energy-dependent endocytosis in A549 cells. J Vet Sci. 2006;7(4):321–326. | ||
Goldenthal KL, Pastan I, Willingham MC. Initial steps in receptor-mediated endocytosis. The influence of temperature on the shape and distribution of plasma membrane clathrin-coated pits in cultured mammalian cells. Exp Cell Res. 1984;152(2):558–564. | ||
Pearse BM, Crowther RA. Structure and assembly of coated vesicles. Ann Rev Biophys Biophys Chem. 1987;16:49–68. | ||
Willox AK, Sahraoui YM, Royle SJ. Non-specificity of Pitstop 2 in clathrin-mediated endocytosis. Biology Open. 2014;3(5):326–331. | ||
von Kleist L, Stahlschmidt W, Bulut H, et al. Role of the clathrin terminal domain in regulating coated pit dynamics revealed by small molecule inhibition. Cell. 2011;146(3):471–484. | ||
Rejman J, Bragonzi A, Conese M. Role of clathrin- and caveolae-mediated endocytosis in gene transfer mediated by lipo- and polyplexes. Mol Ther. 2005;12(3):468–474. | ||
Klausner RD, Donaldson JG, Lippincott-Schwartz J. Brefeldin A: insights into the control of membrane traffic and organelle structure. J Cell Biol. 1992;116(5):1071–1080. | ||
Pelham HR. Multiple targets for brefeldin A. Cell. 1991;67(3):449–451. | ||
Papakonstanti EA, Stournaras C. Cell responses regulated by early reorganization of actin cytoskeleton. FEBS Lett. 2008;582(14):2120–2127. | ||
Barenholz Y. Doxil® – the first FDA-approved nano-drug: lessons learned. J Cont Release. 2012;160(2):117–134. | ||
Ferlay J, Steliarova-Foucher E, Lortet-Tieulent J, et al. Cancer incidence and mortality patterns in Europe: estimates for 40 countries in 2012. Eur J Cancer. 2013;49(6):1374–1403. | ||
Haqq J, Howells LM, Garcea G, Metcalfe MS, Steward WP, Dennison AR. Pancreatic stellate cells and pancreas cancer: current perspectives and future strategies. Eur J Cancer. 2014;50(15):2570–2582. | ||
Sette A SJ, Landoulsi J, Casale S, Haye B, Crociani O, Arcangeli A. Development of novel anti-Kv 11.1 antibody-conjugated PEG-TiO2 nanoparticles for targeting pancreatic ductal adenocarcinoma cells. J Nanopart Res. 2013;15:2111. | ||
Gasparoli L, D’Amico M, Masselli M, et al. New pyrimido-indole compound CD-160130 preferentially inhibits the KV11.1B isoform and produces antileukemic effects without cardiotoxicity. Mol Pharmacol. 2015;87(2):183–196. | ||
Petros RA, DeSimone JM. Strategies in the design of nanoparticles for therapeutic applications. Nat Rev Drug Discov. 2010;9(8):615–627. | ||
Etrych T, Subr V, Laga R, Rihova B, Ulbrich K. Polymer conjugates of doxorubicin bound through an amide and hydrazone bond: Impact of the carrier structure onto synergistic action in the treatment of solid tumours. Eur J Pharm Sci. 2014;58:1–12. | ||
Oh KT, Yin H, Lee ES, Bae YH. Polymeric nanovehicles for anticancer drugs with triggering release mechanisms. J Mater Chem. 2007;17(38):3987–4001. | ||
Pechar M, Ulbrich K, Subr V, Seymour LW, Schacht EH. Poly(ethylene glycol) multiblock copolymer as a carrier of anti-cancer drug doxorubicin. Bioconjug Chem. 2000;11(2):131–139. | ||
Ulbrich K, Subr V, Strohalm J, Plocova D, Jelinkova M, Rihova B. Polymeric drugs based on conjugates of synthetic and natural macromolecules. I. Synthesis and physico-chemical characterisation. J Cont Release. 2000;64(1–3):63–79. | ||
Khullar P, Mahal A, Singh V, Banipal TS, Kaur G, Bakshi MS. How PEO-PPO-PEO triblock polymer micelles control the synthesis of gold nanoparticles: temperature and hHydrophobic effects. Langmuir. 2010;26(13):11363–11371. | ||
Dawidczyk CM, Kim C, Park JH, et al. State-of-the-art in design rules for drug delivery platforms: lessons learned from FDA-approved nanomedicines. J Cont Release. 2014;187:133–144. | ||
Zhang G, Yang Z, Lu W, et al. Influence of anchoring ligands and particle size on the colloidal stability and in vivo biodistribution of polyethylene glycol-coated gold nanoparticles in tumor-xenografted mice. Biomaterials. 2009;30(10):1928–1936. | ||
Daniel MC AD. Gold nanoparticles: assembly, supramolecular chemistry, quantum-size-related properties, and applications toward biology, catalysis, and nanotechnology. Chem Rev. 2004;104(1):293–346. | ||
Vandenberg JI, Perry MD, Perrin MJ, Mann SA, Ke Y, Hill AP. hERG K(+) channels: structure, function, and clinical significance. Physiol Rev. 2012;92(3):1393–1478. | ||
Shannon R. Revised effective ionic radii and systematic studies of interatomic distances in halides and chalcogenides. Acta Cryst. 1976;A32(5):751–767. | ||
Byrne JD, Betancourt T, Brannon-Peppas L. Active targeting schemes for nanoparticle systems in cancer therapeutics. Adv Drug Deliv Rev. 2008;60(15):1615–1626. | ||
Wolfram J, Yang Y, Shen J, et al. The nano-plasma interface: implications of the protein corona. Colloids Surf B Biointerfaces. 2014;124:17–24. | ||
Eaton MA, Levy L, Fontaine OM. Delivering nanomedicines to patients: a practical guide. Nanomedicine. 2015;11(4):983–992. | ||
Kundra R, Kornfeld S. Asparagine-linked oligosaccharides protect Lamp-1 and Lamp-2 from intracellular proteolysis. J Biol Chem. 1999;274(43):31039–31046. | ||
Beddoes CM, Case CP, Briscoe WH. Understanding nanoparticle cellular entry: a physicochemical perspective. Adv Colloid Interface Sci. 2015;218:48–68. | ||
Stern ST, Adiseshaiah PP, Crist RM. Autophagy and lysosomal dysfunction as emerging mechanisms of nanomaterial toxicity. Part Fibre Toxicol. 2012;9:20. | ||
Schutze S, Tchikov V, Schneider-Brachert W. Regulation of TNFR1 and CD95 signalling by receptor compartmentalization. Nat Rev Mol Cell Biol. 2008;9(8):655–662. | ||
McMahon HT, Boucrot E. Molecular mechanism and physiological functions of clathrin-mediated endocytosis. Nat Rev Mol Cell Biol. 2011;12(8):517–533. | ||
Ficker E, Dennis AT, Wang L, Brown AM. Role of the cytosolic chaperones Hsp70 and Hsp90 in maturation of the cardiac potassium channel HERG. Circ Res. 2003;92(12):e87–e100. | ||
Gong Q, Keeney DR, Molinari M, Zhou Z. Degradation of trafficking-defective long QT syndrome type II mutant channels by the ubiquitin-proteasome pathway. J Biol Chem. 2005;280(19):19419–19425. | ||
Guo J, Massaeli H, Xu J, et al. Extracellular K+ concentration controls cell surface density of IKr in rabbit hearts and of the HERG channel in human cell lines. J Clin Invest. 2009;119(9):2745–2757. |
Supplementary materials
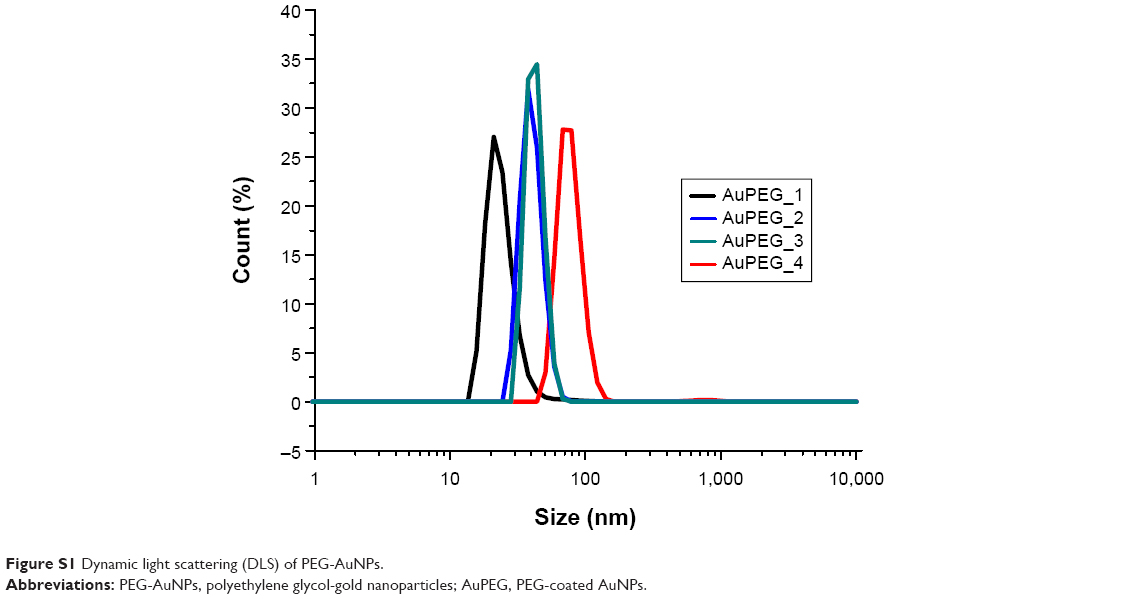 | Figure S1 Dynamic light scattering (DLS) of PEG-AuNPs. |
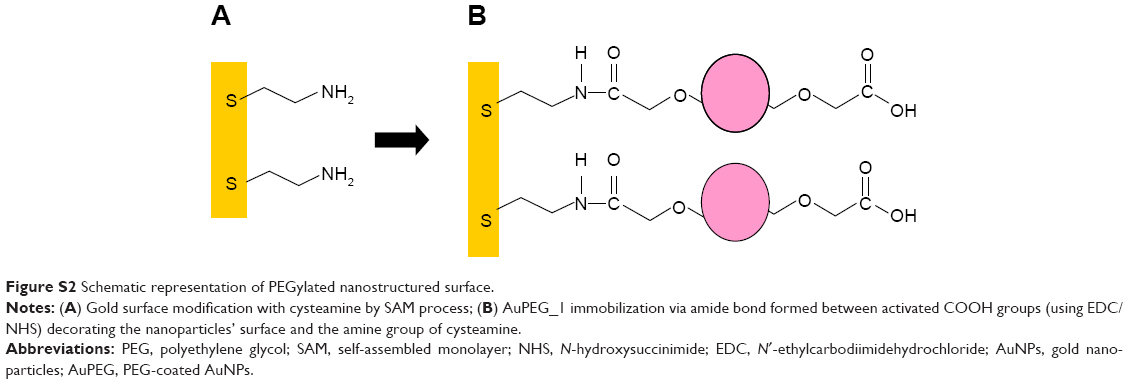 | Figure S2 Schematic representation of PEGylated nanostructured surface. |
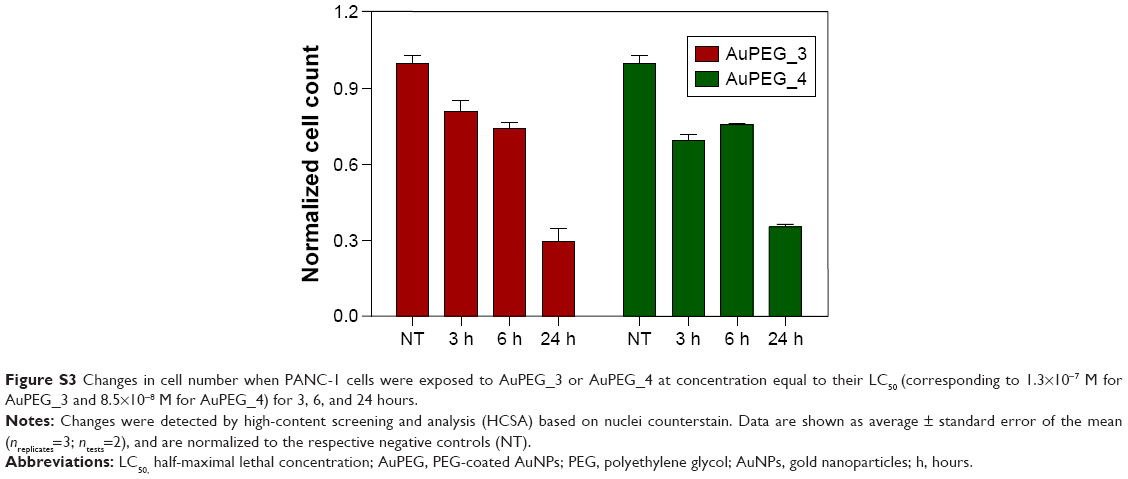 | Figure S3 Changes in cell number when PANC-1 cells were exposed to AuPEG_3 or AuPEG_4 at concentration equal to their LC50 (corresponding to 1.3×10⁻⁷ M for AuPEG_3 and 8.5×10⁻⁸ M for AuPEG_4) for 3, 6, and 24 hours. |
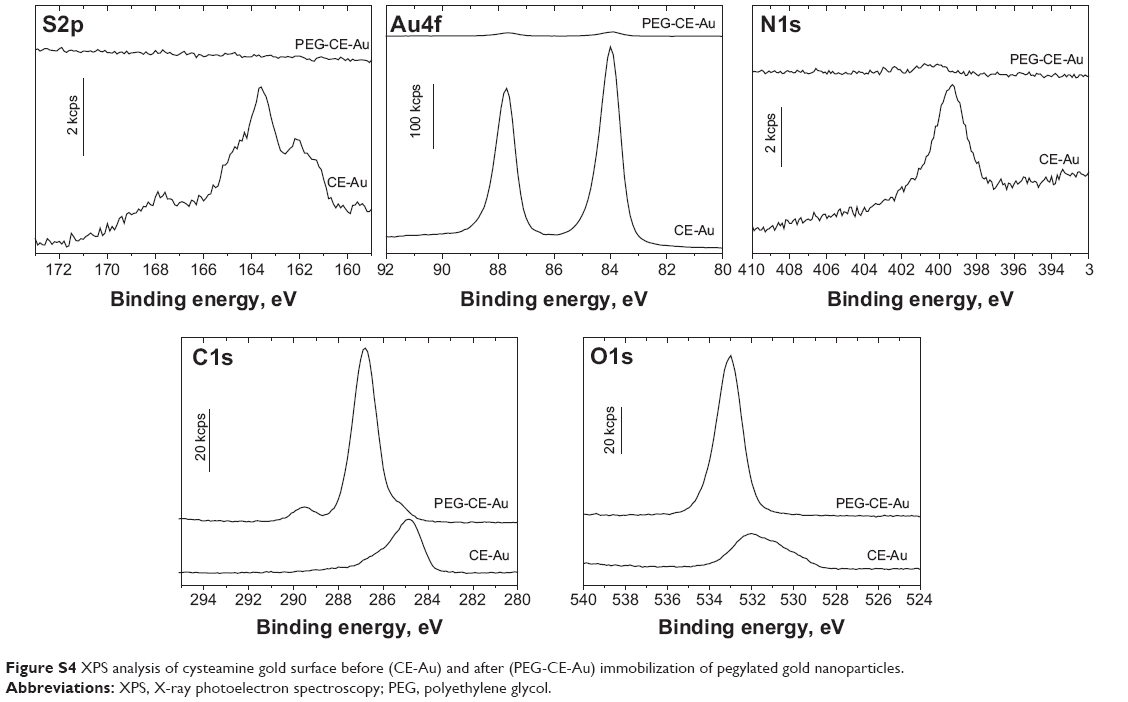 | Figure S4 XPS analysis of cysteamine gold surface before (CE-Au) and after (PEG-CE-Au) immobilization of pegylated gold nanoparticles. |
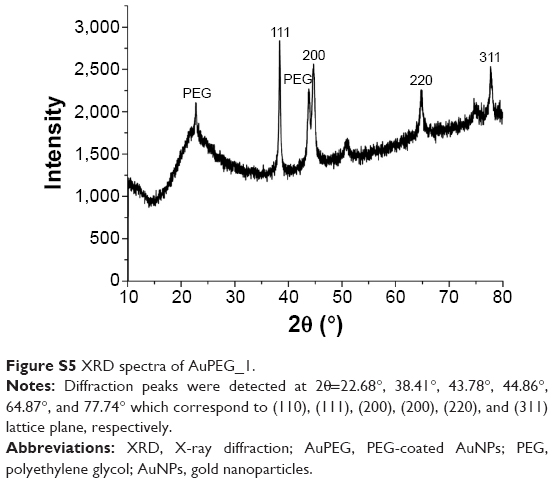 | Figure S5 XRD spectra of AuPEG_1. |
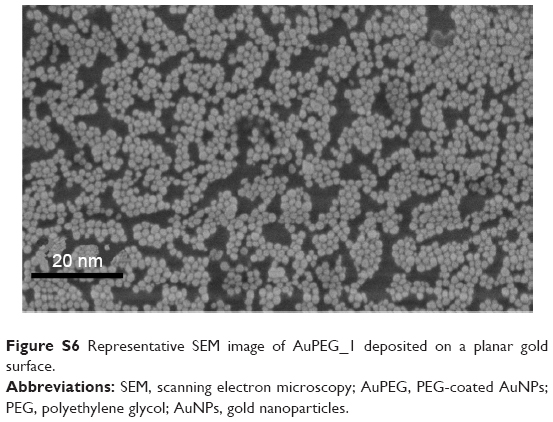 | Figure S6 Representative SEM image of AuPEG_1 deposited on a planar gold surface. |
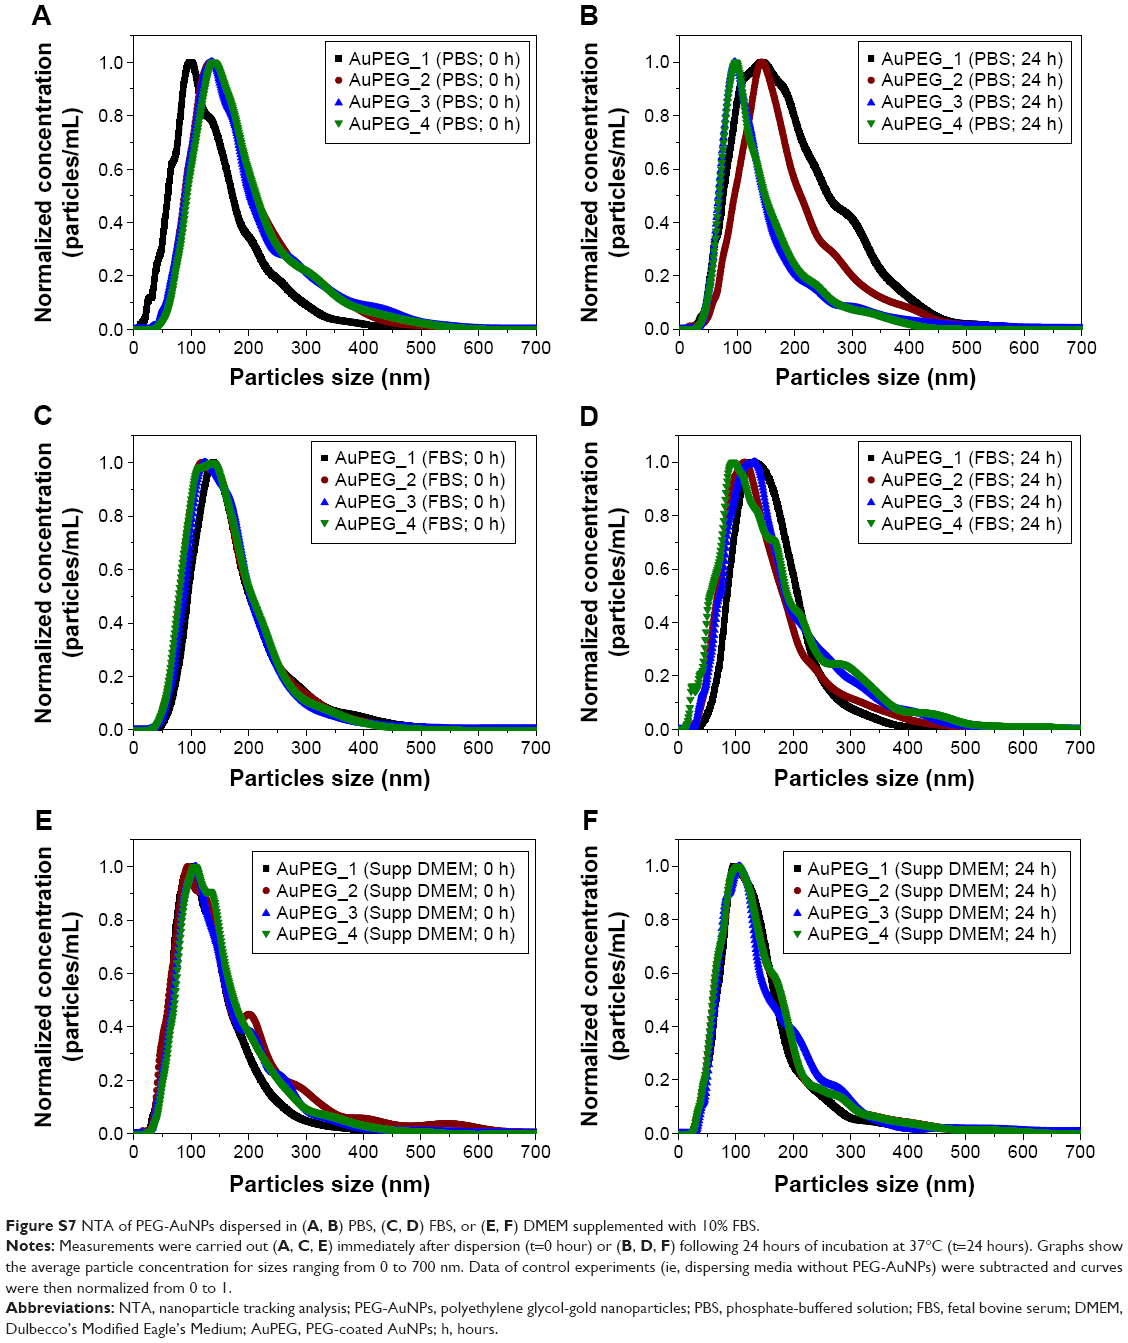 | Figure S7 NTA of PEG-AuNPs dispersed in (A, B) PBS, (C, D) FBS, or (E, F) DMEM supplemented with 10% FBS. |
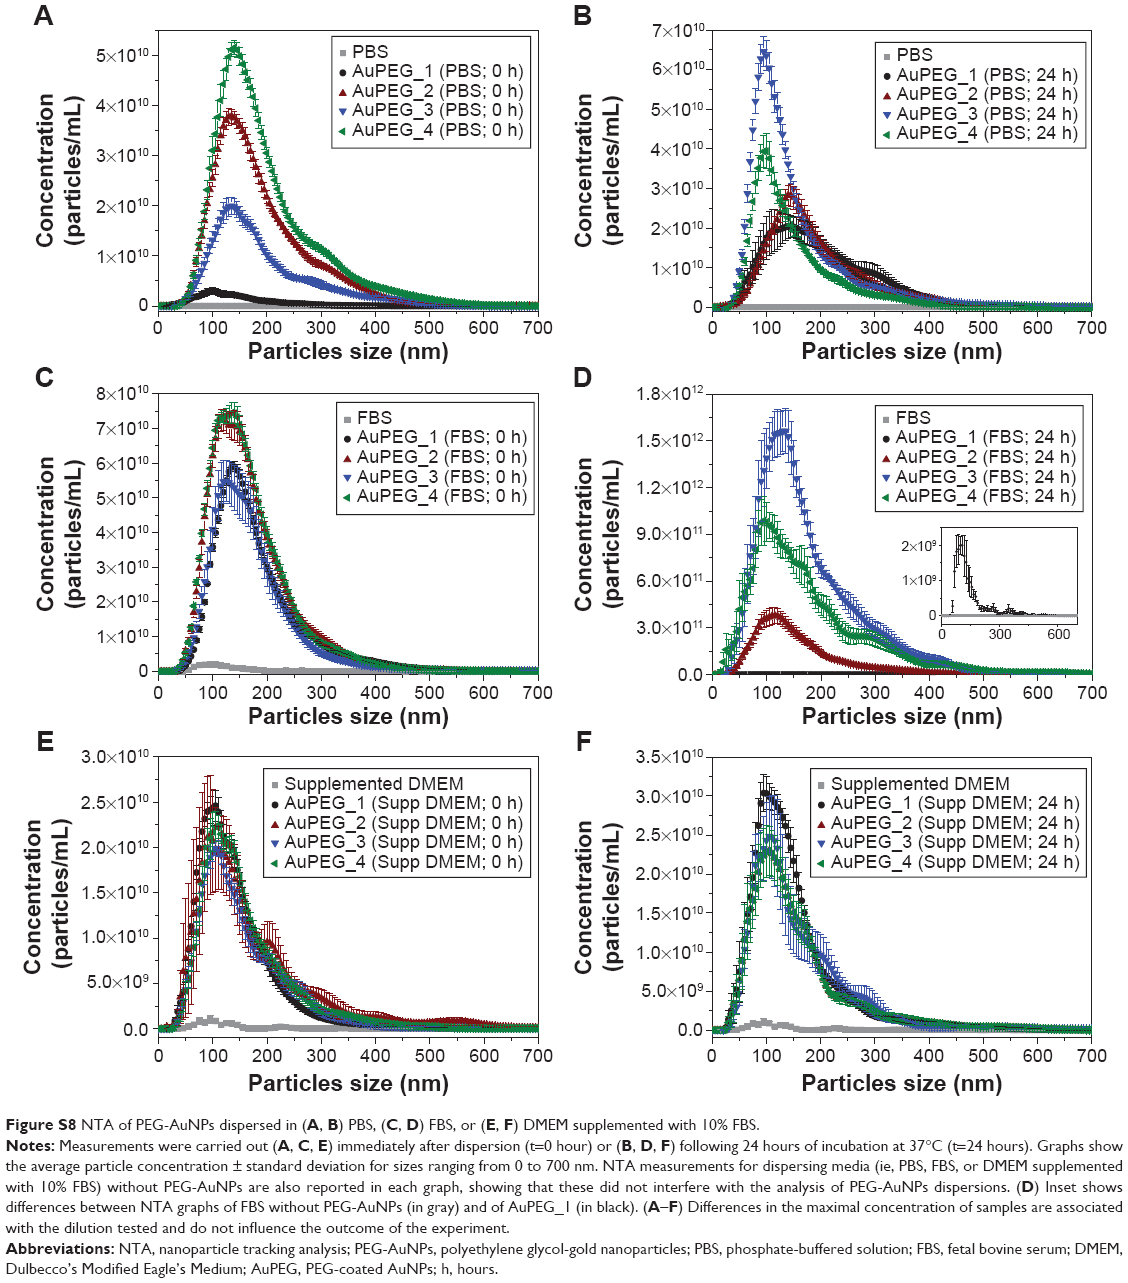 | Figure S8 NTA of PEG-AuNPs dispersed in (A, B) PBS, (C, D) FBS, or (E, F) DMEM supplemented with 10% FBS. |
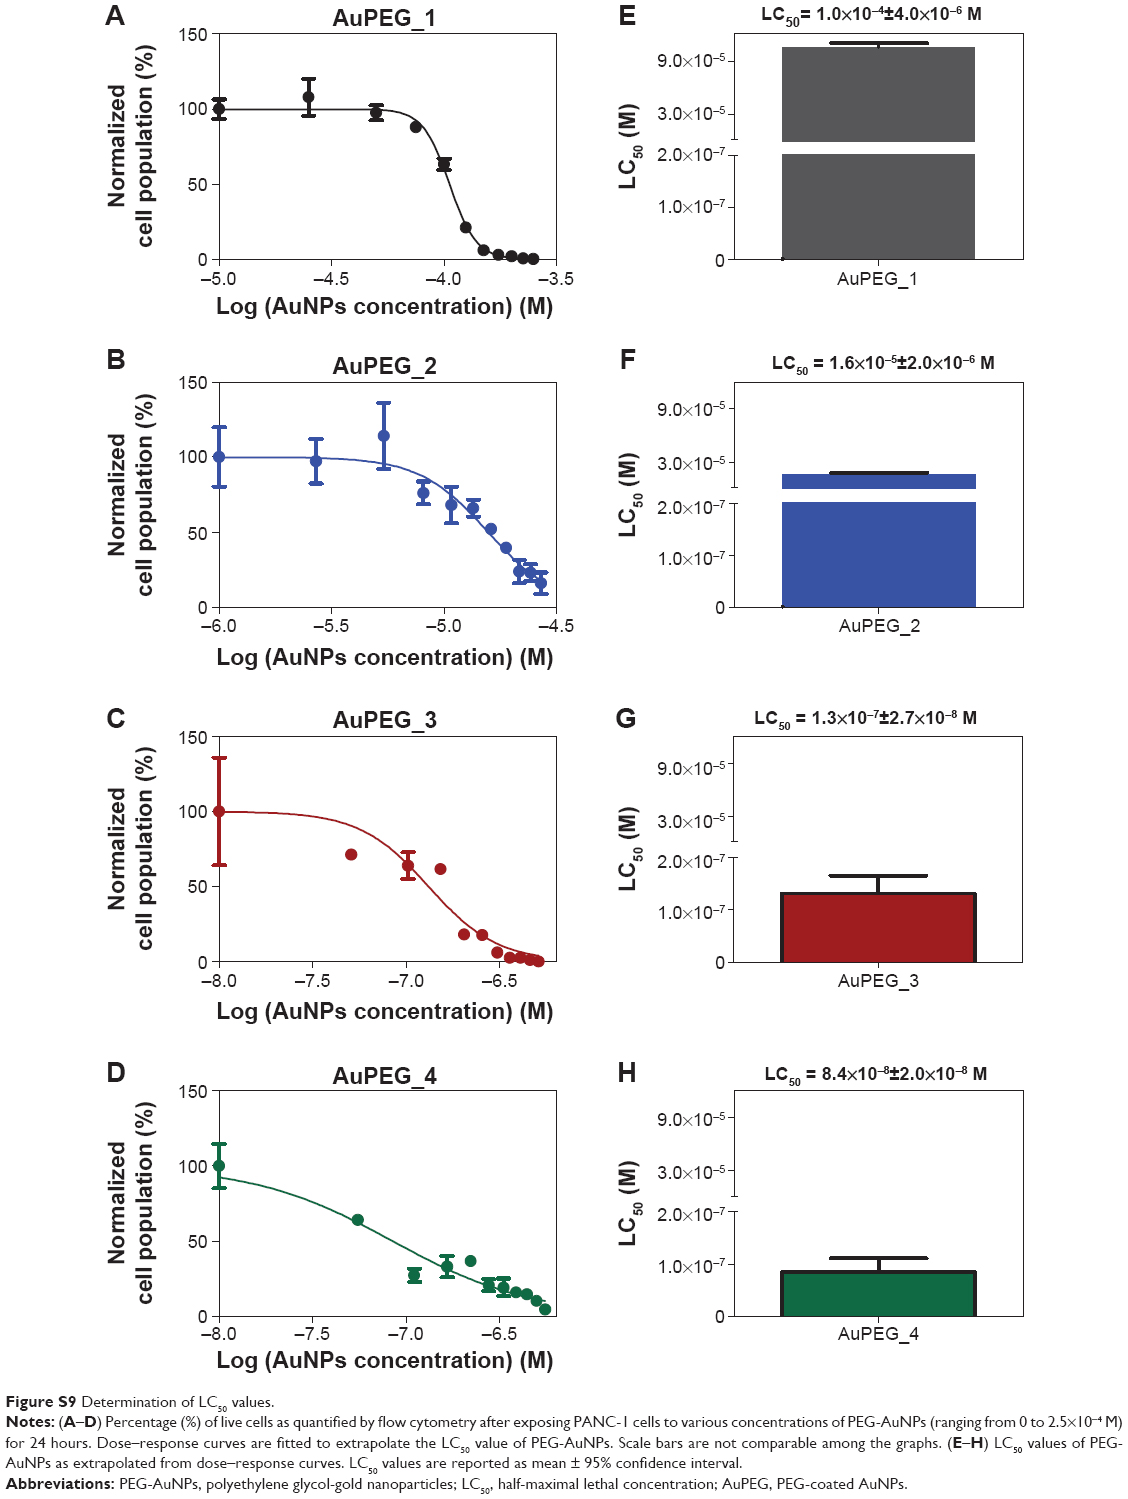 | Figure S9 Determination of LC50 values. |
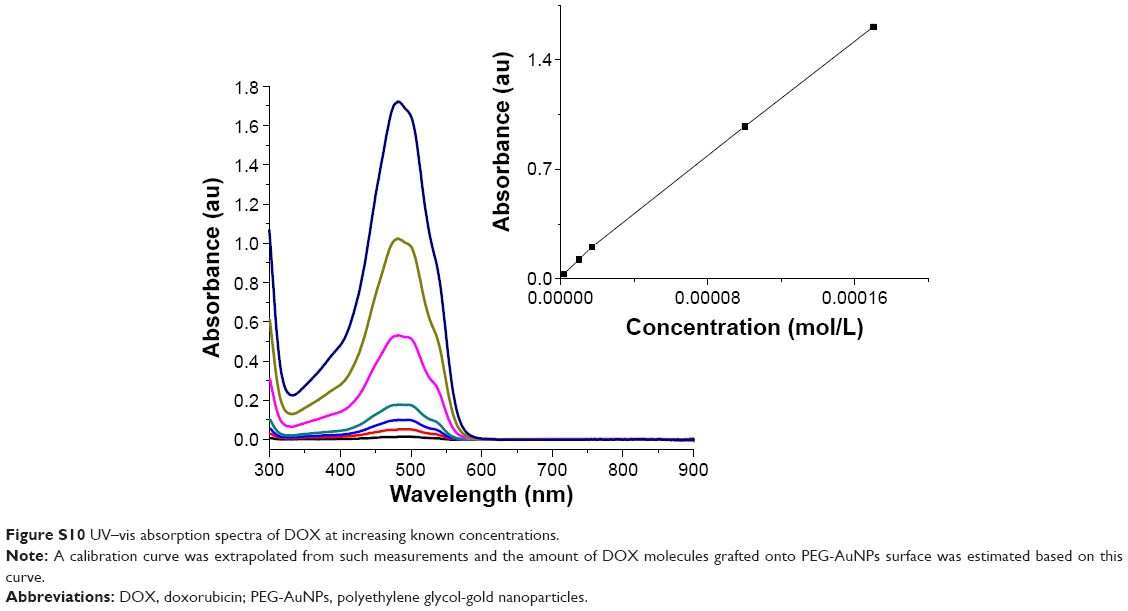 | Figure S10 UV–vis absorption spectra of DOX at increasing known concentrations. |
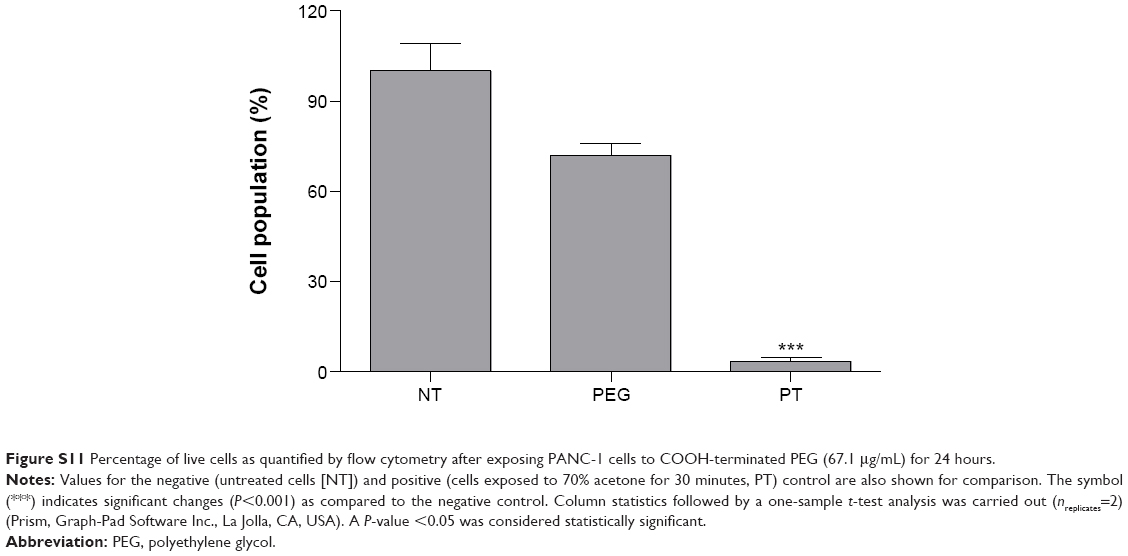 | Figure S11 Percentage of live cells as quantified by flow cytometry after exposing PANC-1 cells to COOH-terminated PEG (67.1 μg/mL) for 24 hours. |
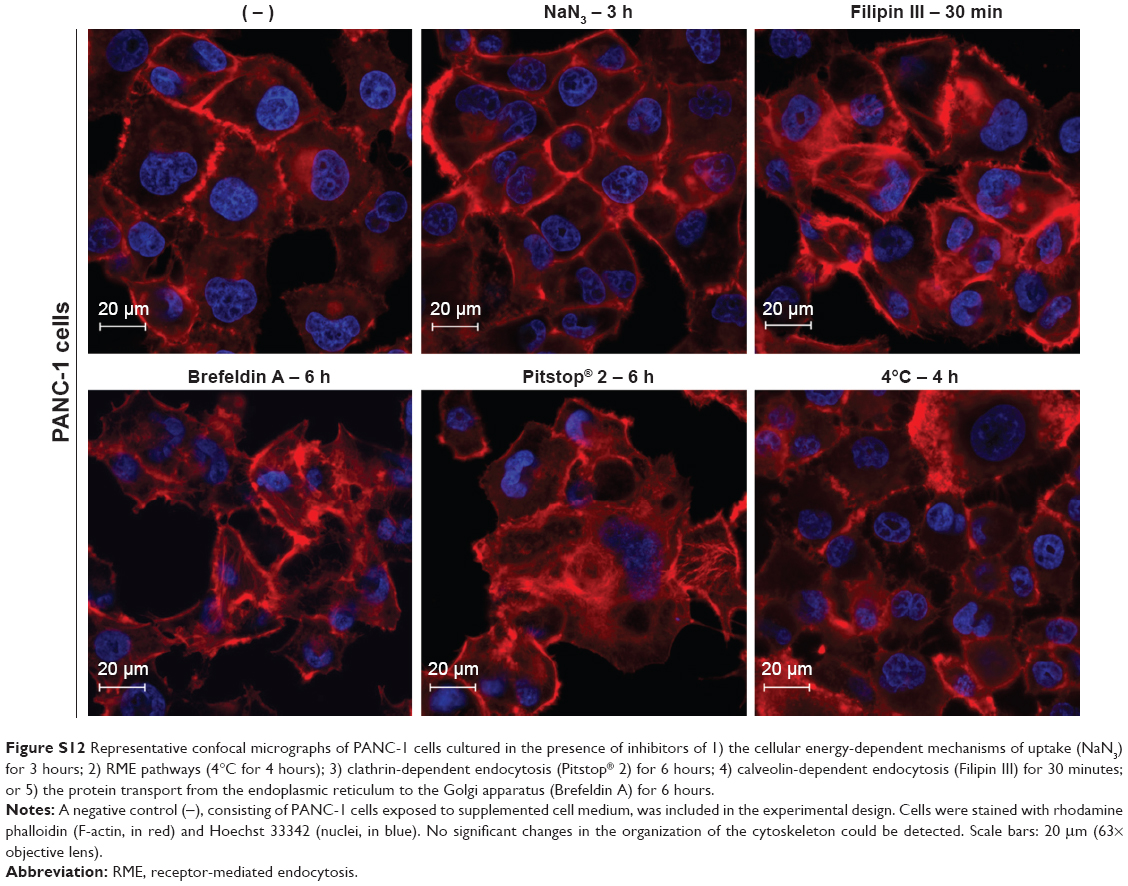 | Figure S12 Representative confocal micrographs of PANC-1 cells cultured in the presence of inhibitors of 1) the cellular energy-dependent mechanisms of uptake (NaN3) for 3 hours; 2) RME pathways (4°C for 4 hours); 3) clathrin-dependent endocytosis (Pitstop® 2) for 6 hours; 4) calveolin-dependent endocytosis (Filipin III) for 30 minutes; or 5) the protein transport from the endoplasmic reticulum to the Golgi apparatus (Brefeldin A) for 6 hours. |
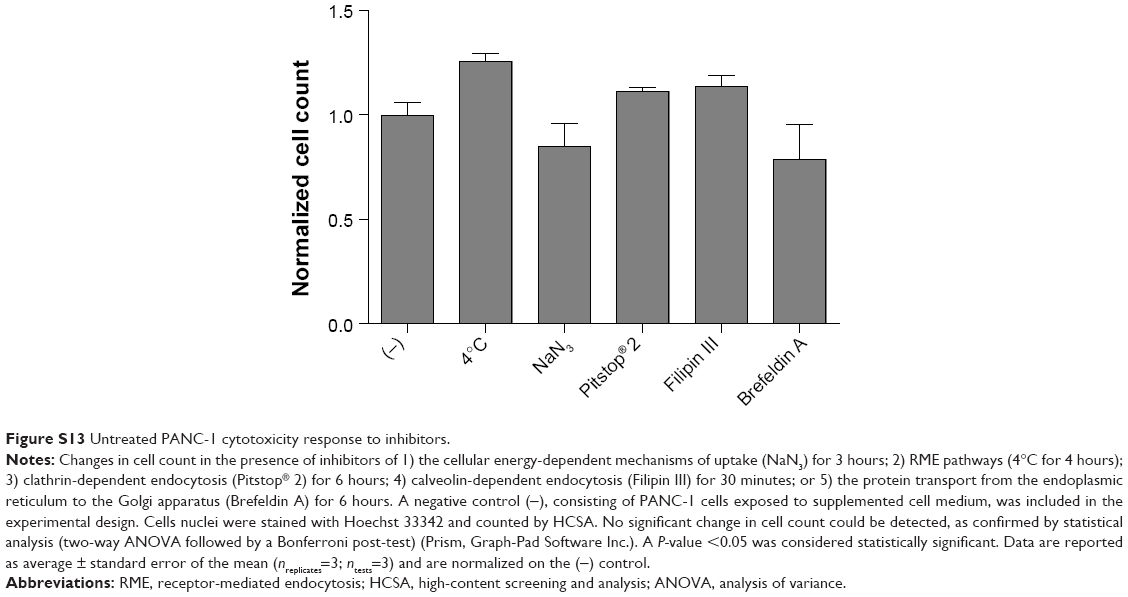 | Figure S13 Untreated PANC-1 cytotoxicity response to inhibitors. |
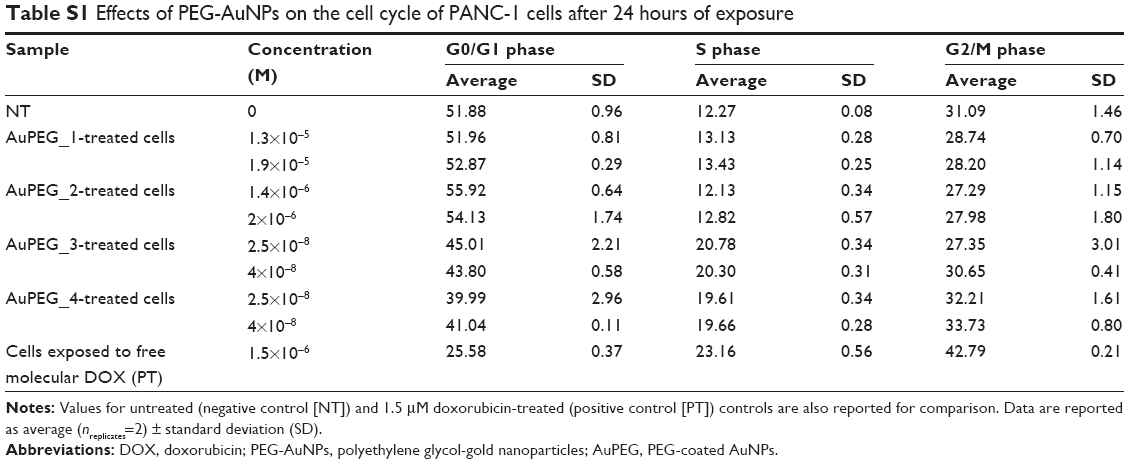 | Table S1 Effects of PEG-AuNPs on the cell cycle of PANC-1 cells after 24 hours of exposure |
Additional experiments
DOX release from PEG-AuNPs
The release studies were performed at room temperature. AuPEG_3 were dispersed at concentration of 1.2×10¹² particles/mL in 2.0 mL PBS or DMEM supplemented with 10% FBS in a 5 mL test tube. pH was adjusted to 7.2 or 4.2. The drug release study was conducted at room temperature with continuous stirring at 150 rpm. After incubation from 0 to 170 hours, the nanoparticles suspensions were centrifuged (14,000 rpm, 20 minutes) and dialyzed in PBS or supplemented DMEM (dialysis tubing Spectra/Por 3; molecular weight cut-off 3,500 Da; Serva Electrophoresis, Heidelberg, Germany). The amount of released DOX was analyzed by fluorescence spectroscopy at λexc of 489 nm. All measurements were carried out using LS50B fluorescence spectrometer (PerkinElmer, Villebon-sur-Yvette, France).The experiments were performed twice in triplicate for each of the samples. The amount of DOX release was determined by Equation 1. The calibration curves showed very good linearities (R2=0.9964 at pH 4.2, R2=0.9988 at pH 7.2, and R2=0.9998 in supplemented DMEM) in the relevant range of concentrations.
|
|
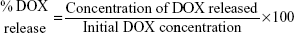
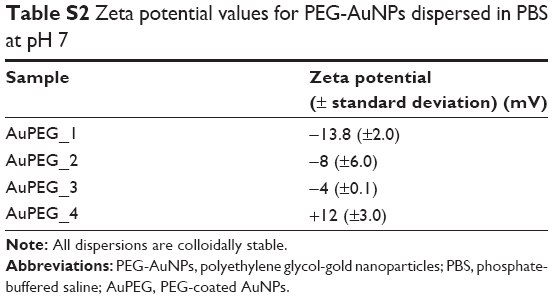 | Table S2 Zeta potential values for PEG-AuNPs dispersed in PBS at pH 7 |
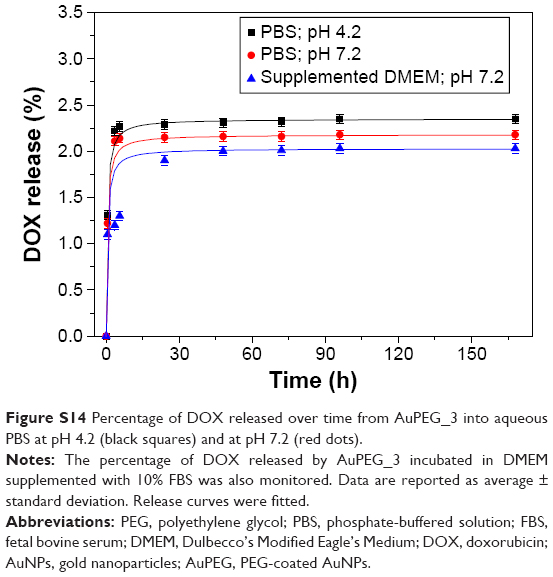 | Figure S14 Percentage of DOX released over time from AuPEG_3 into aqueous PBS at pH 4.2 (black squares) and at pH 7.2 (red dots). |
 © 2016 The Author(s). This work is published and licensed by Dove Medical Press Limited. The full terms of this license are available at https://www.dovepress.com/terms.php and incorporate the Creative Commons Attribution - Non Commercial (unported, v3.0) License.
By accessing the work you hereby accept the Terms. Non-commercial uses of the work are permitted without any further permission from Dove Medical Press Limited, provided the work is properly attributed. For permission for commercial use of this work, please see paragraphs 4.2 and 5 of our Terms.
© 2016 The Author(s). This work is published and licensed by Dove Medical Press Limited. The full terms of this license are available at https://www.dovepress.com/terms.php and incorporate the Creative Commons Attribution - Non Commercial (unported, v3.0) License.
By accessing the work you hereby accept the Terms. Non-commercial uses of the work are permitted without any further permission from Dove Medical Press Limited, provided the work is properly attributed. For permission for commercial use of this work, please see paragraphs 4.2 and 5 of our Terms.