")
Back to Archived Journals » Hypoxia » Volume 5
Targeted metabolomics in colorectal cancer: a strategic approach using standardized laboratory tests of the blood and urine
Authors Jerzak KJ, Laureano M, Elsharawi R , Kavsak P, Chan KKW, Dhesy-Thind SK, Zbuk K
Received 13 November 2016
Accepted for publication 18 February 2017
Published 24 May 2017 Volume 2017:5 Pages 61—66
DOI https://doi.org/10.2147/HP.S127560
Checked for plagiarism Yes
Review by Single anonymous peer review
Peer reviewer comments 4
Editor who approved publication: Prof. Dr. Dörthe Katschinski
Katarzyna J Jerzak,1,2 Marissa Laureano,3 Radwa Elsharawi,4 Peter Kavsak,5 Kelvin KW Chan,2,6 Sukhbinder K Dhesy-Thind,7 Kevin Zbuk7
1Department of Medicine, University of Toronto, Toronto, Ontario, 2Sunnybrook Odette Cancer Centre, University of Toronto, Toronto, 3Department of Medicine, McMaster University, Hamilton, Ontario, 4Department of Health Research Methods, Evidence and Impact, McMaster University, Hamilton, Ontario, 5Department of Pathology and Molecular Medicine, McMaster University, Hamilton, Ontario, 6Division of Biostatistics, Dalla Lana School of Public Health, University of Toronto, Toronto, 7Department of Oncology, McMaster University, Hamilton, Ontario, Canada
Background: Glycolytic markers have been detected in colorectal cancer (CRC) using advanced analytical methods.
Methods: Using commercially available assays, by-products of anaerobic metabolism were prospectively measured in the blood and urine of 20 patients with metastatic colorectal cancer (mCRC) and 20 patients with local disease. Twenty-four-hour urine citrate, plasma lactate, ketones, venous blood gas, anion gap, and osmolar gap were investigated. Results of patients with metastatic and local CRC were compared using two-sample t-tests or equivalent nonparametric tests. In addition, plasma total CO2 concentrations in our local hospital (5,931 inpatients and 1,783 outpatients) were compared retrospectively with those in our dedicated cancer center (1,825 outpatients) over 1 year.
Results: The average venous pCO2 was higher in patients with mCRC (50.2 mmHg; standard deviation [SD]=9.36) compared with those with local disease (42.8 mmHg; SD=8.98), p=0.045. Calculated serum osmolarity was higher in mCRC and attributed to concomitant sodium and urea elevations. In our retrospective analysis, plasma total CO2 concentrations (median=27 mmol/L) were higher in cancer patients compared to both hospital inpatients (median=23 mmol/L) and outpatients (median=24 mmol/L), p<0.0001.
Conclusion: Patients with mCRC had higher venous pCO2 levels than those with local disease. Although causation cannot be established, we hypothesize that pCO2 elevation may stem from a perturbed metabolism in mCRC.
Keywords: metabolism, metabolomics, biomarker, colorectal cancer, hypoxia, venous CO2
Background
It is well known that cancer cells have a perturbed metabolism and preferentially undergo glycolysis instead of oxidative phosphorylation. A hypoxic tumor microenvironment activates transcription of the hypoxia-inducible factor (HIF) α/β heterodimer, which binds to hypoxia response elements in target genes and results in the promotion of angiogenesis, cell survival, and a glycolytic metabolism.1 HIF-1α expression has been correlated with increased mortality among patients with cancer,2 including those with colorectal cancer (CRC).3
Despite significant progress in the field, it is still unclear why glycolysis is favored in malignant as opposed to healthy tissue. It is postulated that conversion of a lactate by-product into energy-rich glucose may offer a survival advantage and fuel malignant growth.4 Furthermore, glycolytic intermediates are used to produce fatty acids and nonessential amino acids, which support their high proliferation rate.5 This unique dependence on macromolecule synthesis and glucose/pyruvate flux, rather than adenosine triphosphate production, is often labeled as the “achilles heel” of cancer cells.4
Metabolomic signatures of CRC have been investigated by measuring metabolites in tumor tissue,6–9 as well as in the blood, urine, and feces of patients.10–14 As outlined in two recent reviews, the types of metabolites tested in such studies vary and have included amino acids, lipids, as well as small molecule intermediates of glycolysis and the tricarboxylic acid (TCA) cycle.12,13 In one of the larger and more rigorous studies, increases in pyruvate and decreases in fumarate were detected in patients with CRC compared with healthy controls, suggesting an upregulation of glycolysis and downregulation of the TCA cycle in CRC.15 Unfortunately, most metabolomic studies have been conducted using complex analytical platforms such as gas chromatography–mass spectrometry (GC/MS), liquid chromatography–mass spectrometry (LC/MS), tandem mass spectrometry, nuclear magnetic resonance spectroscopy as well as other platforms that are not available in day-to-day clinical practice.13 Hence, we attempted to identify a commercially available glycolytic biomarker in the blood and urine of patients with metastatic CRC (mCRC).
We strategically investigated conversion products of pyruvate (Figure 1), many of which are more metabolically stable and easily measurable. It is well known that pyruvate is converted to alanine and α-ketoglutarate via transamination to acetyl-CoA and citrate in the citric acid cycle, and that its fermentation results in lactate formation. Other by-products such as oxaloacetate, phosphoenolpyruvate, acetyl-CoA, bicarbonate, and carbon dioxide are also produced.16
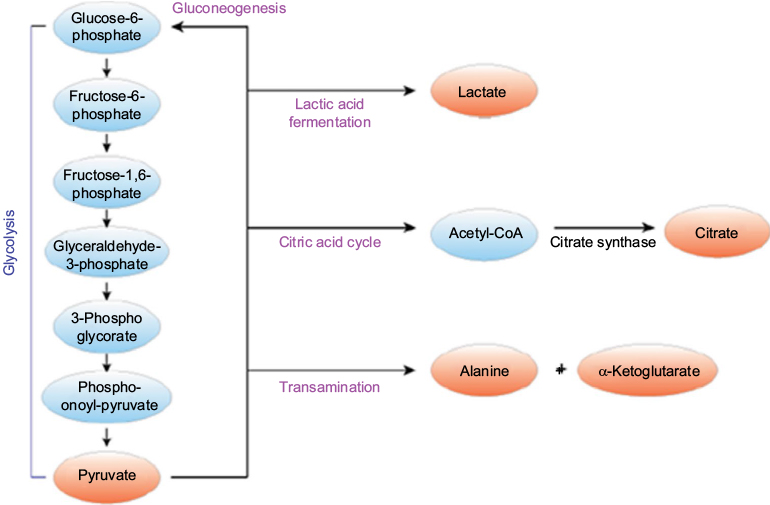 | Figure 1 Schematic representation of pyruvate metabolism, illustrating selected byproducts. |
In an effort to identify a cost-effective biomarker for CRC, we selected readily available assays that could be performed in most clinical laboratories. Rather than pursuing complex metabolomics profiling, we hypothesized that charged and uncharged small molecule metabolites of CRC could be detected using standard anion gap (AG) and osmolar gap tests. In addition, we performed venous blood gases (VBGs) to detect aberrations in bicarbonate and carbon dioxide levels among study participants.
Methods
Twenty patients with metastatic adenocarcinoma and 20 patients with local adenocarcinoma of the colon or rectum were recruited in Hamilton, ON, Canada. The charts of patients with CRC who attended a medical oncology consultation or follow-up visit at the Juravinski Hospital and Cancer Centre (JHCC) were screened from March 2013 to November 2013. Patients attending a consultation or follow-up visit for CRC in surgical clinics at St. Joseph’s Hospital were screened from July 2013 to November 2013. Exclusion criteria included resection of the primary tumor or metastasectomy with no remaining macroscopic disease, insulin-dependent diabetes, chemotherapy, or radiation therapy within 2 weeks, infection requiring antibiotics, hospitalization within 2 weeks, and creatinine clearance <30 mL/min.
After recruitment, patients received a telephone reminder to complete their urine and blood tests, all of which were performed at recruiting hospitals. For patients with local CRC, all tests were completed prior to definitive cancer surgery. Completion rates for the majority of blood tests were very good, ranging from 63% for the AG to 83% for the calculated osmolarity. However, the adherence to 24-hour urine tests was poor; 15 of 20 patients with mCRC and 7 of 20 patients with local disease completed this test. The biggest contributors to low completion rates were, inconvenience in obtaining a 24-hour urine sample, followed by a requirement for specialized nursing to perform a venous blood draw.
Twenty-four-hour urine citrate, blood lactate, ketones, VBG, and indirect markers of small molecules, both charged (AG) and uncharged (osmolar gap), were investigated. The AG in mmol/L was calculated as follows: (AG=Na+ – [Cl−+HCO3−]), where Na+ is the sodium concentration, Cl− is the chloride concentration, and HCO3− is the bicarbonate level in the blood. In clinical practice, the AG is typically used to delineate the cause of metabolic acidosis and identify the presence of toxic alcohols, and other charged small molecules.17 In our study, we used the AG to probe abnormalities in cancer cell metabolism (such as derangements in lactic acid production or ketogenesis), which would theoretically result in excess production of organic acids.
The serum osmolarity in mmol/kg was calculated as follows: (osmolarity=2×[Na+] + glucose + urea], and the osmolar gap was the difference between measured and calculated osmolarity. Although it was not included in the battery of study investigations, the alanine aminotransferase (ALT) level was also recorded if performed within 2 weeks of the study investigations. The ALT enzyme was investigated, because it catalyzes the conversion of pyruvate and glutamate to alanine and α-ketoglutarate in a reversible transamination reaction.16 The coefficient of variation for all measured investigations was <7.0%.
Results of patients with mCRC were compared with 1) the local CRC cohort using two-sample t-tests and the equivalent nonparametric test for variables that were not normally distributed, as well as 2) the normal reference interval via proportions using SAS University Edition. Normality was assessed using the Shapiro–Wilk test, as well as histograms and Q–Q plots. Two-sided p-values <0.05 were considered statistically significant. We did not prespecify a difference in laboratory values that would be considered clinically significant, but rather performed an exploratory analysis.
To further investigate the hypothesis-generating results that were obtained in our pilot study, we also retrospectively investigated plasma total CO2 levels in 9,539 patients between January and December 2014. Plasma total CO2 concentrations in our local hospital (5,931 inpatients and 1,783 outpatients) were compared with those in our dedicated cancer center (1,825 outpatients) using the Kruskal–Wallis and Conover–Iman tests. Indications for plasma total CO2 testing were not recorded. Furthermore, demographic information of these patients, including their age, comorbidities, presence or absence of cancer, cancer site (CRC vs. other cancer), or extent of their disease (local vs. metastatic), were not available.
The study was approved by the Hamilton Integrated Research Ethics Board and all patients gave written consent to participate.
Results
Forty patients with biopsy-proven adenocarcinoma of the colon or rectum participated in our study. Their average age was 67±13 years (range 35–86); 20 had a diagnosis of metastatic CRC and 20 had local disease. The location of metastatic disease was available for 15 patients: 7 had metastases to the liver, 2 had lung metastases, 3 had both liver and lung involvement, and 4 had other sites of disease. Of 35 patients whose past medical history was documented, 4 patients (3 with metastatic and 1 with local CRC) had a history of chronic obstructive pulmonary disease. Unfortunately, due to the nature of this single-center pilot study, we were unable to rigorously match patients for possible confounding variables, including chronic respiratory conditions and/or extent of disease in the local and metastatic settings.
All participants had local or metastatic CRC at the time of their study investigations. Patients who had definitive surgery for local CRC or curative-intent surgery in the metastatic setting were excluded, so that metabolic by-products of the cancer could potentially be detected. However, it is notable that many patients with mCRC were felt to have indolent disease because they were on a break from active therapy for a time period that ranged from 2 weeks to 12 months.
The average venous pCO2 (50.2 mmHg [standard deviation {SD}=9.36]) among patients with metastatic CRC borders the upper limit of normal and is statistically higher than that of patients with local CRC (42.8 mmHg [SD=8.98]), p=0.045. Venous pCO2 levels were greater than the upper limit of normal in 47% (n=9/19) of patients with mCRC and 27% (n=3/11) of those with local disease. Among 24 patients without chronic lung disease, 25% of patients with local CRC (2 of 8) and 43% of those with metastatic disease (6 of 14) had an elevated venous pCO2. Neither of the two patients with known lung metastases had an elevated venous pCO2.
The calculated serum osmolarity was statistically higher among patients with metastatic CRC (median=293.0, interquartile range [IQR]: 290.0–296.0) when compared with those with local disease (median=290.0, IQR: 282.0–292.0), p=0.018. Sodium and urea values were also higher in patients with mCRC (Table 1). The measured osmolarity, calculated osmolar gap, lactate, ALT, AG, pH, calculated bicarbonate (derived from the VBG pH and pCO2 results), and 24-hour urine citrate did not vary significantly between the two groups. Serum ketones were negative in all patients.
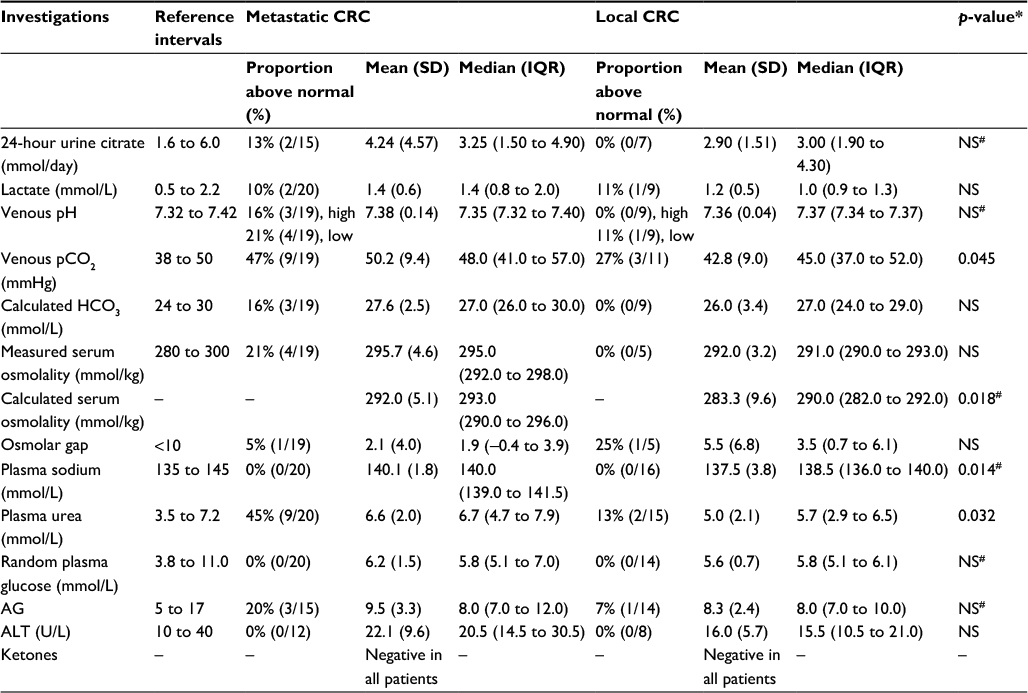 | Table 1 Differences in laboratory investigations between patients with metastatic and local CRC Notes: *Two-sample t-tests were employed for normally distributed variables and the equivalent nonparametric (two-sample Wilcoxon) test was employed for the remaining variables. In all cases where statistically significant results were identified, the corresponding chi-square test of proportions was also statistically significant. #Not normally distributed. Abbreviations: ALT, alanine aminotransferase; AG, anion gap; CRC, colorectal cancer; IQR, interquartile range; SD, standard deviation; NS, non-significant. |
In our retrospective analysis, plasma total CO2 concentrations of patients in a dedicated cancer center were statistically higher than that of a general population in a local hospital (Table 2). Among the outpatients, 13% with cancer had a total CO2 concentration above the upper limit of normal (>29 mmol/L), compared with only 1% of the general hospital outpatient population (p<0.0001).
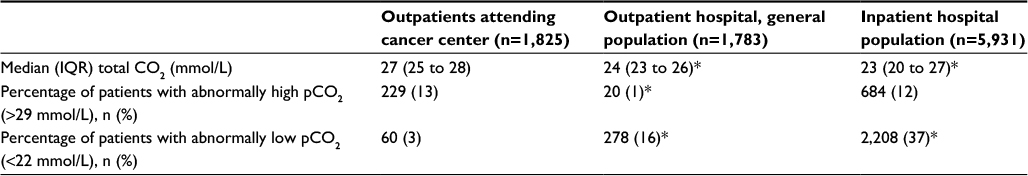 | Table 2 Values of plasma total CO2 in cancer patients and in the hospital inpatient and outpatient populations, from January to December 2014 Note: *p-value <0.05 when compared with cancer center population. Abbreviation: IQR, interquartile range. |
Discussion
The goal of this pilot study was to identify a glycolytic biomarker in the blood or urine of 40 patients with CRC. Conversion products of the metabolically unstable pyruvate, the end-product of glycolysis, were strategically assessed. In addition, the AG served as a surrogate for charged small molecules, and the osmolar gap indicated the presence of uncharged small molecules in the blood. The mean value of study investigations fell within the normal range for both the metastatic and local disease cohorts. However, the calculated osmolarity and venous pCO2 were significantly higher among patients with metastatic disease. Twenty-four-hour urine citrate, plasma lactate, ketones, ALT, pH, bicarbonate, and indirect markers of small charged molecules (AG) did not differ significantly between the local and metastatic cohorts.
The significance of a higher calculated serum osmolarity among patients with metastatic CRC is unclear. The serum osmolarity is calculated using sodium, urea, and glucose levels; hence, higher values among metastatic patients can be attributed to statistically higher sodium and urea levels in this cohort. While the calculated serum osmolarity is not particularly informative in isolation, a difference between the calculated and measured values (commonly referred to as the “osmolar gap”) may herald the presence of uncharged small molecules in the serum. Traditionally, an elevated osmolar gap may represent ketones in patients with diabetic ketoacidosis or toxic alcohols in those who present with a suspected overdose. However, an elevated osmolar gap may be due to any uncharged small molecules, including tumor metabolites. In our pilot study, the osmolar gap was within normal limits and it did not differ significantly among the metastatic and local cohorts.
As a direct product of glycolysis, pyruvate can be metabolized into acetyl-CoA, CO2, and nicotinamide adenine dinucleotide (NADH) by pyruvate dehydrogenase in the mitochondria.18 CO2 readily diffuses across the plasma membrane and forms an equilibrium with H2CO3. Hence, to maintain acid–base homeostasis, intracellular hydrogen ions are transported out of the cell via Na+/H+ exchangers.19 Additional CO2 can ultimately diffuse from the extracellular space and into capillaries, where it is detected in the venous system. Therefore, the increased pCO2 in the blood of patients with metastatic CRC may represent an increase in glycolytic activity due to higher tumor burden. This mechanism is supported by experiments in rodents, which have demonstrated that increases in intratumor pCO2 can also be detected in lymphatic fluid and venous plasma, although to a lesser extent.20
While an elevated pCO2 is postulated to be due to an increase in glycolytic activity, the underlying mechanism cannot be established in this exploratory pilot study. We carefully examined the medical records of all patients to exclude other potential causes of pCO2 elevation, but neither lung metastases nor chronic lung diseases could explain our findings. Furthermore, it is intriguing that cancer patients had statistically higher total CO2 concentrations than either the hospital inpatient or outpatient populations in our retrospective review.
It is conceivable that a greater extent of intratumoral hypoxia among patients with metastatic cancer results in pCO2 elevation.3 Unfortunately, it is difficult to prove causality because the measurement of intratumoral hypoxia is not well validated nor easily accomplished. The gold standard involves pO2 histography with an Eppendorf microelectrode in fresh tumor specimens. This is not feasible due to the challenge of accessing tumors intraoperatively and a lack of specialized equipment. In future correlative studies, measurement of intratumoral hypoxia via immunohistochemical staining of fresh tumor samples20 or noninvasive imaging methods21 could be considered. Assessment of disease-free and overall survival outcomes would also be warranted in future validation cohorts.
Previous studies have reported elevations in blood lactate7 and urine citrate10,22 in patients with CRC compared with healthy controls, neither of which was elevated in our local or metastatic study cohorts. Lactate has not been consistently elevated in metabolomic studies; in fact, in a GC/MS study of 242 patients, blood lactate levels were lower in those with CRC (n=119) compared to healthy volunteers (n=123).23 Although the reasons for these findings are not conclusive, it is possible that any excess lactate is quickly converted into glucose to support malignant growth.4 Unfortunately, our study was underpowered to detect a statistically significant difference in urine citrate between metastatic and local CRC cohorts.
Limitations of this study include a small sample size, especially for 24-hour urine citrate levels. Further, patients with metastatic disease had relatively indolent disease biology and, as required for study entry, all assessed patients in this subgroup were on a break from chemotherapy or had not yet required treatment for their low burden disease. Hence, the proposed glycolytic biomarkers are likely underestimated in this study.
The fact that our large retrospective review confirmed the results of our hypothesis-generating pilot study is intriguing. In an era of complex genomics and detection of circulating tumor DNA, it possible that a simple laboratory test, a VBG pCO2, or even plasma total CO2 could ultimately serve as a prognostic biomarker in cancer patients or aid in the early detection of metastatic disease. Given emerging therapies that target tumor metabolism, predictive value of a glycolytic biomarker is also possible.
Conclusion
In our small prospective study, venous pCO2 levels were statistically higher among patients with metastatic CRC when compared to those with local disease. A retrospective review confirmed that patients with CRC and other malignancies have statistically higher levels of total CO2 than that of the general population. Hence, it is possible that this rarely measured but commercially available assay may serve as novel cancer biomarker. Future studies to validate these results are warranted, and if consistent, evaluation of venous pCO2 as a possible prognostic biomarker in colorectal and other cancers may be indicated.
Acknowledgment
This study was funded by the Physicians’ Services Incorporated Foundation (PSI) grant.
Disclosure
The authors report no conflicts of interest in this work.
References
Brahimi-Horn MC, Chiche J, Pouyssegur J. Hypoxia signalling controls metabolic demand. Curr Opin Cell Biol. 2007;19(2):223–229. | ||
Harris AL. Hypoxia -- a key regulatory factor in tumour growth. Nat Rev Cancer. 2002;2(1):38–47. | ||
De Jaeger K, Kavanagh MC, Hill RP. Relationship of hypoxia to metastatic ability in rodent tumours. Br J Cancer. 2001;84(9):1280–1285. | ||
Semenza G. Tumor metabolism: cancer cells give and take lactate. J Clin Invest. 2008;118(12):3835–3837. | ||
Munoz-Pinedo C, El Mjiyad N, Ricci JE. Cancer metabolism: current perspectives and future directions. Cell Death Dis. 2012;3:e248. | ||
Qiu Y, Cai G, Zhou B, et al. A distinct metabolic signature of human colorectal cancer with prognostic potential. Clin Cancer Res. 2014;20(8):2136–2146. | ||
Zhu J, Djukovic D, Deng L, et al. Colorectal cancer detection using targeted serum metabolic profiling. J Proteome Res. 2014;13(9):4120–4130. | ||
Denkert C, Budczies J, Weichert W, et al. Metabolite profiling of human colon carcinoma-deregulation of TCA cycle and amino acid turnover. Mol Cancer. 2008;7:72. | ||
Hirayama A, Kami K, Sugimoto M, et al. Quantitative metabolome profiling of colon and stomach cancer microenvironment by capillary electrophoresis time-of-flight mass spectrometry. Cancer Res. 2009;69(11):4918–4925. | ||
Cheng Y, Xie G, Chen T, et al. Distinct urinary metabolic profile of human colorectal cancer. J Proteome Res. 2012;11(2):1354–1363. | ||
Farshidfar F, Weljie AM, Kopciuk KA, et al. A validated metabolomic signature for colorectal cancer: exploration of the clinical value of metabolomics. Br J Cancer. 2016;115(7):848–857. | ||
Goveia J, Pircher A, Conradi LC, et al. Meta-analysis of clinical metabolic profiling studies in cancer: challenges and opportunities. EMBO Mol Med. 2016;8(10):1134–1142. | ||
Antonowicz S, Kumar S, Wiggins T, Markar SR, Hanna GB. Diagnostic metabolomic blood tests for endoluminal gastrointestinal cancer-a systematic review and assessment of quality. Cancer Epidemiol Biomarkers Prev. 2016;25(1):6–15. | ||
de Boer NK, de Meij TG, Oort FA, et al. The scent of colorectal cancer: detection by volatile organic compound analysis. Clin Gastroenterol Hepatol. 2014;12(7):1085–1089. | ||
Tan B, Qiu Y, Zou X, et al. Metabonomics identifies serum metabolite markers of colorectal cancer. J Proteome Res. 2013;12(6):3000–3009. | ||
Gray LR, Tompkins SC, Taylor EB. Regulation of pyruvate metabolism and human disease. Cell Mol Life Sci. 2014;71(13):2577–2604. | ||
Kraut JA, Madias NE. Metabolic acidosis: pathophysiology, diagnosis and management. Nat Rev Nephrol. 2010;6(5):274–285. | ||
Pouyssegur J, Dayan F, Mazure NM. Hypoxia signalling in cancer and approaches to enforce tumour regression. Nature. 2006;441(7092):437–443. | ||
Gullino PM, Grantham FH, Smith SH, Haggerty AC. Modifications of the acid-base status of the internal milieu of tumors. J Natl Cancer Inst. 1965;34(6):857–869. | ||
Rademakers SE, Lok J, van der Kogel AJ, Bussink J, Kaanders JH. Metabolic markers in relation to hypoxia; staining patterns and colocalization of pimonidazole, HIF-1alpha, CAIX, LDH-5, GLUT-1, MCT1 and MCT4. BMC Cancer. 2011;11:167. | ||
Sun X, Niu G, Chan N, Shen B, Chen X. Tumor hypoxia imaging. Mol Imaging Biol. 2011;13(3):399–410. | ||
Qiu Y, Cai G, Su M, et al. Urinary metabonomic study on colorectal cancer. J Proteome Res. 2010;9(3):1627–1634. | ||
Nishiumi S, Kobayashi T, Ikeda A, et al. A novel serum metabolomics-based diagnostic approach for colorectal cancer. PLoS One. 2012;7(7):e40459. |
 © 2017 The Author(s). This work is published and licensed by Dove Medical Press Limited. The full terms of this license are available at https://www.dovepress.com/terms.php and incorporate the Creative Commons Attribution - Non Commercial (unported, v3.0) License.
By accessing the work you hereby accept the Terms. Non-commercial uses of the work are permitted without any further permission from Dove Medical Press Limited, provided the work is properly attributed. For permission for commercial use of this work, please see paragraphs 4.2 and 5 of our Terms.
© 2017 The Author(s). This work is published and licensed by Dove Medical Press Limited. The full terms of this license are available at https://www.dovepress.com/terms.php and incorporate the Creative Commons Attribution - Non Commercial (unported, v3.0) License.
By accessing the work you hereby accept the Terms. Non-commercial uses of the work are permitted without any further permission from Dove Medical Press Limited, provided the work is properly attributed. For permission for commercial use of this work, please see paragraphs 4.2 and 5 of our Terms.