")
Back to Journals » OncoTargets and Therapy » Volume 14
Tandem Mass Tag-Based Proteomic Analysis of Potential Biomarkers for Hepatocellular Carcinoma Differentiation
Authors Wang W, Li Q, Huang G, Lin BY, Lin D, Ma Y, Zhang Z, Chen T, Zhou J
Received 4 August 2020
Accepted for publication 28 January 2021
Published 12 February 2021 Volume 2021:14 Pages 1007—1020
DOI https://doi.org/10.2147/OTT.S273823
Checked for plagiarism Yes
Review by Single anonymous peer review
Peer reviewer comments 3
Editor who approved publication: Dr Sanjay Singh
Wei Wang,1,* Qiang Li,2,* Ge Huang,3 Bing-yao Lin,1 Dongzi Lin,1 Yan Ma,1 Zhao Zhang,4 Tao Chen,1 Jie Zhou1
1Department of Laboratory, Foshan Fourth People’s Hospital, Foshan, 528000, People’s Republic of China; 2Department of General Surgery, The First Affiliated Hospital of Jinan University, Guangzhou, 510000, People’s Republic of China; 3Intensive Care Unit, Foshan Fourth People’s Hospital, Foshan, 528000, People’s Republic of China; 4Research and Development Centre, South China Institute of Biomedicine, Guangdonglongsee Biomedical Co., Ltd, Guangzhou, 510000, People’s Republic of China
*These authors contributed equally to this work
Correspondence: Zhao Zhang
Research and Development Centre, South China Institute of© Biomedicine, Guangdonglongsee Biomedical Co., Ltd, 5/F Building A, No. 83 Ruihe Road, Huangpu District, Guangzhou, 510535, People’s Republic of China
Email [email protected]
Ge Huang
Intensive Care Unit, Foshan Fourth People’s Hospital, No. 106, Jinlan Road, Foshan, 528000, People’s Republic of China
Email [email protected]
Purpose: The poor prognosis of hepatocellular carcinoma (HCC) urgent us to discover early and effective biomarkers. In this study, we applied tandem mass tag (TMT)-based proteomic analysis to discover potential protein markers for HCC identification and differentiation.
Patients and Methods: Fifteen patients, well-differentiated (G1, N = 5), moderate-differentiated (G2, N = 5), and poorly differentiated (G3, N = 5), with 30 matched pair tissues (both tumor and adjacent non-tumor tissues derived from the same patient) were enrolled. All samples were subjected to TMT labeling and LC−MS/MS analysis. The identified proteins were subsequently assigned to GO and KEGG for predicting function. The identified protein candidates were validated using immunohistochemistry (IHC).
Results: A total of 1010 proteins were identified. Of these, 154 differentially expressed proteins (DEPs), 100 up-regulated and 54 down-regulated, were found between tumor and adjacent non-tumor tissues; 12 DEPs, 9 up-regulated and 3 down-regulated, were found between G1 and G3 tissues; 8 DEPs, 5 up-regulated and 3 down-regulated, were found between G1 and G2 tissues; 11 DEPs, 8 up-regulated and 3 down-regulated, were found between G2 and G3 tissues. Among them, ASS1 and CPS1 were significantly up-regulated while UROD and HBB were significantly down-regulated in G3 compared with G1 and G2 tumors. Three proteins, CYB5A, FKBP11 and YBX1, were significantly up-regulated in G1 compared with both G2 and G3 tumors. The 7 biomarker candidates were further verified by IHC.
Conclusion: A variety of DEPs related to the histological differentiation of HCC were identified, among which ASS1, CPS1, URPD and HBB proteins were potential biomarkers for distinguishing poorly differentiated HCC, while CYB5A, FKBP11 and YBX1 were potential biomarkers for distinguishing well-differentiated HCC. Our findings may further provide a new insight facilitating the diagnosis and prognosis of HCC.
Keywords: tandem mass tag, proteomic analysis, hepatocellular carcinoma, histological differentiation, diagnosis, prognosis
Introduction
Hepatocellular carcinoma (HCC) is the most prevalent type of liver cancer (accounting for 70–90%) and one of the leading causes of cancer-related death worldwide.1 Late diagnosis and limited treatment modalities explain the high mortality rate and poor prognosis of patients with HCC, while early diagnosis using effective biomarkers could improve the survival rate and therapeutic options. Alpha fetal protein (AFP) is the most commonly used biomarker for clinical diagnosis in HCC.2 However, the low diagnostic sensitivity and specificity, and disturbances of other non-liver diseases minimize its clinical significance as biomarker for HCC.2,3
The development of HCC is a series of multi-gene and multi-step collaborative processes based on histologic changes. Tumor cells are initially well differentiated (grade I, G1), and then progress to moderately differentiated (grade II, G2) and poorly differentiated (grade III, G3) types with high proliferation rates.4 Patients with G3 tumors are more likely to develop invasive and metastatic diseases with much worse prognosis than those with G1 or G2 tumors.5 Previous evidences have demonstrated that the proteome profiles of HCC tumors are grade-dependent.6–9 Thus, it is of great clinical significance to identify the differentially expressed proteins (DEGs) among G1, G2 and G3 tumors for revealing the development and prognosis of HCC.
Proteomics analysis is increasingly employed in global evaluation of protein expression. Multiple proteomic approaches have been applied to study various aspects of HCC, such as investigating the underlying molecular mechanisms,10 identifying relevant proteomic signature for HCC phenotypes,11–13 screening molecular biomarkers for early diagnosis and prediction,14–16 and detecting new therapeutic targets.10 Yet, there is still no report on the proteome distinctions in G1, G2, and G3 HCC tumors.
The development of new proteomics strategies enables us to further explore the molecular events in HCC differentiation. Tandem mass tag (TMT), a type of chemical label developed for MS-based detection and quantification of biological molecules, plays an important role in comparative proteomics in various samples such as biofluids, tissues, and cells using gel-free proteomic approaches.17 TMT enables the multiplexing of all peptide sets prepared from different clinical samples to be combined into a single liquid chromatography-tandem mass spectrometry (LC-MS/MS) analysis, thereby increasing throughput and coverage by avoiding missing values commonly found in label-free based quantification.
In this study, we attempted to make comprehensive and comparative analysis of proteins associated with histological differentiation of HCC. TMT-based quantitative proteomic analysis was used to explore the DEPs profiles between HCC tissues with varying degrees of histological differentiation and their adjacent paired non-tumor tissues identifying potential diagnostic protein biomarkers of hepatocellular differentiation. The potential biomarker candidates were further validated using immunohistochemistry (IHC). By elucidating the proteome alterations occurring in different HCC differentiation grades, we hoped to provide potential diagnostic and prognostic protein markers for HCC differentiation and shed light on new therapeutic targets for future investigations.
Methods
Ethics Statement
All experiments were carried out with the approval of the Ethics Committee of the Fourth People’s Hospital of Foshan (approval code: 2,019,012) and in accordance with the Declaration of Helsinki. Written informed consent was received from all participants in this study.
Patients Selection and Specimen Collection
The study population comprised inpatients who were histopathologically diagnosed as HCC between January 2017 to December 2017 at the Fourth People’s Hospital of Foshan. All HCC diagnoses were in accordance with the Guidelines for Diagnosis and Treatment of Primary Liver Cancer in China (2017 Edition).18 Patients were excluded if they: 1) over 75 years old; 2) with anorexia nervosa, inflammatory bowel disease, immunological disease, or endocrine disorders; 3) with infection; 4) with cholangiocarcinoma, gastric cancer or other tumors; 5) with severe complications such as gastrointestinal bleeding or tumor rupture bleeding; 6) had received any surgical treatment, radiotherapy, or chemotherapy in the past 4 weeks; 7) had undergone medication that could seriously affect metabolism or body mass; 8) were pregnant. A total of 15 HCC patients were recruited and assigned to one of the following groups based on their histological differentiation grade: well-differentiated (G1 group, N = 5), moderately differentiated (G2 group, N = 5) and poorly differentiated (G3 group, N = 5). The clinicopathological data of the enrolled patients were presented in Supplementary Table S1.
In each patient, clinical HCC tissue and the corresponding adjacent non-tumor tissue were obtained. The samples were washed with phosphate buffered saline (PBS) to remove blood, contaminants and stripped mucosa, and subsequently frozen in liquid nitrogen to minimize protein degradation. Three biological replicates per sample were prepared.
Protein Extraction
The extracted proteins from 15 tumors tissues and 15 paired non-tumor tissues were treated separately. For each sample, the frozen tissue was added with 100 μL of RIPA lysis buffer (Beyotime Biotechnology, Beijing, China, Cat. No. P0013C), broken down with tissue homogenizer (1998–1, Biovision, San Francisco, USA), and subsequently sonicated six times on ice using a high-intensity ultrasonic processor (VC500, Sonics & Materials, New York, USA). After centrifugation (12,000 × g, 4 °C, 20 min), the supernatants were collected. Then, the samples were processed with Pierce™ Top 12 Abundant Protein Depletion Spin Columns (Thermo Fisher Scientific, Waltham, MA, Cat. No. 23,227) to remove proteins with high abundance ratios. Protein concentrations after depletion were determined using Pierce™ BCA Protein Assay Kit (Thermo Fisher Scientific, Waltham, MA, Cat. No. 23,227) according to the manufacturer’s instructions.
Protein Reduction, Alkylation, and Trypsin Digestion
About 200 μg of protein solutions from each sample were reduced in 5 mM dithiothreitol for 1 h at 60 °C, and alkylated in 11 mM iodoacetamide for 30 min at room temperature in darkness. After alkylation, the protein solutions were loaded onto an ultrafiltration filtrate (10 kDa; UFC801096, Millipore, Darmstadt, Germany), and centrifuged at 12,000 × g for 20 min. The precipitates from the collection tube were discarded. Next, the sample was washed twice by adding 100 μL urea buffer (8 M urea, pH 8.5) and centrifuged at 12, 000 × g for 20 min, and thrice with 100 μL TEAB (0.25M, pH 8.5) and centrifuged at 12, 000 g for 20 min. The protein suspensions were then digested with trypsin. Trypsin (TPCK Treated, Sangon, Shanghai, China; Cat. No. A003740-0100) was added at a mass ratio of 1:50 (trypsin: protein) for the first digestion at 37 °C overnight, and a mass ratio of 1:100 (trypsin: protein) for a subsequent second digestion at 37 °C for 4 hours. After digestion, approximately 100 μg of proteins for each sample was collected for the following experiments.
Tandem Mass Tag Isobaric Labeling
Fifteen HCC tissues and 15 adjacent non-tumor tissues were mixed into 8 pooled samples designated as G1, G2, G3, HCC, G1 non-tumor, G2 non-tumor, G3 non-tumor, and HCC non-tumor. The pooled samples for G1, G2, G3 and their corresponding non-tumor groups were generated by mixing equal protein amounts of 5 samples in each group, while the HCC and HCC non-tumor groups were generated by mixing equal protein amounts of all 15 samples. The resulting peptides after trypsin digestion were desalted by a Strata-X C18 solid-phase extraction (SPE) column (Phenomenex, Torrance, CA, USA) and then vacuum-dried. Subsequently, the peptides were reconstituted in 0.5 M TEAB and labeled with TMT10-plex™ Isobaric Label Reagent Set (3 x 0.8 mg, Thermo Fisher Scientific, Waltham, MA, USA, Cat. No. 90,111) according to the manufacturer’s instructions. The samples were labeled as (G1)-127N, (G2)-128N, (G3) −129N, (HCC)-130N, (G1 non-tumor)-127C, (G2 non-tumor)-128C, (G3 non-tumor) −129C, (HCC non-tumor)-130C. Three biological replicates were generated for each group. The labeled peptides were incubated with TMT reagent for 2 h at room temperature and then pooled, desalted and dried in a vacuum centrifugation.
High pH Reversed-Phase Fractionation
The labeled peptides were fractionated by high pH reversed-phase high-performance liquid chromatography (HPLC) (8050, Shimadzu, Tokyo, Japan) equipped with an Acclaim™ PepMap™ 100 C18 columns (3 µm, 100 Å, 75 µm x 15 cm; AB Sciex, Cat. No. 4,381,664). The mixed peptides were re-dissolved with solvent A (0.1% formic acid, 2% acetonitrile). Then, the sample (100 μL) was eluted at a flow rate of 0.2 mL/min and monitored by measuring absorbance at 214 nm. The gradient was increased from 5% to 37% solvent B (0.1% formic acid, 98% acetonitrile) for 75 min, from 37% to 95% in 5 min, and kept at 95% for the last 5 min. Fractions were collected every 50 s. A total of 12 fractions were finally obtained and vacuum dried for subsequent LC-MS/MS analysis.
LC-MS/MS Analysis
The fractionated peptides were dissolved in aqueous solution with 0.1% formic acid and 5% acetonitrile, and loaded onto a Thermo Scientific EASY trap column (100 mm × 2 cm, 5 mm, 100 Å, C18, Thermo Fisher Scientific) and an analytical column (75 mm × 25 cm, 5 mm, 100 Å, C18, Thermo Fisher Scientific). Then, the peptides were separated for 90 min with a gradient of 5% to 28% Solvent B (0.1% formic acid, 98% acetonitrile) for 40 min followed by 28%–90% Solvent B for 2 min and then 90% Solvent B for 18 min, at a flow rate of 600 nL/min on an EASY-nLC 1000 Ultra-performance liquid chromatography (UPLC) system (Thermo Fisher Scientific, Waltham, MA, USA). After liquid-phase separation, the peptides were subjected to nanoelectrospray ionization followed by tandem mass spectrometry (MS/MS) in Q Exactive mass spectrometer (Thermo Fisher Scientific, MA, USA) coupled online to the HPLC.
Database Search
Raw data were processed using Proteome Discoverer 2.2 (Thermo Fisher Scientific, Waltham, MA, USA). The search parameters were set as follows: database, UniProt-human-filtered-organism Homo sapiens (Human), 9606 entries; [taxonomy, Homo sapiens] quantitative method: TMT 10-plex labeling; precursor ions mass tolerance, 10 ppm; fragment ions mass tolerance, 0.02 Da; enzyme, trypsin; max missed cleavages, 2; fixed modification: Carbamidomethyl on cysteine, TMT-10plex (N-term), TMT 10-plex (K); variable modification, oxidation of methionine; false discovery rate (FDR), less than 1%. For TMT quantification, the ratios of the TMT reporter ion intensities in MS/MS spectra (m/z 127–130) from raw data sets were used to calculate fold changes (abundance ratios) between samples. For each sample, the quantification was mean-normalized at peptide level to center the distribution of quantitative values. Protein quantitation was then calculated as the median ratio of corresponding unique or razor peptides for a given protein. Proteins with fold changes >1.20 or <0.83 and unadjusted significance level P-value <0.05 between two comparable groups were considered as differentially expressed proteins (DEPs).
Gene ontology (GO) and Kyoto Encyclopedia of Genes and Genomes (KEGG) functional enrichment analysis of DEPs was performed using WebGestaltR (http://www.webgestalt.org/option.php). Significant GO terms and pathways with p-value <0.05 are presented. Search Tool for the Retrieval of Interacting Genes/Proteins (STRING) version 10.5 (http://www.webgestalt.org/option.php) was applied for potential protein–protein interaction (PPI) analysis of DEPs. All interactions with a confidence score ≥0.4 were fetched, and the yield PPI results were visualized by Cytoscape software.
Immunohistochemistry
Tumor and adjacent non-tumor tissues were fixed in 4% paraformaldehyde at 4°C for 24 h, washed the next day and stored in 70% ethanol until paraffin embedding. Hematoxylin and eosin (HE)-stained sections (3 μm) of paraffin-embedded tissues were examined by an experienced pathologist for the differentiation grade. Immunohistochemistry analysis was performed on 3 μm thickness of formaldehyde-fixed and paraffin-embedded tissues according to standard immunohistochemical protocols for deparaffinization and embedding. Tissue sections (3 μm) were deparaffinized and heated in drying oven for 25 min at 75 °C to unmask the antigenic sites. Immunohistochemical staining was performed using the Ventana BenchMark Ultra in automatic mode (Roche Diagnostics Ltd., UK) and antibodies against (Abcam, Shanghai, China, Cat. ab170952), CPS1 (Abcam, Shanghai, China, Cat. ab129076), UROD (Santa Cruze, CA, USA, Cat. sc-365,297), HBB (Santa Cruze, CA, USA, Cat. sc-21,757), CYB5A (Abcam, Shanghai, China, Cat. ab69801), YBX1 (Abcam, Shanghai, China, Cat. ab76149), and FKBP11 (Abcam, Shanghai, China, Cat. ab237528).
Results
Protein Profiling
TMT analysis indicated 382,274 spectra and 7867 matched queries. After searching against the Uniprot Homo sapiens database, a total of 1010 unique proteins were identified across 3426 peptides. Using a 1.2-fold increase or 0.833-fold decrease in protein expression as a benchmark for a physiologically significant change, DEPs between groups were further filtered. A total of 154 DEPs (Up-regulated 100; Down-regulated 54) between HCC tumor and non-tumor tissues (Supplementary Table S2), 30 DEPs (Up-regulated 18; Down-regulated 12) between G1 and G1 non-tumor tissues (Supplementary Table S3), 41 DEPs (Up-regulated 20; Down-regulated 21) between G2 and G2 non-tumor tissues (Supplementary Table S4), and 11 DEPs (Up-regulated 5; Down-regulated 6) between G3 and G3 non-tumor tissues (Supplementary Table S5), were identified. Eleven DEPs (Up-regulated 8; Down-regulated 3) were found between G1 and G2 groups (Figure 1A; Supplementary Table S6). Twelve DEPs (Up-regulated 9; Down-regulated 3) were found between G1 and G3 groups (Figure 1B; Supplementary Table S7). Eight DEPs (Up-regulated 5; Down-regulated 3) were found between G2 and G3 groups (Figure 1C; Supplementary Table S8). Hierarchical clustering of the expression of DEPs in the three groups was mapped. The heatmap showed that these proteins were well distinguished, which provided improved visualization of the overall protein change (Figure 1D).
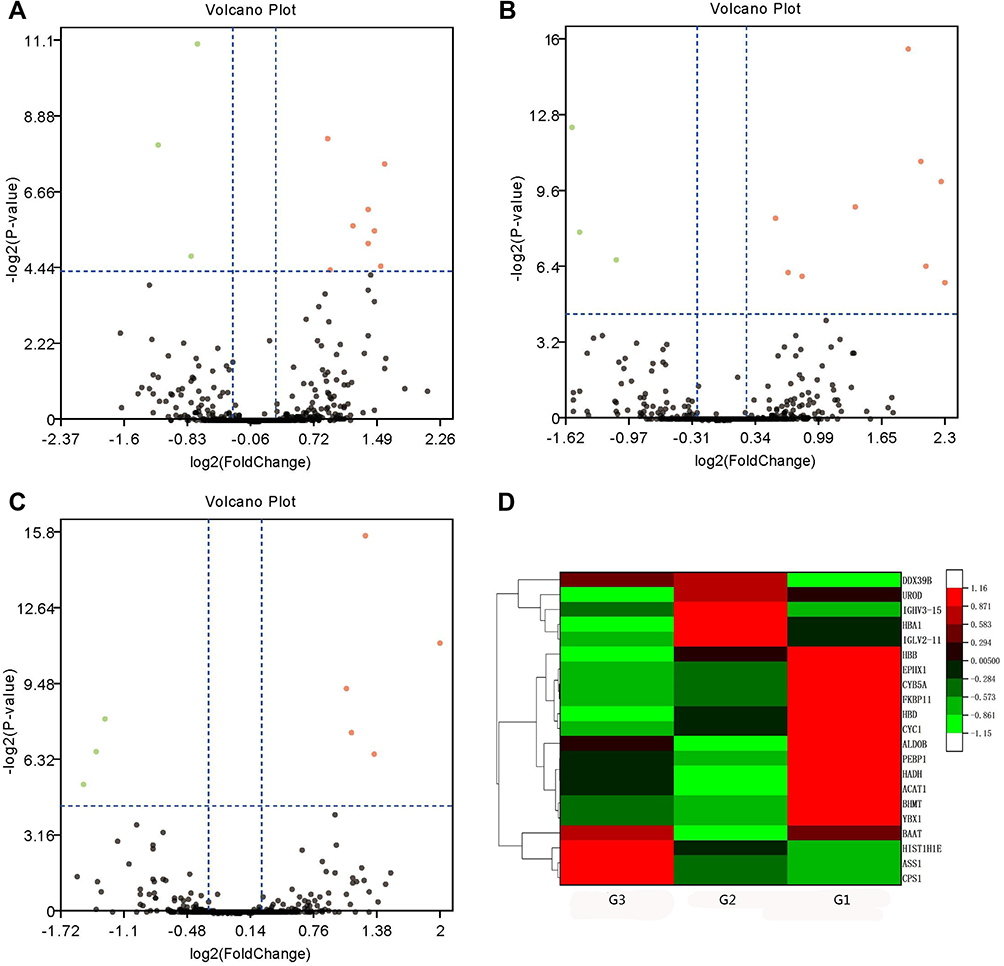 |
Figure 1 Volcano plots and hierarchical clustering of differentially expressed proteins (DEPs) among poorly- (G3), moderate- (G2) and well-differentiated (G1) hepatocellular carcinoma (HCC). Volcano plots showing the distribution of significance fold change of DEPs between (A) G1 and G2, (B) G1 and G3, and (C) G2 and G3 HCC. The red spots and green spots indicate significantly up-regulated and down-regulated proteins, respectively. (D) Hierarchical clustering representing of 21 DEPs. Red indicates upregulation and green represents downregulation (color bar next to the figure). |
Candidate Proteins as HCC Differentiation Biomarkers
If a protein is differentially expressed in G1 compared with both G2 and G3 tumors, the protein is identified as a potential marker for G1 tumors. Similarly, if a protein significantly up- or down-regulated in G3 compared with both G1 and G2 tumors, the protein might be a potential marker for G3 tumors. Applying the above criteria, we further filtered the potential markers for identifying G1 and G3 tumors. Argininosuccinate synthase (ASS1, P < 0.001) and carbamoyl-phosphate synthase[ammonia] (CPS1, P < 0.001) were significantly up-regulated, while uroporphyrinogen decarboxylase (UROD, P < 0.01), and hemoglobin subunit beta (HBB, P < 0.001) were significantly down-regulated in G3 tissues compared with G1 and G2 tissues, indicating that the four proteins might be potential biomarker for distinguishing poorly differentiated HCC (Tables 1 and 2; Figure 2). Cytochrome b5 (CYB5A, P < 0.01), nuclease-sensitive element-binding protein 1 (Fragment) (YBX1, P < 0.01), and peptidyl-prolyl cis-trans isomerase FKBP11 (FKBP11, P < 0.001) were significantly up-regulated in G1 group compared with G2 and G3 groups, suggesting that these proteins might be potential biomarker for distinguishing well-differentiated HCC (Tables 1 and 2; Figure 2).
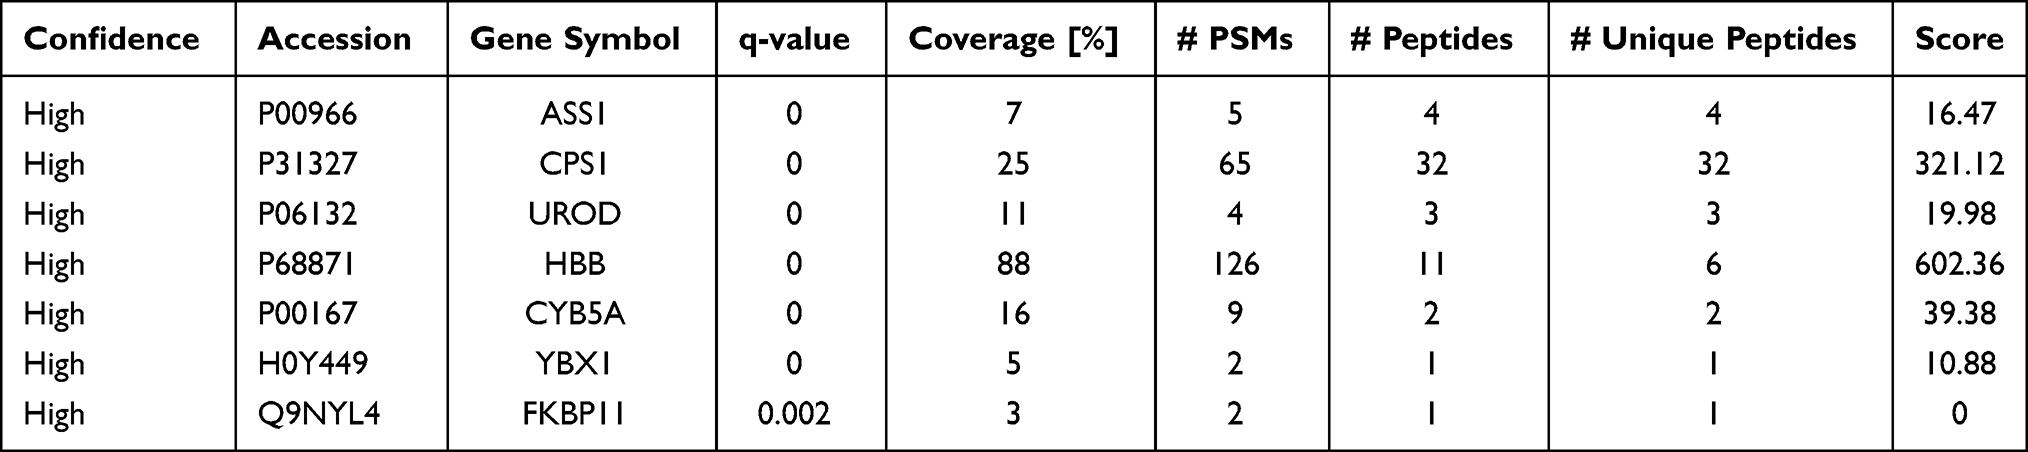 |
Table 1 List of Differentially Expressed Proteins as Potential Biomarker Candidates for Well- and Poorly-Differentiated Hepatocellular Carcinoma |
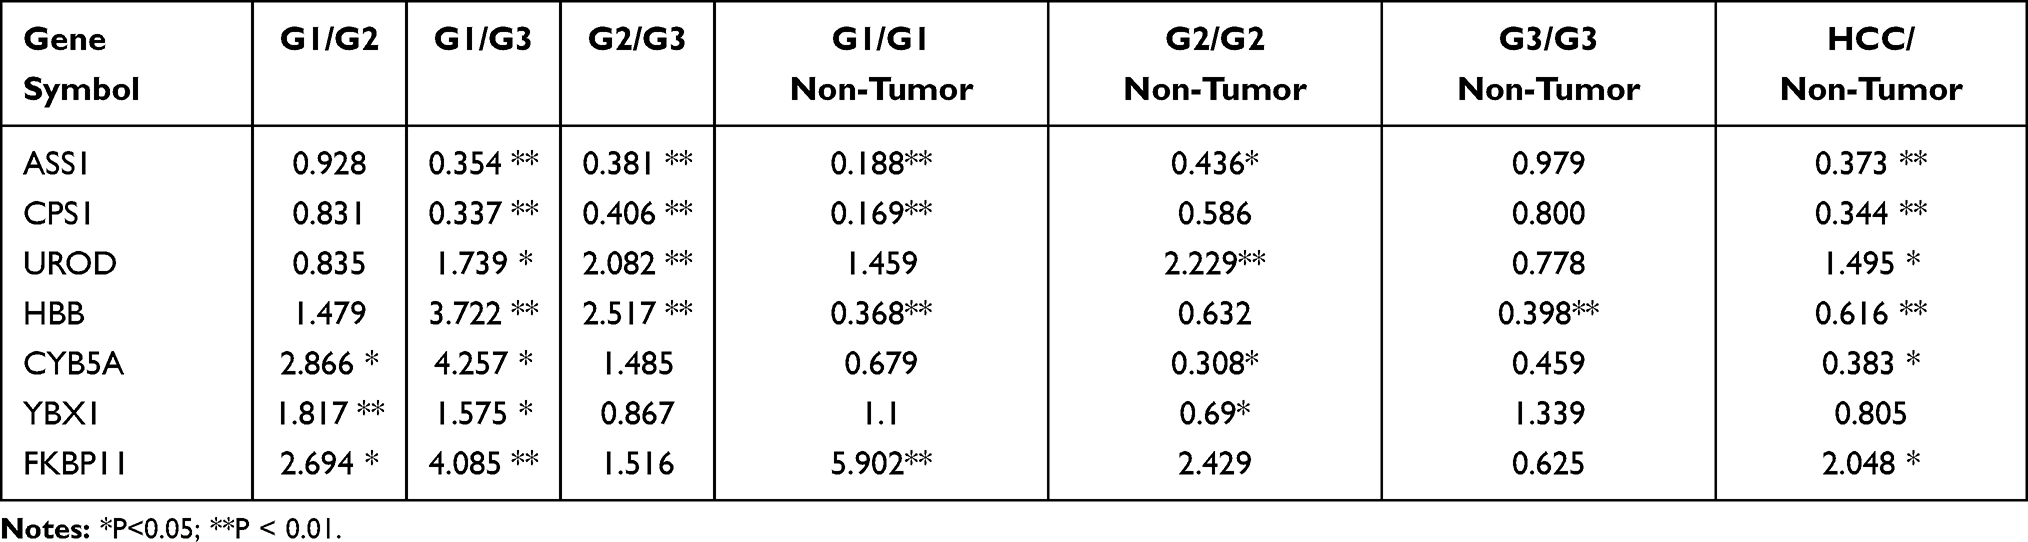 |
Table 2 Statistical Information on the Differentially Expressed Proteins |
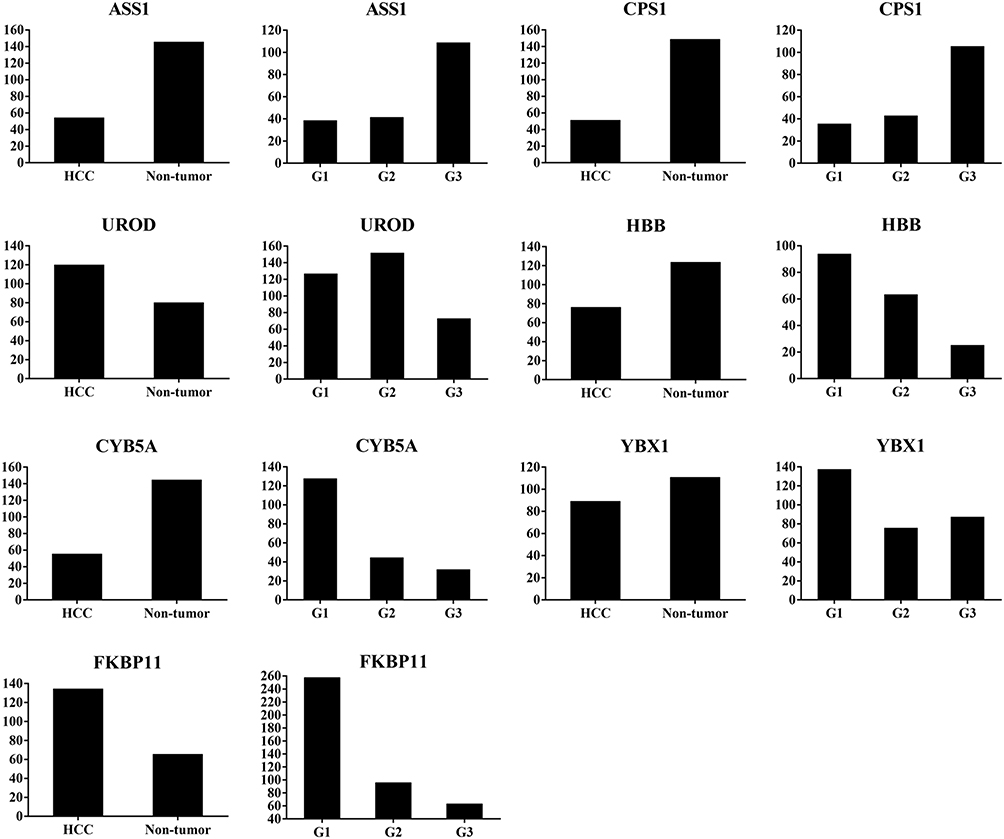 |
Figure 2 Abundance ratio of differentially expressed proteins ASS1, CPS1, UROD, HBB, CYB5A, YBX1, and FKBP11 between hepatocellular carcinoma (HCC) tumor and non-tumorous tissues, and among well- (G1), moderate- (G2), and poorly- (G3) differentiated HCC. ASS1 and CPSI were up-regulated, while UROD and HBB were down-regulated in G3 compared with G1 and G2 tissues; CYB5A, YBX1, and FKBP11 were up-regulated in G1 compared with G2 and G3 tissues. |
To further validate the MS results, the 7 identified candidate proteins were selected for IHC staining. Figure 3 showed a representative IHC staining pattern obtained from paired HCC tissues which displayed reduced expression of candidate proteins ASS1, CPS1, CYB5A, YBX1 and HBB, and increased expression of proteins UROD and FKBP11 in tumor compared with paratumor tissues. Results of IHC staining of G1, G2, and G3 tumors were consistent with the MS findings, showing higher expression of proteins ASS1 and CPS1 and lower expression of proteins UROD and HBB in G3 tumors; and higher expression of proteins CYB5A, YBX1, and FKBP11 in G1 tumors (Figure 4).
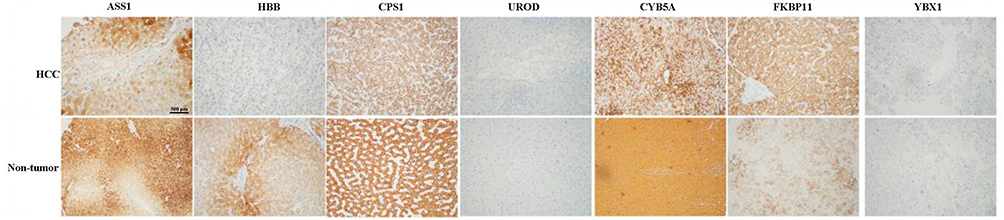 |
Figure 3 Representative immunohistochemical staining for seven candidate proteins (ASS1, CPS1, UROD, HBB, CYB5A, YBX1, and FKBP11) between hepatocellular carcinoma (HCC) and adjacent non-tumorous tissues. The scale bar is 500 μm. |
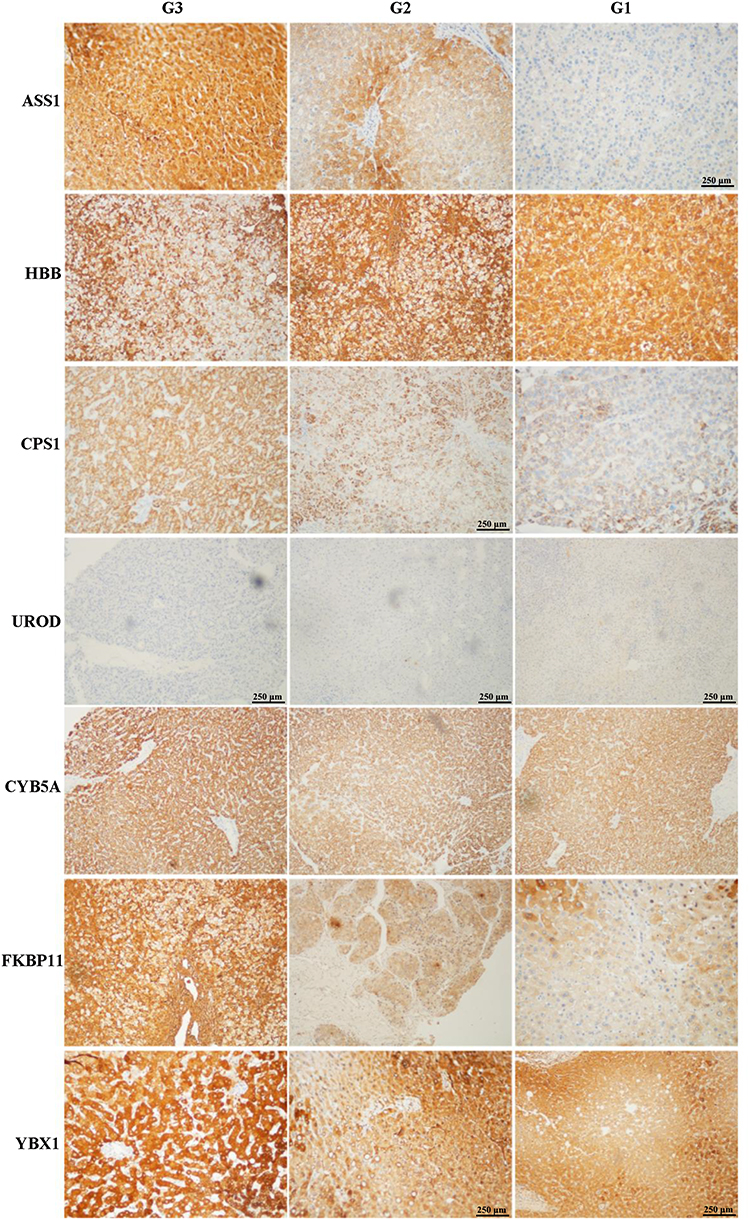 |
Figure 4 Representative immunohistochemical staining for seven candidate proteins (ASS1, CPS1, UROD, HBB, CYB5A, YBX1, and FKBP11) among well- (G1), moderate- (G2), and poorly (G3) differentiated hepatocellular carcinoma (HCC) tissues. The original scale bar is 500 μm. |
GO and KEGG Pathway Enrichment
GO and KEGG pathway enrichment analyses were performed using the 7 potential protein markers. The most enriched GO terms of biological processes (BP), molecular functions (MF) and cellular components (CC) were annotated as metabolic process, catalytic activity, and cytoplasm, respectively (Figure 5).
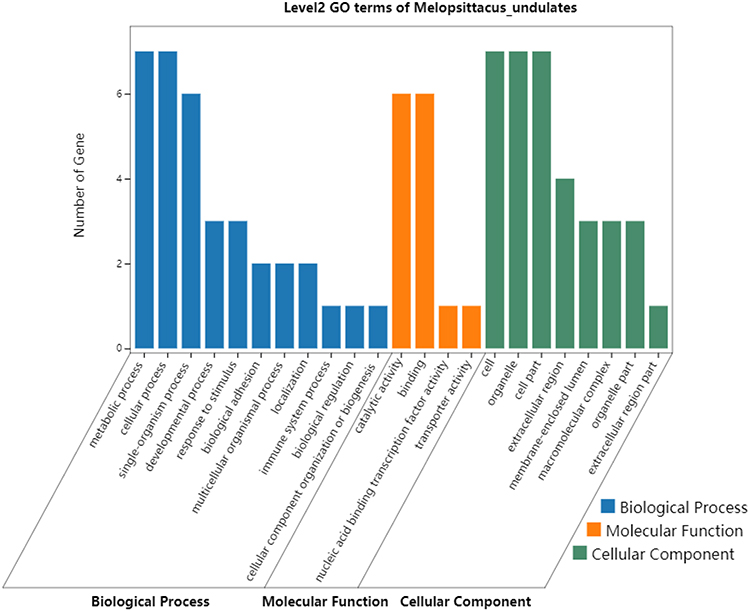 |
Figure 5 Gene Ontology enrichment analysis of the 7 DEPs (ASS1, CPS1, UROD, HBB, CYB5A, YBX1, and FKBP11) potentially for identifying poorly- and well-differentiated hepatocellular carcinoma. |
KEGG pathway analysis identified 4 significantly enriched pathways, including arginine biosynthesis, alanine, aspartate and glutamate metabolism, biosynthesis of amino acids, and metabolic pathways. Both ASSI and CPS1 proteins were implicated in several pathways (Table 3).
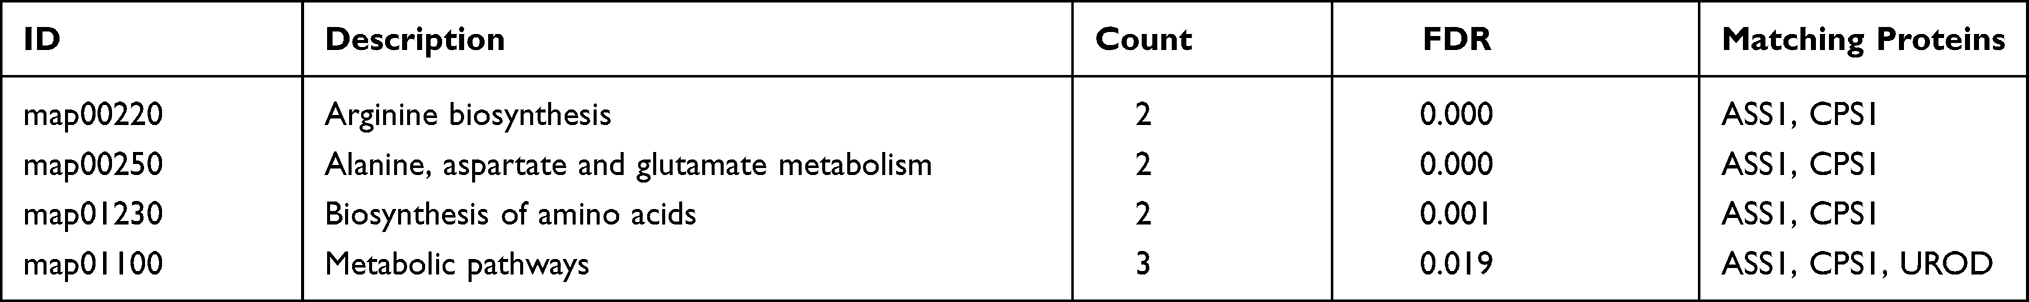 |
Table 3 KEGG Pathway Enrichment Analysis of Differentially Expressed Proteins Between Well- and Poorly-Differentiated Hepatocellular Carcinoma |
Protein–Protein Interactions Analysis
In the PPT network, protein CPS1 depicted interaction with protein ASS1 and YBX1, and protein ASS1 showed interaction with protein CPS1 and UROD (Figure 6). Of these, only CPS1 and ASS1 were found to be functionally associated with each other with high confidence (Table 4).
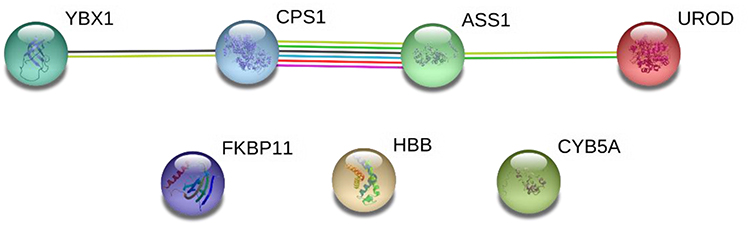 |
Figure 6 STRING networks of the 7 DEPs (ASS1, CPS1, UROD, HBB, CYB5A, YBX1, and FKBP11) potentially for identifying poorly- and well-differentiated hepatocellular carcinoma. Different line colours represent the types of evidence for the association. Green colour depicts neighbourhood; Red colour: Gene fusion; Pink colour: Experiments; Light green colour: Text mining; Blue colour: Cooccurrence; Dark blue colour: Coexpression; Purple colour: Homology; and circle nodes indicated different proteins. Interaction networks are shown in evidence view. |
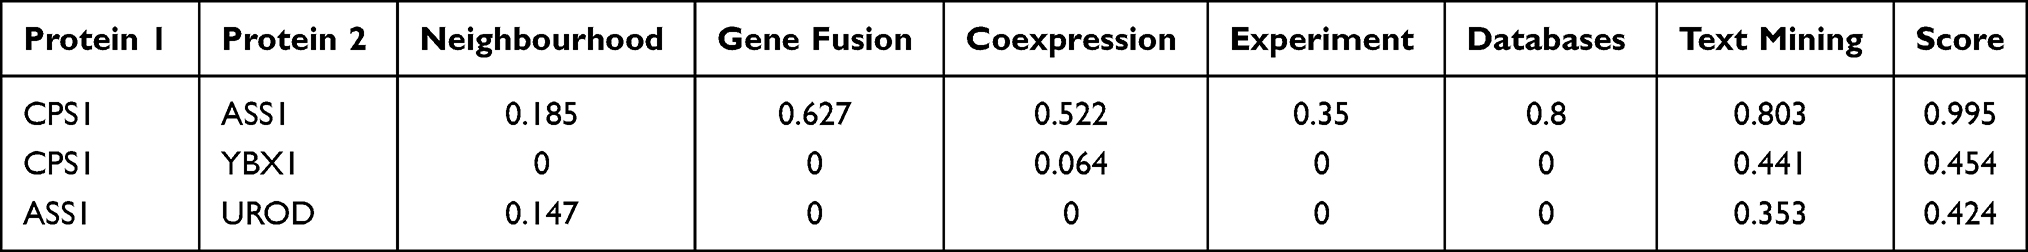 |
Table 4 Protein–Protein Interaction Analysis of the Differentially Expressed Proteins Between Well- and Poorly-Differentiated Hepatocellular Carcinoma |
Discussion
Histological differentiation is an important factor affecting the prognosis of malignant tumors. Poorly differentiated HCC tumors have higher risk of invasion and metastasis.19 The extremely poor prognosis of HCC patients is largely due to high frequency of disease recurrence or distant metastasis. Thus, identification of differentiation specific dysregulated proteins will benefit the elucidation of underlying mechanism of HCC progression, allowing early diagnosis and prognosis and providing new therapeutic targets of HCC with different differentiation. In this study, a comprehensive proteomic screening on HCC tissues with different differentiation was conducted for the first time to identify protein candidates for distinguishing HCC differentiation. With the aid of the TMT-based proteomic analysis, we have identified 4 proteins (ASS1, CPSI, UROD, HBB) as potential biomarkers for distinguishing poorly differentiated HCC tumors, and 3 proteins (CYB5A, YBX1, FKBP11) as potential biomarkers for distinguishing well-differentiated HCC tumors. These potential biomarkers were further confirmed and validated by IHC staining.
The above results indicated that the 7 proteins and their biological functions might be directly or indirectly implicated in the malignant behavior of HCC cells. ASS1 and CPS1 are enzymes in the urea cycle. The urea cycle was first discovered by Hans Krebs in 1932.20 Its main function is to convert the toxic ammonia produced upon the metabolism of proteins and amino acids through a series of biochemical reactions into harmless urea.21 The urea cycle consists of five catalytic enzymes: two mitochondrial enzymes, namely, CPS1, paracetamol transacylase (OTC), and three cytosolic, namely, ASS1, argininosuccinate lyase (ASL) and arginase (ARG). ASS1 is the rate-limiting enzyme for arginine biosynthesis in the urea cycle. It catalyzes the production of argininosuccinate from citrulline and aspartate, which is then converted into arginine.22 Tumors with loss of ASS1 are generally chemoresistant and yet display a critical dependence on extracellular arginine for growth, known as arginine auxotrophy.23 Exhibiting down-regulation of ASS1, HCC is thus arginine auxotrophs.24 Selective elimination of extracellular arginine has been demonstrated as an effective anti-cancer therapy for HCC.25 Evidence has shown that ASS1 protein deficiency is a predictive biomarker for the development of metastasis and is associated with poor prognosis for HCC.26 Agreed with the previous findings, results of the present study also demonstrated significant down-regulation of ASS1 in HCC tumors compared with their adjacent non-tumor tissues. Besides, overexpression of ASS1 was presented in G3 compared with both G1 and G2 tumors, indicating its potential role for distinguishing poorly differentiated HCC.
CPS1 is a liver-specific, intramitochondrial, and the first and rate-limiting enzyme in the urea cycle, which is responsible for the conversion of ammonia into aminoamide phosphate.27 A downregulation of CPS1 has frequently been associated with HCC in literature. A study has reported that 75% of human HCC tissues express low levels of CPS1.28 Some even reported absence of CPS1 in human HCC cells.29,30 In this study, the CPS1 expression was also significantly down-regulated in HCC tumor tissues compared with adjacent non-tumor tissues. In addition, we further pointed out that the expression of CPS1 increased with the development of G3 tumors. Aflatoxin B1 (AFB1) is a potent hepatocarcinogenesis mycotoxin. Previous studies revealed that AFB1 down-regulated the protein level of CPS1.31 Using endogenous co-immunoprecipitation combined with GC-MS, Yang et al discovered three interaction proteins of CPS1, including type II cytoskeleton 1 (KRT1), albumin (ALB) and pervasive protein C (UBC).31 They showed that CPS1 was negatively regulating interacted and colocalized with KRT1 and ALB, and AFB1 affected correlation intensity of these correlations. CPS1, ALB, and KRT1 were reported to be involved in the development and differentiation of cancer cell.32 Results of our TMT-analysis showed that the expression of ALB exhibited a trend of up-regulation (0.05 < P <0.01), which further supports the results of Yang et al.31 Altogether, CPS1 is implicated in the development and differentiation of HCC with potential for the identification of HCC differentiation.
Interestingly, our data demonstrated that ASS1 and CPS1 expressions were continuously increasing in HCC tumor with the progress of poorly differentiated HCC. This phenomenon might be the result of blood metastasis. Angiogenesis is the basis of tumor growth, invasion and metastasis. Nitric oxide (NO) is a physiological messenger that modulates different cancer-related events including apoptosis, progression, invasion and metastasis.33 NO is generated from L-arginine, supplied by the urea cycle.34 Arginine is regulated by ASS1 and CPS1, and thus the loss of ASS1 and CPS1 might lead to reduction of NO. It is suggested that overexpression of NO in tumor tissues induces tumor cell toxicity and apoptosis. We speculated that the formation of HCC tumor cells needs a low concentration of NO environment. Thus, the expression of ASS1 and CPS1 is down regulated, which reduces the production of NO. In the period of poorly-differentiation, a large number of tumor blood vessels need to be generated for blood metastasis, and thus up-regulated ASS1 and CPS1 to promote the production of NO. Nevertheless, the expressions of ASS1 and CPS1 in poorly differentiated HCC tumors are still lower than non-tumour cells, which allows the formation of microvessels but the amount of NO is not enough to generate apoptosis and can also remove toxic ammonia at the same time. This is the first report that increased expression of ASS1 and CPS1 accompanies the progression of HCC differentiation. The underlying mechanisms of protein changes in HCC differentiation still need further investigation.
Uroporphyrinogen decarboxylase (UROD) catalyzes decarboxylation of the four acetate side chains of uroporphyrinogen to form coproporphyrinogen. The mutation or deficiency of UROD can cause porphyria cutanea tarda (PCT). Evidences have showed that PCT is a risk factor for HCC.35,36 Results from a meta-analysis showed approximately 50% hepatitis C virus (HCV) prevalence in patients with PCT, suggesting a possible ecopathogenic role of HCV in PCT.37 These data suggest that UROD is implicated in HCC. In consistent with the data from The Human Protein Atlas, the current study also found overexpression of UROD in HCC compared with non-tumor tissues. In addition, significant down-regulated UROD expression was detected in G3 tumors compared with G1 and G2 tumors, suggesting the potential role of UROD in distinguishing poorly differentiated HCC.
Hemoglobin subunit beta (HBB) is an essential component of hemoglobin. Results of the present study showed significantly lower HBB expression in HCC compared to adjacent non-tumor tissues, and the expression of HBB decreased with poorly differentiated tumors. Using 2-DE coupled with ESI-QTOF MS/MS, Khan et al detected significant down-regulation of HBB in HCC compared with fibrotic liver and HepG2 cell line,38 which was consist with our findings. Although there is a possibility that a sample with blood may cause false positive, the in vitro culture of HepG2 cell line also detected expression of HBB.38 Anemia is a common complication in HCC, and the incidence of HCC in patients with thalassemia is also on the rise.39 Iron overload is one of the risk factors of HCC in thalassemia. The carcinogenicity of iron is related to its induction of oxidative damage, which results in genotoxicity, and to immunologic dysregulation, which attenuates cancer immune surveillance.39 Hemoglobin is an important oxygen-carrying protein and plays crucial roles in establishing host resistance against pathogens and in regulating innate immune responses.40 The HBB is an essential component of hemoglobin which has also been found to play an important role in the antiviral innate immunity. Yang et al showed that HBB was a pleiotropic regulator of the RIG-I/MDA5 signaling pathway, which can directly inhibit binding of MDA5 to dsRNA and negatively regulates MDA5-mediated IFN production; or involved in the regulation of cellular oxidative stress to enhance RIG-I ubiquitination, which indirectly promotes RIG-I-mediated IFN production.41 Thus, lower expression of HBB could result in increased oxidative stress mediated by free iron, which could promote HCC occurrence and progression. These findings may contribute to a broader understanding of the potential of HBB in the differentiation of HCC.
Cytochrome b5 (CYB5A) is a membrane-bound hemoprotein which acts as an electron carrier for several membrane-bound oxygenases. Using 2-DE proteomic analysis, Lee et al demonstrated that the differential expression of CYB5A could accurately distinguished HCC tissues from adjacent non-tumor tissues and normal liver tissues.42 Khan et al also found that the expression of CYB5A was down-regulated in HCC as compared to fibrotic liver and HepG2 cell lines.38 Our study showed significantly down-regulated CYB5A in HCC tissues compared with the adjacent non-tumor tissues, which was consistent with the above findings. Furthermore, significantly higher CYB5A expression was found in G1 tumors than in G2 and G3 tumors, indicating that CYB5A was relatively low in the invasion and expansion stage of HCC. Since CYB5A is mainly located in the endoplasmic reticulum, endoplasmic reticulum stress (ERS) may be responsible. ERS is a pathophysiological response to the accumulation of unfolded or misfolded proteins after endoplasmic reticulum environment disturbance. A range of stressful cellular conditions (hypoxia, nutritional deficiency, energy deficiency, oxidative stress, etc.) accompanied by HCC development may trigger ERS.43 The endoplasmic reticulum is a dynamic and specialized membranous network which implicates in various cellular processes and acts as central coordinator for the maintenance of cellular homeostasis.44 It displays various functions in tumor cells for different degrees of differentiation.45 Thus, the altered expression of CYB5A suggests that these proteins may be used as a novel diagnostic factor for HCC or prognostic factor for HCC differentiation.
FK506 binding protein (FKBP11), a member of the FK506 binding protein family, is involved in peptidyl-prolyl cis-trans isomerase (PPIase) activity and is closely associated with inflammation.46 Previous research has detected a progressive elevation in the expression of FKBP11 during the development of HCC, which suggests potential role of FKBP11 as early biomarker for HCC.47 Results of our study further support its role as an early biomarker, as overexpression of FKBP11 is observed in HCC tissues compared with adjacent non-tumor tissues. It has been suggested that FKBP11 is implicated in endoplasmic reticulum (ER) stress and unfolded protein response (UPR), and the ER stress pathway has been reported to be involved in liver malignancy and HCC progression.46,48 Thus, FKBP11 might be an early response gene to liver injury events that indicate ER stress caused by metabolic disorders and hepatitis due to viral infection and increases dramatically as the disease progress. Taken together, FKBP11 can serve as a potential protein marker to distinguish well-differentiated HCC.
YBX1, belonging to the cold shock domain family, is a highly conserved and multifunctional protein. It binds DNA in the nucleus and RNA in the cytoplasm, participates in transcription regulation, RNA processing and translation regulation, and plays pro-oncogenic roles in tumor progression, metastasis, and drug resistance in various cancers.49–51 In this study, the YBX1 expression tended to be lower in HCC tissues compared with adjacent non-tumor tissues, and significantly higher in G1 compared with G2 and G3 tumors. It has been demonstrated that YBX1 is up-regulated during liver development and regeneration, in which hepatocytes are in an immature state requiring vigorous cell proliferation.52 Besides, YBX1 acts as a key regulator of ammonia detoxification by negatively regulating CPS1 expression.53 The present study showed that YBX1 expression was continuously decreasing while CPS1 expression was continuously increasing in HCC tumor with the progress of poorly differentiated HCC, which further confirmed the negative correlation between YBX1 and CPS1 in HCC. Chao et al demonstrated nuclear localization of YBX1 particularly in the HCC initiating cells, the EpCAM+ cells or sphere cells.52 These results suggest that YBX1is key factor in HCC tumorigenesis, and could maintain the HCC initiating cell population.52 This explained the significant up-regulation of YBX1 expression in G1 tumor compared with G3 tumor, since well-differentiated tumor is the initial stage of HCC. Taken together, YBX1 may be a potential protein marker for HCC differentiation.
In conclusion, the current study illustrated remarkably DEPs profile in HCC with different differentiation. Of these, ASS1, CPS1, UROD and HBB have the potential to distinguish poorly differentiated HCC, while CYB5A, YBX1 and FKBP11 are candidate biomarkers for distinction of well-differentiated HCC. These findings pave a way for new insights into early diagnosis and prognosis of HCC with different differentiation, and provide potential therapeutic targets for further investigation.
Funding
This study is supported by The Science and Technology program of Guangzhou (No.2020-02-03-06-3003-0015), Foshan Science and Technology Innovation Project (No.FS0AA-KJ218-1301-0035), the Cultivation Fund of the First Affiliated Hospital of Jinan University (No.2019315), Administration of Traditional Chinese Medicine of Guangdong Province (No.20201078), the Medical Science Foundation of Guangdong Province (No.B2018014), and The Science and Technology program of Guangzhou (No.202002030200).
Disclosure
The authors declare no conflicts of interest in this work.
References
1. Bray F, Ferlay J, Soerjomataram I, Siegel RL, Torre LA, Jemal A. Global cancer statistics 2018: GLOBOCAN estimates of incidence and mortality worldwide for 36 cancers in 185 countries. CA Cancer J Clin. 2018;68(6):394–424. doi:10.3322/caac.21492
2. Fujiyama S, Tanaka M, Maeda S, Ashihara H, Hirata R, Tomita K. Tumor markers in early diagnosis, follow-up and management of patients with hepatocellular carcinoma. Oncology. 2002;62(suppl1):57–63. doi:10.1159/000048277
3. Gupta S, Bent S, Kohlwes J. Test characteristics of alpha-fetoprotein for detecting hepatocellular carcinoma in patients with hepatitis C. A systematic review and critical analysis. Ann Intern Med. 2003;139(1):46–50. doi:10.7326/0003-4819-139-1-200307010-00012
4. Zhang D, Lim SG, Koay ES. Proteomic identification of down-regulation of oncoprotein DJ-1 and proteasome activator subunit 1 in hepatitis B virus-infected well-differentiated hepatocellular carcinoma. Int J Oncol. 2007;31(3):577–584.
5. Ker CG, Chen HY, Chen KS, et al. Clinical significance of cell differentiation in hepatocellular carcinoma. Hepato-Gastroenterology. 2003;50(50):475–479.
6. Takashima M, Kuramitsu Y, Yokoyama Y, et al. Overexpression of alpha enolase in hepatitis C virus-related hepatocellular carcinoma: association with tumor progression as determined by proteomic analysis. Proteomics. 2005;5(6):1686–1692. doi:10.1002/pmic.200401022
7. Ding SJ, Li Y, Tan YX, et al. From proteomic analysis to clinical significance: overexpression of cytokeratin 19 correlates with hepatocellular carcinoma metastasis. Molecular Cellular proteomics. 2004;3(1):73–81. doi:10.1074/mcp.M300094-MCP200
8. Kuramitsu Y, Harada T, Takashima M, et al. Increased expression and phosphorylation of liver glutamine synthetase in well-differentiated hepatocellular carcinoma tissues from patients infected with hepatitis C virus. Electrophoresis. 2006;27(8):1651–1658. doi:10.1002/elps.200500718
9. Nissom PM, Lo SL, Lo JCY, et al. Hcc-2, a novel mammalian ER thioredoxin that is differentially expressed in hepatocellular carcinoma. FEBS Lett. 2006;580(9):2216–2226. doi:10.1016/j.febslet.2006.03.029
10. Cao Y, Ding W, Zhang J. Significant down-regulation of urea cycle generates clinically relevant proteomic signature in hepatocellular carcinoma patients with macrovascular invasion. J Proteome Res. 2019;18(5):2032–2044.
11. Li C, Tan Y-X, Zhou H, et al. Proteomic analysis of hepatitis B virus-associated hepatocellular carcinoma: identification of potential tumor markers. Proteomics. 2005;5(4):1125–1139. doi:10.1002/pmic.200401141
12. Iizuka N, Oka M, Yamada-Okabe H, et al. Comparison of gene expression profiles between Hepatitis B Virus- and Hepatitis C Virus-infected hepatocellular carcinoma by oligonucleotide microarray data on the basis of a supervised learning method. Cancer Res. 2002;62(14):3939.
13. Wei D, Zeng Y, Xing X, et al. Proteome differences between hepatitis B Virus Genotype-B- and Genotype-C-Induced hepatocellular carcinoma revealed by iTRAQ-Based quantitative proteomics. J Proteome Res. 2016;15(2):487–498. doi:10.1021/acs.jproteome.5b00838
14. Li C, Hong Y, Tan Y-X, et al. Accurate qualitative and quantitative proteomic analysis of clinical hepatocellular carcinoma using laser capture microdissection coupled with isotope-coded affinity tag and two-dimensional liquid chromatography mass spectrometry. Molecular Cellular Proteomics. 2004;3(4):399. doi:10.1074/mcp.M300133-MCP200
15. Liang CRMY, Leow CK, Neo JCH, et al. Proteome analysis of human hepatocellular carcinoma tissues by two-dimensional difference gel electrophoresis and mass spectrometry. Proteomics. 2005;5(8):2258–2271. doi:10.1002/pmic.200401256
16. Kim W, Oe Lim S, Kim J-S, et al. Comparison of proteome between Hepatitis B Virus- and Hepatitis C virus-associated hepatocellular carcinoma. Clin Cancer Res. 2003;9(15):5493.
17. Arntzen MØ, Koehler CJ, Barsnes H, Berven FS, Treumann A. IsobariQ: software for Isobaric Quantitative Proteomics using IPTL, iTRAQ, and TMT. J Proteome Res. 2011;10(2):913–920. doi:10.1021/pr1009977
18. Zhou J, Sun HC, Wang Z, et al. Guidelines for diagnosis and treatment of primary liver cancer in China (2017 Edition). Liver Cancer. 2018;7(3):235–260. doi:10.1159/000488035
19. Okawa T, Michaylira CZ, Kalabis J, et al. The functional interplay between EGFR overexpression, hTERT activation, and p53 mutation in esophageal epithelial cells with activation of stromal fibroblasts induces tumor development, invasion, and differentiation. Genes Dev. 2007;21(21):2788–2803. doi:10.1101/gad.1544507
20. Holmes FL. Hans Krebs and the discovery of the ornithine cycle. Fed Proc. 1980;39(2):216–225.
21. Krebs HA. The history of the tricarboxylic acid cycle. Perspectives Biol Med Autumn. 1970;14(1):154–170. doi:10.1353/pbm.1970.0001
22. Pegg AE. Mammalian polyamine metabolism and function. IUBMB Life. 2009;61(9):880–894. doi:10.1002/iub.230
23. Delage B, Fennell DA, Nicholson L, et al. Arginine deprivation and argininosuccinate synthetase expression in the treatment of cancer. Int J Cancer. 2010;126(12):2762–2772. doi:10.1002/ijc.25202
24. Wu L, Li L, Meng S, Qi R, Mao Z, Lin M. Expression of argininosuccinate synthetase in patients with hepatocellular carcinoma. J Gastroenterol Hepatol. 2013;28(2):365–368. doi:10.1111/jgh.12043
25. Ensor CM, Holtsberg FW, Bomalaski JS, Clark MA. Pegylated arginine deiminase (ADI-SS PEG20,000 mw) inhibits human melanomas and hepatocellular carcinomas in vitro and <strong>in Vivo</strong>. Cancer Res. 2002;62(19):5443.
26. Tan GS, Lim KH, Tan HT, et al. Novel proteomic biomarker panel for prediction of aggressive metastatic hepatocellular carcinoma relapse in surgically resectable patients. J Proteome Res. 2014;13(11):4833–4846. doi:10.1021/pr500229n
27. Maglott D, Ostell J, Pruitt KD, Tatusova T. Entrez Gene: gene-centered information at NCBI. Nucleic Acids Res. 2011;39(Databaseissue):D52–57. doi:10.1093/nar/gkq1237
28. Siddiqui MT, Hossein Saboorian M, Tunc Gokaslan S, Ashfaq R. Diagnostic utility of the HepPar1 antibody to differentiate hepatocellular carcinoma from metastatic carcinoma in fine-needle aspiration samples. Cancer Cytopathol. 2002;96(1):49–52. doi:10.1002/cncr.10311
29. Butler SL, Dong H, Cardona D, et al. The antigen for Hep Par 1 antibody is the urea cycle enzyme carbamoyl phosphate synthetase 1. Laboratory Investigation. 2008;88(1):78–88. doi:10.1038/labinvest.3700699
30. Liu H, Dong H, Robertson K, Liu C. DNA methylation suppresses expression of the urea cycle enzyme carbamoyl phosphate synthetase 1 (CPS1) in human hepatocellular carcinoma. Am J Pathol. 2011;178(2):652–661. doi:10.1016/j.ajpath.2010.10.023
31. Yang C, Fu R, Zhuang Z, Wang S. Studies on the biological functions of CPS1 in AFB1 induced hepatocarcinogenesis. Gene. 2016;591(1):255–261. doi:10.1016/j.gene.2016.07.031
32. Shahid M, Mubeen A, Tse J, et al. Branched chain in situ hybridization for albumin as a marker of hepatocellular differentiation: evaluation of manual and automated in situ hybridization platforms. Am J Surg Pathol. 2015;39(1):25–34. doi:10.1097/PAS.0000000000000343
33. Cheng H, Wang L, Mollica M, Re AT, Wu S, Zuo L. Nitric oxide in cancer metastasis. Cancer Lett. 2014;353(1):1–7. doi:10.1016/j.canlet.2014.07.014
34. Kaluarachchi DC, Smith CJ, Klein JM, Murray JC, Dagle JM, Ryckman KK. Polymorphisms in urea cycle enzyme genes are associated with persistent pulmonary hypertension of the newborn. Pediatr Res. 2018;83(1):142–147. doi:10.1038/pr.2017.143
35. Solis JA, Betancor P, Campos R, et al. Association of porphyria cutanea tarda and primary liver cancer: report of ten cases. J Dermatol. 1982;9(2):131–137. doi:10.1111/j.1346-8138.1982.tb02614.x
36. Salata H, Cortés JM, de Salamanca RE, et al. Porphyria cutanea tarda and hepatocellular carcinoma: frequency of occurrence and related factors. J Hepatol. 1985;1(5):477–487. doi:10.1016/S0168-8278(85)80746-7
37. Gisbert JP, Garcı́a-Buey L, Marı́a Pajares J, Moreno-Otero R. Prevalence of hepatitis C virus infection in porphyria cutanea tarda: systematic review and meta-analysis. J Hepatol. 2003;39(4):620–627. doi:10.1016/S0168-8278(03)00346-5
38. Khan R, Zahid S, Wan YJ, et al. Protein expression profiling of nuclear membrane protein reveals potential biomarker of human hepatocellular carcinoma. Clin Proteomics. 2013;10(1):6. doi:10.1186/1559-0275-10-6
39. Moukhadder HM, Halawi R, Cappellini MD, Taher AT. Hepatocellular carcinoma as an emerging morbidity in the thalassemia syndromes: a comprehensive review. Cancer. 2017;123(5):751–758. doi:10.1002/cncr.30462
40. Giardina B, Messana I, Scatena R, Castagnola M. The multiple functions of hemoglobin. Crit Rev Biochem Mol Biol. 1995;30(3):165–196. doi:10.3109/10409239509085142
41. Yang Q, Bai SY, Li LF, et al. Human hemoglobin subunit beta functions as a pleiotropic regulator of RIG-I/MDA5-Mediated antiviral innate immune responses. J Virol. 2019;93:16. doi:10.1128/JVI.00718-19
42. Lee NP, Chen L, Lin MC, et al. Proteomic expression signature distinguishes cancerous and nonmalignant tissues in hepatocellular carcinoma. J Proteome Res. 2009;8(3):1293–1303. doi:10.1021/pr800637z
43. Rozpedek W, Pytel D, Mucha B, Leszczynska H, Diehl JA, Majsterek I. The Role of the PERK/eIF2alpha/ATF4/CHOP signaling pathway in tumor progression during endoplasmic reticulum stress. Curr Mol Med. 2016;16(6):533–544. doi:10.2174/1566524016666160523143937
44. Moon HW, Han HG, Jeon YJ. Protein quality control in the endoplasmic reticulum and cancer. Int J Mol Sci. 2018;19:10. doi:10.3390/ijms19103020
45. Gao Y, Liu HY, Ni XZ. Elementary the transformation of cancer cell. J Changchun Teachers College. 2002.
46. Rulten SL, Kinloch RA, Tateossian H, Robinson C, Gettins L, Kay JE. The human FK506-binding proteins: characterization of human FKBP19. Mammalian Genome. 2006;17(4):322–331.
47. Lin IY, Yen CH, Liao YJ, et al. Identification of FKBP11 as a biomarker for hepatocellular carcinoma. Anticancer Res. 2013;33(6):2763–2769.
48. Shuda M, Kondoh N, Imazeki N, et al. Activation of the ATF6, XBP1 and grp78 genes in human hepatocellular carcinoma: a possible involvement of the ER stress pathway in hepatocarcinogenesis. J Hepatol. 2003;38(5):605–614. doi:10.1016/S0168-8278(03)00029-1
49. Li D, Liu X, Zhou J, et al. Long noncoding RNA HULC modulates the phosphorylation of YB-1 through serving as a scaffold of extracellular signal–regulated kinase and YB-1 to enhance hepatocarcinogenesis. Hepatology. 2017;65(5):1612–1627. doi:10.1002/hep.29010
50. Pagano C, Di Martino O, Ruggiero G, et al. The tumor-associated YB-1 protein: new player in the circadian control of cell proliferation. Oncotarget. 2017;8(4):6193–6205. doi:10.18632/oncotarget.14051
51. Shiota M, Fujimoto N, Imada K, et al. Potential Role for YB-1 in castration-resistant prostate cancer and resistance to enzalutamide through the androgen receptor V7. J Natl Cancer Inst. 2016;108(7):Jul. doi:10.1093/jnci/djw005
52. Chao HM, Huang HX, Chang PH, Tseng KC, Miyajima A, Chern E. Y-box binding protein-1 promotes hepatocellular carcinoma-initiating cell progression and tumorigenesis via Wnt/beta-catenin pathway. Oncotarget. 2017;8(2):2604–2616. doi:10.18632/oncotarget.13733
53. Chen YR, Sekine K, Nakamura K, Yanai H, Tanaka M, Miyajima A. Y-box binding protein-1 down-regulates expression of carbamoyl phosphate synthetase-I by suppressing CCAAT enhancer-binding protein-alpha function in mice. Gastroenterology. 2009;137(1):330–340. doi:10.1053/j.gastro.2009.02.064
 © 2021 The Author(s). This work is published and licensed by Dove Medical Press Limited. The full terms of this license are available at https://www.dovepress.com/terms.php and incorporate the Creative Commons Attribution - Non Commercial (unported, v3.0) License.
By accessing the work you hereby accept the Terms. Non-commercial uses of the work are permitted without any further permission from Dove Medical Press Limited, provided the work is properly attributed. For permission for commercial use of this work, please see paragraphs 4.2 and 5 of our Terms.
© 2021 The Author(s). This work is published and licensed by Dove Medical Press Limited. The full terms of this license are available at https://www.dovepress.com/terms.php and incorporate the Creative Commons Attribution - Non Commercial (unported, v3.0) License.
By accessing the work you hereby accept the Terms. Non-commercial uses of the work are permitted without any further permission from Dove Medical Press Limited, provided the work is properly attributed. For permission for commercial use of this work, please see paragraphs 4.2 and 5 of our Terms.