")
Back to Journals » OncoTargets and Therapy » Volume 9
Tandem mass spectrometry-based newborn screening strategy could be used to facilitate rapid and sensitive lung cancer diagnosis
Authors huang T, Cao Y, zeng J, Dong J, Sun X, chen J, Gao P
Received 25 October 2015
Accepted for publication 5 January 2016
Published 26 April 2016 Volume 2016:9 Pages 2479—2487
DOI https://doi.org/10.2147/OTT.S99099
Checked for plagiarism Yes
Review by Single anonymous peer review
Peer reviewer comments 4
Editor who approved publication: Dr Jianmin Xu
Ting Huang,1,* Yunfeng Cao,1,* Jia Zeng,1 Jun Dong,2 Xiaoyu Sun,2 Jianxing Chen,1 Peng Gao2,3
1Key Laboratory of Contraceptives and Devices Research (NPFPC), Shanghai Engineer and Technology Research Center of Reproductive Health Drug and Devices, Shanghai Institute of Planned Parenthood Research, Shanghai, 2Clinical Laboratory, Dalian Sixth People’s Hospital, 3CASKey Laboratory of Separation Science for Analytical Chemistry, Dalian Institute of Chemical Physics, Chinese Academy of Sciences, Dalian, People’s Republic of China
*These authors contributed equally to this work
Objective: Newborn screening (NBS) helps in the early detection of inborn errors of metabolism (IEM). The most effective NBS strategy prevailing in clinics is tandem mass spectrometry (MS/MS) analysis using dried blood spot (DBS) samples. Taking lung cancer (LC) as an example, this study tried to explore if this technique could be of any assistance for the discovery of tumor metabolite markers.
Materials and methods: Twenty-six acylcarnitines and 23 amino acids, which are commonly used in IEM screening, were quantified using DBS samples from 222 LC patients, 118 benign lung disease (LD) patients, and 96 healthy volunteers (CONT). Forty-four calculated ratios based on the abovementioned metabolites were also included using MS/MS quantification results.
Results: This pilot study led to the findings of 65 significantly changed amino acids, acylcarnitines, and some of their ratios for the LC, LD, and CONT groups. Among the differential parameters, 12 items showed reverse changing trends between the LC and LD groups compared to the CONT group. Regression analysis demonstrated that six of them – Arg, Pro, C10:1, Arg/Orn, Cit/Arg, and C5-OH/C0 – could be used to diagnose LC with a sensitivity of 91.3% and a specificity of 92.7%.
Conclusion: This study demonstrated the DBS-based MS/MS strategy was a promising tool for the discovery of tumor metabolite markers. Remarkably, this MS/MS analysis could be finished in several minutes, implying that it was a proper measure complementary to the traditional serum protein biomarker quantitation strategy for cancerous disease diagnosis and screening purposes.
Keywords: lung cancer, mass spectrometry, newborn screening tests
Introduction
Newborn screening (NBS) helps in the early detection of inborn errors of metabolism (IEM). IEM consists of a group of metabolic disorders manifested by varied types of abnormal accumulation or deficiency of carbohydrates, amino acids, nucleic acids, steroids, and metals. Every IEM has its specific genetic deficiency and ~1,000 IEM mechanisms have been disclosed to date. These genetic abnormalities usually affect the structure of certain enzymes, availability of enzyme-specific cofactors, or biological processing of the enzymes. The typical pathological features of IEM include upstream substrate accumulation, downstream product shortage, or secondary metabolic byproduct overgeneration.1 It was estimated that the average morbidity due to IEM was ~1/4,000 in newborns.2
Tumor cells are transformed cells that evolve from normal cells. Genetic mutations can be found in nearly all tumor cells, although a single type of cancer can own different mutations or vice versa.3 The theory of “Warburg effect” demonstrates that cancer cells show distinct metabolic features compared to their normal counterparts. As observed in IEM, many metabolites are found to be abnormally accumulated and/or decreased in tumor tissues. For example, higher concentrations of blood branched-chain amino acids (BCAAs) are the pathological factors of maple syrup urine disease, a typical IEM. Recently, it was found that hepatocellular carcinoma and pancreatic adenocarcinoma were also linked to elevated blood BCAAs.4,5 Medium-chain acyl-CoA dehydrogenase (MCAD) deficiency will result in a series of IEM diseases characterized by abnormal organic acid metabolism, whereas dysregulated MCADs could be found in lung and hepatic cancers.6,7 Some IEM diseases are caused by secondary metabolite overproduction. For instance, phenylketonuria is due to the deficiency of phenylalanine hydroxylase. In this condition, phenylalanine is excessively converted into phenylpyruvate through an alternative pathway. Cancer cells can also transform normal substrates to uncommon byproducts. This can be demonstrated by the fact that malignant cells carrying isocitrate dehydrogenase mutations can catalyze isocitrate, on a large scale, to α-hydroxyglutarate instead of α-ketoglutarate.8 Furthermore, a body of evidence has shown that patients suffering from IEM diseases are susceptible to tumorigenesis.9 In this light, metabolic disorders are the common features of both IEM and cancerous diseases, implying the possibility that IEM screening measures could be, to some extent, used for cancer diagnosis purposes.
Tandem mass spectrometry (MS/MS) technology was first introduced into NBS in 1990.10 It plays key roles in IEM detection for its simultaneous multiple metabolite quantitation property. A single MS/MS run could be finished within 2–3 minutes, exhibiting great potential for high-throughput screening utilization.10 Currently, many countries have recommended MS/MS as one of the standard NBS techniques.11,12 The most popular sample type for NBS is the so-called dried blood spot (DBS) specimen. The notion of collecting blood samples for biochemical analysis on filter paper was first described by Ivar Christian Bang nearly a century ago.13 Subsequently, this method gained wide applications in clinical laboratories and was proved to be an effective and economic way of sampling blood. The distinct advantages of DBS sampling are 1) less blood volume is needed compared to the traditional venous blood sampling, which is often not compatible with pediatric patients; 2) sampling equipment is easy to operate and no expensive vacuum tube is needed; and 3) DBS can be stored for a long time using limited space with nearly no analyte degradation.13
Lung cancer (LC) is one of the lethal malignancies worldwide and has become the leading cause of cancer-related death globally. It was estimated that ~1.6 million cases were diagnosed and resulted in 1.4 million deaths in 2008.14 The prevailing diagnosis measures for LC in clinics include protein biomarker quantification, radiologic imaging, sputum cytology, and endoscopic examination. Of note, their sensitivities and specificities are not fully satisfied. In a study, it was found that 75% of the patients were diagnosed at later stages of disease, impairing the selection of effective therapeutic interventions and resulting in a 5-year survival rate of only 5%–10%.15 Taking LC as an example, this study would employ the popular NBS strategy, DBS-based MS/MS analysis, to test whether it could be used for LC diagnosis. The targeted analytes in this study included 26 acylcarnitines and 23 amino acids which are commonly used in IEM screening.16 These metabolites can reflect the systemic status of amino acid and fatty acid metabolism, and pathological changes associated with them are frequently encountered in most tumors including LC. In order to facilitate locking specific enzymatic activity fluctuation and enrich the data information, 44 calculated ratios based on the abovementioned metabolites were also included (our recently published results).
Materials and methods
Clinical samples
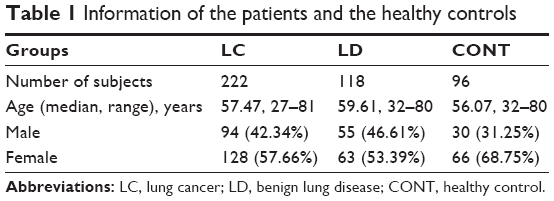
For this study, 222 LC patients, 118 benign lung disease (LD) patients, and 96 healthy volunteers (CONT) were enrolled from the First Affiliated Hospital of Liaoning Medical University. The LC patients with non-small-cell lung cancer (NSCLC) included those with adenocarcinoma (n=47), squamous carcinoma (n=103), adenosquamous carcinoma (n=49), and carcinoids (n=6). There were 17 small-cell lung cancer (SCLC) patients. Detailed information is given in Table 1. Before the study, written informed consents were acquired from the patients. The whole study was approved by the Hospital Ethics Committee of the First Affiliated Hospital of Liaoning Medical University and carried out in accordance with the Guidelines of the Hospital Ethics Committee of the First Affiliated Hospital of Liaoning Medical University. None of the LC patients had received chemotherapy or radiation treatment before sample collection. Every fasting blood DBS sample was collected from the tip of the distal phalanx of the third finger. The first drop of blood was discarded. The subsequent naturally formed blood drops were separately spotted onto the aseptic filter paper without the fingertip touching the paper surface. After drying at room temperature overnight, the sample paper was stored at −20°C in an airtight plastic bag individually. Then, 80% samples of each group were randomly selected as the training set to find differential metabolites and construct a regression model. The remaining 20% samples of each group were used for model validation purpose.
 | Table 1 Information of the patients and the healthy controls |
Chemicals
HPLC-grade acetonitrile (ACN), methanol, and pure water used for the experiments were all the products of Thermo Fisher Scientific (Waltham, MA, USA). 1-Butanol and acetyl chloride were provided by Sigma-Aldrich Co. (St Louis, MO, USA). Internal standard kits containing 12 isotope-labeled amino acids (catalog number: NSK-A) and eight acylcarnitines (catalog number: NSK-B) were used for absolute quantification purposes. They all were purchased from Cambridge Isotope Laboratories (Andover, MA, USA). The standards were separately dissolved in every 1 mL of pure methanol and then mixed together to construct a stock solution and stored at 4°C. Working solution was prepared by diluting the stock solution 100 times. For quality control (QC) purposes, kits containing mixed standard amino acids and acylcarnitines were purchased from Chromsystems (Grafelfing, Germany). The QC samples were processed as real samples and randomly inserted in the real sample analysis queue.
Sample preparation
A blood spot disc with a diameter of 3 mm (~3.2 μL of whole blood) from each filter was punched out. The disc was placed in a well of a Millipore MultiScreen HV 96-well plate (Merck KGaA, Darmstadt, Germany) containing 100 μL of freshly prepared working solution. The disc-containing plate was gently shaken for 20 minutes at room temperature to release metabolites from the filter discs. For each plate, at least four low-level and high-level QC solutions were added into randomly selected empty wells. The QC samples were analyzed in parallel with the real samples to ensure the stability of the analysis. Subsequently, the disc-containing plate was centrifuged at 1,500× g for 2 minutes to collect the filtrate into a new flat-bottom 96-well plate installed below the disc-containing plate. The filtrate was dried by pure nitrogen gas (50°C). For each well, 60 μL of 1-butanol and acetyl chloride mixture (90:10, v/v) was added and incubated at 65°C for 20 minutes for metabolite derivatization. After a second drying procedure by nitrogen gas, 100 μL of mobile phase solution was added into each well to redissolve the derivatized metabolites.
MS/MS analysis
For metabolite MS/MS analysis, an AB SCIEX 4000 QTrap system (Framingham, MA, USA) equipped with an electrospray ionization (ESI) source was employed in positive scan mode. For each analysis, 20 μL of redissolved solution was injected, and 80% ACN aqueous solution was used as mobile phase with an initial flow rate of 0.18 mL/min. When the sample was introduced into the MS system for 8 seconds, the flow rate immediately decreased to 0.02 mL/min within 2 seconds and remained constant for 0.07 minutes. Subsequently, the flow rate increased to 0.6 mL/min within 0.5 minutes and remained constant for another 0.5 minutes. After that, the flow rate returned to 0.18 mL/min for equilibration. The total runtime was 2 minutes for each single run. A 4.5 kV ion spray voltage was applied to the MS system. Pressures for ion source gas 1, Ion Source Gas 2, and curtain gas were 35, 35, and 20 psi, respectively. Auxiliary gas temperature was maintained at 350°C. The scan parameters for the considered metabolites were identical to our previous report.16 MS/MS data were collected by using Analyst v1.6.0 (AB SCIEX). ChemoView 2.0.2 software (AB SCIEX) was used for absolute quantification purposes.
MS/MS data analysis
For the analysis, 80% of randomly selected raw quantitation data from each group were fed to SIMCA-P v11.5 software (Umetrics AB, Umea, Sweden) for partial least squares-discriminant analysis (PLS-DA) to find the difference among the groups. Potential metabolite markers were first selected based on the algorithm of significant analysis of microarrays (SAM)17 and then confirmed by one-way analysis of variance (ANOVA) or Student’s t-test (P<0.05 is considered significant). Metabolites showed reverse changing trends between the LC and LD groups compared to the CONT group subjected to binary logistic regression analysis to construct a diagnosis model. The diagnostic ability of the model was evaluated by the area under the receiver operating characteristic (ROC) curve (AUC). The diagnosis accuracy of this regression model was further validated by the remaining 20% samples from each group. All statistical analyses were conducted by using MINITAB v16.0 software (State College, PA, USA).
Results
QC sample data were first evaluated to ensure methodological applicability. All the QC values fell within the recommended ±2 standard deviation (SD) ranges (data not shown). This indicated that the adopted NBS tactic was stable and could be used to analyze real samples. For different LC types, the detected parameters showed no difference. This might be due to the fact that the parameters selected in this study could only reflect the general features of LC, or that the included patient numbers of different types were not sufficient enough to show subtype difference. PLS-DA was then used to differentiate the LC, LD, and CONT groups. It gave a relatively clear separation between the LC and non-LC (LD and CONT) groups (Figure 1A). A validation test based on 100 permutations indicated that no overfitting occurred in the analysis with the intercepts of R2=0.086 and Q2=−0.231 (Figure 1B).18 Evidently, Figure 1A shows a complete overlap between the LD and CONT groups, indicating that benign lung diseases did not cause substantial metabolic changes as malignant lung diseases.
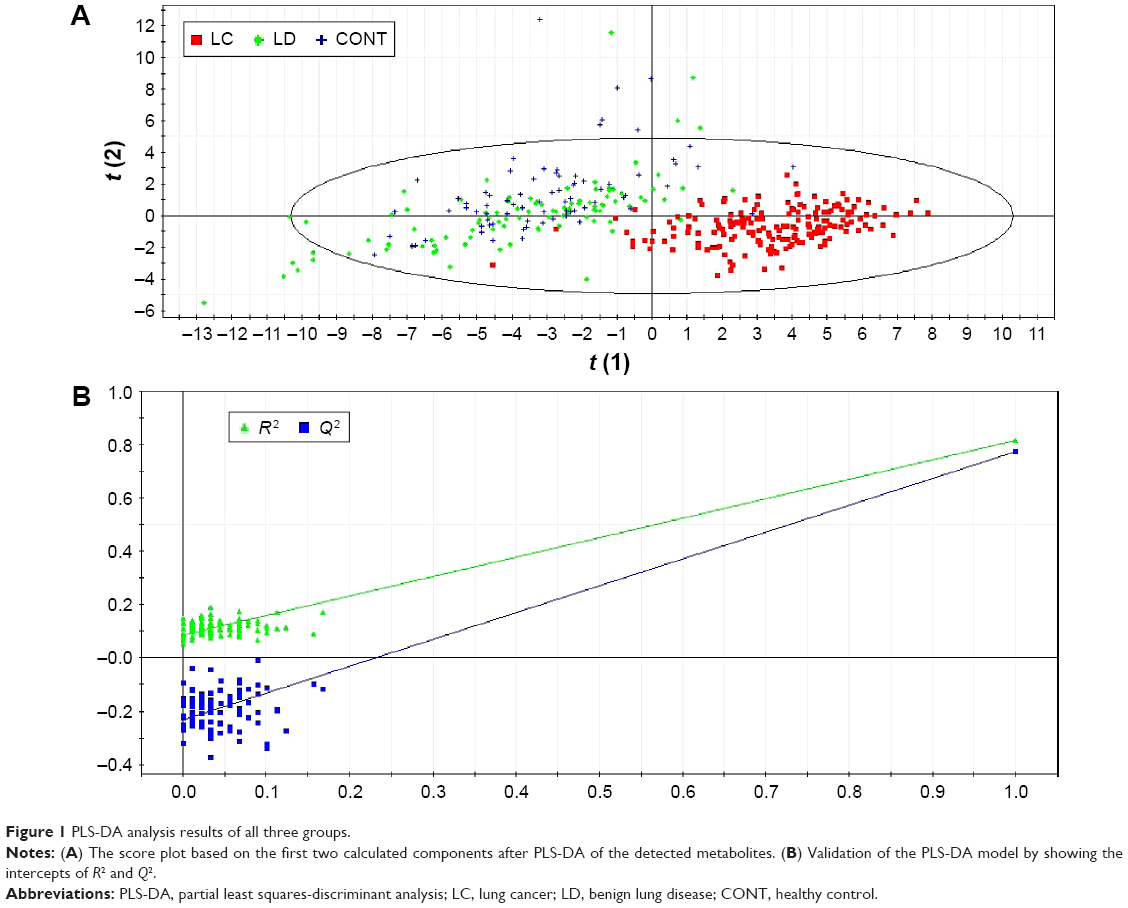 | Figure 1 PLS-DA analysis results of all three groups. |
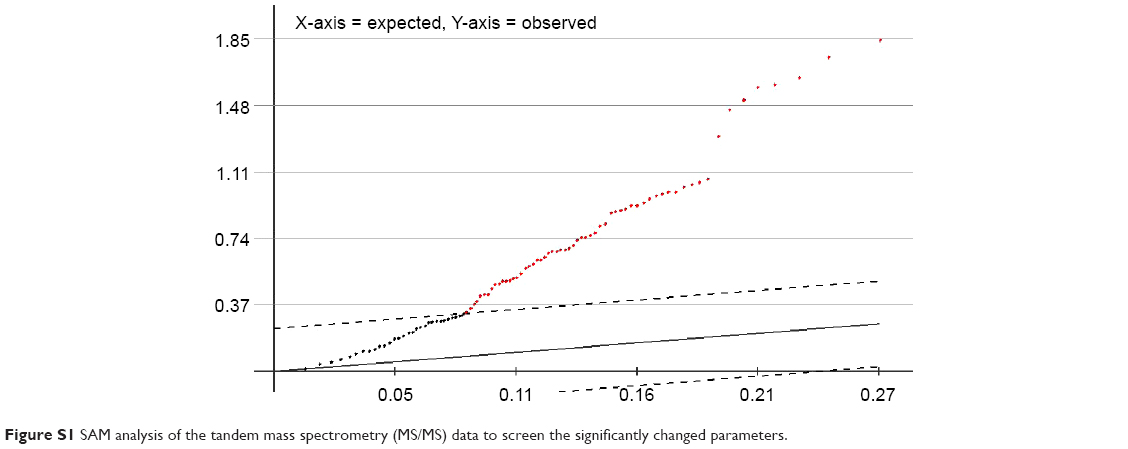
In the next step, SAM analysis was carried out to select the differentially changed metabolites and calculated ratios among the three groups. It was shown that the blood levels of 65 parameters were different at least between two randomly selected groups (Figure S1). Further analyzed by one-way ANOVA, all the 65 parameters changed significantly (P<0.05) as presented in the heat map (Figure 2).
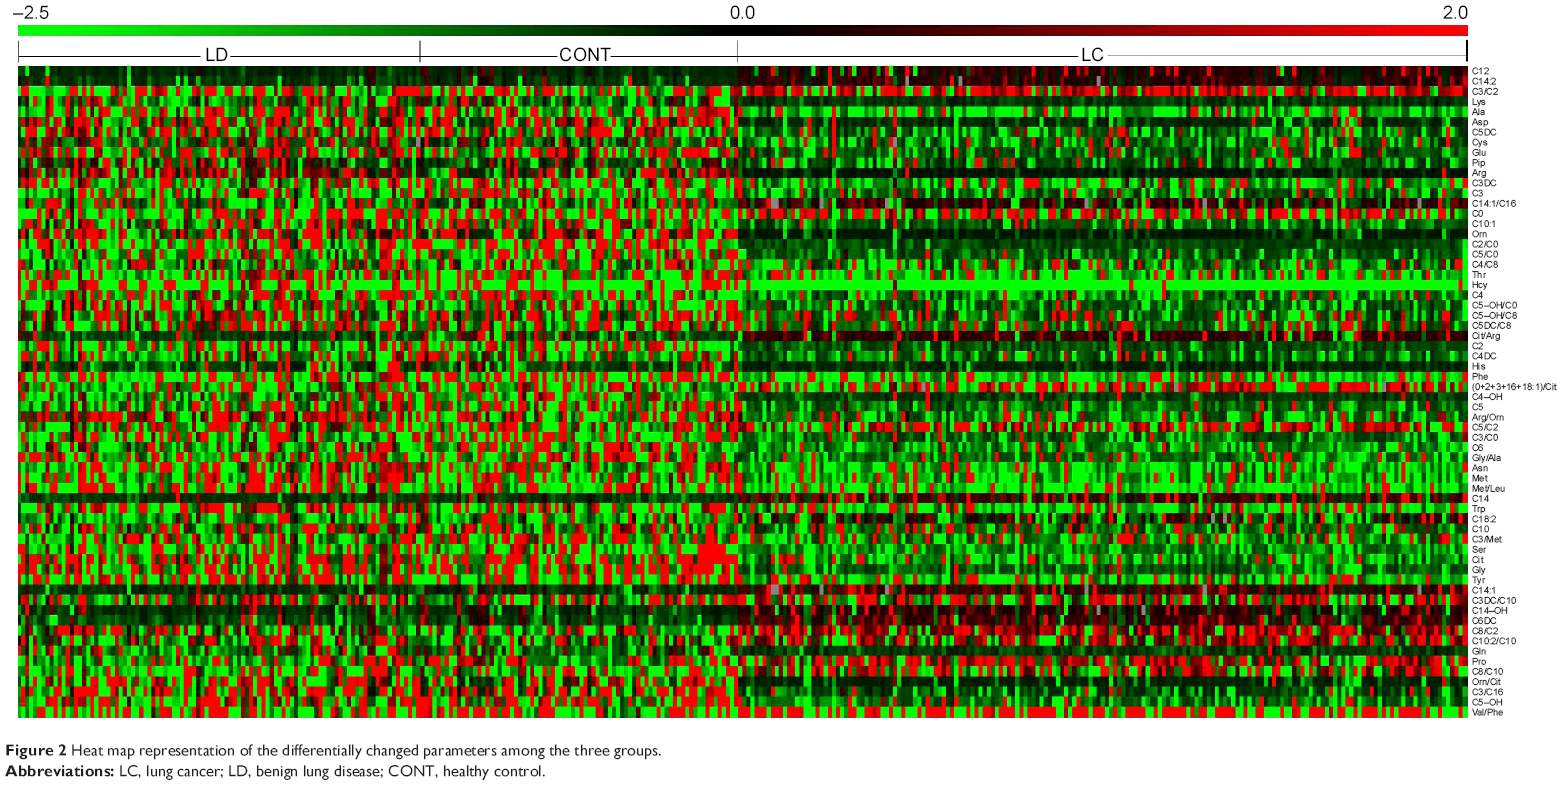 | Figure 2 Heat map representation of the differentially changed parameters among the three groups. |
To further investigate whether the adopted method could facilitate LC diagnosis, the data shown in Figure 2 were explored to find the parameters that showed reverse changing trends between the LC and LD groups as compared to the CONT group. The results showed that 12 parameters showed reverse changing trends. They included nine endogenous metabolites and three calculated ratios (Figure 3). Compared to the CONT group, Pro, C12, C14, C14:1, and Cit/Arg levels were elevated in the LC group but decreased in the LD group. On the contrary, Arg, Hcy, Pip, Arg/Orn, C5-OH/C0, and C10:1 levels were decreased in the LC group and increased in the LD group. These results indicate that benign lung diseases would result in some reversible metabolic changes as compared to those of the malignant lung diseases.
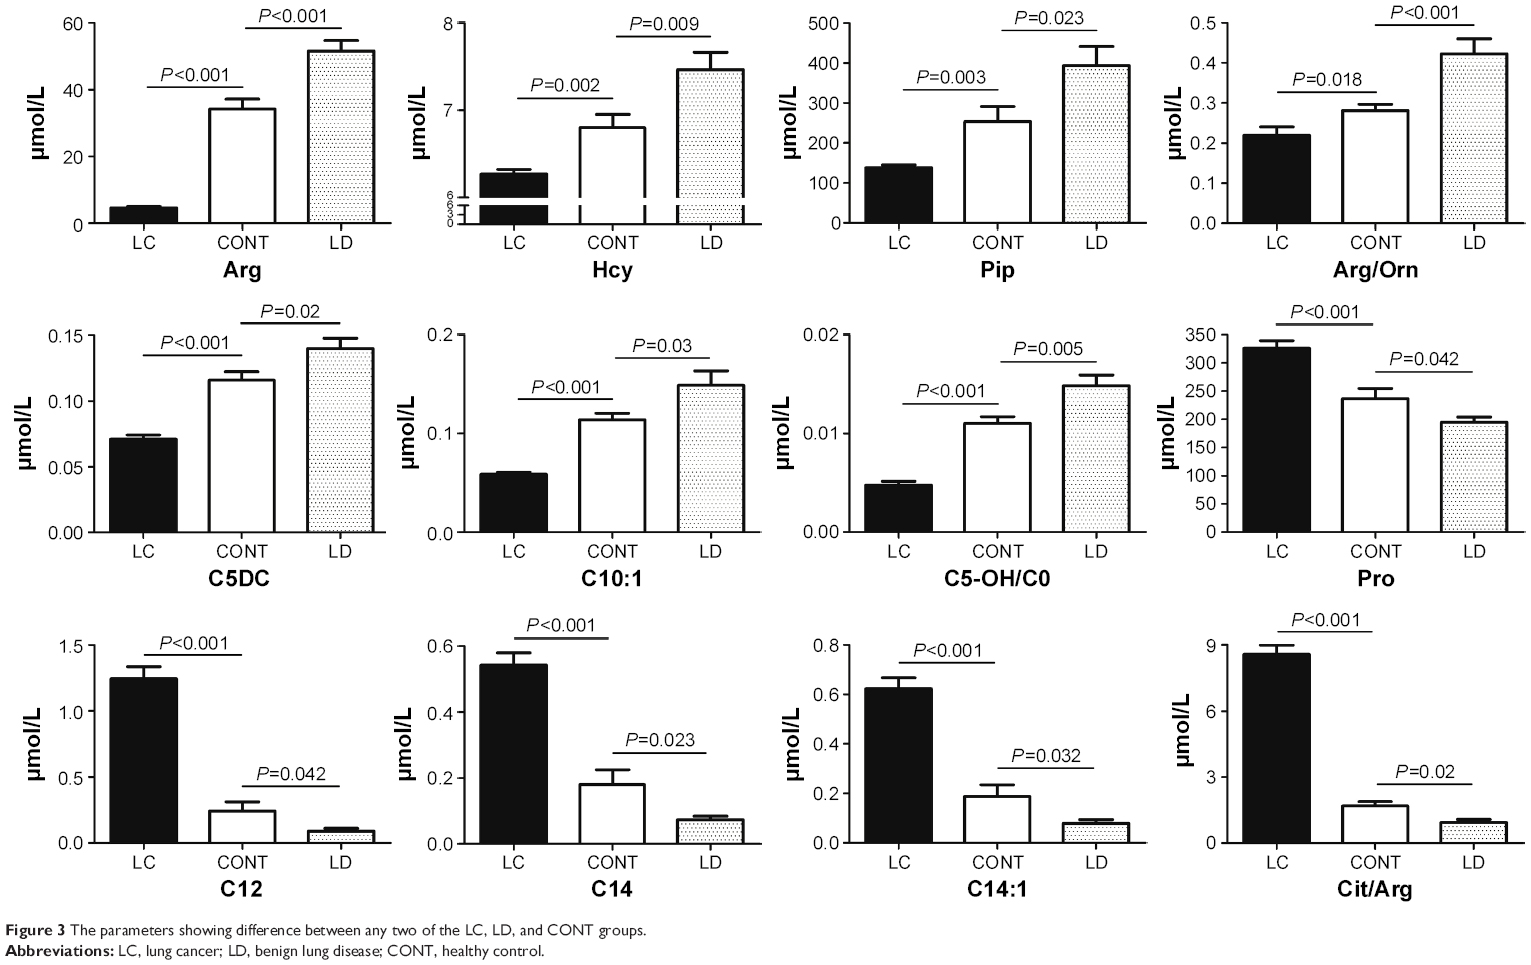 | Figure 3 The parameters showing difference between any two of the LC, LD, and CONT groups. |
In the context of clinical utilization, these 12 parameters were further processed through a binary logistic regression analysis to establish a model for malignant and nonmalignant disease diagnosis. The final model included six parameters: Arg, Pro, C10:1, Arg/Orn, Cit/Arg, and C5-OH/C0 (P<0.05). ROC curve analysis indicated that diagnosis with a sensitivity of 91.3% and a specificity of 92.7% could be obtained if an optimal cutoff value of 0.766 was selected (Figure 4). The AUC was 0.967, indicating that this statistic model was robust for diagnostic purpose. On evaluation by another set of samples, the diagnosis accuracy of this regression model was 91.9% (68/74, with a sensitivity of 92.5% and a specificity of 91.2%). This diagnosis ability was comparable to that obtained by the combined use of routine multiple protein tumor markers for LC diagnosis.14
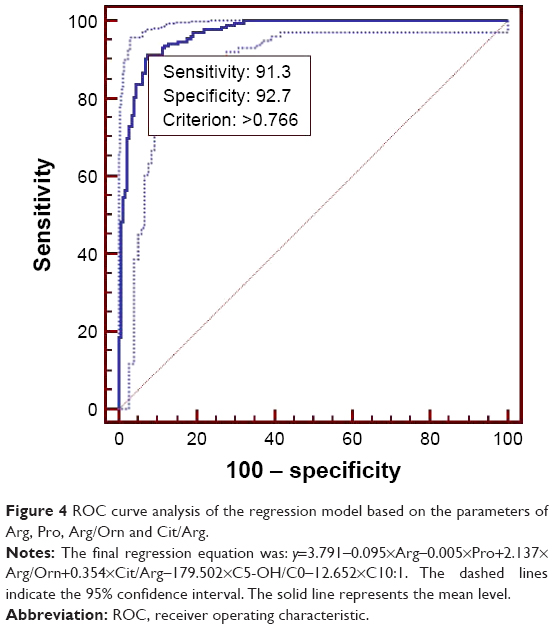 | Figure 4 ROC curve analysis of the regression model based on the parameters of Arg, Pro, Arg/Orn and Cit/Arg. |
Discussion
The search for new tumor markers has become a hot spot in all cancerous diseases including LC. Low-dose computed tomography could result in over 90% false-positive rates for LC diagnosis.14 The other strategies used were either with low sensitivity or with low specificity.14 One of the first used tumor markers for LC diagnosis is carcinoembryonic antigen (CEA). But, extremely elevated CEA levels could only account for 40%–80% of LC patients. It is most valuable as a prognostic marker rather than a diagnosis marker when used independently.19 Neuron-specific enolase (NSE) is another commonly used LC marker. Approximately, 40%–70% of LC patients, especially those suffering from SCLC, could have higher blood NSE levels. Approximately, 11%–41% of non-SCLC patients could be detected with elevated serum NSE levels. Similar to CEA, NSE tends to be used as a prognostic marker.19 The other markers include tissue polypeptide antigen and squamous cell carcinoma-related antigen. All of them are not sensitive enough and lack the specificity for LC if used individually. A recent report showed that combined use of different serum tumor biomarkers could improve LC diagnosis sensitivity and/or specificity.14 Remarkably, quantitation of these multiple serum protein markers is not cost-effective. What makes things worse is that nearly all the currently used LC biomarkers can elevate in benign lung diseases separately or collectively.14
Through sequential statistical analysis, at least 65 parameters were found to be differently expressed in the three groups (Figure 2). We speculated that benign lung diseases are characterized by reversible metabolic changes, but malignant lung diseases are the result of substantial irreversible metabolic remodeling.20 In order to avoid interference from the benign lung diseases, attention was paid to screening parameters that changed reversibly between the LC and LD groups as compared to the CONT group. Finally, 12 parameters were locked (Figure 3). Further filtered by regression analysis, the remaining six parameters could be sufficiently utilized for LC diagnosis purposes.
Increased blood Pro concentration has been found in various tumors.21,22 Pro is the only secondary amino acid involved in protein synthesis, and shows distinct biological functions compared to other primary amino acids.23 It plays significant roles in maintaining cancer cell proliferation and invasion and is also an anti-stress agent.24 Pro can be synthesized from Arg. The decreased concentrations of Arg in LC (Figure 3) might be due to its excessive conversion into Pro. For Pro synthesis, Arg should be first converted into Orn, which mainly takes place in the urea cycle. In the LC group, blood Arg/Orn was lower than that of the normal people. This evidence might partially explain the abovementioned deduction.23 Decreased Cit/Arg ratios were reported in interferon-α-treated cancer patients.25 Thus, this study implied that urea cycle intermediates play key roles in LC progression.
Acylcartinine-related parameters included in the regression model were also decreased in the LC group but increased in the LD group (Figure 3). Most of them were medium- and long-chain acylcarnitines, indicating the compromised mitochondrial β-oxidation functions. Impaired mitochondrial function is a universal pathological feature in nearly all tumors. A previous report also indicated that decreased medium- and long-chain acylcarnitines could be found in the urine of non-SCLC patients,26 whereas the exact biological significance is still elusive.
Conclusion
In this study, the DBS-based MS/MS NBS strategy was successfully used to assist in LC diagnosis. Combining six parameters, a regression model was constructed to realize accurate diagnosis of LC, which was comparable to the integrated utilization of some traditional serum protein biomarkers. Further analysis will focus on the integrated use of protein and metabolite markers to improve LC diagnosis accuracy. The employed MS/MS analysis could be completed in 2–3 minutes and was compatible with screening purposes. The cost to perform the MS/MS analysis is just similar to one tumor protein marker detection by immunochemiluminometric analysis, which meant that it was a cost-effective method for screening purposes. Here, only LC was selected as an example. It can be expected that this MS/MS analysis can be applied to explore the potential of metabolite markers for the diagnosis of other cancerous diseases.
Acknowledgment
This study was partially supported by the project from the Science and Technology Department of Liaoning Province.
Disclosure
The authors report no conflicts of interest in this work.
References
Lanpher B, Brunetti-Pierri N, Lee B. Inborn errors of metabolism: the flux from Mendelian to complex diseases. Nat Rev Genet. 2006;7(6):449–460. | ||
Zytkovicz TH, Fitzgerald EF, Marsden D, et al. Tandem mass spectrometric analysis for amino, organic, and fatty acid disorders in newborn dried blood spots: a two-year summary from the New England Newborn Screening Program. Clin Chem. 2001;47(11):1945–1955. | ||
Duesberg P, Mandrioli D, McCormack A, et al. Is carcinogenesis a form of speciation? Cell Cycle. 2011;10(13):2100–2114. | ||
Burrage LC, Nagamani SC, Campeau M, et al. Branched-chain amino acid metabolism: from rare Mendelian diseases to more common disorders. Hum Mol Genet. 2014;23(R1):R1–R8. | ||
Mayers JR, Wu C, Clish CB, et al. Elevation of circulating branched-chain amino acids is an early event in human pancreatic adenocarcinoma development. Nat Med. 2014;20(10):1193–1198. | ||
Huang D, Li T, Li X, et al. HIF-1-mediated suppression of acyl-CoA dehydrogenases and fatty acid oxidation is critical for cancer progression. Cell Rep. 2014;8(6):1930–1942. | ||
Sohn EJ, Kim J, Hwang Y, et al. TGF-beta suppresses the expression of genes related to mitochondrial function in lung A549 cells. Cell Mol Biol. 2012;Suppl 58:OL1763–OL1767. | ||
Parker SJ, Metallo CM. Metabolic consequences of oncogenic IDH mutations. Pharmacol Ther. 2015;152:54–62. | ||
Onal IK, Turhan N, Oztas E, et al. Hepatocellular carcinoma in an adult patient with type IV glycogen storage disease. Acta Gastroenterol Belg. 2009;72(3):377–378. | ||
Millington DS, Kodo N, Norwood DL, et al. Tandem mass spectrometry: a new method for acylcarnitine profiling with potential for neonatal screening for inborn errors of metabolism. J Inherit Metab Dis. 1990;13(3):321–324. | ||
Pandor A, Eastham J, Chilcott J, et al. Economics of tandem mass spectrometry screening of neonatal inherited disorders. Int J Technol Assess Health Care. 2006;22(3):321–326. | ||
Pandor A, Eastham J, Beverley C, et al. Clinical effectiveness and cost-effectiveness of neonatal screening for inborn errors of metabolism using tandem mass spectrometry: a systematic review. Health Technol Assess. 2004;8(12):iii1–iii121. | ||
Gruner N, Stambouli O, Ross RS. Dried blood spots – preparing and processing for use in immunoassays and in molecular techniques. J Vis Exp. 2015;13(97):e52619. | ||
Hirales Casillas CE, Flores Fernandez JM, Padilla CE, et al. Current status of circulating protein biomarkers to aid the early detection of lung cancer. Future Oncol. 2014;10(8):1501–1513. | ||
Spiro SG, Porter JC. Lung cancer – where are we today? Current advances in staging and nonsurgical treatment. Am J Respir Crit Care Med. 2002;166(9):1166–1196. | ||
Wang Q, Sun T, Cao Y, et al. A dried blood spot mass spectrometry metabolomic approach for rapid breast cancer detection. OncoTargets and Therapy. 2016;9:1389–1398. | ||
Tusher VG, Tibshirani R, Chu G. Significance analysis of microarrays applied to the ionizing radiation response. Proc Natl Acad Sci U S A. 2001;98(9):5116–5121. | ||
Huang Z, Lin L, Gao Y, et al. Bladder cancer determination via two urinary metabolites: a biomarker pattern approach. Mol Cell Proteomics. 2011;10(10):M111. | ||
Ferrigno D, Buccheri G. Clinical applications of serum markers for lung cancer. Respir Med. 1995;89(9):587–597. | ||
Warburg O. On the origin of cancer cells. Science. 1956;123(3191):309–314. | ||
Catchpole G, Platzer A, Weikert C, et al. Metabolic profiling reveals key metabolic features of renal cell carcinoma. J Cell Mol Med. 2011;15(1):109–118. | ||
Hirayama A, Kami K, Sugimoto M, et al. Quantitative metabolome profiling of colon and stomach cancer microenvironment by capillary electrophoresis time-of-flight mass spectrometry. Cancer Res. 2009;69(11):4918–4925. | ||
Phang JM, Pandhare J, Liu Y. The metabolism of proline as microenvironmental stress substrate. J Nutr. 2008;138(10):2008S–2015S. | ||
Liu W, Glunde K, Bhujwalla ZM, et al. Proline oxidase promotes tumor cell survival in hypoxic tumor microenvironments. Cancer Res. 2012;72(14):3677–3686. | ||
Fekkes D, Van Gool AR, Bannink M, et al. Nitric oxide production and monoamine oxidase activity in cancer patients during interferon-alpha therapy. Amino Acids. 2009;37(4):703–708. | ||
Wu Q, Wang Y, Gu X, et al. Urinary metabolomic study of non-small cell lung carcinoma based on ultra high performance liquid chromatography coupled with quadrupole time-of-flight mass spectrometry. J Sep Sci. 2014;37(14):1728–1735. |
Supplementary material
 | Figure S1 SAM analysis of the tandem mass spectrometry (MS/MS) data to screen the significantly changed parameters. |
 © 2016 The Author(s). This work is published and licensed by Dove Medical Press Limited. The full terms of this license are available at https://www.dovepress.com/terms.php and incorporate the Creative Commons Attribution - Non Commercial (unported, v3.0) License.
By accessing the work you hereby accept the Terms. Non-commercial uses of the work are permitted without any further permission from Dove Medical Press Limited, provided the work is properly attributed. For permission for commercial use of this work, please see paragraphs 4.2 and 5 of our Terms.
© 2016 The Author(s). This work is published and licensed by Dove Medical Press Limited. The full terms of this license are available at https://www.dovepress.com/terms.php and incorporate the Creative Commons Attribution - Non Commercial (unported, v3.0) License.
By accessing the work you hereby accept the Terms. Non-commercial uses of the work are permitted without any further permission from Dove Medical Press Limited, provided the work is properly attributed. For permission for commercial use of this work, please see paragraphs 4.2 and 5 of our Terms.