")
Back to Journals » International Journal of Chronic Obstructive Pulmonary Disease » Volume 11 » Issue 1
Systolic time intervals combined with Valsalva maneuver for the diagnosis of left ventricular dysfunction in COPD exacerbations
Authors Boubaker H, Grissa M, Beltaïef K , Dridi Z, Najjar MF , Bouida W, Boukef R, Marghli S, Nouira S
Received 13 September 2015
Accepted for publication 21 May 2016
Published 15 September 2016 Volume 2016:11(1) Pages 2237—2243
DOI https://doi.org/10.2147/COPD.S96280
Checked for plagiarism Yes
Review by Single anonymous peer review
Peer reviewer comments 2
Editor who approved publication: Dr Richard Russell
Hamdi Boubaker,1,2 Mohamed Habib Grissa,1,2 Kaouther Beltaief,1,2 Zohra Dridi,3 Mohamed Fadhel Najjar,4 Wahid Bouida,1,2 Riadh Boukef,5 Soudani Marghli,6 Semir Nouira1,2
1Department of Emergency, Fattouma Bourguiba University Hospital, 2Research Laboratory (LR12SP18), University of Monastir, 3Department of Cardiology, 4Department of Biochemistry, Fattouma Bourguiba University Hospital, Monastir, 5Department of Emergency, Sahloul University Hospital, Sousse, 6Department of Emergency, Tahar Sfar University Hospital, Mahdia, Tunisia
Background: The goal of this study was to determine the value of systolic time intervals and their change during Valsalva maneuver (VM) in the diagnosis of left ventricular dysfunction (LVD) in patients with acute exacerbation of chronic obstructive pulmonary disease (AECOPD).
Methods: We included 166 patients admitted to the emergency department for AECOPD. Measurement of systolic time intervals included electromechanical activation time (EMAT), left ventricular ejection time (LVET), and EMAT/LVET ratio. These were performed at baseline and during the first strain phase of the VM using a computerized phonoelectrocardiographic method. The diagnosis of LVD was determined on the basis of clinical examination, echocardiography, and brain natriuretic peptide. The values of systolic time intervals were compared between patients with and without LVD; their diagnostic performance was assessed using the area under receiver operating characteristic (ROC) curve.
Results: Patients with LVD (n=95) had a significantly higher EMAT and lower LVET and EMAT/LVET ratio compared to patients without LVD (n=71); the area under ROC curve was 0.79, 0.88, and 0.90, respectively, for EMAT, LVET, and EMAT/LVET ratio. All baseline systolic time intervals changed significantly during VM in patients without LVD but they did not change in patients with LVD. The area under ROC curve increased to 0.84 and 0.93, respectively, for EMAT and EMAT/LVET ratio but did not change for LVET.
Conclusion: Simple and noninvasive measurements of systolic time intervals combined with VM could be helpful to detect or rule out LVD in patients admitted to the emergency room for COPD excacerbation. The EMAT/LVET ratio seems to have the best diagnostic value.
Keywords: chronic obstructive pulmonary disease, exacerbation, systolic time intervals, Valsalva maneuver
Introduction
Acute exacerbations of chronic obstructive pulmonary disease (AECOPD) is the major cause of hospitalization of patients with COPD and have a considerable impact on morbidity, mortality, and quality of life. Common triggers for AECOPD include viral and/or bacterial infection of the tracheobronchial tree, but the cause of approximately one-third of severe exacerbations cannot be identified.1,2 However, cohort studies show that the frequency of left ventricular dysfunction (LVD) increases with COPD progression and is particularly common in patients hospitalized with an exacerbation of COPD.3 Therefore, optimizing the diagnosis of LVD could be useful in AECOPD as underdiagnosed and/or undertreated LVD may affect adversely the outcome.4 Echocardiography is a fundamental tool in the diagnosis of LVD but, it is not routinely available in the emergency room (ER). In an acute setting, brain natriuretic peptides (BNPs) could assist in identifying LVD but, in many patients, this biomarker has low diagnostic value in the gray zone.5 Thus, development of new methods that facilitate the accurate and inexpensive detection of LVD remains of great importance. One of the validated noninvasive methods of detecting LVD is the measurement of systolic time intervals by combining data from electrocardiography and phonocardiography or cardiothoracic impedance.6 Because LVD usually prolongs the electromechanical activation time (EMAT) and shortens the left ventricular ejection time (LVET), a number of clinical studies have demonstrated their value for assessing left ventricular performance in patients with heart failure.7–9 However, it remains uncertain whether systolic time intervals are useful in detecting LVD in the particular setting of AECOPD where LVD could be easily underdiagnosed.
The aim of this investigation was to assess the value of systolic time intervals as a method of detecting LVD in patients admitted to the emergency department for AECOPD and whether systolic time intervals measured during Valsalva maneuver (VM) could improve the distinction between patients with LVD and those without LVD.
Patients and methods
Study design and setting
This prospective study was performed in the ER of Fattouma Bourguiba University Hospital (Monastir, Tunisia) between April 2012 and December 2013. During this period, a total of 1,659 adults presenting with primary complaint of acute dyspnea were admitted to the ER. Patients diagnosed with AECOPD with no prior history of congestive heart failure were eligible for the study. AECOPD was defined as an increase in cough and dyspnea, and a change in sputum volume and purulence. Definition of COPD was ascertained by patient self-report and review of the prior medical record at the time of the ER visit. Exclusion criteria were patients with age <18 years, severe comorbidity, evident causes of dyspnea, hemodynamic instability, or immediate requirement of mechanical ventilation. We also excluded patients with cardiac rhythm other than a sinus or paced atrial rhythm, and those with severe mitral regurgitation or stenosis, constrictive pericarditis, and severe pulmonary hypertension. All patients gave written informed consent before enrollment, and the protocol was approved by the Ethics Committee of Fattouma Bourguiba University Hospital. The trial was registered with ClinicalTrials.gov NCT02481908.
Study protocol
After enrollment, patient’s demographic characteristics and baseline clinical data were determined based on a systematic review of clinical record. Within a 1-hour period, transthoracic echocardiography and BNP measurement were performed for all included patients. Echocardiography was performed by a trained emergency physician using a portable ultrasound system (SonoSite Inc, Bothell, WA, USA) with a 2.5 MHz array probe. Echocardiographic examination included M-mode and two-dimensional examination with pulsed Doppler analysis of mitral inflow. We calculated the left ventricular ejection fraction (LVEF) as:
|

We defined systolic dysfunction as LVEF of 50% or lower. We assessed diastolic function using peak early diastolic filling velocity (E velocity) and peak filling velocity at atrial contraction (A velocity). We categorized diastolic dysfunction according to published criteria.
Systolic time interval measurements
After echocardiographic examination, systolic time intervals were measured from simultaneous recording of the electrocardiogram and the phonocardiogram signals using an analog numeric system (Biopac Systems, Goleta, CA, USA). The acoustic cardiographic tracing was recorded from the upper part of the precordium in a position optimal for recording the initial high frequency vibrations of the second heart sound, corresponding usually to the second left intercostal space. The microphone used was in a frequency range of 100–500 Hz. For all patients, a 10-minute acoustic cardiographic tracing was obtained and stored electronically. The Q–S1 interval was measured from the initial deflection of the electrocardiographic Q wave to the first phonocardiographic complex. This interval was designated as the EMAT. The LVET, defined as the interval between the peak components of the S1 and S2 complexes, was measured on the same cardiac cycles and the EMAT/LVET ratio was calculated. The data acquired online were stored in a laptop for subsequent analysis. After baseline measurements, a calibrated VM lasting 10 seconds was performed in all included patients. A disposable mouthpiece and a disposable transducer (type TNF-R, Vigo-Spectramed, Bilthoven, the Netherlands) were connected by a homemade stainless steel tube. Prior to any measurement, VM was practiced to ensure that the patient was able to perform the maneuver. A second set of systolic time interval measurements was performed under VM. Values of EMATvm and LVETvm were calculated as the mean of EMAT and LVET, respectively, of the first three successive cardiac cycles under VM. All the studies were performed in patients in a semi-recumbent position with the head at 30° forward position. For each patient, measurements were performed twice and at least once, depending on the patient’s ability. A third one was required if the difference between the first two values was >10%. Between two successive maneuvers, there was a 2-minute period of rest. When more than one measurement of systolic time intervals during VM was obtained, the average value was calculated. The respiratory management was kept constant throughout the study period, with no change in pharmacologic treatment. Physicians performing the VM test were unaware of the patient’s final diagnosis. Two independent reviewers (one emergency physician and one cardiologist) blinded to the systolic time intervals results established the diagnosis of LVD on the basis of clinical data, BNP levels, and echocardiographic findings. To be diagnosed with LVD, the patient was required to have a BNP level >100 pg/mL and one or more echocardiographic criteria of left ventricular systolic or diastolic dysfunction.
The interobserver variability of systolic time interval measurements was determined in a blinded fashion. It was assessed in 20 randomly selected sets of measurements by calculating the ratio (expressed as a percentage) of the difference between the values obtained by each observer (expressed as absolute value) divided by the mean of the two values.
Statistical analysis
The patients were divided into two groups: group of patients identified as having LVD (with LVD) and a group of patients where the diagnosis of LVD was excluded (no LVD group). Variables were expressed as mean ± standard deviation, or median and interquartile range as appropriate. Comparisons were made among continuous variables using Student’s t-test for independent samples. Chi-square was used for discrete variables. Correlation between systolic time intervals values and BNP levels was computed by calculating Pearson’s correlation coefficient. Receiver operating characteristic (ROC) curves for predicting LVD were constructed and area under curve (AUC) was measured for the different systolic time interval variables. Sensitivity, specificity, positive and negative predictive values, and likelihood ratios of positive and negative results were calculated using the optimal cutoff value of the best systolic time interval assessed. A P-value <0.05 was considered statistically significant. Calculations were performed with a SPSS version 13 software package for Windows (SPSS Inc, Chicago, IL, USA).
Results
Characteristics of the patients
The clinical and demographic characteristics of the study patients at ER admission are presented in Table 1. One hundred and eighty-nine patients were included in the study, of which 23 patients were unable to perform VM. Among the 166 patients who completed the study, 71 were defined as having LVD. The interexpert agreement on the presence of LVD was good (Kappa =0.81). Patients with LVD were older and more likely to have a previous history of hypertension, coronary artery disease, and diabetes. They also had significantly lower LVEF and higher BNP values compared to patients without LVD (Table 1).
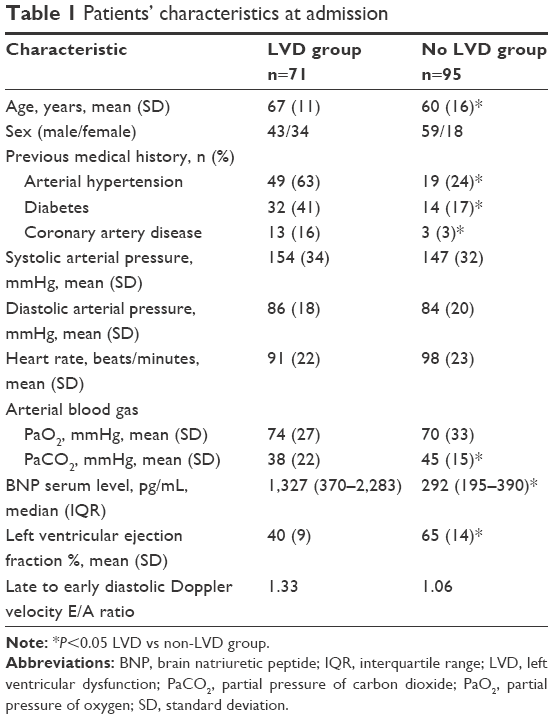 | Table 1 Patients’ characteristics at admission |
Systolic time intervals
Mean time between ER admission and systolic time interval measurements was 151±55 minutes. The interobserver variability was 9%±5% and the intraobserver variability was 5%±3%. Patients with LVD had significantly higher EMAT (114±31 ms vs 93±17 ms, P<0.001) and lower LVET (304±60 ms vs 404±53 ms, P<0.001) than those without LVD. As a result, EMAT/LVET ratio was significantly higher in the LVD group (Table 2). The area under receiver operating characteristic (ROC) curve for LVD was 0.79, 0.88, and 0.90, respectively, for EMAT, LVET, and EMAT/LVET ratio. We found a significant correlation between systolic time intervals and BNP serum levels (Table 3). The highest correlation was found with EMAT/LVET ratio (r2=0.48, P<0.001). Distribution of the three systolic time intervals values in LVD and non-LVD groups is shown in Figure 1. A value of EMAT/LVET ratio >0.25 predicted LVD with 88% sensitivity, 84% specificity, 90% positive predictive value, and 89% negative predictive value. This cutoff provided a positive likelihood ratio value of 5.5 and a negative likelihood ratio of 0.1.
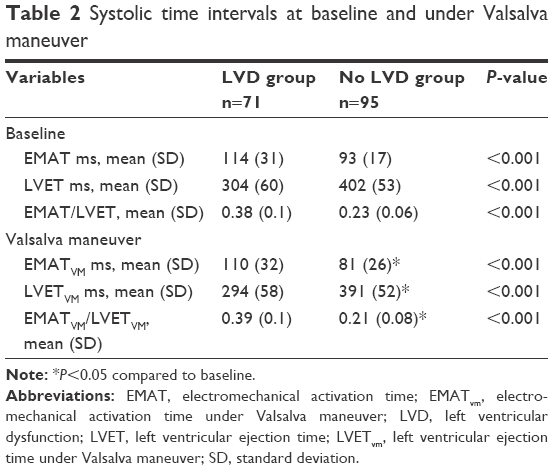 | Table 2 Systolic time intervals at baseline and under Valsalva maneuver |
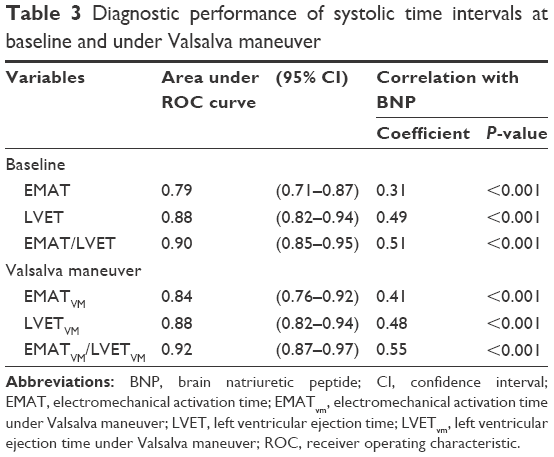 | Table 3 Diagnostic performance of systolic time intervals at baseline and under Valsalva maneuver |
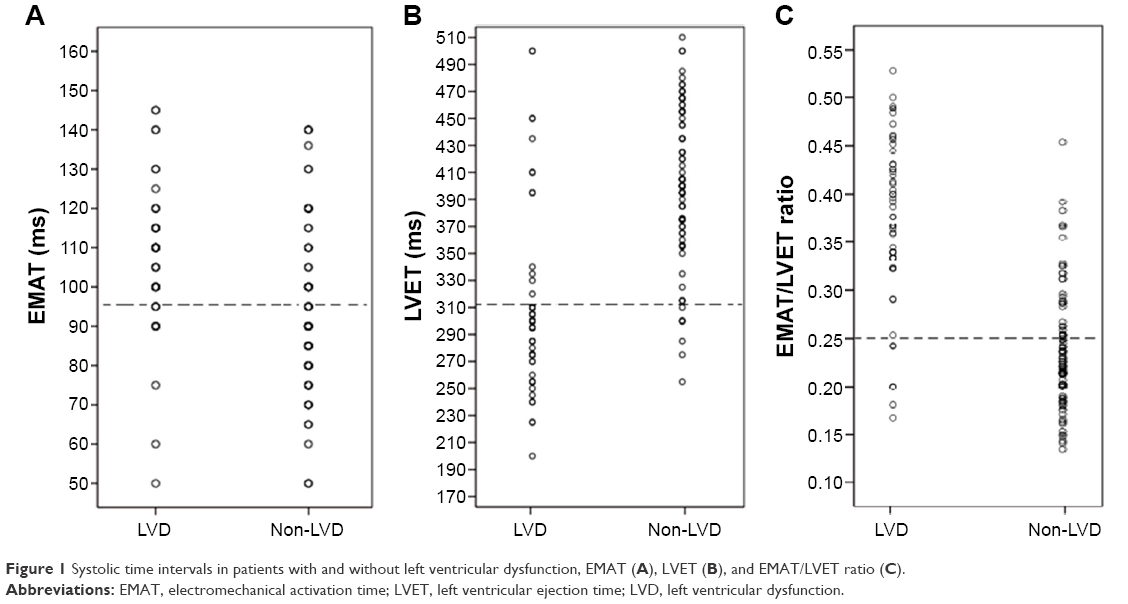 | Figure 1 Systolic time intervals in patients with and without left ventricular dysfunction, EMAT (A), LVET (B), and EMAT/LVET ratio (C). |
Effect of VM on systolic time intervals
All systolic time intervals significantly decreased during VM in patients without LVD; while in patients with LVD, systolic time intervals did not significantly change. Differences of systolic time intervals during VM between both groups remained statistically significant and similar to those observed at baseline (Table 2). The AUC of ROC curve increased to 0.88 and 0.92 for EMAT and EMAT/LVET ratio respectively, while it did not change for LVET compared to baseline finding; a better correlation was found between systolic time intervals measured during VM and BNP compared to baseline; the best correlation between systolic time intervals measured under VM and BNP was found with EMATvm/LVETvm (r2=0.52, P<0.001) (Table 3).
Discussion
In this study conducted on patients admitted to the ER for AECOPD, we sought to determine whether computerized noninvasive measurement of systolic time intervals using a phonoelectrocardiographic method could accurately diagnose LVD, and whether the results were improved with VM. We showed that LVD was associated with a prolonged EMAT and a shortened LVET. These two systolic time intervals had a good diagnostic performance and were well correlated to BNP values. We also showed that EMAT/LVET ratio had the highest AUC of ROC curve and the best correlation with BNP. Using VM, we found that the diagnostic performance of EMAT, LVET, and EMAT/LVET ratio was increased. Our data suggest that systolic time intervals measurement could be considered as a useful method to identify LVD in patients with AECOPD.
Accurate bedside diagnosis of LVD is still a challenge even with today’s technology.10 Although diagnostic tests such as BNP and echocardiography have increased the precision beyond that achieved with physical examination alone, neither test is optimal in all situations.11–13 This is particularly true for AECOPD patients who usually have an increased BNP release related to right ventricular dysfunction precluding an accurate interpretation. In addition, in these patients there are often difficulties to obtain transthoracic window during echocardiographic imaging.14,15 Thus, the development of novel diagnostic tests that facilitate the accurate and cost-effective detection of LVD in AECOPD patients is important. The current study is the first to assess the value of systolic time intervals as a diagnostic tool of LVD in AECOPD. Our results are in line with the findings of previous studies that investigated the value of systolic time intervals as markers of acute heart failure,16–19 even in patients with nondiagnostic BNP values.20,21 Yet, many clinicians have been reluctant to use systolic time intervals citing problems with poor accuracy and precision. This was true many decades ago because systolic time intervals were determined by traditional methods, which are less sensitive than those used in recent studies.22 Actually, systolic time intervals can be measured by commercially computerized acoustic cardiography where they have been shown to correlate with heart failure and LVEF measured by echocardiography.6,21,23–25 Several studies have been performed to investigate the physiologic underpinnings of the relationship between systolic time intervals and measures of left ventricular function. In heart failure, the decrease in the rate of left ventricular pressure development during the pre-ejection phase results in a prolonged isovolumic contraction time and lengthening of EMAT. Our results are in accordance with this explanation and support the concept that myocardial contractility is an important determinant of the isovolumetric period, which in turn is a major determinant of EMAT.18,26,27 In contrast to EMAT, the meaning of LVET is less clear in heart failure because it reflects both the velocity and extent of fiber shortening. As a consequence, either of the two mechanisms may dominate and produce a prolonged or shortened LVET in heart failure. In our patients, the shortened LVET may indicate that the diminished extent of fiber shortening predominates. Although systolic time intervals values are primarily related to contractility, these intervals may also be influenced by cardiac preload and afterload.22,28–30 Using this principle, we hypothesized that assessment of systolic time intervals under VM might improve the diagnosis of LVD because VM increases intrathoracic pressure and may therefore decrease systemic venous return. According to the Frank–Starling mechanism, VM would significantly change systolic time intervals in patients without LVD but not in patients with LVD. In our study, only patients without LVD demonstrated a significant change of their systolic time intervals under VM, which seems to improve their diagnostic accuracy as demonstrated by higher AUC of ROC curves compared to baseline.
Limitations
This study has several limitations. First, our cohort was selected from patients referred to the ER, and the data may not be representative of ambulatory managed patients in whom LVD is probably less overt and less detectable by changes in systolic time intervals. Second, because we did not perform a specific analysis in patients with conditions known to independently affect systolic time intervals, including left bundle branch block, aortic valve disease, and use of inotropic agents, it is unknown to what extent our data could be applied in these circumstances. Third, in contrast to our study, many investigators used R wave of the electrocardiogram instead of the Q wave to define the onset of EMAT, as the Q wave is often absent or not differentiated. However, many previous studies demonstrated that difference between both measurements did not seem to affect the observed changes in systolic time intervals. Fourth, no control group was used in this study. Thus, it cannot be concluded that the findings are specific for AECOPD. Finally, systolic time intervals as surrogate tests to detect LVD in AECOPD patients do not necessarily provide the answer of how to treat these patients. Many patients with AECOPD will have some degree of cardiac dysfunction, but the presence of LVD does not necessarily guide care, especially if LVD is present at baseline. This issue may warrant further investigation, perhaps by conducting randomized controlled trial using agents to treat specifically LVD.
Conclusion
This study showed that systolic time intervals were good indicators of the presence of LVD in AECOPD patients and that VM could improve diagnostic performance. Consequently, measurement of systolic time intervals using a noninvasive commercially available technique could be proposed in many ERs where echocardiography is not immediately available.
Acknowledgments
The authors wish to acknowledge Dr Mohamed Amine Msolli, the staff members of Emergency Department of Fattouma Bourguiba University Hospital, Monastir, Tunisia, and the staff members of Emergency Department of Sahloul University Hospital, Sousse, Tunisia, for their contribution to this study. This article was funded by the Ministry of Higher Education and Scientific Research, Tunisia.
Author contributions
SN conceived the study, and designed the trial. SN, SM, RB, MHG, WB, and HB supervised the conduct of the trial and data collection. KB, MHG, HB, ZD, and MFN undertook recruitment of patients and managed the data, including quality control. SN and SM performed statistical analysis and analyzed the data. SN drafted the manuscript, and all authors contributed substantially to its revision. SN takes responsibility for the paper as a whole. All authors contributed toward data analysis, drafting and revising the paper and agree to be accountable for all aspects of the work.
Disclosure
The authors report no conflicts of interest in this work.
References
The Global initiative for chronic obstructive lung disease (GOLD). Global strategy for diagnosis, management, and prevention of COPD. Updated November 2008. Available from: https://www.google.co.nz/webhp?sourceid=chrome-instant&ion=1&espv=2&ie=UTF-8#q=The+Global+initiative+for+chronic+obstructive+lung+disease+(GOLD).+Global+strategy+for+diagnosis%2C+management%2C+and+prevention+of+COPD. Accessed January 01, 2013. | ||
Yang S, Tan KL, Devanand A, Fook-Chong S, Eng P. Acute exacerbation of COPD requiring admission to the intensive care unit. Respirology. 2004;9(4):543–549. | ||
Curkendall SM, DeLuise C, Jones JK, et al. Cardiovascular disease in patients with chronic obstructive pulmonary disease, Saskatchewan Canada cardiovascular disease in COPD patients. Ann Epidemiol. 2006;16(1):63–70. | ||
Matamis D, Tsagourias M, Papathanasiou A, et al. Targeting occult heart failure in intensive care unit patients with acute chronic obstructive pulmonary disease exacerbation: Effect on outcome and quality of life. J Crit Care. 2014;29(2):315.e7–e14. | ||
Schwam E. B-type natriuretic peptide for diagnosis of heart failure in emergency department patients: a critical appraisal. Acad Emerg Med. 2004;11(6):686–691. | ||
Shapiro M, Moyers B, Marcus GM, et al. Diagnostic characteristics of combining phonocardiographic third heart sound and systolic time intervals for the prediction of left ventricular dysfunction. J Card Fail. 2007;13(1):18–24. | ||
Collins SP, Kontos MC, Michaels AD, et al. Utility of a bedside acoustic cardiographic model to predict elevated left ventricular filling pressure. Emerg Med J. 2010;27(9):677–682. | ||
Dillier R, Zuber M, Arand P, Erne S, Erne P. Assessment of systolic and diastolic function in heart failure using ambulatory monitoring with acoustic cardiography. Ann Med. 2011;43(5):403–411. | ||
Oh JK, Tajik J. The return of cardiac time intervals. The phoenix is rising. J Am Coll Cardiol. 2003;42(8):1471–1474. | ||
Wong GC, Ayas NT. Clinical approaches to the diagnosis of acute heart failure. Curr Opin Cardiol. 2007;22(3):207–213. | ||
Hunt SA, Abraham WT, Chin MH, et al. 2009 focused update incorporated into the ACC/AHA 2005 guidelines for the diagnosis and management of heart failure in adults: a report of the American College of Cardiology Foundation/American Heart Association Task Force on Practice Guidelines: developed in collaboration with the International Society for Heart and Lung Transplantation. Circulation. 2009;119(14):e391–e479. | ||
Felker GM, Petersen JW, Mark DB. Natriuretic peptides in the diagnosis and management of heart failure. CMAJ. 2006;175(6):611–617. | ||
Wang CS, FitzGerald JM, Schulzer M, Mak E, Ayas NT. Does this dyspneic patient in the emergency department have congestive heart failure? J Am Med Assoc. 2005;294(15):1944–1956. | ||
Nagaya N, Nishikimi T, Okano Y, et al. Plasma brain natriuretic peptide levels increase in proportion to the extent of right ventricular dysfunction in pulmonary hypertension. J Am Coll Cardiol. 1998;31(1):202–208. | ||
Bozkanat E, Tozkoparan E, Baysan O, Deniz O, Ciftci F, Yokusoglu M. The significance of elevated brain natriuretic peptide levels in chronic obstructive pulmonary disease. J Int Med Res. 2005;33(5):537–544. | ||
Roos M, Toggweiler S, Zuber M, Jamshidi P, Erne P. Acoustic cardiographic parameters and their relationship to invasive hemodynamic measurements in patients with left ventricular systolic dysfunction. Congest Heart Fail. 2006;12(Suppl 1):19–24. | ||
Cheng HM, Chuang SY, Hsu PF, Chou P, Chen CH. Systolic time intervals revisited: correlations with N-terminal pro-brain natriuretic peptide in a community population. Heart Vessels. 2005;20(6):256–263. | ||
Shapiro M, Moyers B, Marcus GM, et al. Diagnostic characteristics of combining phonocardiographic third heart sound and systolic time intervals for the prediction of left ventricular dysfunction. J Cardiac Fail. 2007;13(1):18–24. | ||
Ohte N, Hashimoto T, Narita H, et al. Noninvasive evaluation of left ventricular performance with a new systolic time interval, the Q-V peak, and comparison with established systolic time intervals. Am J Cardiol. 1990;66(12):1018–1020. | ||
Zuber M, Kipfer P. Attenhofer Jost CH. Usefulness of acoustic cardiology to resolve ambiguous values of B-type natriuretic peptide levels in patients with suspected heart failure. Am J Cardiol. 2007;100(5):866–869. | ||
Moyers B, Shapiro M, Marcus GM, et al. Performance of phonoelectrocardiographic left ventricular systolic time intervals and B-type natriuretic peptide levels in the diagnosis of left ventricular dysfunction. Ann Noninvasive Electrocardiol. 2007;12(2):89–97. | ||
Hassan S, Turner P. Systolic time intervals: a review of the method in the non-invasive investigation of cardiac function in health, disease and clinical pharmacology. Postgrad Med J. 1983;59(693):423–434. | ||
Máttar JA, Shoemaker WC, Diament D, et al. Systolic and diastolic time intervals in the critically ill patient. Crit Care Med. 1991;19(11):1382–1386. | ||
Hu K, Liu D, Niemann M, et al. Methods for assessment of left ventricular systolic function in technically difficult patients with poor imaging quality. J Am Soc Echocardiogr. 2013;26(2):105–113. | ||
Carvalho P, Paiva RP, Couceiro R, et al. Comparison of systolic time interval measurement modalities for portable devices. Conf Proc IEEE Eng Med Biol Soc. 2010;2010:606–609. | ||
Jamshidi P, Kobza R, Toggweiler S, Arand P, Zuber M, Erne P. Impact of preload changes on positive and negative left ventricular dP/dt and systolic time intervals: preload changes on left ventricular function. Indian Heart J. 2012;64(3):314–318. | ||
Zuber M, Attenhofer Jost CH, Kipfer P, Collins SP, Michota F, Peacock WF. Acoustic cardiography augments prolonged QRS duration for detecting left ventricular dysfunction. Ann Noninvasive Electrocardiol. 2007;12(4):316–328. | ||
Buch J, Egeblad H, Hansen PB, Kjaergård H, Waldorff S, Steiness E. Correlation between changes in systolic time intervals and left ventricular end-diastolic diameter after preload reduction. Non-invasive monitoring of pharmacological intervention. Br Heart J. 1980;44(6):668–671. | ||
Rmö P, Karhunen M, Rämö OJ. Systolic time intervals in canine experimental acute hemorrhagic pancreatitis. J Surg Res. 1989;46(3):212–215. | ||
Chan GS, Middleton PM, Celler BG, Wang L, Lovell NH. Change in pulse transit time and pre-ejection period during head-up tilt-induced progressive central hypovolaemia. J Clin Monit Comput. 2007;21(5):283–293. |
 © 2016 The Author(s). This work is published and licensed by Dove Medical Press Limited. The full terms of this license are available at https://www.dovepress.com/terms.php and incorporate the Creative Commons Attribution - Non Commercial (unported, v3.0) License.
By accessing the work you hereby accept the Terms. Non-commercial uses of the work are permitted without any further permission from Dove Medical Press Limited, provided the work is properly attributed. For permission for commercial use of this work, please see paragraphs 4.2 and 5 of our Terms.
© 2016 The Author(s). This work is published and licensed by Dove Medical Press Limited. The full terms of this license are available at https://www.dovepress.com/terms.php and incorporate the Creative Commons Attribution - Non Commercial (unported, v3.0) License.
By accessing the work you hereby accept the Terms. Non-commercial uses of the work are permitted without any further permission from Dove Medical Press Limited, provided the work is properly attributed. For permission for commercial use of this work, please see paragraphs 4.2 and 5 of our Terms.