")
Back to Journals » Diabetes, Metabolic Syndrome and Obesity » Volume 13
Systolic Blood Pressure, Cardiovascular Mortality, and All-Cause Mortality in Normoglycemia, Prediabetes, and Diabetes
Authors Chen CL , Liu L, Huang JY, Yu YL , Lo K , Huang YQ, Feng YQ
Received 2 May 2020
Accepted for publication 9 June 2020
Published 6 July 2020 Volume 2020:13 Pages 2375—2388
DOI https://doi.org/10.2147/DMSO.S260990
Checked for plagiarism Yes
Review by Single anonymous peer review
Peer reviewer comments 2
Editor who approved publication: Professor Ming-Hui Zou
Chao-Lei Chen,1,* Lin Liu,1,* Jia-Yi Huang,1 Yu-Ling Yu,1 Kenneth Lo,1,2 Yu-Qing Huang,1 Ying-Qing Feng1
1Department of Cardiology, Guangdong Cardiovascular Institute, Guangdong Provincial Key Laboratory of Coronary Heart Disease Prevention, Guangdong Provincial People’s Hospital, Guangdong Academy of Medical Sciences, School of Medicine, South China University of Technology, Guangzhou 510080, People’s Republic of China; 2Centre for Global Cardiometabolic Health, Department of Epidemiology, School of Public Health, Brown University, Providence, RI, USA
*These authors contributed equally to this work
Correspondence: Yu-Qing Huang; Ying-Qing Feng
Department of Cardiology,Guangdong Cardiovascular Institute, Guangdong Provincial People’s Hospital, Guangdong Provincial Key Laboratory of Coronary Heart Disease Prevention, Guangdong Academy of Medical Sciences, School of Medicine, South China University of Technology, Guangzhou 510080, People’s Republic of China
Tel/ Fax +86-20-83827812
Email [email protected]; [email protected]
Background: The optimal blood pressure (BP) level for diabetic patients remains controversial, while studies provided limited evidence on BP management for individuals with normoglycemia or prediabetes. We aimed to investigate the associations between systolic blood pressure (SBP) and all-cause and cardiovascular (CVD) mortality among US adults with different glycemic profiles.
Methods: We used data from the 1999– 2014 National Health and Nutrition Examination Survey (NHANES, n=40,046) with comprehensive baseline examination and follow-up assessment. Restricted cubic spline analysis was performed to examine dose–response relationship between SBP and mortality risk. Cox regression models were used to estimate hazard ratios of all-cause mortality and CVD mortality for SBP categories.
Results: U-shaped associations between SBP and all-cause mortality were observed regardless of glucose status. The relationship between SBP and CVD mortality was found to be U-shaped only in normoglycemic participants. The lowest mortality risk of optimal SBP (mmHg) by group was 115– 120 (normoglycemia), 120– 130 (prediabetes), and 125– 135 (diabetes). When compared with the reference group, SBP < 100 mmHg was significantly associated with 49% (HR=1.49, 95% CI: 1.13– 1.96), 57% (1.57, 1.07– 2.3), and 59% (1.59, 1.12– 2.25) higher all-cause mortality risk in people with normoglycemia, prediabetes, and diabetes, respectively. The multivariable-adjusted HRs of all-cause mortality for SBP ≥ 150 mmHg were 1.51 (1.25– 1.82), 1.56 (1.27– 1.93), and 1.33 (1.08– 1.64), respectively. As for CVD mortality, the multivariable-adjusted HRs were 2.85 (1.29– 6.33) for SBP < 100 mmHg and 2.71 (1.56– 4.69) for SBP ≥ 150 mmHg in normoglycemia; HR was 1.66 (1.05– 2.63) for SBP ≥ 150 mmHg in diabetic patients.
Conclusion: U-shaped relationships between SBP and all-cause mortality were observed regardless of diabetes status. The optimal SBP range was gradually higher with worsening glucose status.
Keywords: systolic blood pressure, mortality, normoglycemia, prediabetes, diabetes mellitus
Introduction
Hypertension often co-exists with abnormal glucose metabolism. Patients with established hypertension and diabetes mellitus (DM) have a 4-fold increased risk for the development of cardiovascular diseases (CVD) and substantially higher risk of CVD death and all-cause mortality.1,2 Whether prediabetes (Pre-DM) alone is associated with adverse cardiovascular outcomes remains uncertain,3,4 but findings from several longitudinal studies and meta-analyses have suggested that patients with Pre-DM have 3–12 times higher risk of incident DM than in the general population.5–8 Besides, with the combination of hypertension, Pre-DM could accelerate the development of DM and further significantly increase CVD risk.3,9,10 Considering the high prevalence of DM and Pre-DM and subsequent huge disease burden globally,1,11,12 blood pressure (BP) management in these large populations becomes particularly urgent.
However, studies focused on reducing CVD risk of diabetic patients have shown mixed results.13,14 The discordant results of the recent Action to Control Cardiovascular Risk in Diabetes Blood Pressure (ACCORD BP) trial and the Systolic Blood Pressure Intervention Trial (SPRINT) add to this uncertainty. ACCORD demonstrated a nonsignificant reduction in CVD events (except for stroke) with intensive systolic blood pressure (SBP) treatment (below 120 mmHg) compared with SBP below 140 mmHg over 5 years of follow-up among US adults with type 2 DM at high cardiovascular risk.15 However, in SPRINT,16 CVD risk and all-cause mortality were substantially reduced with similar SBP treatment targets in high-risk patients. Of note, SPRINT excluded people with DM. Controversies become more intense when SBP below 120 mmHg was found to be associated with increased risk for cardiovascular death and total mortality in patients at high cardiovascular risk,17 and some suggest J-shaped relationship between SBP and cardiovascular outcomes in patients with or without DM.18,19 Very few published data focused on the benefit of optimal SBP levels in patients with normoglycemia and Pre-DM, in reducing the risk of mortality.20,21 The current study, using data from the National Health and Nutrition Examination Surveys (NHANES), has allowed us to address the research gap.
Methods
Study Population
We analyzed data from NHANES over 15 years (1999–2014) to examine the relationship between SBP and mortality by glycemic status (ie, normoglycemia, Pre-DM, and DM). NHANES was a nationally representative study of the US civilians recruited using a complex multistage sampling method. The US National Center for Health Statistics (NCHS) Research Ethics Review Board approved NHANES and all participants provided written informed consent before participation. Depending on previous publications, the response rates from 1999 to 2014 ranged from 75% to 80%.22 More detailed descriptions of the survey design were released elsewhere.23–25 Our analyses included all participants aged 18 and older with no self-reported diabetes whose blood samples were obtained after fasting for a minimum of 8 h for assessment and all participants with self-reported DM irrespective of fasting status. We excluded participants who had missing data in diabetic history, BP measurement, hemoglobin A1c (HbA1c) or fasting blood glucose (FBG), and mortality data. After applying the exclusion criteria, 40,046 participants remained for analysis (Figure 1).
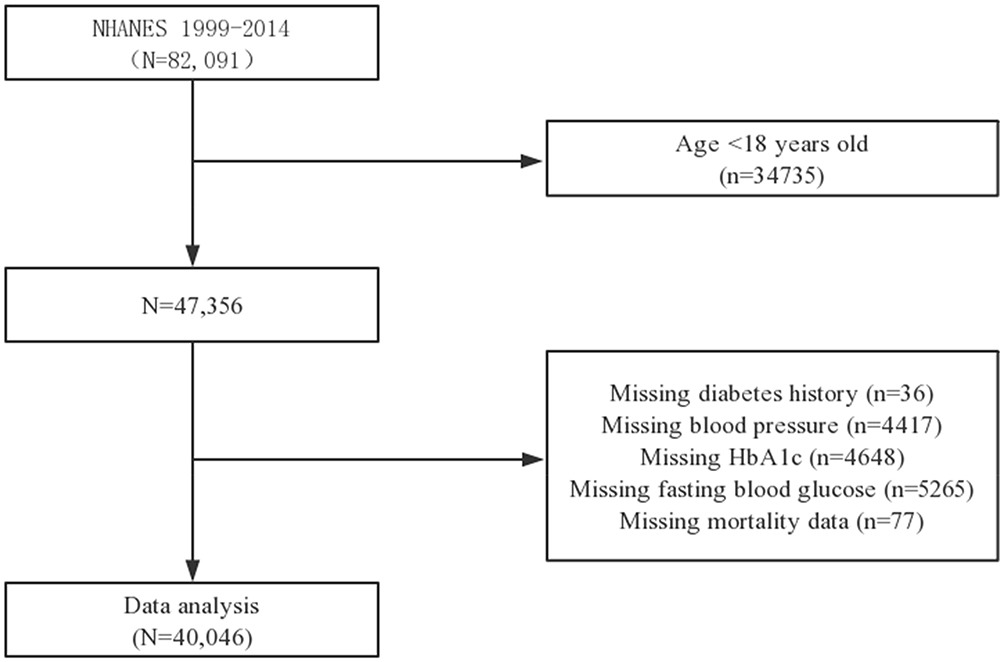 |
Figure 1 Flow chart of study participants. Abbreviations: NHANES, National Health and Nutrition Examination Survey; HbA1c, hemoglobin A1c. |
BP and Blood Glucose Measurement
Two certified physicians and two health technologists were trained to collect NHANES BP data using protocols approved by the American Heart Association. Briefly, participants rested upon arrival and BP was then measured in the seated position using a mercury sphygmomanometer and an appropriately sized cuff. The average of three consecutive BPs measured during that visit was recorded as the baseline BP of that participant. Hypertension in our analysis was defined as the use of antihypertensive medications or a mean resting SBP at least 130 mmHg or diastolic blood pressure (DBP) at least 80 mmHg.26
FBG (mg/dL) and HbA1c (%) were estimated using standardized laboratory techniques. Diagnosed diabetes was defined as taking antihyperglycemic medications or having a positive response to the question: “Other than during pregnancy, have you ever been told by a doctor or health professional that you have diabetes or sugar diabetes?” Undiagnosed diabetes was defined as FPG ≥126 mg/dL (7.0 mmol/L) or HbA1c ≥ 6.5% (48 mmol/mol). Diabetic participants in our analysis were the combination of having diagnosed and undiagnosed diabetes. We classified people with Pre-DM when their FPG was between 100 and 125 mg/dL or their level of HbA1c was between 5.7% and 6.4%, and normoglycemia was defined as FPG less than 100 mg/dL and HbA1c less than 5.7%.27
Study End Points
Our outcome was all-cause mortality and CVD mortality, which were obtained in the National Death Index (NDI), a centralized database of US death records collected from the National Center for Health Statistics (NCHS). Mortality status was ascertained through probabilistic record matching with the NDI.28 Participants were followed up until the intended outcome or the end of the study (December 2015), whichever came first. The International Classification of Diseases (ICD), 10th Revision was used for the identification of death causes. CVD mortality was defined as death caused by heart disease (ICD −10 codes I00 to I09, I11, I13, I20 to I51) or cerebrovascular disease (I60 to I69).
Other Variables of Interest
At baseline interview, age, sex, ethnicity, smoking status, educational level, history of hypertension, CVD (any prior diagnosed congestive heart failure, coronary heart disease, angina/angina pectoris, heart attack, or stroke), and cancer were self-reported by questionnaire. Smoking status, history of hypertension, CVD, and cancer were categorized into yes or no. Education level was categorized into less than or more than high school. Medication usage including antihypertensive drugs, antihyperglycemic drugs, antiplatelet drugs, and insulin were obtained from questions on prescription medications. Anthropometric indicators including height, weight, DBP, and body mass index (BMI, calculated by weight divided by height squared [kg/m2]) and laboratory examination including total cholesterol (TC), triglyceride (TG), high-density lipoprotein cholesterol (HDL-C), low-density lipoprotein cholesterol (LDL-C), and estimated glomerular filtration rate (eGFR, calculated using Modification of Diet in Renal Disease formula29) were conducted at NHANES mobile examination centers. Dietary energy was assessed using dietary recall. Detailed examination methods and questionnaire information can be referred to https://wwwn.cdc.gov/nchs/nhanes/Default.aspx.
Statistical Analysis
For participants with different glycemic status (normoglycemia, Pre-DM, and DM), we compared the demographic differences between groups using the One-Way ANOVA, Kruskal–Wallis H-test, and chi-square tests. Data were presented as mean standard deviation (SD) for continuous variables and percentage for categorical variables, as appropriate. We used Kaplan–Meier curves Log-rank test to analyze and compare the associations between SBP and all-cause mortality and CVD mortality by glycemic status. To test for dose–response relationship, we utilized restricted cubic splines to estimate associations between SBP and mortality risk. We selected three knots at quartiles 25th, 50th, and 75th for restricted cubic spline. SBP was treated as continuous variable (per SD change) or as categories (<100, 100–109, 110–119 (reference), 120–129, 130–139, 140–149, and ≥150 mmHg). Adjusted models incorporated covariates including DBP, age, gender, race, education, smoking status, BMI, baseline CVD, baseline cancer, baseline hypertension, dietary intake, TC, HDL-C, eGFR, statin, antiplatelet drugs, antidiabetic drugs, and antihypertensive medications. Antihyperglycemic drugs were additionally adjusted among diabetic patients. The Cox proportional hazard analysis was stratified by glycemic status. All statistical tests were two-sided, with P < 0.05 considered significant. All statistical analyses were performed using R version 3.3.2 (R Foundation for Statistical Computing, Vienna, Austria).
Results
Baseline Characteristics of Study Participants
Out of 40,046 participants, 57.9% (n=23,176) had normal glycemic profile, 26.7% (n=10,685) had pre-DM and 15.4% (n=6185) had DM. Demographic, clinical, and laboratory data at baseline of study participants according to glucose status are provided in Table 1. Significant differences between groups were found in all covariates at baseline.
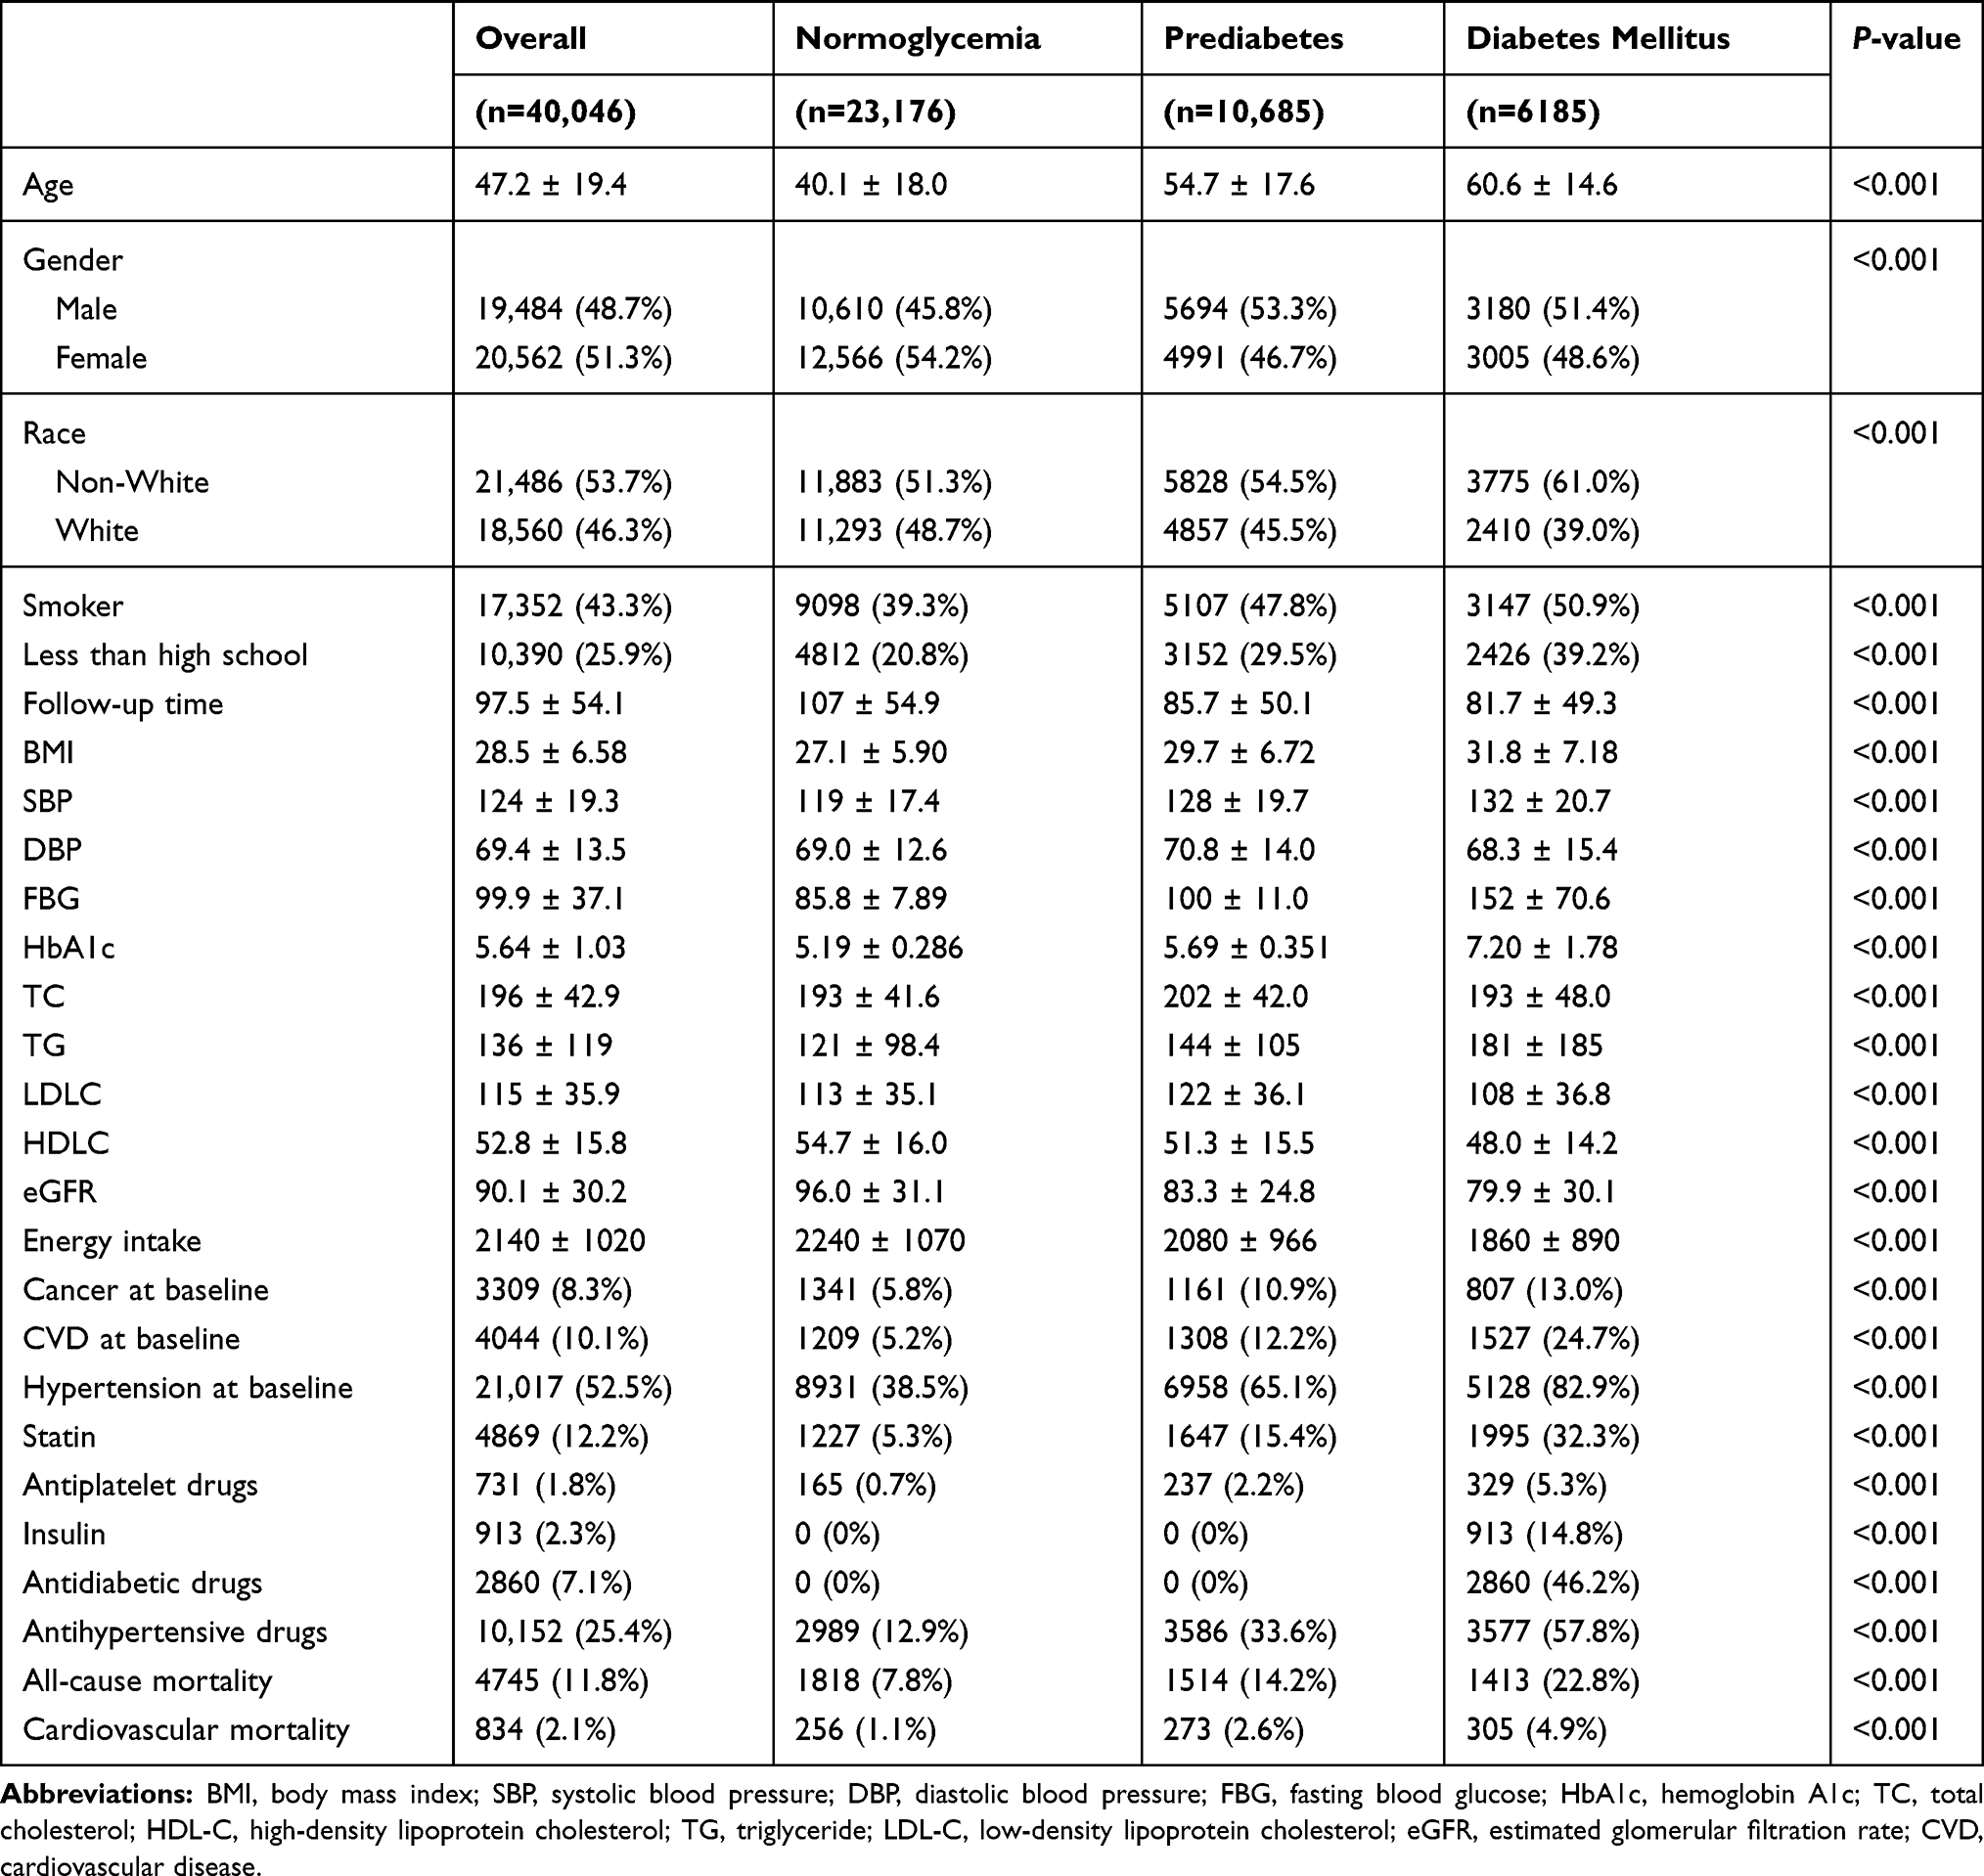 |
Table 1 Baseline Characteristics of Study Participants According to Glucose Status |
Figure 2 shows the all-cause and CVD event-free survival stratified by hypertension status in three glycemic groups. People with DM had lower all-cause event-free survival compared with Pre-DM and normoglycemia. Hypertension was associated with a reduced mortality event-free survival regardless of diabetes status (Log-rank P <0.0001). In addition, significant differences in the rate of all-cause mortality and CVD mortality were observed among the SBP groups in all three glycemic groups (Figures 3 and 4).
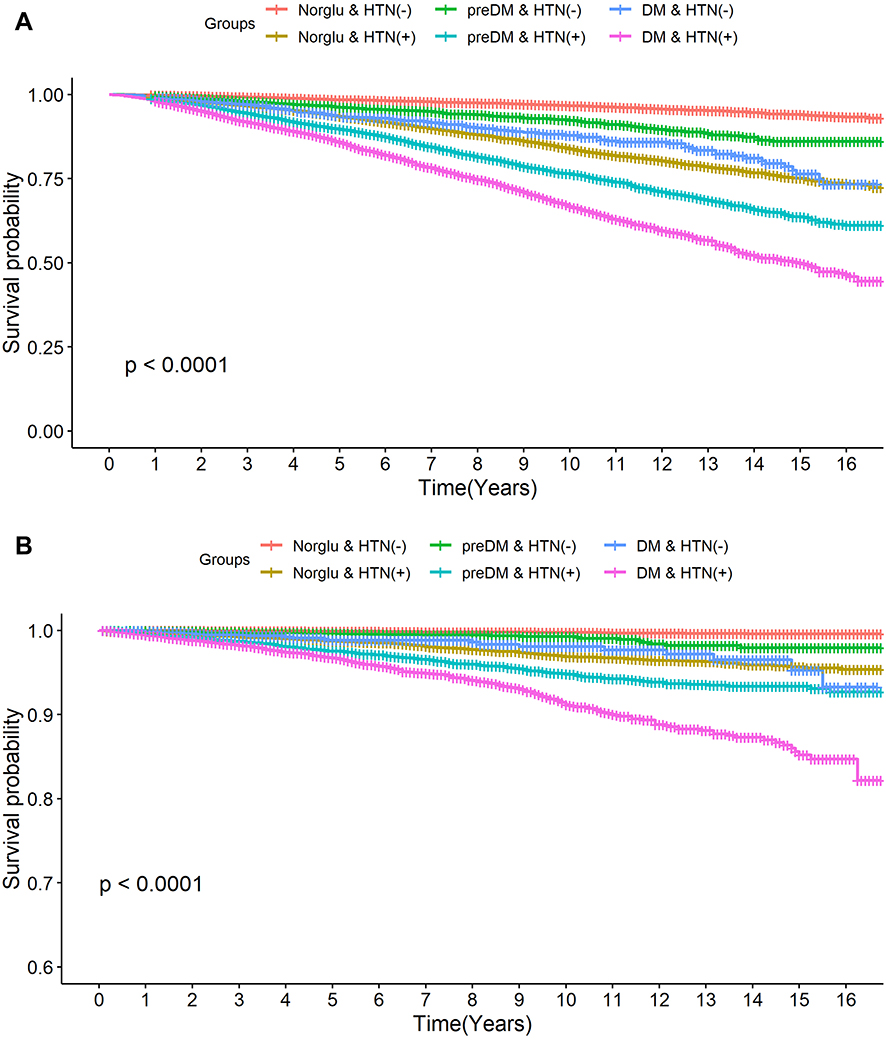 |
Figure 2 Kaplan–Meier curves of the event-free survival for all-cause (A) and cardiovascular mortality (B) in persons with normoglycemia, prediabetes, and diabetes stratified by hypertension status. |
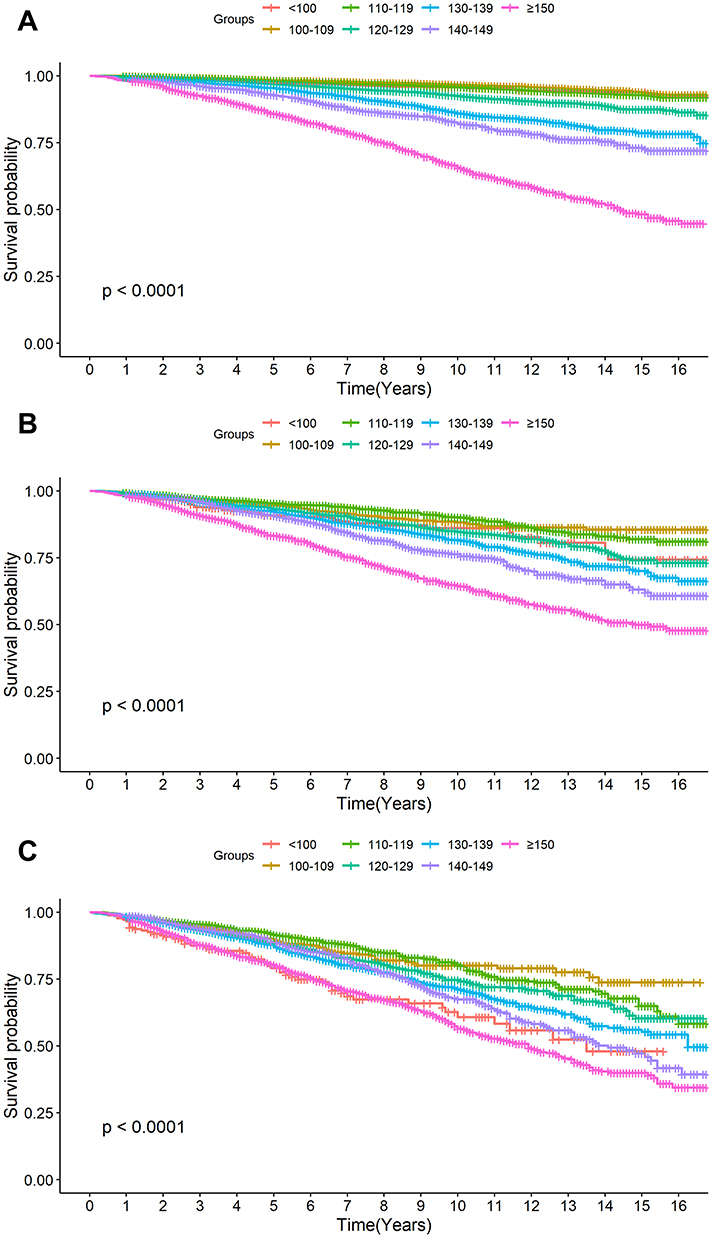 |
Figure 3 Kaplan–Meier curves of the event-free survival for all-cause mortality according to SBP categories in (A) normoglycemia, (B) prediabetes, and (C) diabetes. |
 |
Figure 4 Kaplan–Meier curves of the event-free survival for cardiovascular mortality according to SBP categories in (A) normoglycemia, (B) prediabetes, and (C) diabetes. |
Natures of Associations of Systolic Blood Pressure Levels with Mortality Risk
In the full multivariable models when treating SBP as a continuous variable, the relations of SBP and all-cause mortality risk were both U-shaped in participants with normoglycemia, Pre-DM and DM (Figure 5). Besides, the relationship between SBP and CVD mortality in normoglycemic participants was also U-shaped (Figure 6). The lowest risk was observed at SBP between 115 and 120 mmHg in normoglycemia, 120 and 130 mmHg in Pre-DM, and 125 and 135 mmHg in DM (Figures 5 and 6).
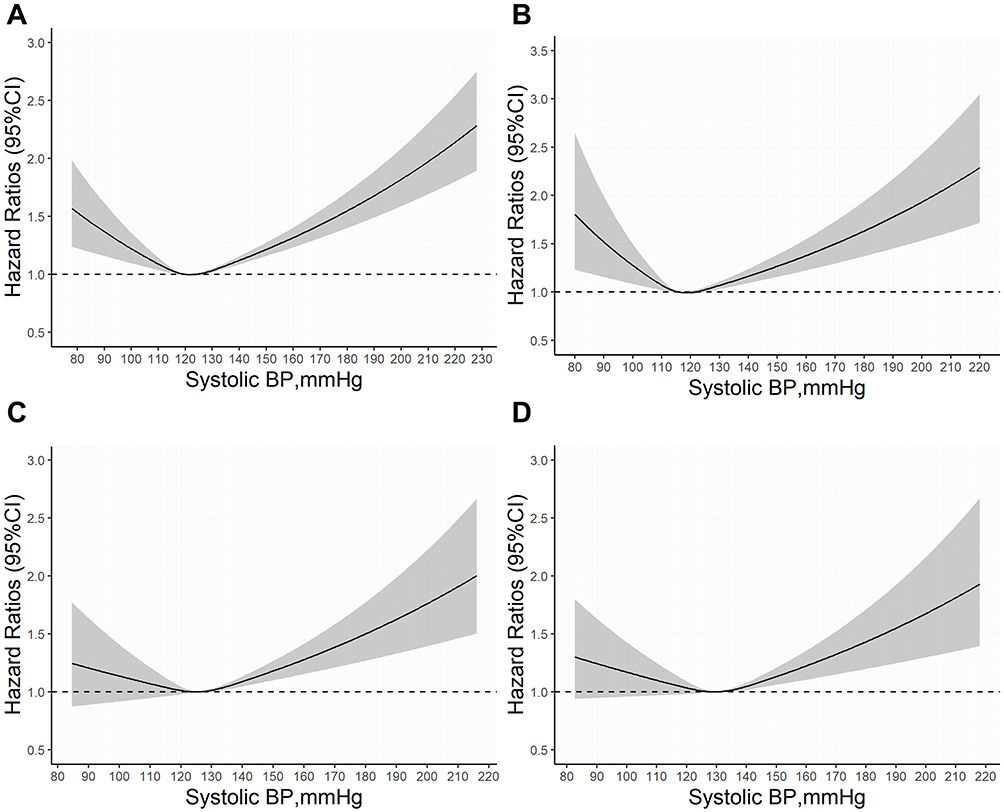 |
Figure 5 Adjusted cubic spline model of the association between hazard ratio of all-cause mortality and SBP of participants overall (A) and in normoglycemia (B), prediabetes (C) and diabetes (D). Models were adjusted for age, sex, race, education, smoke, body mass index, diastolic blood pressure, baseline cardiovascular disease, baseline cancer, baseline hypertension, dietary intake, total cholesterol, high-density lipoprotein cholesterol, estimated glomerular filtration rate, statin and antiplatelet drugs in normoglycemia and prediabetes, and additionally adjusted for antihypertensive drugs in diabetes. |
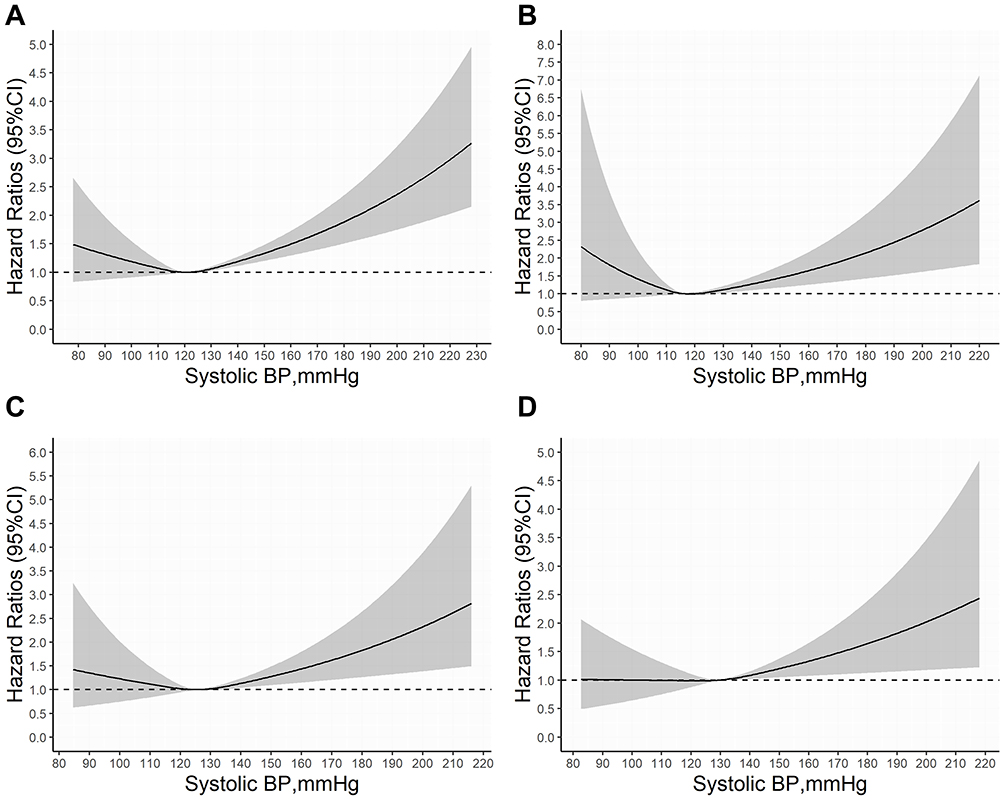 |
Figure 6 Adjusted cubic spline model of the association between hazard ratio of cardiovascular mortality and SBP of participants overall (A) and in normoglycemia (B), prediabetes (C) and diabetes (D). Models were adjusted for age, sex, race, education, smoke, body mass index, diastolic blood pressure, baseline cardiovascular disease, baseline cancer, baseline hypertension, dietary intake, total cholesterol, high-density lipoprotein cholesterol, estimated glomerular filtration rate, statin and antiplatelet drugs in normoglycemia and prediabetes, and additionally adjusted for antihypertensive drugs in diabetes. |
Hazard Ratios for All-Cause Mortality in Different Groups
Over 32,5450 person-years of follow-up (median 8.1 years), 4745 cases of all-cause death (11.8%), and 834 (2.1%) cases of CVD death were recorded, corresponding to an event rate of 14.58 and 2.56 per 1000 patient years in the study population, respectively. Higher SBP levels were significantly associated with increased risk of all-cause mortality. Per SD increase in SBP associated with a 12%, 11%, and 8% higher mortality in the group normoglycemia, Pre-DM, and DM, respectively (Table 2). Besides, per SD increase in SBP also associated with a 21%, 17%, and 15% higher CVD mortality, respectively (Table 3).
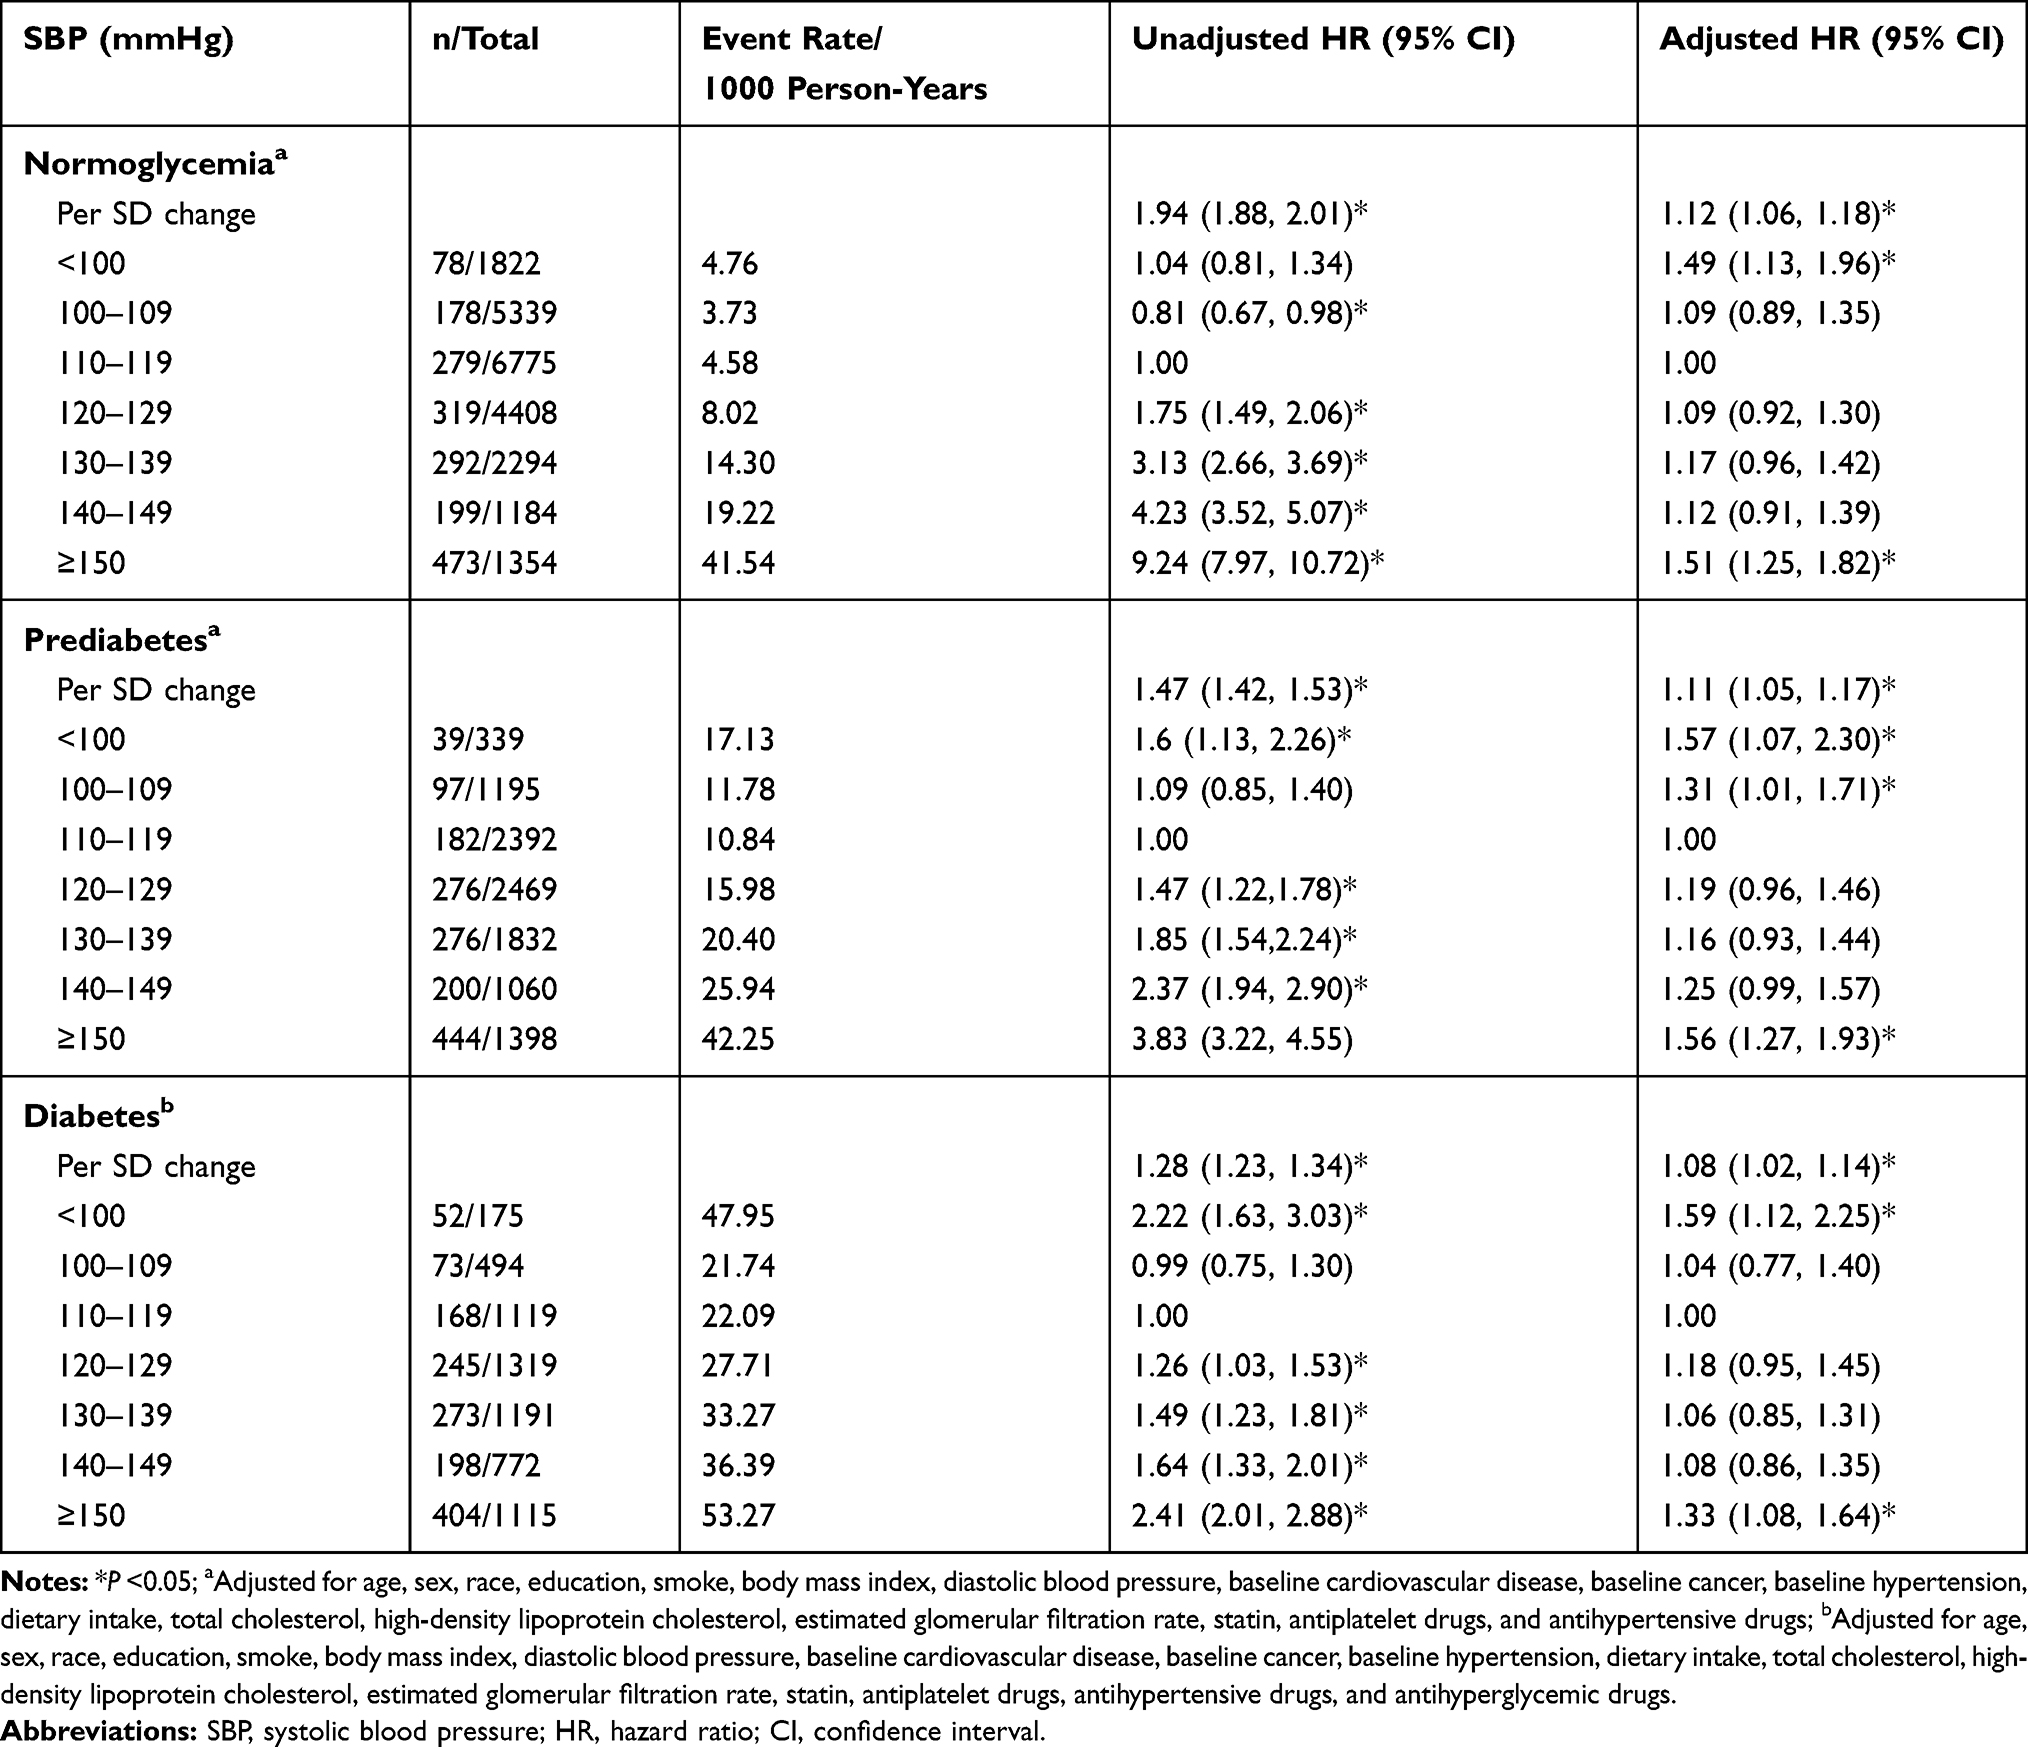 |
Table 2 Hazard Ratios for All-Cause Mortality According to Systolic Blood Pressure Categories Among Participants with Different Glycemic Status |
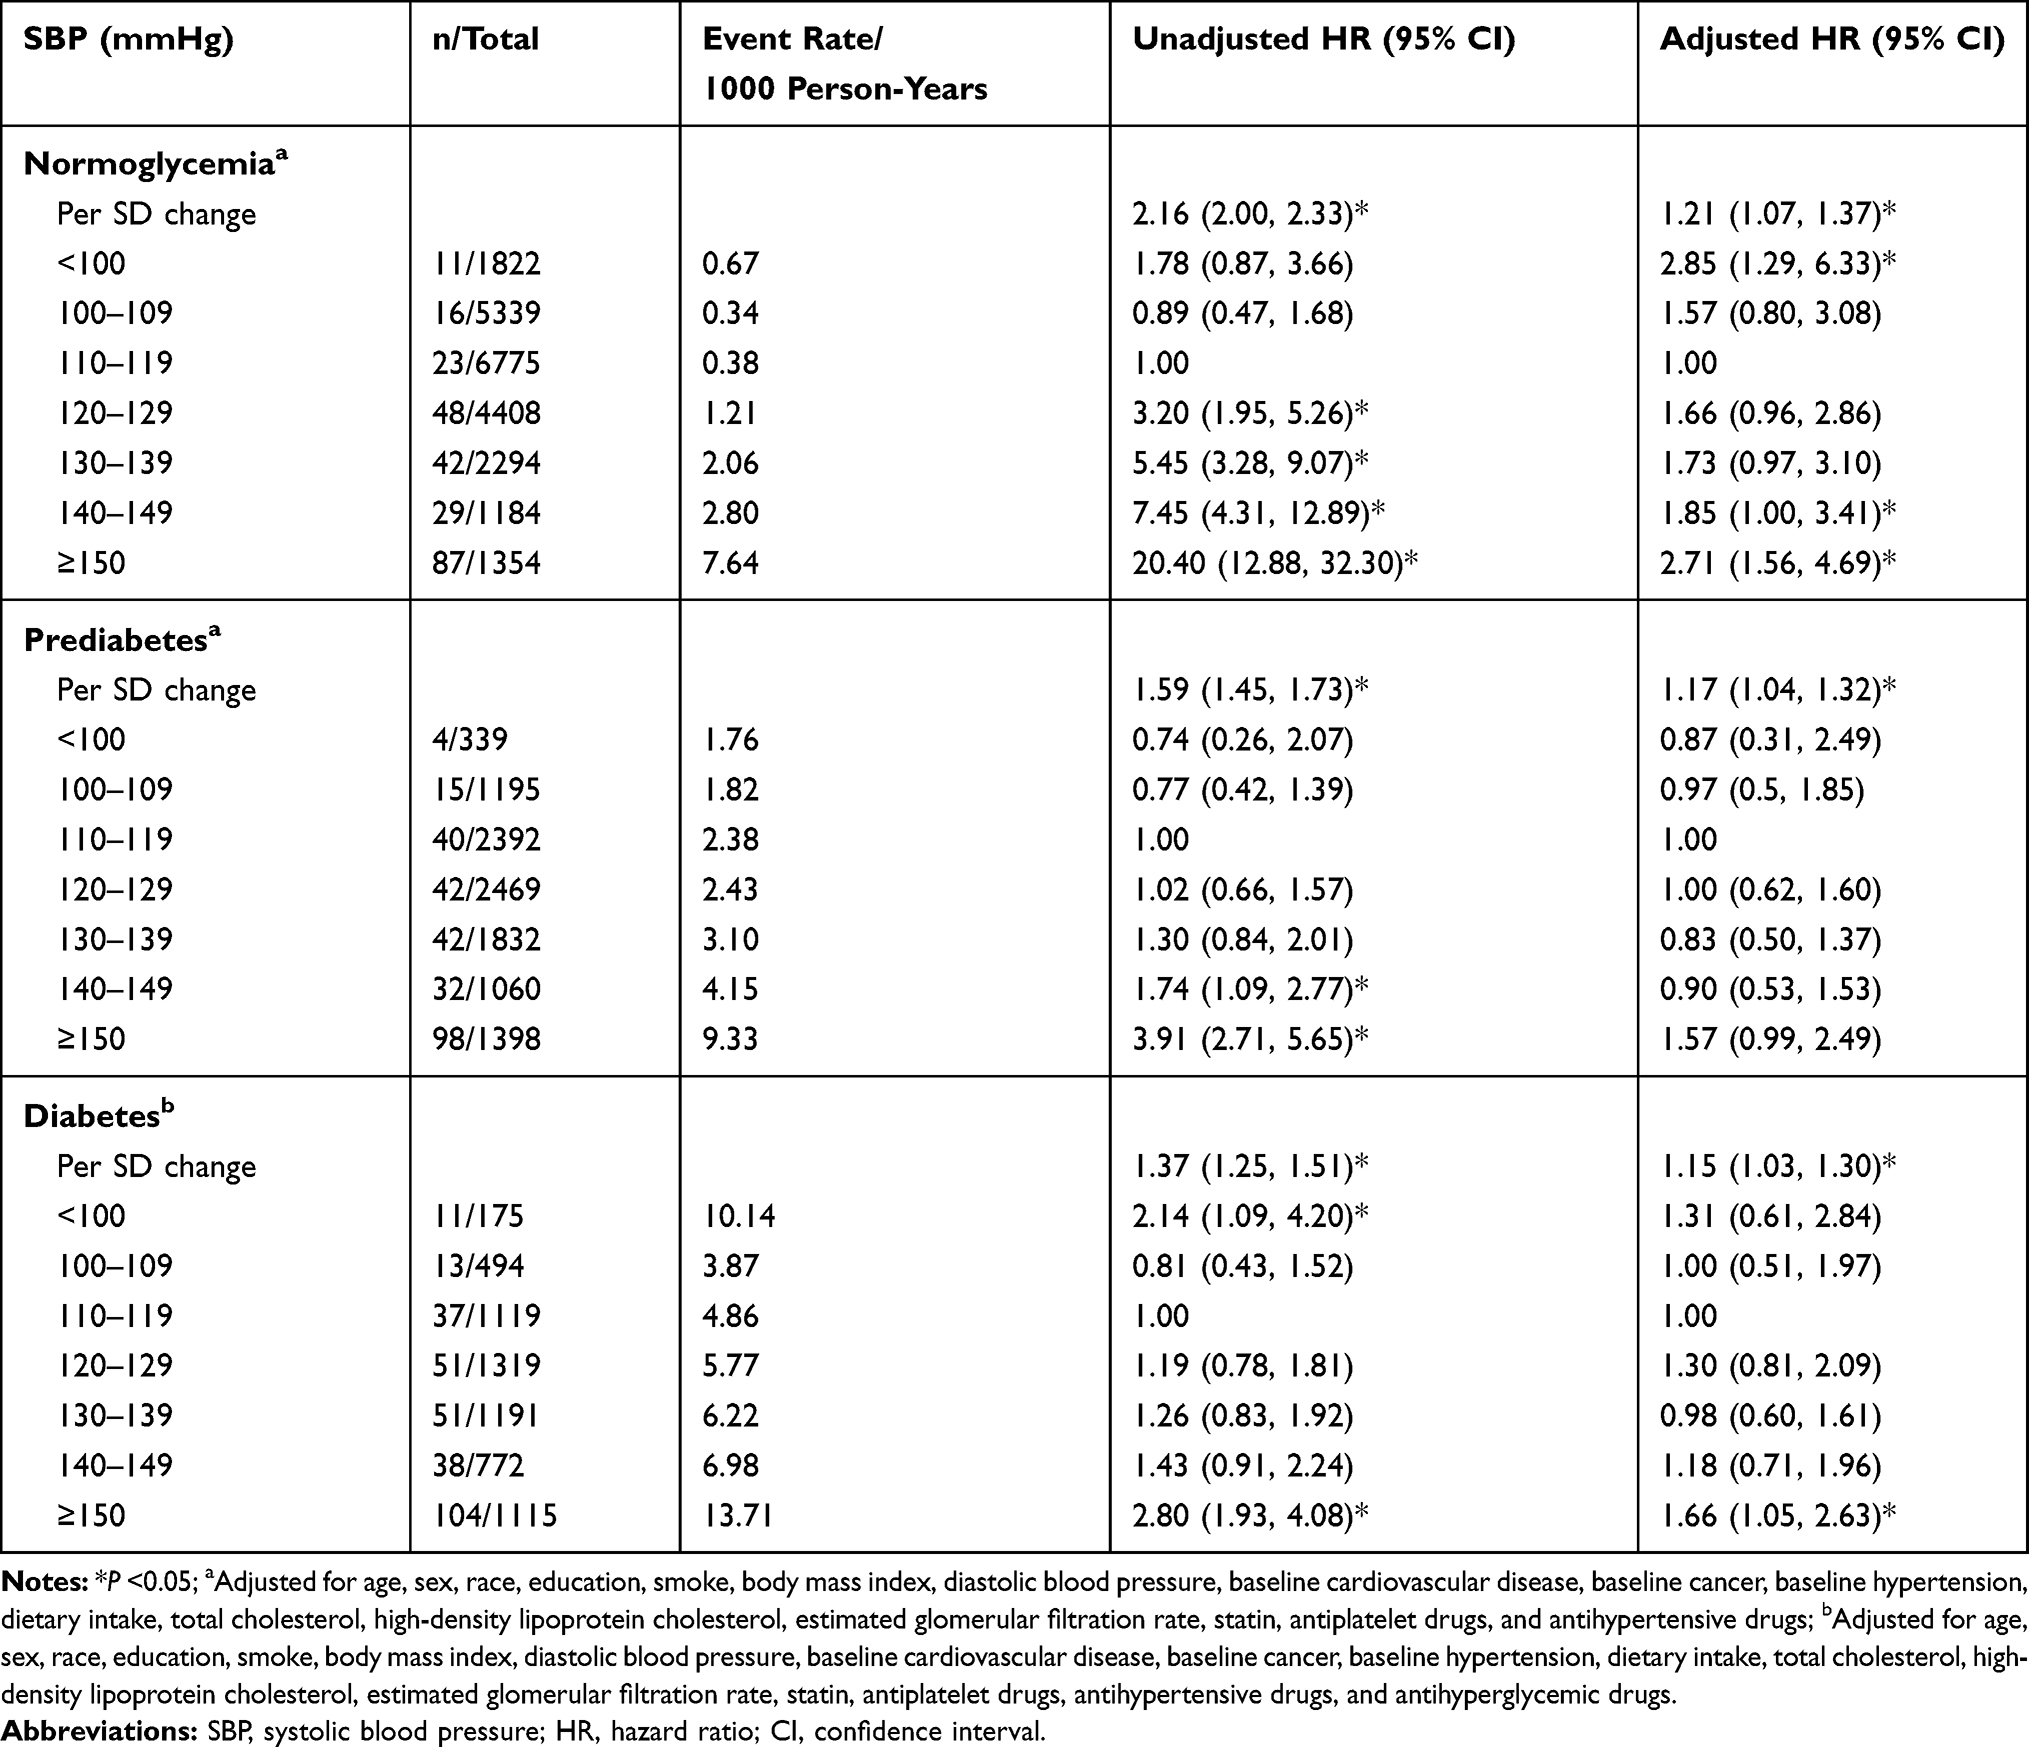 |
Table 3 Hazard Ratios for Cardiovascular Mortality According to Systolic Blood Pressure Categories Among Participants with Different Glycemic Status |
In normoglycemic participants, the multivariable-adjusted HRs of all-cause mortality for SBP group of <100, 100–109, 110–119 (reference), 120–129, 130–139, 140–149, and ≥150 mmHg were 1.49 (95% CI: 1.13–1.96), 1.09 (0.89–1.35), 1.00, 1.09 (0.92–1.30), 1.17 (0.96–1.42), 1.12 (0.91–1.39), and 1.51 (1.25–1.82), respectively (Table 2). Besides, both lower and higher SBP were significantly associated with higher CVD mortality; multivariable-adjusted HRs were 2.85 (1.29–6.33) for SBP <100, 1.85 (1.00–3.41) for SBP of 140–149, and 2.71 (1.56–4.69) for SBP ≥150 mmHg (Table 3). In prediabetic participants, the HRs of all-cause mortality for SBP groups were 1.57 (95% CI: 1.07–2.3), 1.31 (1.01–1.71), 1.00, 1.19 (0.96,1.46), 1.16 (0.93–1.44), 1.25 (0.99–1.57), and 1.56 (1.27–1.93), respectively (Table 2). No significant association was detected among SBP groups and CVD mortality after adjusting for potential confounders (Table 3). Among patients with DM, the HRs of all-cause mortality were 1.59 (1.12,2.25), 1.04 (0.77,1.4), 1.00, 1.18 (0.95,1.45), 1.06 (0.85,1.31), 1.08 (0.86,1.35), and 1.33 (1.08, 1.64), respectively (Table 2). Besides, SBP ≥150 mmHg was significantly associated with CVD mortality (HR= 1.66, 95% CI, 1.05–2.63) (Table 3). Both higher (≥150 mmHg) and lower (<100 mmHg) were significantly associated with greater risk of all-cause mortality in all subpopulations and were associated with greater risk of CVD mortality in normoglycemia.
Discussion
In this cohort study among US adults with different conditions of glucose metabolism, we assessed the associations of SBP levels and risk of all-cause mortality and CVD mortality in individuals with normoglycemia, Pre-DM, and DM. A U-shaped relationship between SBP and all-cause mortality was observed regardless of glycemic status. Although the relationship between SBP and CVD mortality was also U-shaped in people with normoglycemia, no significant association was found in people with Pre-DM and DM (except for SBP ≥150 mmHg in DM). The lowest mortality risk was observed at SBP between 115 and 120 mmHg in the group of normoglycemia, 120 and 130 mmHg in Pre-DM and 125 and 135 mmHg in DM, while both lower (<100 mmHg) or higher SBP (≥150 mmHg) were significantly associated with increased mortality risk. Of note, the optimal SBP range for the lowest mortality was gradually higher with worsening glucose status.
The optimal BP target for diabetic patients remains controversial for the past few decades. Findings from several meta-analyses of BP lowering trials found that intensive treatment in diabetic patients can effectively reduce the risk of CVD and all-cause mortality.13,30 Benefits of reduced CVD and all-cause mortality in diabetic patients persisted to SBP <120 mmHg, although the benefit was attenuated when SBP was 130 mmHg or lower.31 Our study also demonstrated that higher SBP levels were associated with increased risk of CVD and all-cause mortality and the benefits were attenuated when SBP was lower than 125 mmHg in patients with DM. Moreover, we found a U-shaped association between SBP and mortality risk in diabetic patients. Data from the LSU Health Care Services Division (LSUHCSD) study of 35,261 patients with type 2 diabetes also showed a U-shaped relationship between SBP and all-cause mortality, which was consistent with our findings.32 However, the LSUHCSD study suggested maintaining SBP at 130–150 mmHg, with SBP <120 mmHg and ≥160 mmHg both associated with increased risk of all-cause death. When compared to LSUHCSD study, our study suggested a narrower and lower SBP range. Similar associations between SBP and all-cause mortality (U-shaped) in diabetic patients were also observed in the Swedish National Diabetes Register studies,33,34 which were different from previous widely published J-shaped association between BP and CVD outcomes among patients with diabetes.35
The recently published SPRINT analysis showed that in high-risk populations without DM, intensive BP reduction below 120 mmHg can significantly improve cardiovascular prognosis.16 However, the results of ACCORD failed to achieve the beneficial effect of strengthening BP in the diabetic population at high cardiovascular risk.15 Considering the identical SBP targets (<120 mmHg in the intensive arm and <140 mmHg in the standard arm) in those trials, the inconsistent results further increased the controversy regarding the optimal BP target in people with DM or without DM.36 In addition, it is worth considering that in non-diabetic patients, considering the harm of microvascular or macrovascular damages that have been proven to have higher blood glucose levels such as pre-DM,37 especially combined with hypertension, the appropriate BP target among these people still needs to be further discussed.
To the best of our knowledge, the current study for the first time found a U-shaped association between SBP and all-cause mortality among people with normoglycemic and prediabetic profile and a U-shaped association between SBP and CVD mortality among normoglycemic population. It was estimated that by 2011–2014, 78.5 million adults in US had Pre-DM and more than a third of those had hypertension.22 Identifying people with Pre-DM and addressing related cardiovascular risk factors such as hypertension is important and recommended by recent modifications to the US Preventive Services Task Force diabetes screening guideline.38 However, few studies focused on the BP management in people with normoglycemia and Pre-DM.20,21 A post hoc analysis of SPRINT demonstrated that the beneficial effects of intensive treatment extend to those with Pre-DM and normoglycemia.21 Importantly, there was no attenuation of benefits between participants with Pre-DM and those with normoglycemia. Moreover, in a Chinese cohort, Tian et al demonstrated that BP of 130–139/80-89 mmHg was associated with increased risk of CVD events in Chinese adults with DM, but not in those with Pre-DM or normoglycemia.20 Our study expanded evidence on the BP management for normoglycemic and prediabetic individuals, suggesting that both lower and higher SBP levels associated with higher all-cause mortality. Additionally, SBP < 120 mmHg was suggested by Hajebrahimi.et al to be associated with CVD events/mortality among prediabetic population.39 More large-scale randomized trials are needed to better determine the optimal range of blood pressure management in these populations.
Our results also added the evidence that lowering SBP to less than 100 mmHg was significantly associated with higher all-cause mortality risk regardless of blood glucose status. In addition, SBP <100 mmHg was also associated with higher CVD mortality in people with normoglycemia, but not in Pre-DM or DM. One explanation of higher mortality risk associated with lower SBP levels was that intensive SBP reduction could accelerate the development of DM and may worsen cardiovascular outcomes.40 Besides, strict BP control could increase the risk of CVD and mortality through the under-perfusion of vital organs.41 Extremely low SBP often occurs in very sick patients and was a potential marker of heart failure and other comorbidities rather than playing a causal role, suggesting that higher mortality caused by SBP < 100 mmHg was not due to antihypertensive treatment and should be cautious when interpreting these findings.42 Moreover, one important finding of our study was that a U-shaped association for all-cause mortality existed regardless of diabetes status but appeared to be attenuated by higher blood glucose levels when came to CVD mortality. This inconsistency was partly due to the few number of CVD deaths in our study, which might have impact on the results. Further investigation is warranted to clarify the underlying mechanism among normoglycemic and prediabetic individuals.
The present study has several strengths. Nationally representative data from the NHANES were collected by standardized protocols. In addition, we adjusted numerous potential confounding factors, such as socioeconomic status, lifestyle factors, and anthropometric measures included in the NHANES. Despite those advantages, some limitations should be taken into consideration. First, FBG and HbA1c were measured only once at baseline, and we did not have the data on postprandial blood glucose after 2 hours, which may lead to a bias in the estimate of the total number of DM. Furthermore, the number of Pre-DM in our study population might be underestimated because data of glucose tolerance were missing in NHANES. Second, our validity of findings was limited by the cross-sectional and observational design. The non-linear association between SBP and mortality risk do not imply causality. Third, baseline factors such as BP levels, lipids, and drug treatment may change during the follow-up period, which may result in misclassification and bias estimated HR. Lastly, although we adjusted for multiple confounders, residual or unmeasured confounding effect may exist.
Conclusion
To sum up, the association of SBP with all-cause mortality was U-shaped regardless of diabetes status. Both lower (<100 mmHg) and higher (≥150 mmHg) levels of SBP were associated with greater risk of all-cause mortality. The optimal SBP range for the lowest mortality was gradually higher with worsening glucose status. Of note, there is little or insufficient evidence on the outcome benefit of BP-lowering treatment among adults with Pre-DM, and more well-designed, large-scale studies are needed in the future to reduce the huge disease burden in this growing population.
Acknowledgment
We are grateful to all the patients for their participation.
Disclosure
The authors declare that they have no conflicts of interest in this work.
References
1. Danaei G, Finucane MM, Lu Y, et al. National, regional, and global trends in fasting plasma glucose and diabetes prevalence since 1980: systematic analysis of health examination surveys and epidemiological studies with 370 country-years and 2.7 million participants. Lancet. 2011;378:31–40. doi:10.1016/s0140-6736(11)60679-x
2. Stamler J, Vaccaro O, Neaton JD, et al. Diabetes, other risk factors, and 12-yr cardiovascular mortality for men screened in the multiple risk factor intervention trial. Diabetes Care. 1993;16:434–444. doi:10.2337/diacare.16.2.434
3. Hubbard D, Colantonio LD, Tanner RM, et al. Prediabetes and risk for cardiovascular disease by hypertension status in black adults: the Jackson Heart Study. Diabetes Care. 2019;42:2322–2329. doi:10.2337/dc19-1074
4. Huang Y, Cai X, Mai W, et al. Association between prediabetes and risk of cardiovascular disease and all cause mortality: systematic review and meta-analysis. BMJ. 2016;355:i5953. doi:10.1136/bmj.i5953
5. Morris DH, Khunti K, Achana F, et al. Progression rates from HbA1c 6.0–6.4% and other prediabetes definitions to type 2 diabetes: a meta-analysis. Diabetologia. 2013;56:1489–1493. doi:10.1007/s00125-013-2902-4
6. Gerstein HC, Santaguida P, Raina P, et al. Annual incidence and relative risk of diabetes in people with various categories of dysglycemia: a systematic overview and meta-analysis of prospective studies. Diabetes Res Clin Pract. 2007;78:305–312. doi:10.1016/j.diabres.2007.05.004
7. Knowler WC, Barrett-Connor E, Fowler SE, et al. Reduction in the incidence of type 2 diabetes with lifestyle intervention or metformin. N Engl J Med. 2002;346:393–403. doi:10.1056/NEJMoa012512
8. Tuomilehto J, Lindström J, Eriksson JG, et al. Prevention of type 2 diabetes mellitus by changes in lifestyle among subjects with impaired glucose tolerance. N Engl J Med. 2001;344:1343–1350. doi:10.1056/nejm200105033441801
9. Liu HH, Cao YX, Li S, et al. Impacts of prediabetes mellitus alone or plus hypertension on the coronary severity and cardiovascular outcomes. Hypertension. 2018;71:1039–1046. doi:10.1161/hypertensionaha.118.11063
10. Qiu M, Shen W, Song X, et al. Effects of prediabetes mellitus alone or plus hypertension on subsequent occurrence of cardiovascular disease and diabetes mellitus: longitudinal study. Hypertension. 2015;65:525–530. doi:10.1161/hypertensionaha.114.04632
11. Hadaegh F, Derakhshan A, Zafari N, et al. Pre-diabetes tsunami: incidence rates and risk factors of pre-diabetes and its different phenotypes over 9 years of follow-up. Diabet Med. 2017;34:69–78. doi:10.1111/dme.13034
12. Bullard KM, Saydah SH, Imperatore G, et al. Secular changes in U.S. Prediabetes prevalence defined by hemoglobin A1c and fasting plasma glucose: national health and nutrition examination surveys, 1999–2010. Diabetes Care. 2013;36:2286–2293. doi:10.2337/dc12-2563
13. Ettehad D, Emdin CA, Kiran A, et al. Blood pressure lowering for prevention of cardiovascular disease and death: a systematic review and meta-analysis. Lancet. 2016;387:957–967. doi:10.1016/s0140-6736(15)01225-8
14. Cooper-DeHoff RM, Gong Y, Handberg EM, et al. Tight blood pressure control and cardiovascular outcomes among hypertensive patients with diabetes and coronary artery disease. JAMA. 2010;304:61–68. doi:10.1001/jama.2010.884
15. Cushman WC, Evans GW, Byington RP, et al. Effects of intensive blood-pressure control in type 2 diabetes mellitus. N Engl J Med. 2010;362:1575–1585. doi:10.1056/NEJMoa1001286
16. Wright JT, Williamson JD, Whelton PK, et al. A randomized trial of intensive versus standard blood-pressure control. N Engl J Med. 2015;373:2103–2116. doi:10.1056/NEJMoa1511939
17. Vidal-Petiot E, Ford I, Greenlaw N, et al. Cardiovascular event rates and mortality according to achieved systolic and diastolic blood pressure in patients with stable coronary artery disease: an international cohort study. Lancet. 2016;388:2142–2152. doi:10.1016/s0140-6736(16)31326-5
18. Reboldi G, Gentile G, Angeli F, et al. Effects of intensive blood pressure reduction on myocardial infarction and stroke in diabetes: a meta-analysis in 73,913 patients. J Hypertens. 2011;29:1253–1269. doi:10.1097/HJH.0b013e3283469976
19. Bangalore S, Kumar S, Lobach I, et al. Blood pressure targets in subjects with type 2 diabetes mellitus/impaired fasting glucose: observations from traditional and bayesian random-effects meta-analyses of randomized trials. Circulation. 2011;123:2799–2810, 2799 p following 2810. doi:10.1161/circulationaha.110.016337
20. Tian J, Sheng CS, Sun W, et al. Effects of high blood pressure on cardiovascular disease events among Chinese adults with different glucose metabolism. Diabetes Care. 2018;41:1895–1900. doi:10.2337/dc18-0918
21. Bress AP, King JB, Kreider KE, et al. Effect of intensive versus standard blood pressure treatment according to baseline prediabetes status: a post hoc analysis of a randomized trial. Diabetes Care. 2017;40:1401–1408. doi:10.2337/dc17-0885
22. Ali MK, Bullard KM, Saydah S, et al. Cardiovascular and renal burdens of prediabetes in the USA: analysis of data from serial cross-sectional surveys, 1988–2014. Lancet Diabetes Endocrinol. 2018;6:392–403. doi:10.1016/s2213-8587(18)30027-5
23. Bao W, Liu B, Simonsen DW, et al. Association between exposure to pyrethroid insecticides and risk of all-cause and cause-specific mortality in the general US adult population. JAMA Intern Med. 2020;180:367–374. doi:10.1001/jamainternmed.2019.6019
24. Palta P, Huang ES, Kalyani RR, et al. Hemoglobin A(1c) and mortality in older adults with and without diabetes: results from the national health and nutrition examination surveys (1988–2011). Diabetes Care. 2017;40:453–460. doi:10.2337/dci16-0042
25. Fain JA. NHANES. Diabetes Educ. 2017;43:151. doi:10.1177/0145721717698651
26. Whelton PK, Carey RM, Aronow WS, et al. 2017 ACC/AHA/AAPA/ABC/ACPM/AGS/APhA/ASH/ASPC/NMA/PCNA guideline for the prevention, detection, evaluation, and management of high blood pressure in adults: a report of the American college of cardiology/American heart association task force on clinical practice guidelines. J Am Coll Cardiol. 2018;71:e12–e248. doi:10.1016/j.jacc.2017.11.006
27. American Diabetes Association. 2. Classification and diagnosis of diabetes: standards of medical care in diabetes-2020. Diabetes Care. 2020;43:S14–S31. doi:10.2337/dc20-S002
28. National Center for Health Statistics. 2011 Public-use linked mortality files. Available from: https://www.cdc.gov/nchs/data/datalinkage/2011_linked_mortality_file_matching_methodology.pdf.
29. National Kidney Foundation. K/DOQI clinical practice guidelines for chronic kidney disease: evaluation, classification, and stratification. Am J Kidney Dis. 2002;39:S1–266.
30. Bundy JD, Li C, Stuchlik P, et al. Systolic blood pressure reduction and risk of cardiovascular disease and mortality: a systematic review and network meta-analysis. JAMA Cardiol. 2017;2:775–781. doi:10.1001/jamacardio.2017.1421
31. Brunström M, Carlberg B. Effect of antihypertensive treatment at different blood pressure levels in patients with diabetes mellitus: systematic review and meta-analyses. BMJ. 2016;352:i717. doi:10.1136/bmj.i717
32. Li W, Katzmarzyk PT, Horswell R, et al. Blood pressure and all-cause mortality among patients with type 2 diabetes. Int J Cardiol. 2016;206:116–121. doi:10.1016/j.ijcard.2016.01.009
33. Adamsson Eryd S, Gudbjörnsdottir S, Manhem K, et al. Blood pressure and complications in individuals with type 2 diabetes and no previous cardiovascular disease: national population based cohort study. BMJ. 2016;354:i4070. doi:10.1136/bmj.i4070
34. Sundström J, Sheikhi R, Ostgren CJ, et al. Blood pressure levels and risk of cardiovascular events and mortality in type-2 diabetes: cohort study of 34 009 primary care patients. J Hypertens. 2013;31:1603–1610. doi:10.1097/HJH.0b013e32836123aa
35. Banach M, Aronow WS. Blood pressure j-curve: current concepts. Curr Hypertens Rep. 2012;14:556–566. doi:10.1007/s11906-012-0314-3
36. Thomopoulos C, Parati G, Zanchetti A. Effects of blood-pressure-lowering treatment on outcome incidence in hypertension: 10 - Should blood pressure management differ in hypertensive patients with and without diabetes mellitus? Overview and meta-analyses of randomized trials. J Hypertens. 2017;35:922–944. doi:10.1097/hjh.0000000000001276
37. Emanuelsson F, Marott S, Tybjærg-Hansen A, et al. Impact of glucose level on micro- and macrovascular disease in the general population: a mendelian randomization study. Diabetes Care. 2020;43:894–902. doi:10.2337/dc19-1850
38. Siu AL. Screening for abnormal blood glucose and type 2 diabetes mellitus: U.S. preventive services task force recommendation statement. Ann Intern Med. 2015;163:861–868. doi:10.7326/m15-2345
39. Hajebrahimi MA, Akbarpour S, Eslami A, et al. Different combinations of glucose tolerance and blood pressure status and incident cardiovascular disease and all-cause mortality events. J Hum Hypertens. 2017;31:744–749. doi:10.1038/jhh.2017.49
40. Roumie CL, Hung AM, Russell GB, et al. Blood pressure control and the association with diabetes mellitus incidence: results from SPRINT randomized trial. Hypertension. 2020;75:331–338. doi:10.1161/hypertensionaha.118.12572
41. Mancia G, Laurent S, Agabiti-Rosei E, et al. Reappraisal of European guidelines on hypertension management: a European society of hypertension task force document. J Hypertens. 2009;27:2121–2158. doi:10.1097/HJH.0b013e328333146d
42. Xie X, Atkins E, Lv J, et al. Effects of intensive blood pressure lowering on cardiovascular and renal outcomes: updated systematic review and meta-analysis. Lancet. 2016;387:435–443. doi:10.1016/s0140-6736(15)00805-3
 © 2020 The Author(s). This work is published and licensed by Dove Medical Press Limited. The full terms of this license are available at https://www.dovepress.com/terms.php and incorporate the Creative Commons Attribution - Non Commercial (unported, v3.0) License.
By accessing the work you hereby accept the Terms. Non-commercial uses of the work are permitted without any further permission from Dove Medical Press Limited, provided the work is properly attributed. For permission for commercial use of this work, please see paragraphs 4.2 and 5 of our Terms.
© 2020 The Author(s). This work is published and licensed by Dove Medical Press Limited. The full terms of this license are available at https://www.dovepress.com/terms.php and incorporate the Creative Commons Attribution - Non Commercial (unported, v3.0) License.
By accessing the work you hereby accept the Terms. Non-commercial uses of the work are permitted without any further permission from Dove Medical Press Limited, provided the work is properly attributed. For permission for commercial use of this work, please see paragraphs 4.2 and 5 of our Terms.