")
Back to Journals » International Journal of Nanomedicine » Volume 15
Synergistic Combination of Sodium Aescinate-Stabilized, Polymer-Free, Twin-Like Nanoparticles to Reverse Paclitaxel Resistance
Authors Li J, Zheng L , Wang R, Sun D, Liang S, Wu J, Liu Y, Tian X, Li T, Yang Y, Han L
Received 22 April 2020
Accepted for publication 22 July 2020
Published 6 August 2020 Volume 2020:15 Pages 5839—5853
DOI https://doi.org/10.2147/IJN.S259432
Checked for plagiarism Yes
Review by Single anonymous peer review
Peer reviewer comments 2
Editor who approved publication: Professor Lei Yang
Juan Li,1 Lei Zheng,2 Rongmei Wang,1 Deqing Sun,1 Shuang Liang,3 Jing Wu,1 Yongqing Liu,1 Xiaona Tian,1 Tingting Li,4 Yang Yang,5 Leiqiang Han1
1Department of Clinical Pharmacy, The Second Hospital, Cheeloo College of Medicine, Shandong University, Jinan, Shandong 250033, People’s Republic of China; 2Department of Pharmacy, Shandong Provincial Third Hospital, Cheeloo College of Medicine, Shandong University, Jinan, Shandong 250031, People’s Republic of China; 3School of Pharmaceutical Sciences, Cheeloo College of Medicine, Shandong University, Jinan, Shandong 250012, People’s Republic of China; 4Department of Pharmaceutical Sciences, University of Connecticut, Storrs, CT, USA; 5China National Center for Biotechnology Development, Beijing 100039, People’s Republic of China
Correspondence: Leiqiang Han
Department of Clinical Pharmacy, The Second Hospital, Cheeloo College of Medicine, Shandong University, 247 Beiyuan Road, Jinan, Shandong 250033, People’s Republic of China
Tel +86-531-85875083
Fax +86-531-88962544
Email [email protected]
Background: The development of paclitaxel (PTX) resistance seriously restricts its clinical efficacy. An attractive option for combating resistance is inhibiting the expression of P-glycoprotein (P-gp) in tumor cells. We have reported that flavokawain A (FKA) inhibited P-gp protein expression in PTX-resistant A549 (A549/T) cells, indicating that FKA combined with PTX may reverse PTX resistance. However, due to the variable pharmacokinetics of FKA and PTX, the conventional cocktail combination in clinics may cause uncertainty of treatment efficacy in vivo.
Materials and Methods: To synergistically elevate the anti-cancer activity of PTX and FKA in vivo, the national medical products administration (NMPA) approved sodium aescinate (Aes) was utilized to stabilize hydrophobic PTX and FKA to form polymer-free twin like PTX-A nanoparticles (NPs) and FKA-A NPs.
Results: The resulting nanoparticles prepared simply by nanoprecipitation possessed similar particle size, good stability and ultrahigh drug loadings of up to 50%. With the aid of Aes, these two drugs accumulated in tumor tissue by passive targeting and were efficiently taken up by A549/T cells; this resulted in significant suppression of tumor growth in A549/T homograft mice at a low PTX dose (2.5 mg·kg− 1). Synergistic effects and reversed PTX resistance were achieved by the combination of PTX-A NPs and FKA-A NPs by inhibiting P-gp expression in tumor cells.
Conclusion: Using NMPA-approved Aes to prepare twin-like nanoparticles without introducing any new materials provides an efficient platform for combination chemotherapy and clinical translation.
Keywords: paclitaxel resistance, flavokawain A, sodium aescinate, polymer-free nanoparticles, combination therapy
Introduction
Paclitaxel (PTX) is one of the most useful and effective antineoplastic agents.1 However, long-term use of PTX can induce the upregulation of P-glycoprotein (P-gp) or multidrug resistance-associated protein (MRP), which leads to PTX resistance.2,3 Flavokawain A (FKA) is a novel chalcone from kava plant which can induce G2/M arrest and inhibit invasion and metastasis in different tumor cells.4,5 In our previous study, FKA was found to significantly reduce the expression of P-gp in PTX-resistant lung cancer (A549/T) cells.6 This result indicated that a combination of PTX and FKA might increase the sensitivity of lung cancer cells to PTX and improve the antitumor effects. However, due to the distinctive properties of PTX and FKA, the effective drug dosage and ratio at target tissues are difficult to control, which hampers the prediction of in vivo therapeutic efficacy from in vitro characterizations. An ideal delivery platform that normalizes the properties of PTX and FKA resulting in selective accumulation and controlled drug release at the target site is urgently required.
For combination therapy, many codelivery methods such as liposomes,7,8 micelles,9–11 nanoparticles12–16 and hydrogel17,18 have been developed. For instance, Johnson and colleagues reported an all-in-one star polymer nanoparticle generated by a ring-opening metathesis polymerization method; this method could load precise molar ratios of doxorubicin, camptothecin and cisplatin.19 Our group has developed irinotecan/oxaliplatin coloaded liposomes, which achieved synchronized delivery and exhibited superior antitumor effects.20 Despite this progress, most of these methods require a large quantity of materials and involve complicated processes.
Small molecule-based nanodrugs (SMNDs) are a type of self-carried nanodrugs which are comprised of pure drug or drug derivative with or without a small amount of stabilizer. For example, Paclical is composed of PTX and an equal mass of vitamin A analogue (XR-17) and was licensed by the Russian Federation to treat ovarian cancer in 2015. Meanwhile, our group also designed a series of SMND systems that exhibited excellent application potential.21,22 Furthermore, we reported the concept of complex SMNDs, in which 5-fluorouracil and vorinostat were conjugated to the same molecular chain to unify their physicochemical properties. These prodrugs could self-assemble into complex SMNDs with precise and tunable drug ratios for combination therapy.22 However, this strategy is not applicable for drug molecules lacking suitable coupling sites or those unable to form amphiphilic conjugates.
To solve this problem, a novel combination methodology based on SMND was proposed in this study. Briefly, a novel amphiphilic small molecule called stabilizer, which is independent of lipids, was applied for coassembly with an insoluble drug to generate nanoparticles. Due to the strong intermolecular interaction between stabilizer and drug, a sophisticated process, chemical synthesis and large amounts of excipients were not required. The stabilizer should have an amphiphilic structure; the hydrophobic part interacts strongly with the hydrophobic drug, while the hydrophilic part sticks out and makes the particle dispersible. Utilizing the same stabilizer, different drugs were expected to form twin-like nanoparticles,23 with similar size, size distribution and zeta potential, which is helpful for combination therapy. Sodium aescinate (Aes) has been approved by the National Medical Products Administration (NMPA) to relieve tissue edema, recover vasopermeability, and eliminate pressure caused by edema.24 Recent studies have shown that Aes has an inhibitory effect against different tumors.25–27 More importantly, based on our experience in designing self-assembled small molecules,21,22 Aes acts as a stabilizer since it is amphiphilic.
Herein, Aes-stabilized, twin-like PTX-A nanoparticles (NPs) and FKA-A NPs were prepared through precipitation. Extensive biophysical and biological characterizations were conducted, including evaluating the self-assembly mechanism, release profile, cellular uptake, cytotoxicity, synergistic effect, apoptotic induction and cell cycle blocking, tumor accumulation, anti-tumor efficacy and P-gp expression. The developed Aes-stabilized, polymer-free, twin-like nanoparticles exhibited several striking characteristics (Scheme 1): 1) easy preparation without any synthesis or sophisticated processes; 2) clinically translatable, since clinically used amphiphilic drugs were used to fabricate nanoparticles; 3) similar particle size, size distribution, zeta potential, good stability and ultrahigh drug loadings of up to 50%; 4) reversal of PTX resistance and significant suppression of tumor growth in A549/T homograft mice at a low PTX dosage (2.5 mg·kg−1). This SMND platform provides a new channel for combination chemotherapy and clinical translation.
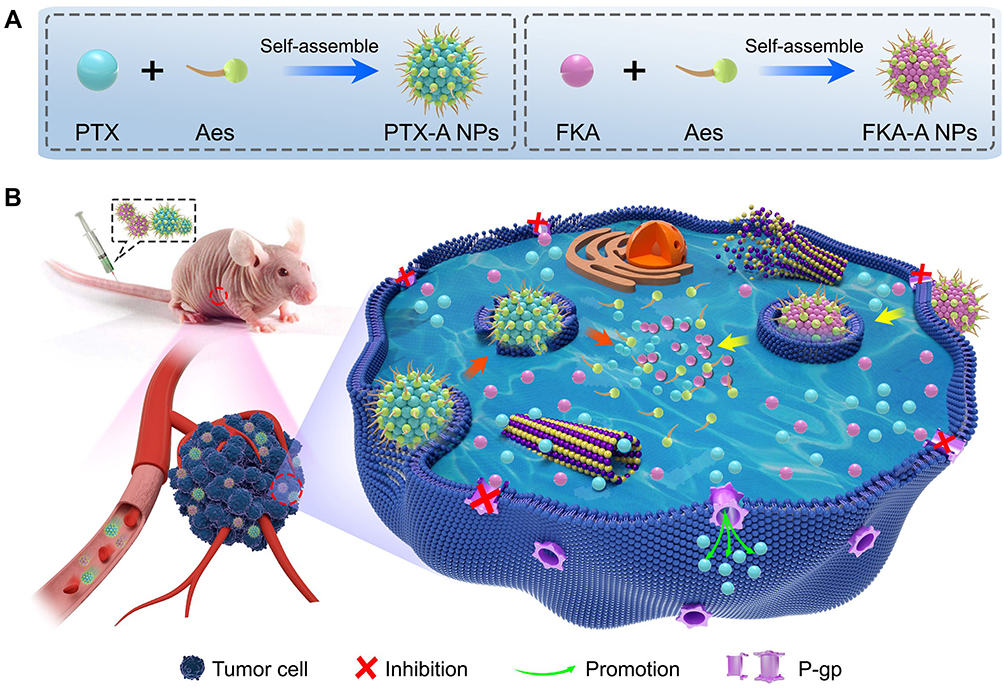 |
Scheme 1 Synergistic combination of sodium aescinate stabilized polymer-free twin-like nanoparticles to reverse paclitaxel resistance. (A) Aes was utilized to stabilize hydrophobic PTX and FKA to form polymer-free twin-like PTX-A NPs and FKA-A NPs. (B) With the aid of Aes, these two drugs could accumulate in tumor tissue via passive targeting and be efficiently taken up by PTX-resistant lung cancer (A549/T) cells, synergistic effects and reversed PTX resistance were achieved by combination of PTX-A NPs and FKA-A NPs via inhibiting P-gp expression in tumor cells. |
Materials and Methods
Materials
PTX and FKA were purchased from Sigma (St. Louis, MO, USA). Sodium aescinate (Aes) (≥98%) was purchased from Meilunbio® (Dalian, China). Monoclonal rabbit anti-human P-gp (cat. no. 13978) was purchased from Cell Signaling Technology (MA, USA). Cell Counting Kit-8 (CCK-8) was purchased from Dojindo Molecular Technologies (Kumamoto, Japan). Annexin V‑fluorescein isothiocyanate/propidium iodide Apoptosis Detection Kit was purchased from BD Biosciences (Franklin Lakes, NJ, USA). The cell cycle detection kit was purchased from Sigma (St. Louis, MO, USA). Dialysis membranes (MWCO 1000) were obtained from the Shanghai Medical Chemical Reagent Co., Ltd. (Shanghai, China). Phosphate buffer and 0.25% trypsin were purchased from Gibco, Invitrogen Corp (Ontario, USA).
Cell Culture
PTX-resistant human lung adenocarcinoma cells A549 (A549/T) cells were kindly gifted by the Central Research Laboratory of the Second Hospital of Shandong University (Jinan, China) and approved by the Animal Ethics Committee of the Second Hospital of Shandong University (Permit Number: KYLL-2017(LW)A-009). Cells were cultured in RPMI-1640 (HyClone; GE Healthcare Life Sciences) containing 10% (v/v) fetal bovine serum (Gibco; Thermo Fisher Scientific, Inc.), penicillin-streptomycin (100 U·mL−1) and 2 mM glutamine. The cells were cultured at 37°C in an incubator with 5% CO2. The A549/T cells were maintained in medium with 3 nM PTX to maintain PTX resistance in this cell line. Before the experiment, cells were cultured in drug-free medium for ≥2 weeks.
PTX-A NPs and FKA-A NPs Preparation & Characterization
PTX-A NPs and FKA-A NPs were prepared by the nanoprecipitation method.22 In brief, different mass ratios of PTX/Aes or FKA/Aes were dissolved in DMSO. Then, 100 μL DMSO solution of PTX/Aes or FKA/Aes at different mass ratio was added dropwise to 1000 μL ddH2O under mechanical stirring. The organic solvent was removed dialysis method (MWCO 1000). Zeta sizer Nano ZS90 (Malvern Instruments, Malvern, UK) was used to analyze the mean particle size and ζ-potential. Transmission electron microscopy (JEM-1200EX, JEOL, Tokyo, Japan) was adopted to observe the morphology of nanoparticles. The best mass ratio of PTX-A NPs and FKA-A NPs was determined by prescription screening.
X-Ray Diffraction Study
X-ray diffraction diagrams of PTX-A NPs and FKA-A NPs were collected with an X-ray diffractometer (D8 advance, Bruker Co. Ltd, Karlsruhe, Germany). The instrument was operated with a scanning range of 2 θ from the initial angle 10° to the final angle of 60°.
The Ultraviolet-Visible (UV) Absorption Study
The UV absorption spectra of PTX-A NPs, PTX, Aes and PTX/Aes mixture solutions (eq. 10 μg·kg−1 PTX) were measured by UV spectrophotometry (u-2910, HITACHI, Japan) with a scanning range from 200 nm to 500 nm. The ultraviolet-visible (UV) absorption study of FKA-A NPs was conducted with the same method (eq.10 μg·kg−1 FKA).
Plasma Stability of PTX-A NPs and FKA-A NPs
The stability of PTX-A NPs and FKA-A NPs was evaluated in terms of particle size change in different media. The same volume of RPMI 1640 or 20% plasma were added into an equal volume of PTX-A NPs and FKA-A NPs, respectively (Figure S1). It was followed by incubation in a water bath oscillation at 37 ± 0.5°C. The change in particle size and PDI with different media was recorded for 24 h. The preparation of plasma was approved by the Animal Ethics Committee of the Second Hospital of Shandong University (Permit Number: KYLL-2017(LW)A-009).
In vitro Release Assay
The in vitro release of PTX and FKA from respective nanoformulations was conducted with the dialysis bag diffusion method (pH 7.4, 37°C) and evaluated by high-performance liquid chromatography (HPLC). At timed intervals, 0.2 mL solution was withdrawn, 1:1 diluted with methanol and subjected to HPLC analysis to quantify the PTX or FKA content. The release experiments were performed in triplicate, and the results were expressed as the mean ± SD.
Molecular Dynamic (MD) Simulations
The full-atomistic classical MD simulation for Aes, FKA and PTX molecules with mixed molar ratios of Aes: FKA=5:17 and Aes: PTX=6:8 were performed with the GROMACS28–33 software package version 2018.3. The bonding and nonbonding parameters for the atoms in Aes, FKA and PTX molecules were taken from the Generalized Amber Forcefield34 (GAFF). The charges of Aes, FKA and PTX molecules were obtained using the restrained electrostatic potential (RESP)35 method with the aid of the MultiWFN36 package version 3.6 from DFT (at PBE0/def2-SVP level37 with the SMD model38 of water considered) optimized structures of Aes, FKA and PTX molecules with their lowest energy conformation (Figures S2–S3) determined from the conformation search run, as well as respective DFT electron densities of these molecules.
The initial structures of the Aes: FKA=5:17 system were prepared by randomly placing 10 Aes molecules and 34 FKA molecules in a simulation box of 1×1×1nm3. Similarly, 10 Aes molecules and 14 PTX molecules were randomly inserted into a simulation box with same size to form the Aes: PTX=6:8 system. After inserting the amphiphilic molecules into their simulation boxes, the boxes were filled with water molecules. Then, 10 Na+ ions were added to each simulation box to balance the negative charge in the Aes molecules.
The MD trajectories obtained in the final production run were subsequently analyzed using the VMD package39 version 1.9.4. The MD trajectories were output with a time interval of 1 ps. The root mean squared displacement (RMSD) of the molecules was calculated to assess the convergence of the MD simulations.
In vitro Cellular Uptake Study
Coumarin 6 (C6) was used to trace the in vitro cellular uptake of nanoparticles. C6-A NPs was prepared by the same method used for PTX-A NPs (weight ratio, 1:1). A549/T cells were seeded in a 12-well plate at 1.0×10⁵ cells/well and incubated overnight. Then, cells were incubated with free C6 and C6-A NPs for 1 h, 2 h and 4 h at 37°C and washed three times with cold PBS (pH 7.4). Cellular uptake was observed using an inverted fluorescence microscope (BX40, Olympus, Japan). Thereafter, cells were harvested by trypsinization and washed three times with cold PBS. The cell-associated fluorescence was quantitatively determined by FACS Calibur flow cytometry (BD Biosciences, USA). Data collection involved 10,000 counts per sample, and only viable cells were gated for fluorescence analysis. All experiments were performed in triplicate.
In vitro Cytotoxicity & Synergistic Effect Assay
In vitro cytotoxicity assays of PTX-A NPs, FKA-A NPs, and PTX-A NPs +FKA-A NPs were performed in A549/T cells. Briefly, cells were cultured in a 96-well plate (5000 cells per well) in RPMI-1640 medium with 10% fetal bovine serum at 37°C. After 12 h, cells were treated with varied concentrations of different formulations for 72 h. Inhibition of cell proliferation was evaluated with the CCK-8 assay. Absorbance was measured at 450 nm using a microplate reader. The synergistic effect was assessed by the combination index (CI) assay. CI values were calculated from the Chou-Talalay equation:22
where D1 and D2 are the doses of drug 1 and 2 that in combination produce the specified effect (eg, IC50). Dm1 or Dm2 is the dose of drug 1 or 2 alone required to achieve the same effect. CI>1, =1 or <1 denotes antagonism, additivity and synergism, respectively.
Apoptosis and Cell Cycle Distribution Assay
Following treatment with 0.1% DMSO, 10 μM Aes, 10 μM PTX+FKA solution, and 10 μM PTX-A NPs+10 μM FKA-A NPs for 24 h at 37°C, A549/T cells were digested and centrifugalized at 1000 r·min−1 for 5 min at 4°C. Then, the cells were harvested, washed twice with cold PBS, resuspended in 400 μL Annexin V binding buffer, and stained with Annexin V-FITC/PI for 20 min at 2–8°C in the dark. Fluorescence was quantified by flow cytometry (FACSCalibur™; BD Biosciences), and the data were analyzed by WinMDI Software 2.8 (Purdue University Cytometry Laboratories, West Lafayette, IN, USA).
For the cell cycle distribution assay, A549/T cells at 70% to 80% confluency were treated with 0.1% DMSO, 10 μM Aes, 10 μM PTX+10 μM FKA solution, and 10 μM PTX-A NPs + 10 μM FKA-A NPs for 24 h. Then, cells were fixed in ice-cold 70% ethanol overnight. After incubation with RNase (Invitrogen, CA, USA) and propidium iodide (PI, Sigma-Aldrich), cell cycle analysis was performed by flow cytometry (Becton Dickinson, NJ, USA). The percentage of cells in the S, G0-G1, and G2-M phases of the cell cycle was determined.
In vivo Antitumor Activity Assay
All animal experiments were performed in accordance with protocols approved by the Animal Ethics Committee of the Second Hospital of Shandong University (Permit Number: KYLL-2017(LW)A-009). A549/T cells (1 × 10⁷) in 0.1 mL of physiological saline were injected subcutaneously into the flanks of 6-week-old female BALB/c nude mice (Vital River Laboratories, Beijing, China). When the tumors reached approximately 100 mm3, mice were randomly divided into six groups: control (0.9% saline), PTX (5.0 mg·kg−1 PTX solution), FKA (5.0 mg·kg−1 FKA solution), PTX-A NPs (eq. 5.0 mg·kg−1 PTX), FKA-A NPs (eq. 5 mg·kg−1 FKA) and PTX-A NPs + FKA-A NPs (eq. 2.5 mg·kg−1 PTX and 2.5 mg·kg−1 FKA). Mice in each group were intravenously administered different treatments on days 0, 2, 4, 6, 8, 10 and 12 for a total of seven injections. The width and length of tumors, as well as the body weight of each mouse, were measured on days 0, 2, 4, 6, 8, 10, 12 and 14. The tumor volumes were calculated using the formula: V=Width2 x 1/2 Length. At the end of the experiment, all mice were euthanized. Tumors were separated, weighed and photographed.
Immunohistochemistry Analysis
Tumor sections obtained from A549/T tumor-bearing mice with different therapies (0.9% saline, PTX, FKA, PTX-A NPs, FKA-A NPs, and PTX-A NPs + FKA-A NPs) were fixed in 4% polyformaldehyde and embedded in paraffin. Paraffin-embedded tissue blocks were cut to 4 mm sections and dehydrated in xylene and graded alcohol. After antigen retrieval, 3% hydrogen peroxide was incubated with the slides for 30 min to inactivate endogenous peroxidase. Then, the slides were blocked with goat serum to reduce nonspecific binding, incubated with diluted P-gp antibody (1:200, Cell Signaling Technology) at 4 °C overnight, and then incubated with peroxidase-conjugated secondary antibody for 1 h. Diaminobenzidine (DAB) substrate and hematoxylin were used for detection and counterstaining, respectively. All slides were reviewed under a microscope (Nikon, Ti-U).
In vivo Biodistribution
For evaluating the in vivo biodistribution of PTX-A NPs and FKA-A NPs in tumor-bearing mice, the near-infrared fluorescence (NIRF) dye DiR was applied, and DiR-loaded NPs were prepared as described previously.22 Mice were randomly grouped into DiR solution and DiR-loaded NP groups (3 mice/group); then, the mice were injected intravenously with different DiR formulation (0.5 mg·kg−1). The NIRF images of mice were taken with a real-time NIRF imaging system (Xenogen IVIS Lumina; Caliper Life Sciences, MA, USA) at 0, 1, 2, 4, 8, and 24 h postinjection. Then, mice were sacrificed, and organs (heart, liver, spleen, lung and kidney) as well as tumors were excised for ex vivo fluorescence imaging.
Statistical Analysis
The data are presented as the mean ± standard deviation of at least three independent experiments and were analyzed by GraphPad Prism 5 (GraphPad Software, Inc., La Jolla, CA, USA). The statistical significance of the mean difference between the control and treated groups was evaluated with two-tailed Student’s t-tests. Multiple group comparisons were performed with a one-way analysis of variance, followed by Dunnett’s multiple comparison test. *Indicates p< 0.05, **Indicates p< 0.01, ***Indicates p< 0.001.
Results and Discussion
Preparation and Characterization of Nanoparticles
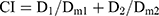
PTX and FKA have poor solubility in water. Thus, DMSO solutions were prepared, which induced precipitation when diluted in PBS. However, when amphiphilic Aes was added into their respective DMSO solutions, Aes coassembled with PTX or FKA and formed spherical PTX-A NPs or FKA-A NPs with particle sizes approximately 200 nm. Our previous study indicated that the ratio of Aes to PTX or FKA was crucial for forming coassembled nanoparticles. Thus, various weight ratios of PTX or FKA/Aes (20:2.5, 20:5, 20:10, 20:20, 10:20, 5:20, 2.5:20) were tested to optimize the experimental conditions (Figure 1A). When the ratio of PTX/Aes was below 20:20, the resulting solutions precipitated in 24 h. A similar phenomenon was observed in FKA-A NPs. When the Aes ratio was below 25%, they could not coassemble into nanoparticles. By varying the mass ratio of PTX/Aes from 20:20 to 2.5:20, spherical PTX-A NPs were formed with a hydrodynamic diameter ranging from 148.9 nm to 242.6 nm. When the ratio of FKA to Aes changed from 20:20 to 2.5:20, the size of FKA-A NPs increased from 113.6 nm to 329.1 nm. Therefore, an optimized ratio of 20:20 was chosen for both groups to achieve spherically assembled particles, small particle size and suitable polydispersity index (PDI) (Figure 1A–C). FKA-A NPs and PTX-A NPs were designed to be administered and diluted intravenously. The dilution stability is shown in Figure 2A and C. The particle size remained almost unchanged when they were diluted to 0.125 mg·mL−1. Additionally, the zeta potentials of PTX-A NPs and FKA-A NPs in aqueous solution were negative (about −30 mV) (Figure 2B and D), which was beneficial for their stability due to electrostatic repulsion. Furthermore, at this optimal ratio, the encapsulation efficiency (EE) of FKA and PTX was >95%, as determined by HPLC. Therefore, these optimized formulations with similar nanoscale size, size distribution, zeta potential and drug loading (close to 50%) were selected for the following in vitro and in vivo experiments.
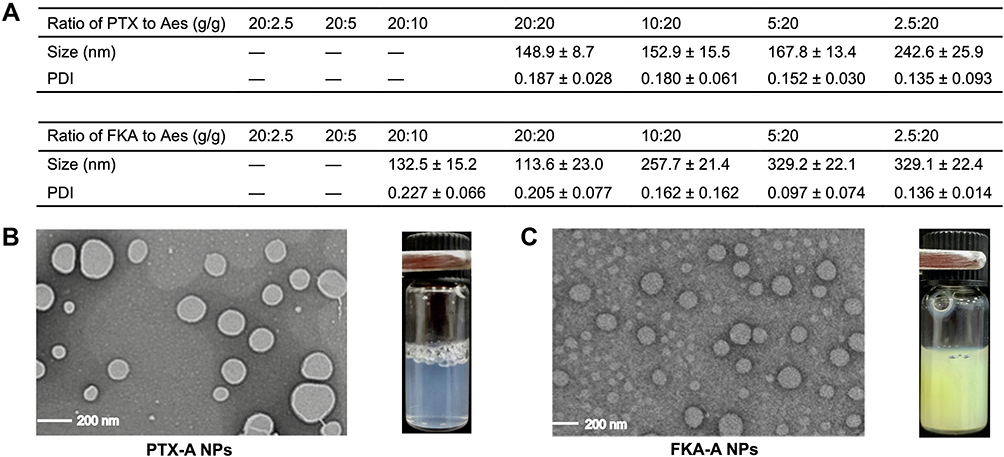 |
Figure 1 (A) Characterizations of PTX-A NPs with different ratio of PTX to Aes and FKA-A NPs with different ratio of FKA to Aes. (B and C) TEM images and appearance of the optimized nanoparticles. “–” represented that the resulting solutions formed precipitation within 24 h. |
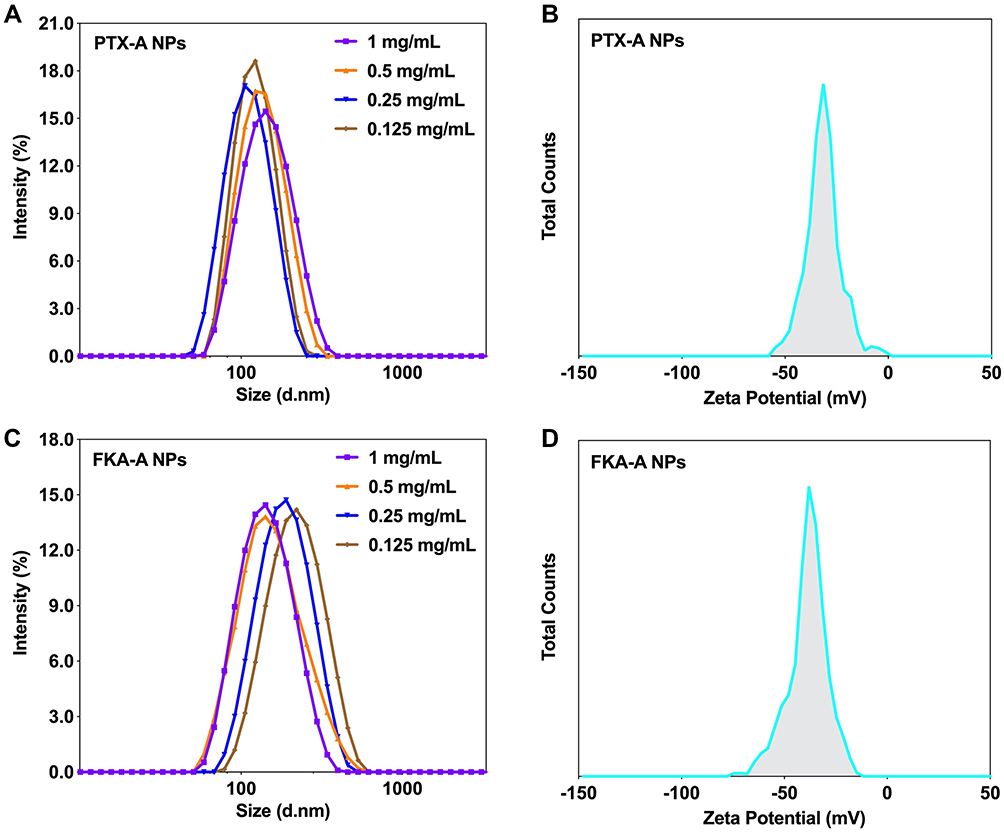 |
Figure 2 (A) DLS curves at different concentrations and (B) zeta potential of optimized PTX-A NPs. (C) DLS curves at different concentrations and (D) zeta potential of optimized FKA-A NPs. |
X-Ray Diffraction of PTX-A NPs and FKA-A NPs
The X-ray diffraction results for PTX, FKA, Aes, PTX-A NPs, and FKA-A NPs are shown in Figure 3A–E. The diffraction pattern of PTX showed several distinct sharp peaks at 12.6°, 18.1°, 20.1°, 22.2° and 25.4°. Similarly, the diffraction pattern of FKA showed several distinct sharp peaks at 12.5°, 19.8°, 23.2°, and 27.4°. Conversely, Aes has no sharp peaks. However, these peaks disappeared in PTX-A NPs and FKA-A NPs, which indicated that PTX and FKA were dispersed randomly, coassembled with Aes, and distributed in an amorphous state.40
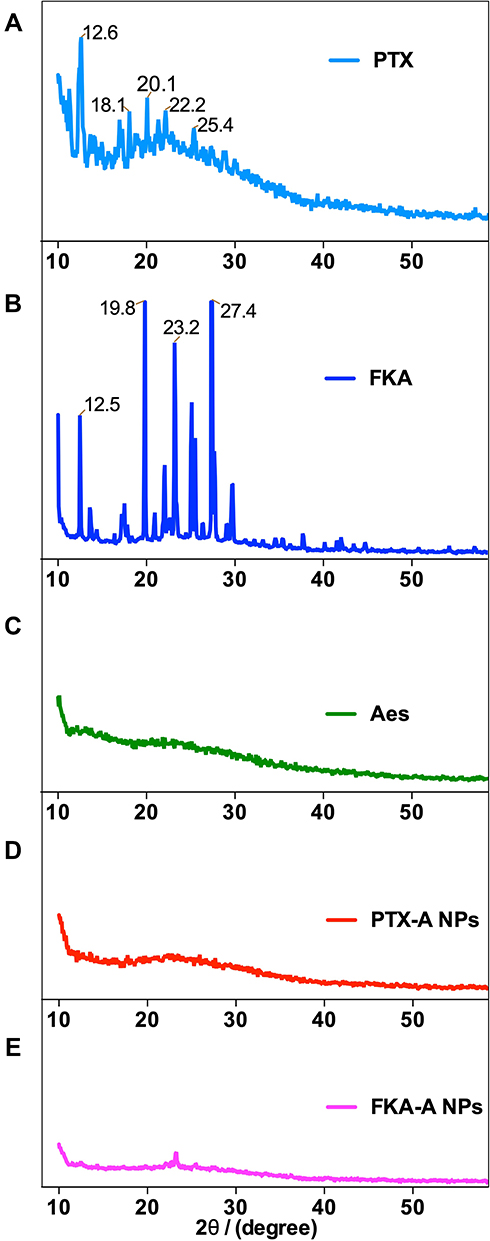 |
Figure 3 X-ray diffraction diagrams of PTX (A), FKA (B), Aes (C), PTX-A NPs (D) and FKA-A NPs (E). |
The UV Absorption of PTX-A NPs and FKA-A NPs
The UV spectra of PTX, FKA, Aes as well as their nanoformulations and solutions are shown in Figure 4A–D. PTX had maximum absorption at 228 nm, while FKA had maximum absorption at 367 nm. Aes showed no UV absorption, and Aes did not influence the UV absorption of PTX in PTX/Aes solution and FKA in FKA/Aes solution. Once PTX and Aes coassembled into nanoparticles, the curve shape changed greatly, and the maximum absorption at 228 nm disappeared (Figure 4A). When FKA and Aes coassembled into nanoparticles, the maximum absorption of FKA redshifted from 367 nm to 375 nm (Figure 4C). Additionally, the UV spectra of PTX, FKA and their mixture with Aes in different solvents were also tested. As shown in Figure 4B and D, the maximum absorption wavelength of PTX in H2O/CH3OH (v/v, 3/2) showed a slight redshift from 228 nm to 229 nm, while the maximum absorption wavelength of FKA in H2O/CH3OH (v/v, 3/2) did not change. This suggests that the water in nanoformulations made little contribution to the spectral transformation. These results indicate that PTX-A NPs and FKA-A NPs were prepared via heterogeneous molecular–molecular interactions.
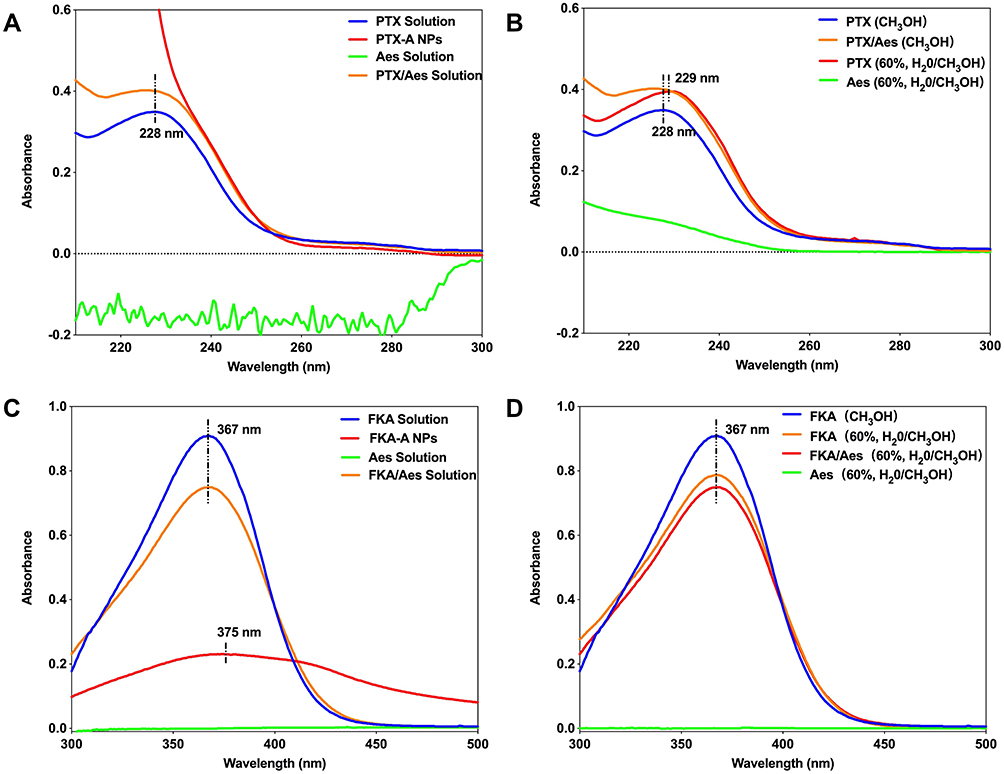 |
Figure 4 (A) The UV spectrum of PTX, PTX-A NPs, Aes and PTX/Aes solution. (B) The UV spectrum of PTX, Aes and PTX/Aes in different solvent. (C) The UV spectrum of FKA, FKA-A NPs, Aes and FKA/Aes solution. (D) The UV spectrum of FKA, Aes and FKA/Aes in different solvent. |
Stability of PTX-A NPs and FKA-A NPs
Particle size and PDI changes of nanoparticles under simulated physiological conditions were evaluated for 24 h.41 As shown in Figure S1, particle size and PDI of PTX-A NPs and FKA-A NPs showed almost negligible changes after incubation in RPMI 1640 and 20% plasma for 24 h, indicating the satisfactory stability of PTX-A NPs and FKA-A NPs in these two media. This would be conducive to exerting the enhanced permeation and retention effect during the circulation of nanoparticles in the body.
In vitro Release
The release profile of PTX or FKA from nanoparticles was studied. Both PTX-A NPs and FKA-A NPs exhibited prolonged and slower drug release than their solutions. After 48 h, only 48.8% of encapsulated PTX was released from PTX-A NPs. After 72 h, only 57.9% of PTX was released from the nanoparticles. This compared favorably to its solution, in which 78.0% and 86.0% of PTX was released after 48 h and 72 h, respectively (Figure 5A). By contrast, FKA released much slower from FKA-A NPs, with no more than 30% of FKA released at 72 h (Figure 5B). The slow release might be due to the strong interaction within nanoparticles. This may facilitate the PTX and FKA delivery by minimizing their premature release from PTX-A NPs and FKA-A NPs before reaching the tumor site.
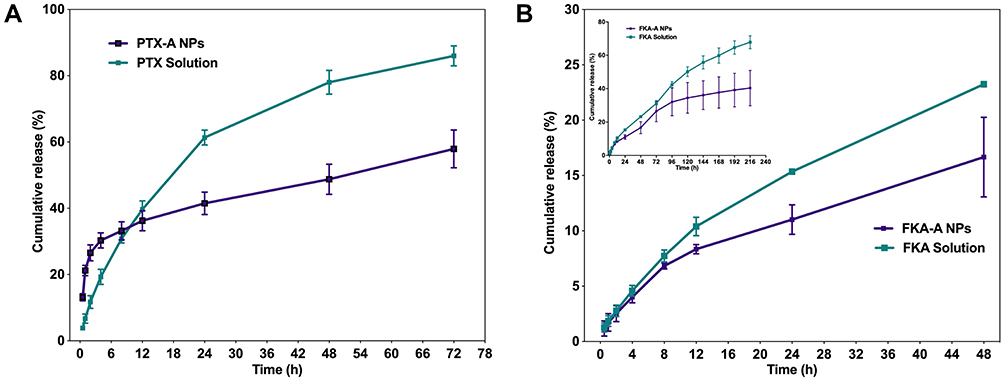 |
Figure 5 In vitro release behavior of PTX-A NPs (A) and FKA-A NPs (B). |
MD Simulations
To explore how molecules interact with each other in aqueous solution, MD simulations were performed. The self-assembly processes of the FKA-A NPs (molar ratio, Aes: FKA = 5:17) are shown in Figure 6A, and the final structure of the FKA-A NPs is shown in Figure 6C. The overall RMSD suggests excellent convergence of the MD simulations. Aes and FKA tended to aggregate as early as 5 ns, with notable aggregation of FKA that was surrounded by Aes. Three larger aggregates were observed at 10 ns, followed by further growth through 20 ns. Single particles formed after 40 ns, and there were much smaller structural fluctuations afterwards. The particles had closely packed ellipsoidal to spherical shape with FKA aggregating in the central part, while Aes was located at the surface of the nanoparticle, suggesting Aes acts as a surfactant. In contrast, PTX and Aes tended to aggregate later than FKA and Aes, as suggested in Figure 6B. Notable aggregation was observed after 10 ns, and the formation of individual particles was detected after 60 ns. The aggregation process agreed with the RMSD curve, which also showed a dramatic reduction in the fluctuation magnitude after 60 ns. Interestingly, spherical disc-like structures were formed in PTX-A NPs (mole ratio, Aes: PTX = 6:8) (Figure 6D) with intertwined Aes and PTX molecules. Additionally, the more hydrophilic part of Aes was located towards the outer part of the nanoparticle.
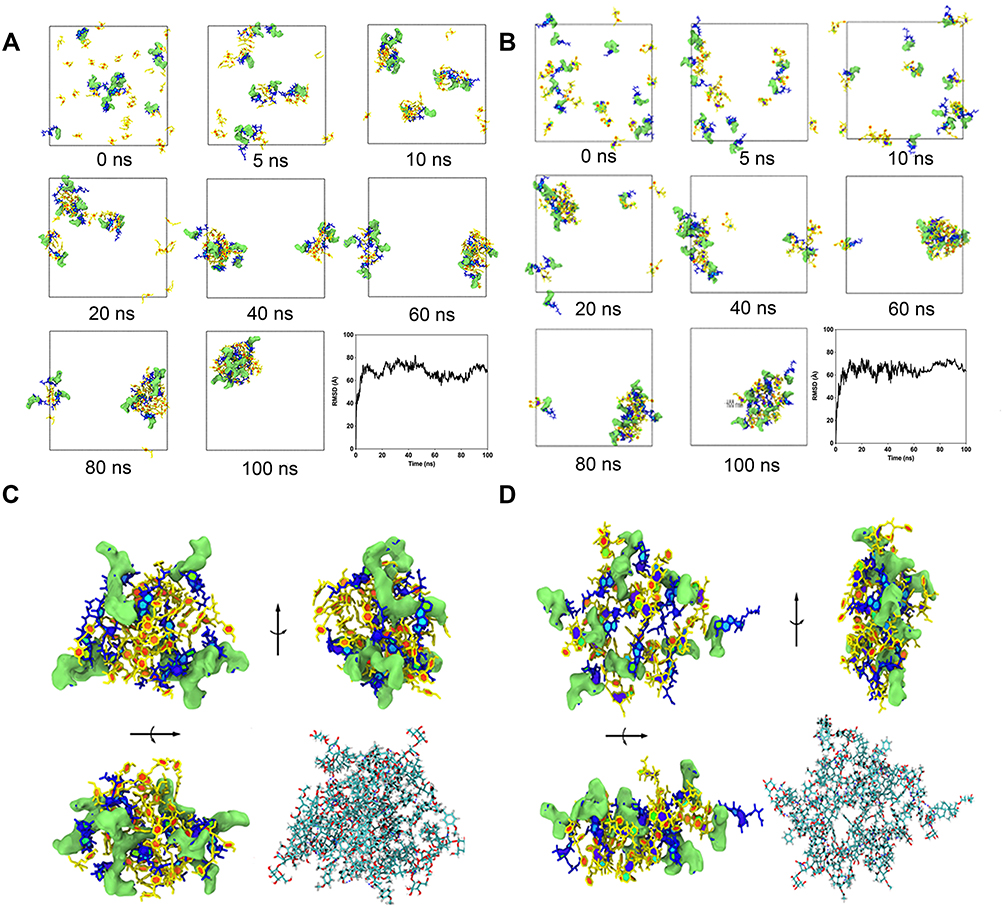 |
Figure 6 (A) The self-assembly process of FKA-A NPs from 0 to 100 ns. Aes was colored in blue with hydrophilic part represented by lime isosurfaces. FKA was colored in yellow. (B) The self-assembly process of PTX-A NPs from 0 to 100 ns. Aes was colored in blue with hydrophilic part represented by lime isosurfaces and PTX were colored in yellow. The time evolution of the overall RMSD of the FKA and Aes as well as PTX and Aes were also provided. (C) Structure of the self-assembled FKA-A NPs at 100 ns. (D) Structure of the self-assembled PTX-A NPs at 100 ns. |
Both nanoparticles were amorphously formed. We further confirmed this observation by calculating the average radial distribution function (RDF) for the FKA or PTX molecules in these systems. As shown in Figure S5, disordered features were observed, suggesting that no specific type of intermolecular interaction governed the formation of the two nanoparticles. However, the electrostatic potential (ESP) distributions in Figure S3 indicated preference of π-π interaction between FKA, which was the strongest driving force thus leading to a sharper peak. However, the central part of PTX had abundant hydroxyl groups (Figure S4) which induced the formation of intertwined structure and hydrogen bonds with the hydrophilic part of Aes. These MD simulations were consistent with the above data and strongly supported our hypothesis that a suitable stabilizer was able to coassemble with insoluble drug into nanoparticles. Moreover, these results could also explain why both nanoparticles showed slow drug release profiles.
The in vitro Cellular Uptake Studies
The in vitro cellular uptake of C6-A NPs was studied in A549/T cells after 1 h, 2 h and 4 h of incubation by fluorescence microscopy. The microscopy images (Figure 7A) showed that free C6 or C6-A NPs were internalized by A549/T cells in a time-dependent manner. Compared with free C6, A549/T cell uptake of C6-loaded NPs was more efficient. The cellular uptake was qualitatively measured using flow cytometric analysis. As shown in Figure 7B, the mean fluorescence intensity (MFI) of C6-A NPs and free C6 in A549/T cells increased in a time-dependent manner. However, at each time point, the MFI of cells treated with C6-A NPs was significantly (p<0.001) higher than that of cells treated with free C6 (Figure 7C). These results demonstrated that Aes-stabilized nanoparticles are efficiently taken up by A549/T cells.
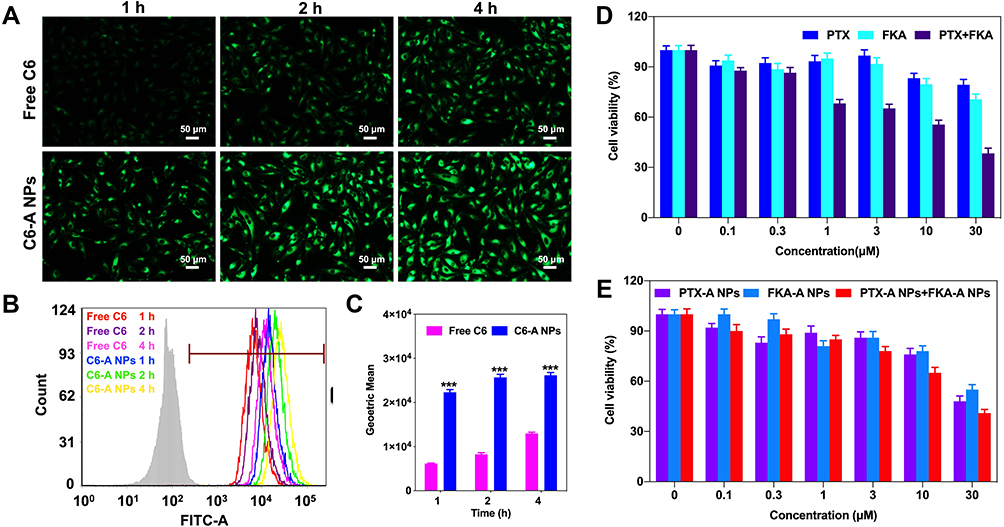 |
Figure 7 (A) Representative fluorescence microscope images of cellular uptake of C6-A NPs in A549/T cells at different times. (B) Fluorescence spectra of cellular uptake of C6-A NPs in A549/T cells. (C) Internalization rates of C6-A NPs analyzed by flow cytometry. ***p<0.001 vs free C6 (n = 3). (D) Cytotoxicity of FKA, PTX, FKA+PTX in A549/T cells. (E) Cytotoxicity of PTX-A NPs, FKA-A NPs and PTX-A NPs + FKA-A NPs in A549/T cells. |
PTX-A NPs + FKA-A NPs Exhibited Synergistic Effects in Inhibiting Cells Viability, Promoting Cell Apoptosis and Triggering Cell Cycle Arrest in A549/T Cells
As an initial screening approach, a cell viability assay was carried out to identify the inhibitory effect of different treatments on A549/T cells. As shown in Figure 7D, A549/T cells were not sensitive to PTX or FKA, and their IC50 values in A549/T cells were 92.11 μM and 58.55 μM, respectively. However, PTX and FKA co-administration inhibited A549/T cells in a dose-dependent manner, with a marginally lower IC50 (9.56 μM, p<0.01, vs PTX group). On the other side, as shown in Figure 7E, PTX-A NPs alone and FKA-A NPs alone inhibited A549/T cells growth with IC50 values of 28.90 μM and 34.38 μM, respectively. The IC50 of PTX-A NPs + FKA-A NPs decreased to 13.68 μM (p<0.05, vs PTX-A NPs). The CI index for the synergistic effect was calculated by the Chou-Talalay method, and the CI value at IC50 was 0.95. These data demonstrated that PTX-A NPs + FKA-A NPs synergistically inhibited A549/T cells.
Compared with the PTX+FKA solution group, PTX-A NPs combined with FKA-A NPs did not show higher anti-proliferative activity in A549/T cells. It is possible that free drug readily penetrates cells, while cellular uptake of nanoparticles is limited by endocytosis and there is a time lag for the same amount of free drug to be released from nanoparticles incubated with live cells. The altered cellular pharmacokinetics obviate the comparison of cytotoxicity effect between free drug and its nanoparticles.
Flow cytometry was used to analyze apoptosis in A549/T cells exposed to PTX-A NPs combined with FKA-A NPs. As shown in Figure 8A, PTX-A NPs + FKA-A NPs caused a significant increase in the fraction of apoptotic cells, with approximately 30.02±1.12% apoptotic cells after treatment (p<0.05, vs control). The effect of PTX-A NPs combined with FKA-A NPs on cell cycle progression was also measured. Treatment with PTX-A NPs + FKA-A NPs caused a significant accumulation of cells in G2/M phase and a corresponding decrease in S and G0/G1 phase fractions compared with vehicle control in A549/T cells (Figure 8B). Specifically, PTX-A NPs + FKA-A NPs resulted in 41.52±1.78% of A549/T cells in the G2/M phase compared to 7.12±0.62% in vehicle control cells (p<0.05). Compared with free drug combination, PTX-A NPs + FKA-A NPs possessed similar activities in promoting apoptosis and triggering cell cycle arrest, suggesting that their nanoformulations do not affect the anti-cancer activity of free drug.
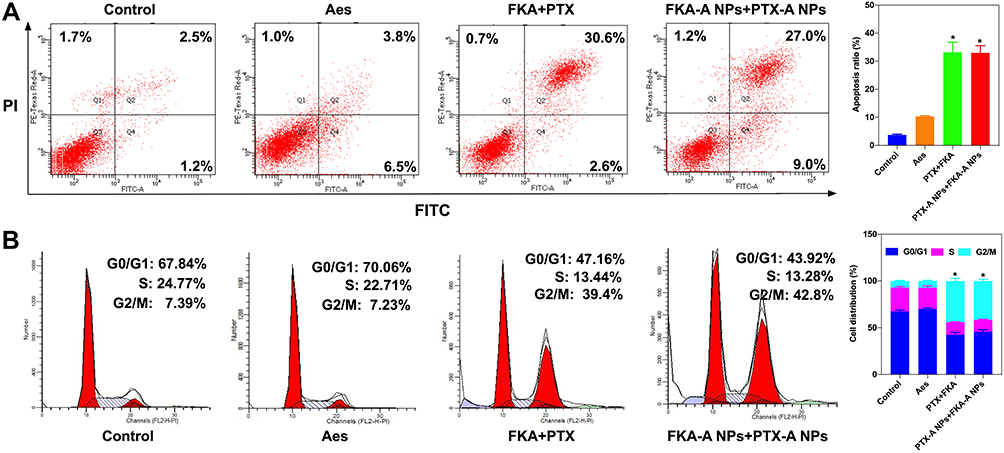 |
Figure 8 (A) Flow cytometry analysis for apoptosis of A549/T cells induced by Aes, PTX+FKA and PTX-A NPs + FKA-A NPs. *p <0.05 vs control, (n = 3). (B) Cell cycle distribution histograms of A549/T treated with Aes, PTX+FKA and PTX-A NPs + FKA-A NPs. *p <0.05 vs control, (n = 3). |
PTX-A NPs + FKA-A NPs Led to Synergistic Inhibition in a Mouse Xenograft Model
The antitumor efficiency of PTX-A NPs + FKA-A NPs was further elucidated in vivo. As shown in Figure 9A–D, PTX-A NPs + FKA-A NPs significantly reduced average tumor volume (p<0.01) at a much lower PTX dosage (2.5 mg·kg−1), while the average volume (Figure S6) and weight of the A549/T tumor treated with PTX (5.0 mg·kg−1) or FKA were not significantly changed compared to the control. Compared with PTX-A NPs (eq. 5.0 mg·kg−1 PTX) alone or FKA-A NPs alone, a remarkable volume and weight reduction in the PTX-A NPs + FKA-A NPs group was also observed (p<0.05). Additionally, the initial and final body weights of tumor-bearing mice after PTX-A NPs + FKA-A NPs treatment were not significantly different from those of the other groups.
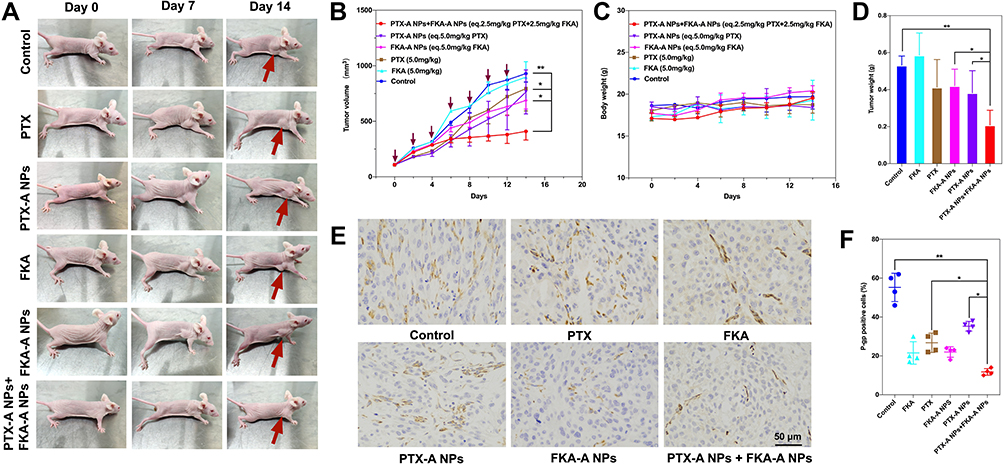 |
Figure 9 Combination of PTX-A NPs and FKA-A NPs exhibited potent antitumor activity in PTX-resistant homograft mice. (A-B) Antitumor activities in A549/T bearing female BALB/c mice. The red arrow represents the location of the tumor. *p < 0.05 vs PTX-A NPs or FKA-A NPs, **p < 0.01 vs control group (n = 5). (C) Changes of mouse body weight over the experiment. (D) Average tumor mass isolated from the mice of each experimental group. **p < 0.01, *p < 0.05 (n = 5). (E) Immunohistochemical analysis of tumor tissues treated with various treatments. Tumor sections were evaluated for P-gp expression using an rabbit anti-human P-gp antibody (magnification ×400). (F) P-gp-positive rates in the six groups, **p < 0.01, *p < 0.05 (n = 4). |
In this study, the dose of PTX in the PTX-A NPs group and the PTX-A NPs + FKA-A NPs group were 5.0 mg·kg−1 and 2.5 mg·kg−1, respectively, and this dose is lower than that commonly used in the clinic and reported in the literature (10.0 mg·kg−1).42 Therefore, to control the tumor growth in mice bearing PTX-resistant lung cancer, we increased the number of treatments to seven injections, which is consistent with the number of injections in the previous report.43 P-gp expression in tumor tissue was investigated by immunohistochemistry. As shown in Figure 9E, P-gp expression was high in the control group but low in the FKA group, indicating the suppression of P-gp by FKA in vivo. PTX-A NPs + FKA-A NPs treatment significantly reduced P-gp expression (p<0.01, vs control, p<0.05, vs PTX or PTX-A NPs) (Figure 9F). These results suggested that PTX-A NPs + FKA-A NPs potently inhibit the growth of PTX-resistant cancer by inhibiting the expression of P-gp.
Chemotherapy resistance is the main limiter of cancer drug treatment effectiveness. Molecular mechanisms that drive chemotherapy resistance are complicated and include insufficient intratumoral drug accumulation, reduced target accessibility, activation of DNA repair pathways and inactivation of apoptosis pathways. The most widely encountered and investigated resistance mechanism is the reduction of intracellular drug concentration by targeted efflux. This is mainly the result of elevated expression of ATP-binding cassette (ABC) transporters, such as P-gp, MRP1 and BCRP. PTX is known to induce P-gp expression in tumor cells, leading to drug resistance. Some inhibitors of drug‑efflux pumps have been reported,44 but no potential modulators are currently licensed for clinical application. One obvious challenge arises from their toxicity in normal tissue due to the wide distribution of P-gp and its role in protecting normal cells and tissue. In our previous study, FKA was found to inhibit the protein expression of P-gp in PTX-resistant A549 cells. Hence, further exploration of a delivery system to reduce the exposure of FKA and PTX to normal tissue was necessary.
The real-time imaging of DiR-loaded NPs in tumor-bearing mice was conducted for 24 h. According to Figure S7, the fluorescence signal of DiR solutions gradually accumulated in the liver, illustrating that DiR solutions are largely metabolized by the liver.22 For the DiR solution-treated groups, there was little fluorescence signal at the tumor site at any time point. However, the fluorescence signal of DiR-loaded NPs at the tumor site was obvious at 4 h, and the signal in the tumor maintained high intensity up to 24 h greater than that of DiR solutions. As shown in Figure S8, the accumulation of nanoparticles in tumor tissue was time-dependent, which was consistent with the result of Figure S7. Twenty-four hours after injection, DiR-loaded NPs had little aggregation in the heart and kidney. However, DiR-loaded NPs still accumulated to some extent in organs of liver, spleen and lung. That is because DiR-loaded NPs could be taken up by macrophages of reticuloendothelial system (RES), which are mainly concentrated in the above organs.45,46 Altogether, these results demonstrated that our nanoparticles passively targeted the tumor site.
Conclusion
In this study, the NMPA-approved stabilizer Aes was chosen to prepare polymer-free nanoparticles with a facile route without any synthesis or sophisticated processes. The twin-like PTX-A NPs and FKA-A NPs prepared by simple nanoprecipitation possessed similar particle size, size distribution, zeta potential, and ultrahigh drug loadings of up to 50%. Their self-assembled mechanisms were validated through X-ray diffraction, UV absorption, and MD simulations. With the aid of Aes, these two drugs accumulated in tumor tissue via passive targeting were efficiently taken up by A549/T cells, and reduced P-gp expression. These advantages resulted in synergistic inhibition of PTX-resistant tumor growth. This SMND platform provides an efficient method for combination chemotherapy. In future studies, we will optimize the ratio between PTX-A NPs and FKA-A NPs for better synergistic actions and clinical translation.
Disclosure
The authors declare that they have no conflicts of interest for this work.
References
1. Li J, Wang F, Sun D, Wang R. A review of the ligands and related targeting strategies for active targeting of paclitaxel to tumours. J Drug Target. 2016;24(7):590–602. doi:10.3109/1061186X.2016.1154561
2. Podolski-Renić A, Banković J, Dinić J, et al. DTA0100, dual topoisomerase II and microtubule inhibitor, evades paclitaxel resistance in P-glycoprotein overexpressing cancer cells. Eur J Pharm Sci. 2017;105:159–168. doi:10.1016/j.ejps.2017.05.011
3. Liu W, Lo YL, Hsu C, et al. CS-PEI/Beclin-siRNA downregulate multidrug resistance proteins and increase paclitaxel therapeutic efficacy against NSCLC. Mol Ther Nucleic Acids. 2019;17:477–490. doi:10.1016/j.omtn.2019.06.017
4. Jandial DD, Krill LS, Chen L, et al. Induction of G2M arrest by flavokawain A, a kava chalcone, increases the responsiveness of HER2-overexpressing breast cancer cells to herceptin. Molecules. 2017;22(3):
5. Zhang Y, Zvi YS, Batko B, et al. Down-regulation of Skp2 expression inhibits invasion and lung metastasis in osteosarcoma. Sci Rep. 2018;8(1):14294–14306. doi:10.1038/s41598-018-32428-9
6. Li J, Zheng L, Yan M, et al. Activity and mechanism of flavokawain A in inhibiting P-glycoprotein expression in paclitaxel resistance of lung cancer. Oncol Lett. 2020;19(1):379–387. doi:10.3892/ol.2019.11069
7. Yao Y, Wang T, Liu Y, Zhang N. Co-delivery of sorafenib and VEGF-siRNA via pH-sensitive liposomes for the synergistic treatment of hepatocellular carcinoma. Artif Cells Nanomed Biotechnol. 2019;47(1):1374–1383. doi:10.1080/21691401.2019.1596943
8. Zhang X, Liu Y, Kim YJ, Mac J, Zhuang R, Wang P. Co-delivery of carboplatin and paclitaxel via cross-linked multilamellar liposomes for ovarian cancer treatment. RSC Adv. 2017;7(32):19685–19693. doi:10.1039/c7ra01100h
9. Yang C, Pang X, Chen W, et al. Environmentally responsive dual-targeting nanotheranostics for overcoming cancer multidrug resistance. Sci Bull (Beijing). 2019;64:705–714. doi:doi.10.1016/j.scib.2019.04.019
10. Zhao C, Shao L, Lu J, Deng X, Tong Y, Wu Y. Hybrid prodrug nanoparticles with tumor penetration and programmed drug activation for enhanced chemoresistant cancer therapy. ACS Appl Mater Interfaces. 2017;9(22):18450–18461. doi:10.1021/acsami.7b01908
11. Lan Y, Sun Y, Yang T, et al. Co-delivery of paclitaxel by a capsaicin prodrug micelle facilitating for combination therapy on breast cancer. Mol Pharm. 2019;16(8):3430–3440. doi:10.1021/acs.molpharmaceut.9b00209
12. Meng H, Wang M, Liu H, et al. Use of a lipid-coated mesoporous silica nanoparticle platform for synergistic gemcitabine and paclitaxel delivery to human pancreatic cancer in mice. ACS Nano. 2015;9(4):3540–3557. doi:10.1021/acsnano.5b00510
13. Zhao MD, Li JQ, Chen FY, et al. Co-delivery of curcumin and paclitaxel by “Core-Shell” targeting amphiphilic copolymer to reverse resistance in the treatment of ovarian cancer. Int J Nanomedicine. 2019;14:9453–9467. doi:10.2147/IJN.S224579
14. Zhang W, Shen J, Su H, et al. Co-delivery of cisplatin prodrug and chlorin e6 by mesoporous silica nanoparticles for chemo-photodynamic combination therapy to combat drug resistance. ACS Appl Mater Interfaces. 2016;8(21):13332–13340. doi:10.1021/acsami.6b03881
15. Fan L, Jin B, Zhang S, Song C, Li Q. Stimuli-free programmable drug release for combination chemo-therapy. Nanoscale. 2016;8(25):12553–12559. doi:10.1039/c5nr06305a
16. Castillo RR, Colilla M, Vallet-Regi M. Advances in mesoporous silica-based nanocarriers for co-delivery and combination therapy against cancer. Expert Opin Drug Deliv. 2017;14(2):229–243. doi:10.1080/17425247.2016.1211637
17. Sheu M-T, Jhan H-J, Su C-Y, et al. Codelivery of doxorubicin-containing thermosensitive hydrogels incorporated with docetaxel-loaded mixed micelles enhances local cancer therapy. Colloids Surf B Biointerfaces. 2016;143:260–270. doi:10.1016/j.colsurfb.2016.03.054
18. Ganguly K, Chaturvedi K, More UA, Nadagouda MN, Aminabhavi TM. Polysaccharide-based micro/nanohydrogels for delivering macromolecular therapeutics. J Control Release. 2014;193:162–173. doi:10.1016/j.jconrel.2014.05.014
19. Liao L, Liu J, Dreaden EC, et al. A convergent synthetic platform for single-nanoparticle combination cancer therapy: ratiometric loading and controlled release of cisplatin, doxorubicin, and camptothecin. J Am Chem Soc. 2014;136(16):5896–5899. doi:10.1021/ja502011g
20. Zhang B, Wang T, Yang S, et al. Development and evaluation of oxaliplatin and irinotecan co-loaded liposomes for enhanced colorectal cancer therapy. J Control Release. 2016;238:10–21. doi:10.1016/j.jconrel.2016.07.022
21. Han L, Wang T, Wu J, Yin X, Fang H, Zhang N. A facile route to form self-carried redox-responsive vorinostat nanodrug for effective solid tumor therapy. Int J Nanomedicine. 2016;11:6003–6022. doi:10.2147/IJN.S118727
22. Han L, Wang T, Mu S, et al. Unified D-α-Tocopherol 5-Fu/SAHA bioconjugates self-assemble as complex nanodrug for optimized combination therapy. Nanomedicine. 2018;13(11):1285–1301. doi:10.2217/nnm-2017-0316
23. Wang T, Zhang J, Hou T, Yin X, Zhang N. Selective targeting of tumor cells and tumor associated macrophages separately by twin-like core–shell nanoparticles for enhanced tumor-localized chemoimmunotherapy. Nanoscale. 2019;11(29):13934–13946. doi:10.1039/c9nr03374b
24. Zhang Z, Cao G, Sha L, Wang D, Liu M. The efficacy of sodium aescinate on cutaneous wound healing in diabetic rats. Inflammation. 2015;38(5):1942–1948. doi:10.1007/s10753-015-0174-5
25. Wang Z, Chen Q, Li B, et al. Escin-induced DNA damage promotes Escin-induced apoptosis in human colorectal cancer cells via p62 regulation of the ATM/gammaH2AX pathway. Acta Pharmacol Sin. 2018;39(10):1645–1660. doi:10.1038/aps.2017.192
26. Hou H, Li WX, Cui X, Zhou DC, Zhang B, Geng XP. CARMA3/NF-κB signaling contributes to tumorigenesis of hepatocellular carcinoma and is inhibited by sodium aescinate. World J Gastroenterol. 2019;25(36):5483–5493. doi:10.3748/wjg.v25.i36.5483
27. Cheng CL, Chao WT, Li YH, et al. Escin induces apoptosis in human bladder cancer cells: an in vitro and in vivo study. Eur J Pharmacol. 2018;840:79–88. doi:10.1016/j.ejphar.2018.09.033
28. Berendsen HJC, Van Der Spoel D, Van Drunen R. GROMACS: a message-passing parallel molecular dynamics implementation. Comput Phys Commun. 1995;91(1–3):43–56. doi:10.1016/0010-4655(95)00042-e
29. Lindahl E, Hess B, Van Der Spoel D. GROMACS 3.0: a package for molecular simulation and trajectory analysis. J Mol Model. 2001;7(8):306–317. doi:10.1007/s008940100045
30. Van Der Spoel D, Lindahl E, Hess B, Groenhof G, Mark AE, Berendsen HJC. GROMACS: fast, flexible, and free. J Comput Chem. 2005;26(16):1701–1718. doi:10.1002/jcc.20291
31. Hess B, Kutzner C, Van Der Spoel D, Lindahl E. GROMACS 4: algorithms for highly efficient, load-balanced, and scalable molecular simulation. J Chem Theory Comput. 2008;4(3):435–447. doi:10.1021/ct700301q
32. Pronk S, Páll S, Schulz R, et al. GROMACS 4.5: a high-throughput and highly parallel open source molecular simulation toolkit. Bioinformatics. 2013;29(7):845–854. doi:10.1093/bioinformatics/btt055
33. Páll S, Abraham M, Kutzner C, et al. Tackling exascale software challenges in molecular dynamics simulations with gromacs.
34. Wang J, Wolf RM, Caldwell JW, Kollman PA, Case DA. Development and testing of a general amber force field. J Comput Chem. 2004;25(9):1157–1174. doi:10.1002/jcc.20035
35. Bayly CI, Cieplak P, Cornell W, Kollman PA. A well-behaved electrostatic potential based method using charge restraints for deriving atomic charges: the RESP model. J Phys Chem. 1993;97(40):10269–10280. doi:10.1021/j100142a004
36. Lu T, Chen F. Multiwfn: a multifunctional wavefunction analyzer. J Comput Chem. 2012;33(5):580–592. doi:10.1002/jcc.22885
37. Adamo C, Barone V. Toward reliable density functional methods without adjustable parameters: the PBE0 model. J Chem Phys. 1999;110(13):6158–6170. doi:10.1063/1.478522
38. Marenich AV, Cramer CJ, Truhlar DG. Universal solvation model based on solute electron density and on a continuum model of the solvent defined by the bulk dielectric constant and atomic surface tensions. J Phys Chem B. 2009;113(18):6378–6396. doi:10.1021/jp810292n
39. Humphrey W, Dalke A, Schulten K. VMD: visual molecular dynamics. J Mol Graph. 1996;14(1):33–38. doi:10.1016/0263-7855(96)00018-5
40. Hu S, Lee E, Wang C, et al. Amphiphilic drugs as surfactants to fabricate excipient-free stable nanodispersions of hydrophobic drugs for cancer chemotherapy. J Control Release. 2015;220(Pt A):175–179. doi:10.1016/j.jconrel.2015.10.031
41. Yin X, Han L, Mu S, et al. Preparation and evaluation of etoposide-loaded lipid-based nanosuspensions for high-dose treatment of lymphoma. Nanomedicine. 2019;14(11):1403–1427. doi:10.2217/nnm-2018-0502
42. Zhang H, Hu H, Zhang H, et al. Effects of PEGylated paclitaxel nanocrystals on breast cancer and its lung metastasis. Nanoscale. 2015;7(24):10790–10800. doi:10.1039/c4nr07450e
43. Li Z, Tian G, Jiang H, et al. Liver-targeting and ph-sensitive sulfated hyaluronic acid mixed micelles for hepatoma therapy. Int J Nanomedicine. 2019;14:9437–9452. doi:10.2147/IJN.S214528
44. Waghray D, Zhang Q. Inhibit or evade multidrug resistance P-glycoprotein in cancer treatment. J Med Chem. 2018;61(12):5108–5121. doi:10.1021/acs.jmedchem.7b01457
45. Li Y, Lin J, Liu G, et al. Dual-acting, function-responsive, and high drug payload nanospheres for combining simplicity and efficacy in both self-targeted multi-drug co-delivery and synergistic anticancer effect. Int J Pharm. 2016;512(1):194–203. doi:10.1016/j.ijpharm.2016.08.035
46. Lu J, Zhao W, Liu H, et al. An improved D-α-tocopherol-based nanocarrier for targeted delivery of doxorubicin with reversal of multidrug resistance. J Control Release. 2014;196:272–286. doi:10.1016/j.jconrel.2014.10.016
 © 2020 The Author(s). This work is published and licensed by Dove Medical Press Limited. The full terms of this license are available at https://www.dovepress.com/terms.php and incorporate the Creative Commons Attribution - Non Commercial (unported, v3.0) License.
By accessing the work you hereby accept the Terms. Non-commercial uses of the work are permitted without any further permission from Dove Medical Press Limited, provided the work is properly attributed. For permission for commercial use of this work, please see paragraphs 4.2 and 5 of our Terms.
© 2020 The Author(s). This work is published and licensed by Dove Medical Press Limited. The full terms of this license are available at https://www.dovepress.com/terms.php and incorporate the Creative Commons Attribution - Non Commercial (unported, v3.0) License.
By accessing the work you hereby accept the Terms. Non-commercial uses of the work are permitted without any further permission from Dove Medical Press Limited, provided the work is properly attributed. For permission for commercial use of this work, please see paragraphs 4.2 and 5 of our Terms.