")
Back to Journals » Diabetes, Metabolic Syndrome and Obesity » Volume 13
Sustained Stimulation of β2AR Inhibits Insulin Signaling in H9C2 Cardiomyoblast Cells Through the PKA-Dependent Signaling Pathway
Authors Pei J, Xiao Z, Guo Z, Pei Y , Wei S , Wu H , Wang D
Received 26 June 2020
Accepted for publication 5 September 2020
Published 21 October 2020 Volume 2020:13 Pages 3887—3898
DOI https://doi.org/10.2147/DMSO.S268028
Checked for plagiarism Yes
Review by Single anonymous peer review
Peer reviewer comments 4
Editor who approved publication: Dr Konstantinos Tziomalos
Jinli Pei,1,2 Zhengpan Xiao,1,2 Ziyi Guo,1,2 Yechun Pei,1,2 Shuangshuang Wei,1,2 Hao Wu,1,2 Dayong Wang1,2
1Key Laboratory of Ministry of Education for Tropical Bioresources, Hainan University, Haikou, Hainan 570228, People’s Republic of China; 2Laboratory of Biotechnology and Molecular Pharmacology, School of Life and Pharmaceutical Sciences, Hainan University, Haikou, Hainan 570228, People’s Republic of China
Correspondence: Dayong Wang
Laboratory of Biotechnology and Molecular Pharmacology, School of Life and Pharmaceutical Sciences, Hainan University, 58 People’s Road, Haikou, Hainan 570228, People’s Republic of China
Tel +86-187-8955-6728
Email [email protected]
Introduction: This study aimed to investigate the role of β2 adrenergic receptor (β2AR) in insulin signaling transduction in H9C2 cardiomyoblast cells to understand the formation of the β2AR-insulin receptor (IR) protein complex and its role in insulin-induced Glut4 expression.
Methods: H9C2 cells were treated with various protein inhibitors (CGP, β1AR inhibitor CGP20712; ICI, β2AR inhibitor ICI 118,551; PKI, PKA inhibitor myristoylated PKI; PD 0325901, MEK inhibitor; SP600125, JNK inhibitor) with or without insulin or isoproterenol (ISO) before RNA-sequencing (RNA-Seq) and quantitative-PCR (Q-PCR). Yeast two-hybrid, co-immunoprecipitation and His-tag pull-down assay were carried out to investigate the formation of the β2AR-IR protein complex. The intracellular concentrations of cAMP in H9C2 cells were tested by high performance liquid chromatography (HPLC) and the phosphorylation of JNK was tested by Western blot.
Results: Gene Ontology (GO) analysis revealed that the most significantly enriched processes in the domain of molecular function (MF) were catalytic activity and binding, whereas in the domain of biological processes (BP) were metabolic process and cellular process. Furthermore, the enriched processes in the domain of cellular components (CC) were cell and cell parts. The Kyoto encyclopedia of genes and genomes (KEGG) pathway analysis showed that the most significant pathways that have been altered included the PI3K-Akt and MAPK signaling pathways. Q-PCR, which was performed to verify the gene expression levels exhibited consistent results. In evaluating the signaling pathways, the sustained stimulation of β2AR by ISO inhibited insulin signalling, and the effect was primarily through the cAMP-PKA-JNK pathway and MEK/JNK signaling pathway. Yeast two-hybrid, co-immunoprecipitation and His-tag pull-down assay revealed that β2AR, IR, insulin receptor substrate 1 (IRS1), Grb2-associated binding protein 1 (GAB1) and Grb2 existed in the same protein complex.
Conclusion: The sustained stimulation of β2AR might inhibit insulin signaling transduction through the cAMP-PKA-JNK and MEK/JNK pathways in H9C2 cells.
Keywords: RNA sequencing, beta adrenergic receptor, insulin receptor, protein interaction, insulin resistance
Introduction
Type 2 diabetes (T2D), also known as Non-Insulin-Dependent Diabetes Mellitus is characterized by insulin resistance and progressive beta cell deterioration1 which can lead to tissue damage and serious secondary complications such as cardiovascular disease, nephropathy, stroke, peripheral neuropathy and retinopathy.2,3 Over the decades, insulin resistance has been proven to be a primary contributor to the pathogenesis of T2D; thus, studies on the mechanism of insulin action and resistance play an important role in diabetes research.
The phosphatidylinositide 3-kinase (PI3K)/AKT (also known as protein kinase B) signaling pathway plays a critical role in linking the activation of IR to glucose metabolism.4,5 Activation of IR by insulin or insulin-like growth factor 1 (IGF1) leads to auto-phosphorylation of its beta subunits which subsequently phosphorylates insulin receptor substrates (IRS) at tyrosine residues.6 The binding of the PI3K regulatory subunit to the phosphorylated IRS triggers the activation of its catalytic subunit, which catabolizes the formation of the second messenger phosphatidylinositol (3,4,5)-triphosphate (PIP3).7,8 Akt is then recruited to the plasma membrane, the activation of which promotes glucose uptake, glucose metabolism, skeletal muscle growth and insulin-mediated cardiac myotrophy.9 The ERK/MAPK pathway is activated by the binding of adapter protein Grb2 to the phosphorylated IRS or SHC, which is involved in the regulation of the expression of genes related to glucose metabolism and control of mitogenesis and differentiation.10 IR exhibits spatial preference in triggering its downstream signaling pathways; when IR is internalized, it activates ERK/MAPK whilst initiating PI3K/AKT on the plasma membrane.11,12
Insulin stimulation of glucose transport in adipose cells and skeletal and cardiac muscles is essential for the maintenance of glucose homeostasis, which is mediated by the translocation of insulin sensitive glucose transporter (predominantly Glut4) from the intracellular storage to the plasma membrane to increase glucose uptake.13,14 The reduction of Glut4 expression in the muscle or adipose tissue results in insulin resistance and increases the risk of diabetes.15
The regulation of glucose metabolism is coordinated by IR and β2AR, which represents receptor tyrosine kinase (RTK) and G protein-coupled receptor (GPCR) signaling pathways that interact under certain pathophysiological circumstances.16,17 The protein complex consisting of IR and β2AR has been characterized in the heart and the interaction between these two proteins has been demonstrated by bioluminescence resonance energy transfer (BRET) experiment.16,18 Long-term overstimulation of βAR induces a state of insulin resistance leading to heart failure.19,20 In addition, the inhibition of insulin-induced glucose uptake by overstimulation of βAR has been observed in various tissues such as brown adipose tissue,21 and cardiomyocytes.22 According to previous publications, phosphorylation of β2AR under insulin stimulation creates a potent feedback by inhibiting insulin-stimulated phosphorylation of IRS, and this effect relies on the Try364 site of β2AR, because the mutation of which abolishes its inhibitory effects.23 Another research found that up-regulation of G protein-coupled receptor kinase 2 (GRK2) by chronic adrenergic stimulation in cardiomyocytes negatively affected cardiac metabolism through phosphorylation and interaction with IRS1, which resulted in the inhibition of glucose uptake and impaired insulin signaling.24
Next-Generation RNA Sequencing (RNA-Seq) has several advantages, such as low background signal, high technical reproducibility, no requirement of existing genomic sequence and large dynamic range; one important application of which lies in drug research.25 The study on differentially expressed genes and pathways under certain condition reveals potential drug targets. In comparison with microarray, RNA-Seq has several advantages including detection of novel transcripts, identification of genetic variants, differentiating biologically critical isoforms, and quantifying both very low and very high abundance transcripts.26,27 Moreover, RNA-Seq has a broader dynamic range, allowing detection of more differentially expressed genes with high fold-change and providing a good option in the estimation of absolute transcript levels.28
This study profiled the transcriptome under various treatments by RNA-seq and generated a list of differentially expressed genes (DEGs). These DEGs were further analyzed by GO and KEGG pathway analysis to reveal molecular mechanisms underlying the cross-talk between β2AR and IR. Biochemical and cellular biological experiments were conducted following the bioinformatics study.
Materials and Methods
Cell Culture and Treatment
H9C2 cells, which are derived from cardiomyocytes (obtained from the Cell Bank of the Chinese Academy of Sciences) and widely adopted in studies on insulin transduction signaling,29,30 were cultured in Dulbecco’s modified Eagle’s medium containing 10% fetal bovine serum, 25 ng/mL nerve growth factor, and 1 mM glutamine. Cells that reached 90–95% confluence cultured in 6-well plates were serum starved for 2 h before pretreatment with various inhibitors for 30 mins as indicated (CGP, β1AR inhibitor CGP20712; ICI, β2AR inhibitor ICI 118,551; PKI, PKA inhibitor myristoylated PKI; PD 0325901, MEK inhibitor; SP600125, JNK inhibitor). Finally, cells were stimulated with 10 μM ISO for 4 h and 200 nM Insulin for 30 mins.
Library Construction and Sequencing
Total RNAs were extracted separately from the above-mentioned treatments using total RNA extraction reagent (Sangon Biotech, China) following the protocols described by the manufacturer. A total of 3 μg of RNA per sample was used for library preparation with insert sizes of 350 bp and sequenced on Illumina Novaseq 6000, which generated 6 G raw data for each sample. Sequences generated were initially processed by FastQC (http://www.bioinformatics.babraham.ac.uk/projects/fastqc) including sequencing fault rate distribution check, GC content distribution check and sequencing data filtering (removal of original sequence with adaptors and low quality). Clean data obtained after quality control with filtering were mapped to the reference genome (Rattus norvegicus; Assembly Rnor_6.0) using HISAT2.31 The gene expression levels were calculated by FKPM (fragments per kilo bases per million reads) and analyzed by HTSeq software (https://github.com/htseq/htseq). DEGs amongst various treatment groups were identified using a cut-off of false discovery rate (FDR)-adjusted p value less than 0.05 using DESeq2. GO enrichment analysis and KEGG pathway enrichment analysis of the DEGs were performed by clusterProfiler.32
cDNA Synthesis and Q-PCR
cDNA was synthesized by reverse transcription PCR using the PrimeScript™ RT reagent Kit with gDNA Eraser (Takara, China). Q-PCR was carried out on a three-step real-time PCR system (ABI 7500, America) using TB Green® Fast qPCR Mix (Takara, China). Each sample was amplified in three repeats and the relative gene expression data were calculated using the 2−ΔΔCt method (qPCR primers are listed in Table 1). All statistical analyses were performed using IBM SPSS software, and p<0.05 was considered statistically significant.
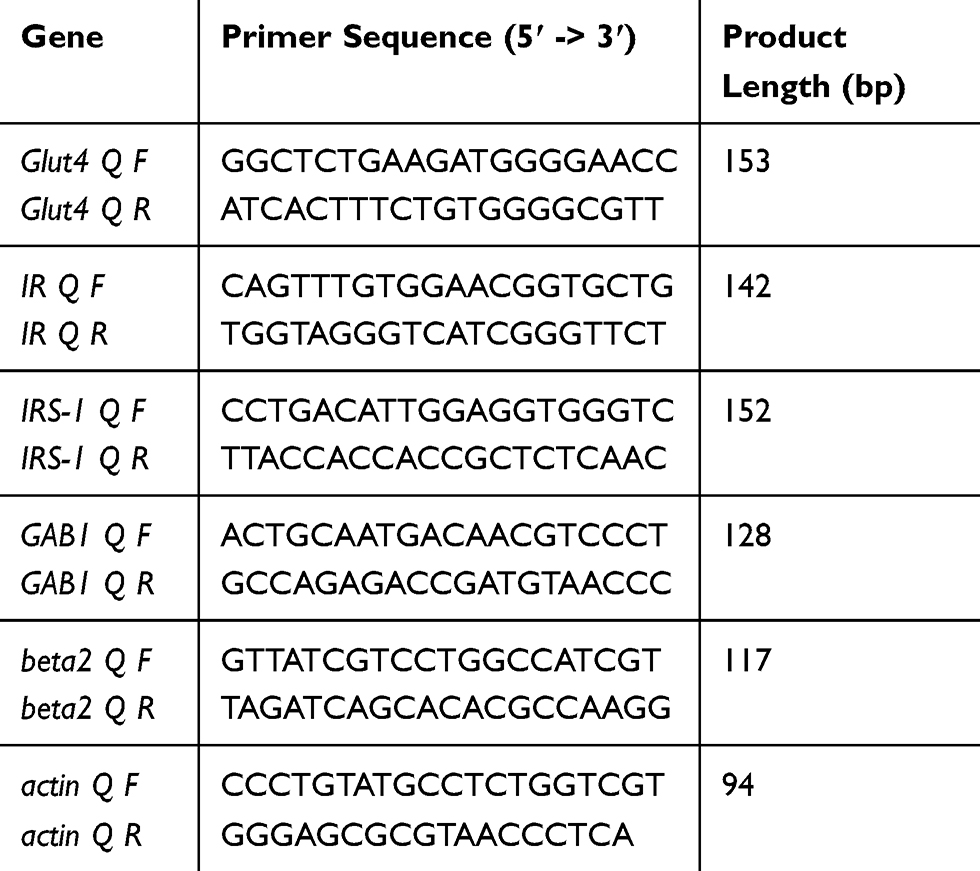 |
Table 1 Q-PCR Primers |
Co-Immunoprecipitation and His Pull-Down
H9C2 cells that reached 90–95% confluence and cultured in T75 flasks were homogenized in lysis buffer. The lysates were clarified by centrifugation and the cleared supernatant was incubated with primary antibodies against IRS1, IR, GAB1 and/or a control IgG. The mixture was rotated at 4°C for 3 h before precipitation with protein A Sepharose beads (GE, America). The bound proteins were resolved for Western blotting. The cleared supernatants were immobilized on Ni-NTA agarose beads (Qiagen, Germany) and rotated at 4°C for 3 h before washed with washing buffer. The bound proteins were collected by eluent for Western Blotting. Proteins were resolved by SDS-PAGE and transferred to nitrocellulose membranes (Millipore) and blocked in blocking buffer for 2 hours before incubation with primary antibodies against β2AR (Santa Cruz Biotechnology, Inc.), IRS1 (Santa Cruz Biotechnology, Inc.), GAB1 (Santa Cruz Biotechnology, Inc.), IR (Abcam), β-actin (Santa Cruz Biotechnology, Inc.), phospho-JNK (phospho-Thr183/Tyr185, Cell Signaling Technology, Inc.) at 4°C overnight. Then the membranes were washed with TBST for three times before incubation with secondary antibodies for detection with the Typhoon FLA 9500 system (GE Healthcare).
Intracellular Cyclic Adenosine Monophosphate (cAMP) Assay by HPLC
HPLC was used to test the intracellular concentration of cAMP. An Inertsil® C18 chromatographic column (4.6 × 150 mm, Ø 5 μm) was used and the mobile phase consisted of 82% organic phase (methanol) and 18% inorganic aqueous phase (water). The flow rate was set at 1.0 mL/min and the wavelength was 254 nm. The determination of cAMP content in the sample was made using standard samples and standard curves.
Yeast Two-Hybrid
Saccharomyces cerevisiae yeast strain Y2H Gold, the yeast two-hybrid plasmids, pGADT7-T and pGBKT7, and all media and protocols for the assay were prepared according to manufacturer’s instructions (Clontech, America). Co-transformants expressing putative interacting proteins and negative and positive controls were selected by deficient plating. The identification of interactions was further analyzed on the SD/-Leu/-Trp/-His/-Ade agar medium containing the chromogenic substrate 5-bromo-4-chloro-3-indolyl-β-D-galactopyranoside (X-α-Gal) and Aureobasidin A (AbA).
Results
Differentially Expressed Genes Amongst Various Treatment Groups
We collected 10 samples under various treatments as indicated which were used for deep RNA-seq and annotation (Table 2). In H9C2 cell line pretreated with ICI, a total of 4243 DEGs were significantly and differentially expressed (2067 upregulated and 2176 downregulated genes) at FDR less than 0.05 (Figure 1A) compared with ISO plus insulin treatment. Functional annotation was performed using GO enrichment analysis to study the biological roles of significant DEGs in the study (Figure 2A). The most significantly enriched processes in the study were catalytic activity and binding in the molecular function, metabolic process and cellular process in the biological processes, cell and cell part in the cellular components. KEGG pathway analysis was conducted to identify the most significant pathways that have been altered in the study (Figure 1B). The top 10 pathways that were significantly enriched included insulin signaling pathway (49 DEGs), FoxO signaling pathway (56 DEGs), PI3K−Akt signaling pathway (98 DEGs) and MAPK signaling pathway (108 DEGs).
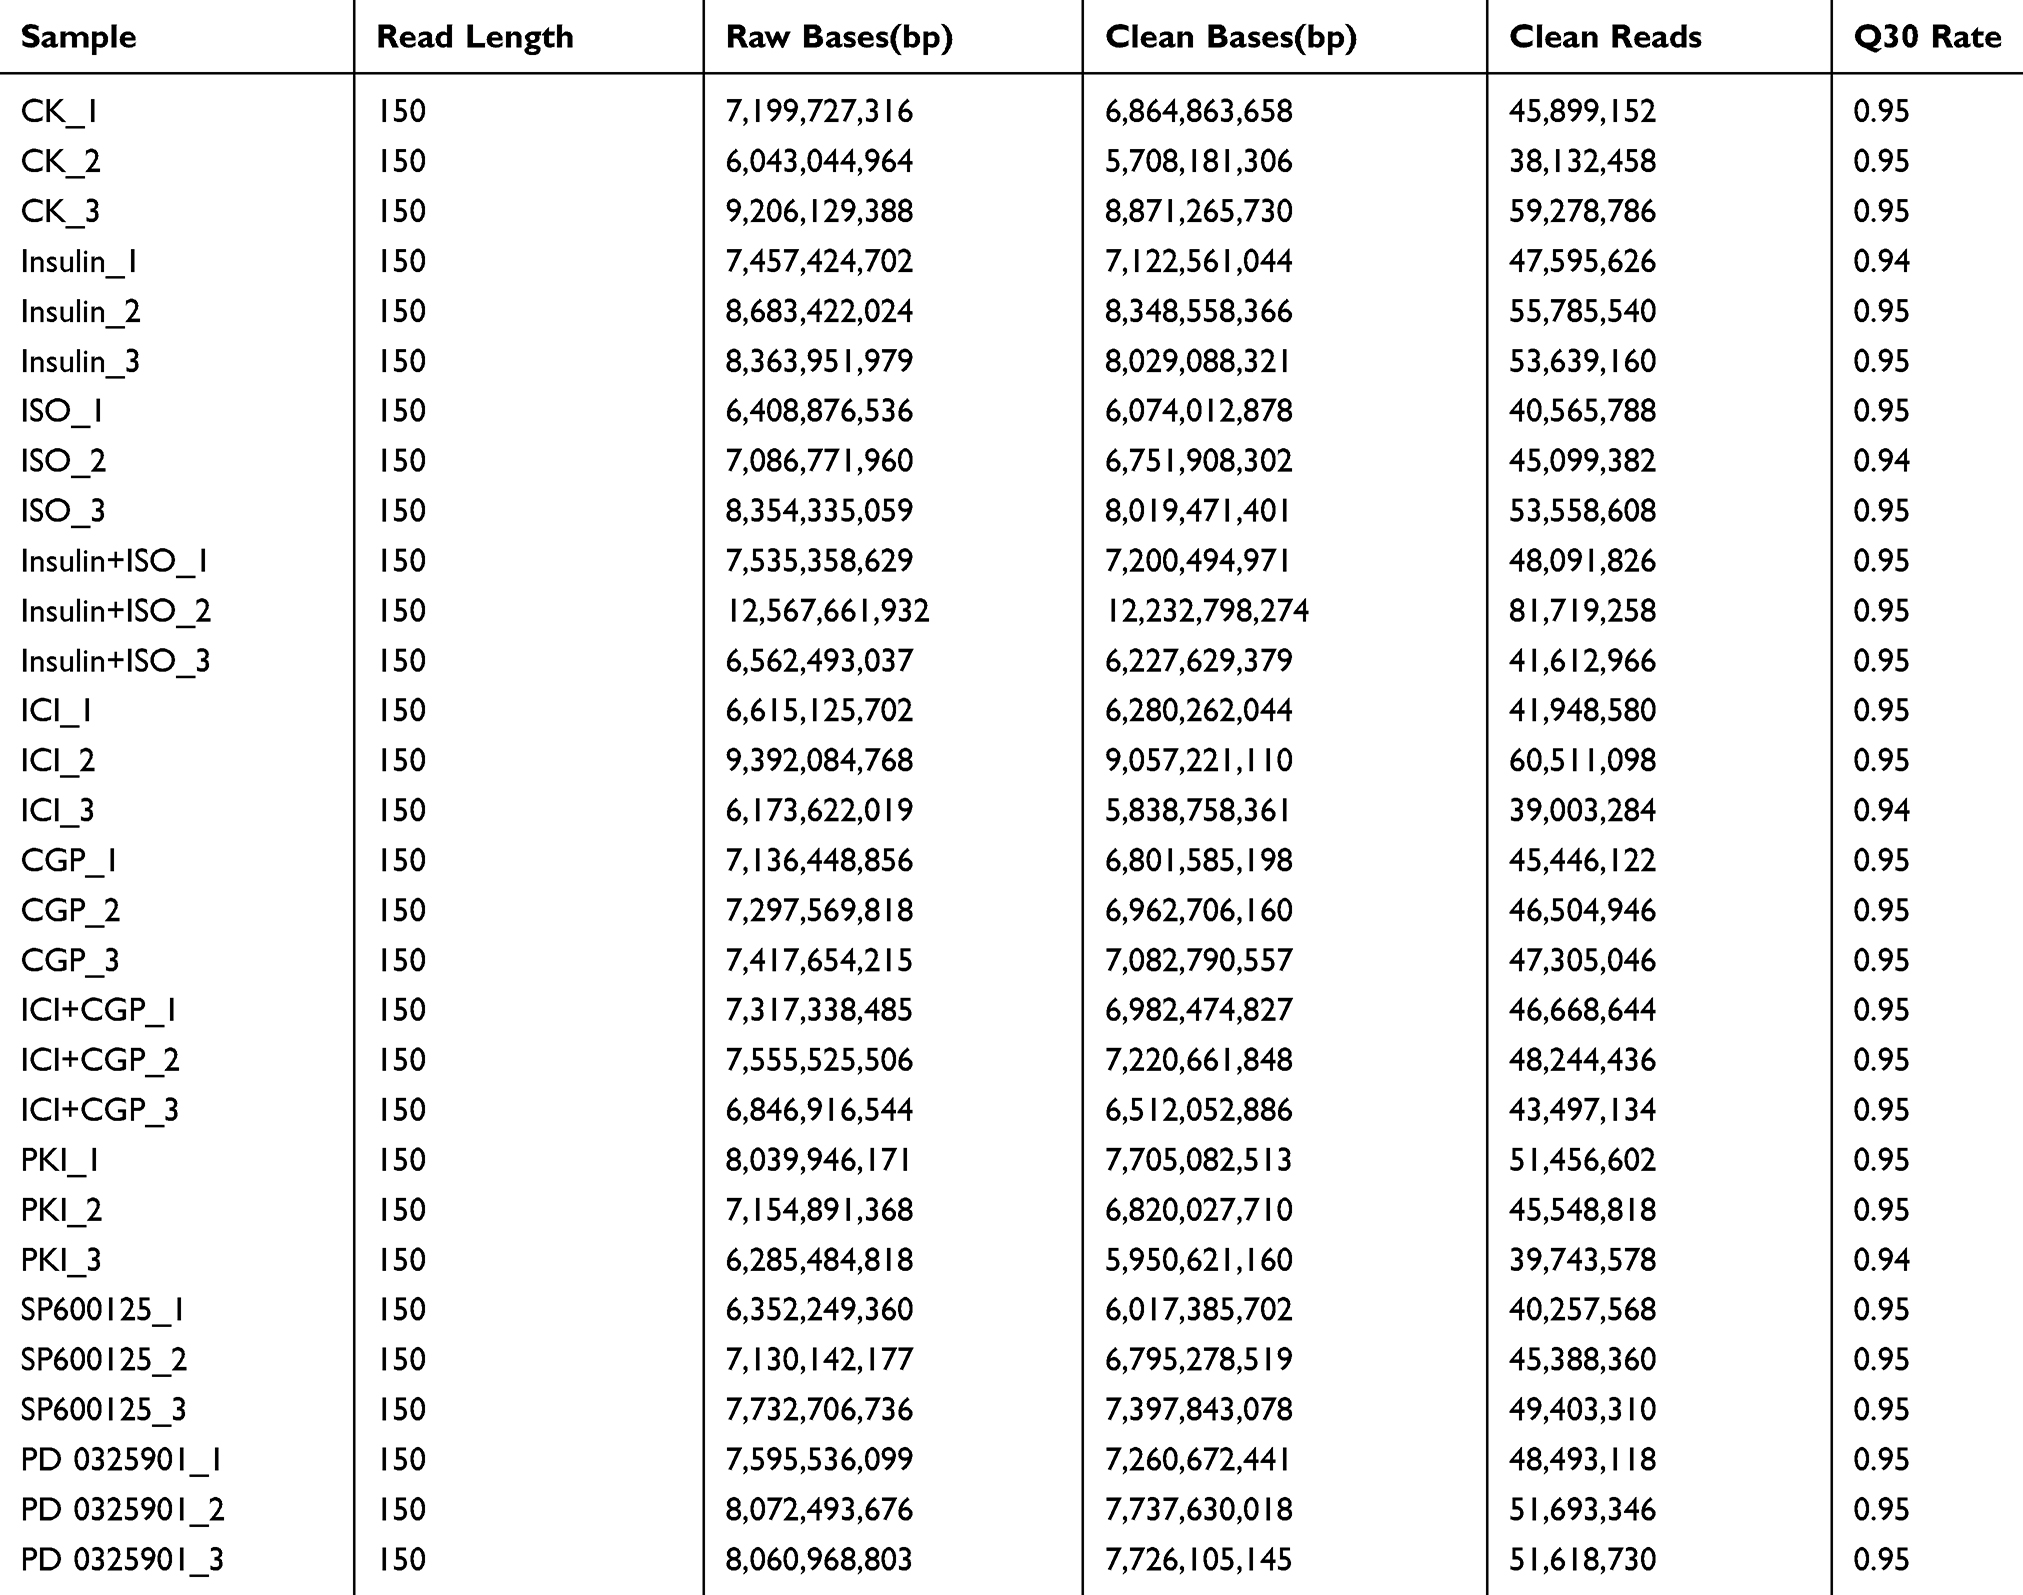 |
Table 2 Clean Data Output Statistics |
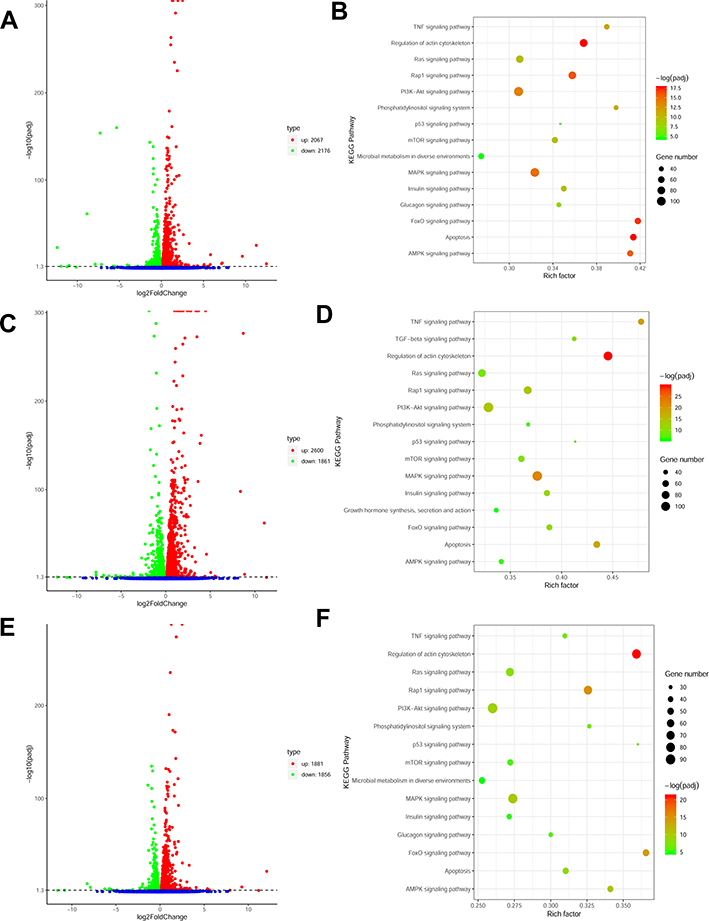 |
Figure 1 (A) Volcano plot of ICI versus Insulin+ISO DEGs; (B) KEGG enrichment plot of ICI versus Insulin+ISO DEGs; (C) Volcano plot of PD0325901 versus Insulin+ISO DEGs; (D) KEGG enrichment plot of PD0325901 versus Insulin+ISO DEGs; (E) Volcano plot of PKI versus Insulin+ISO DEGs; (F) KEGG enrichment plot of PKI versus Insulin+ISO DEGs. |
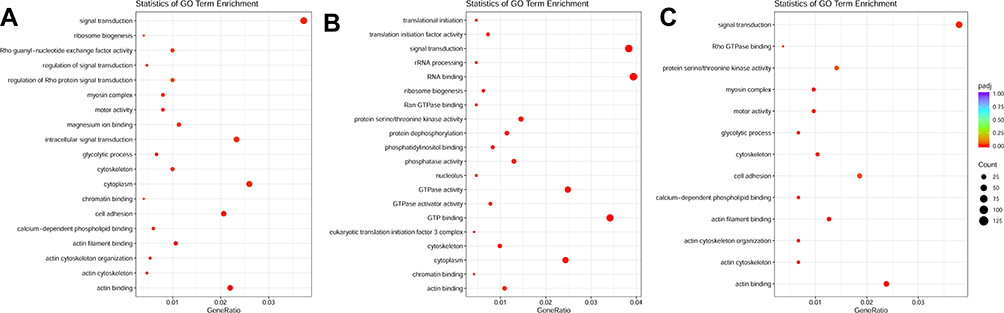 |
Figure 2 (A) GO enrichment plot of ICI versus Insulin+ISO DEGs; (B) GO enrichment plot of PD0325901 versus Insulin+ISO DEGs; (C) GO enrichment plot of PKI versus Insulin+ISO DEGs. |
In H9C2 cell line pretreated with PD, a total of 4461 DEGs were significantly and differentially expressed (2600 upregulated and 1861 downregulated genes) at FDR less than 0.05 compared with ISO plus insulin treatment (Figure 1C). GO enrichment analysis showed that the significantly enriched processes were catalytic activity and binding in the molecular function, metabolic process and cellular process in the biological processes, cell and cell part in the cellular components (Figure 2B). KEGG pathway analysis identified the top 10 significantly enriched pathways including the insulin signaling pathway (54 DEGs), FoxO signaling pathway (52 DEGs), PI3K−Akt signaling pathway (115 DEGs) and MAPK signaling pathway (114 DEGs) (Figure 1D).
In H9C2 cell line pretreated with PKI, a total of 3737 DEGs were observed (1881 upregulated and 1856 downregulated genes) at FDR less than 0.05 (Figure 1E) compared to treatment with ISO plus insulin treatment. GO enrichment analysis showed that the significantly enriched processes were catalytic activity and binding in the molecular function, metabolic process and cellular process in the biological processes, cell and cell part in the cellular components (Figure 2C). KEGG pathway analysis identified the top 10 significantly enriched pathway including the insulin signaling pathway (38 DEGs), FoxO signaling pathway (49 DEGs), PI3K−Akt signaling pathway (91 DEGs) and MAPK signaling pathway (83 DEGs) (Figure 1F). In addition, we analyzed the DEGs in different groups and found that 1645 were co-expressed in three groups, indicating the coordinated roles of β2AR, PKA and MEK (Figure 3).
 |
Figure 3 Venn diagram shows the number of DEGs identified by RNA sequencing in ICI versus Insulin+ISO (orange), PD0325901 versus Insulin+ISO (gray) and PKI versus Insulin+ISO (blue). |
The expression level of glucose transporter 4 (Glut4) was significantly upregulated under insulin treatment whereas the addition of ISO inhibited insulin stimulation of Glut4. Pretreatment of ICI and ICI+CGP could alleviate the inhibitory effect of ISO, indicating ISO functions through the β2AR receptor. Pretreatment with SP600125, myristoylated PKI 14–22 amide and PD 0325901 all alleviates the inhibitory impact of ISO, of which myristoylated PKI 14–22 amide showed the most evident effect indicating that ISO functions through the PKA and MEK/ERK signaling pathway might also be involved (Figure 4A). Q-PCR was performed to verify the expression levels of key genes which showed consistent results with RNA-seq (Figure 4B and Supplementary Figure 2).
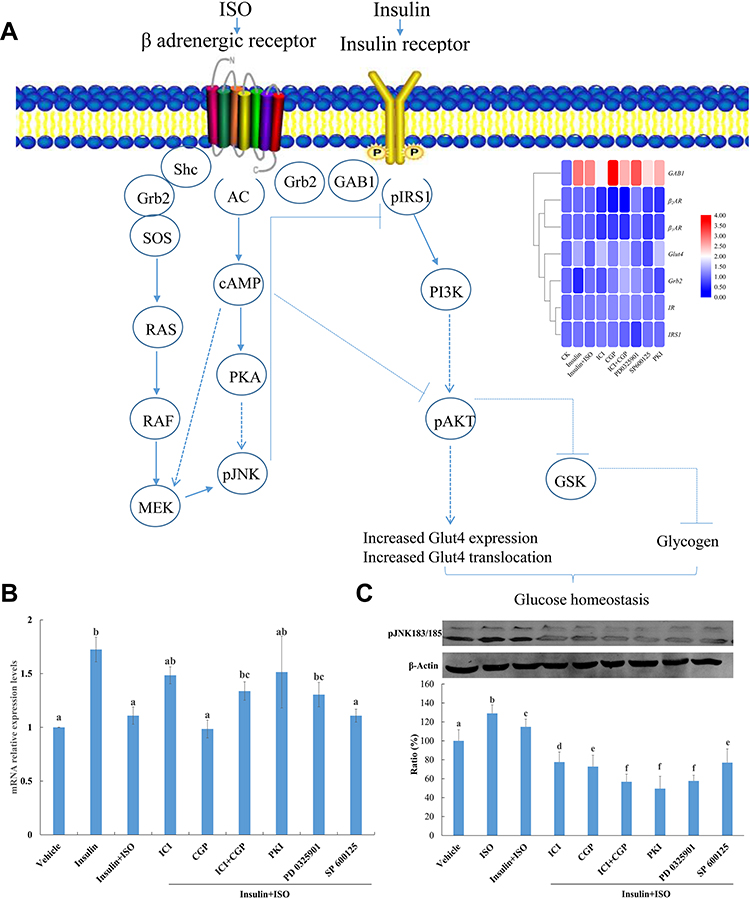 |
Figure 4 (A) β2AR and IR protein complex and schematic diagram of its role in insulin signalling pathway; (B) Gene expression levels of Glut4 under various treatment. Vehicle, Control; Insulin, 200 nM insulin treatment for 30 mins; Insulin+ISO, pretreatment with 10 μM ISO for 4 h before 200 nM insulin treatment for 30 mins; ICI, CGP, ICI+CGP, PKI, PD 0325901, SP600125 pretreatment for 30 mins and then stimulated with 10 μM ISO for 4 h before 200 nM insulin treatment for 30 mins; β-actin was used as an internal control and gene expression profiles were evaluated using the 2−∆∆C method. Three biological replicates for each sample were performed and bars represented the standard deviations. Different letters on top of the bars indicate statistically significant differences (ANOVA, Duncan post hoc test, p<0.05) between various treatments. (C) Phosphorylation of JNK in H9C2 cells under various inhibitor treatment. Vehicle, Control; Insulin, 200 nM insulin treatment for 30 mins; Insulin+ISO, pretreatment with 10 μM ISO for 4 h before 200 nM insulin treatment for 30 mins; ICI, CGP, ICI+CGP, PKI, PD 0325901, SP600125 pretreatment for 30 mins and then stimulated with 10 μM ISO for 4 h before 200 nM insulin treatment for 30 mins. Different letters on top of the bars indicate statistically significant differences (ANOVA, Duncan post hoc test, p<0.05) between various treatments. |
Protein Interaction Tested by Yeast Two-Hybrid
Self-activating analysis indicated that pGBKT7-β2AR and pGBKT7-GAB1 vectors did not have self-activating activity (Figure 5A). β2AR interacted with IRS1, however, the PH domain or PTB domain of IRS1 alone did not show interaction with β2AR (Figure 5B). β2AR showed interaction with GAB1, and various β2AR deletion revealed that the β2AR 230–310 AA sequence had an essential role in the interaction between β2AR and GAB1 (Figure 5C).
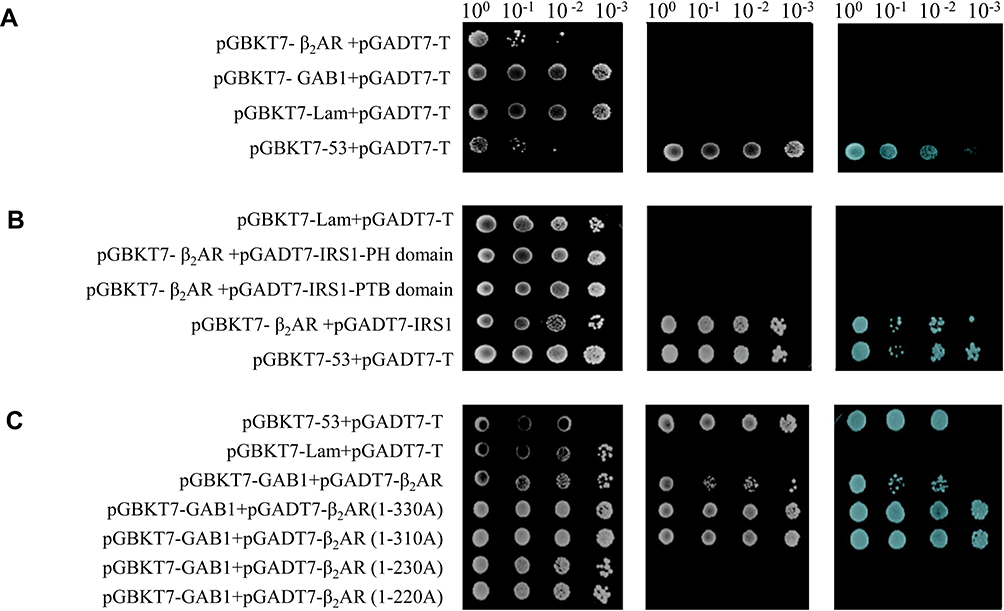 |
Figure 5 Self-activation verification and protein interaction tested by Y2H. (A) Self-activation verification of pGBKT7-β2AR and pGBKT7-GAB1; (B) Protein interaction between β2AR and IRS1 verified by Y2H; (C) Protein interaction between β2AR and GAB1 verified by Y2H. |
Protein Interaction Tested by Co-Immunoprecipitation
Protein interaction was further confirmed using co-immunoprecipitation. The eluted samples were resolved for Western Blotting which showed that β2AR was detected in the eluted samples using primary antibodies against IRS1, IR and GAB1 for co-immunoprecipitation but not in the eluted sample using control IgG indicating that β2AR interacted with IRS1, IR and GAB1, respectively (Figure 6A).
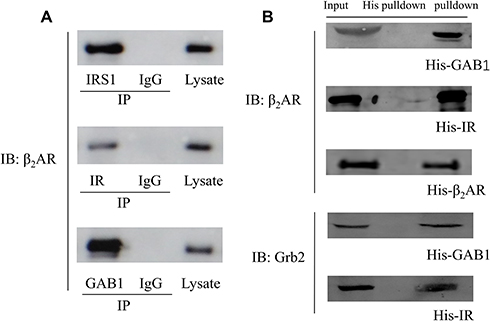 |
Figure 6 (A) CO-IP results. Cell lysate were subjected to immunoprecipitation with the antibody against IRS1, IR, GAB1 or a control IgG. Bound proteins were detected by Western blotting; (B) His pull-down assay results detected by Western Blotting. |
Protein Interaction Tested by His Pull-Down
H9C2 cells expressing His-GAB1, His-IR and His-β2AR were used for His pull-down assay. The eluted samples were collected and resolved by Western blotting. β2AR was detected in the eluate of His-GAB1, His–IR and His-β2AR pulldown whereas Grb2 was detected in the eluate of His-GAB1 and His–IR pulldown (Figure 6B), indicating that β2AR, IR, GAB1 and Grb2 could form a protein complex.
Analysis of cAMP Concentration by HPLC
Chromatographic grade cAMP (Sigma-Aldrich) was gradient diluted in 0.1 M HCl and the peak area Y corresponding to each standard working solution and its mass concentration X were subjected to linear regression analysis. The regression equation was Y=21619X+21886, R=0.9997, showing a good linear relationship in the range of 0.39–100 μg/mL (Supplementary Figure 1A). Treatment with ISO increased the intracellular level of cAMP and treatment with insulin decreased the intracellular level of cAMP. Pretreatment with ISO before the treatment with insulin reversed the effects on cAMP. Pretreatment with CGP, β1AR inhibitor CGP20712 and ICI, β2AR inhibitor ICI 118,551 all blocked the effects of ISO stimulation on the intracellular levels of cAMP (Supplementary Figure 1B).
Impacts of Various Treatments on the Phosphorylation Levels of JNK
ISO-treated cells could increase pJNK level by activating the MAPK/ERK signaling pathway (results are shown in Figure 4C). Pretreatment with CGP and ICI could reduce ISO-stimulated pJNK enhancement, indicating that G protein-coupling (βAR) activation of the MAPK/ERK signaling pathway increased JNK phosphorylation.
Furthermore, pretreatment with SP600125, myristoylated PKI 14–22 amide and PD 0325901 all blocked the ISO stimulation of the JNK phosphorylation level (Figure 4C). Increased JNK phosphorylation could negatively regulate insulin signaling pathway transmission, indicating that ISO inhibited the insulin signaling pathway through the MEK/JNK and PKA signaling pathway.
Discussion
Type II diabetes accounts for 85–90% of the number of diabetic patients and is characterized by reduced insulin sensitivity and insulin resistance. Glucose metabolism is coordinately regulated by IR and β2AR and protein interactions, representing a fine control of the cross-talk between the GPCR and RTK signaling pathways. In this study, a protein complex including IR, IRS1, β2AR, GAB1 and Grb2 has been revealed by several experiments including yeast two-hybrid, co-immunoprecipitation and His-tag pull-down assay. In consistent with the result, a protein complex consisting of IR and β2AR in the mouse heart16 has been described and the interaction between IR and β2AR has been demonstrated by BRET assay.33
Studies have shown that βAR inhibits insulin-stimulated glucose uptake and insulin-induced IRS1 tyrosine self-phosphorylation under long-term stimulation, and promotes threonine/serine phosphorylation of IRS1, thereby hindering the insulin signaling pathway.22,34 However, experiments in heart tissue have shown that continuous stimulation of β2AR inhibits insulin-stimulated glucose uptake functions through the cAMP and PKA signaling pathways.19 The results of this experiment indicate that continuous stimulation of ISO for 4 h inhibits insulin-induced Glut4 gene expression. The detection of endogenous cAMP by HPLC after various inhibitor treatments showed that ISO activates the cAMP-PKA signaling pathway and pretreatment with PKA specific inhibitor PKI can effectively alleviate the inhibition of insulin signaling by ISO, indicating that the negative regulation of ISO on insulin signaling pathway is mediated by the cAMP-PKA signaling pathway, which is consistent with previous publications. The MAPK/ERK signaling pathway is also involved. The possible underlying mechanism is shown in Figure 4A. Under the action of ISO, β2AR undergoes a conformational change, which activates AC, thereby increasing cAMP synthesis. Increased cAMP synthesis can activate the MAPK signaling pathways. The specific mechanism may involve membrane translocation of PDK1 and prevent the binding of PDK1 and AKT or reduce the activity of PI3K.35 Moreover, activated PKA can cause serine phosphorylation of Rap1 protein, leading to the increase in the activity of certain phosphatase enzymes, which increases the tendency of AKT dephosphorylation, resulting in the blockage of the insulin signaling pathway.36,37
Previous publications have demonstrated that JNK plays an important role in the metabolism and development of progressive beta cell deterioration and insulin resistance caused by obesity. Activated JNK can phosphorylate IRS1 serine residues and affect their tyrosine phosphorylation levels, thereby inhibiting the IRS1-PI3K pathway.38–41 This study showed that ISO stimulated JNK phosphorylation whereas the treatments with various inhibitors demonstrated that with the pretreatment with CGP20712 and ICI118551, the stimulation of phosphorylation was significantly reduced. In addition, pretreatment with PKI, PD0325901, and SP600125 can significantly reduce the effect of ISO stimulation on JNK phosphorylation, indicating that ISO stimulates JNK phosphorylation through the MEK and PKA signaling pathways. The mechanism may be due to the increased phosphorylation of IRS1 serine residues caused by JNK, thereby reducing its tyrosine phosphorylation to inhibit the IRS1-PI3K pathway.
Various adaptor proteins play key roles in regulating diverse signaling pathways. Grb2, one of the adaptor proteins widely expressed, plays critical roles in cellular signal transduction by connecting activated receptors on the cell membrane to the downstream effectors. Previously, Grb2 was believed to be an active regulator of RTK signaling; however, a negative role of Grb2 through its interaction with fibroblast growth factor (FGF) receptor to relay the basal signaling from the activated receptors to different proteins has been reported.42,43 Upon insulin stimulation, Grb2 forms a protein complex with tyrosine-phosphorylated IRS1 and SH2 domain-containing oncogenic protein Shc, and these multiple protein interactions may play a crucial role in controlling the downstream effector molecules.44,45 Moreover, the members of the Grb7 family of adapters (Grb10 and Grb14) function as negative modulators of insulin signaling by binding with activated IR.46–48 Overexpression of Grb10 or Grb14 in cultured cell line inhibited phosphorylation of IRS1,49,50 whereas the knockout of Grb14 improves insulin signaling in the liver and skeletal muscle with no significant changes in cardiac function,51 supporting Grb14 inhibition as an effective therapeutic target. Various Grb2 inhibitors have been proven effective in treating human cancer by targeting Grb2 signaling either through blocking its connection with cell surface kinases or compromising its interlink to downstream pathways.52–54 Collectively, selective inhibitors of these proteins may serve as potential therapeutic candidates in treating diabetes and related pathological conditions.
RNA-Seq, superior to microarray with regard to detecting novel transcripts, identifying genetic variants and differentiating biologically critical isoforms, has been applied in pathophysiological studies of various diseases, such as T2D.55–58 A recent publication on RNA-Seq analysis in peripheral blood mononuclear cells of T2D patients and healthy controls identified 420 molecular signatures associated with T2D-related comorbidities and symptoms. These signatures were primarily enriched in pathogenic cell type-specific regulatory elements in relation to inflammatory and immunity, fetal development and expression quantitative trait loci.59 However, single-cell RNA sequencing (scRNA-Seq), a powerful tool to measure RNA expression characteristics at the single cell level, proceeds traditional RNA-Seq with regard to accuracy and efficiency. The application of scRNA-Seq in islets has identified markers and pathways in association with β-cell dedifferentiation and dysfunction, indicating that targeting dedifferentiated β-cells for diabetes remission may be a promising therapeutic strategy.60
In this study, the experimental results applied so far were limited to H9C2 cells, whereas in other cell lines or tissues, similar results are expected to be further verified. The detailed role of IR-β2AR protein complex can be analyzed through gene knockout studies and the effects of the activation of related molecules may be investigated to further understand the effect of sustained stimulation of β2AR on insulin resistance.
Conclusion
This study combined yeast two-hybrid, co-immunoprecipitation, and His pull-down experiments to show that β2AR, Grb2, GAB1, IRS1, and IR could form protein complexes. RNA sequencing and Q-PCR verification showed that insulin stimulated the up-regulation of Glut4 gene expression whereas the pretreatment of ISO could inhibit the insulin-induced up-regulation of Glut4 gene expression. Pretreatment with various protein inhibitors showed that ISO inhibited insulin-induced up-regulation of Glut4 gene expression through the β2AR and cAMP-PKA-JNK signaling pathway. Moreover, the MAPK/ERK signaling pathway was also involved.
Ethics Statement
This study is in compliance with the provisions of the National Ministry of Science and Technology and the University Ethics Committee.
Funding
This work was supported by grants from the National Natural Science Foundation of China (31460226 and 31760246) and Natural Science Foundation of Hainan Province (314058) to Dayong Wang.
Disclosure
None of the authors has conflict of interest related to this article.
References
1. Zaccardi F, Webb DR, Yates T, Davies MJ. Pathophysiology of type 1 and type 2 diabetes mellitus: a 90-year perspective. Postgrad Med J. 2016;92(1084):63–69. doi:10.1136/postgradmedj-2015-133281
2. Harding JL, Pavkov ME, Magliano DJ, Shaw JE, Gregg EW. Global trends in diabetes complications: a review of current evidence. Diabetologia. 2018.
3. Wu CS, Hsu LY, Wang SH. Association of depression and diabetes complications and mortality: a population-based cohort study. Epidemiol Psychiatr Sci. 2020;29.
4. Haeusler RA, Mcgraw TE, Accili D. Biochemical and cellular properties of insulin receptor signalling. Nat Rev Mol Cell Biol. 2017.
5. Titchenell PM, Lazar MA, Birnbaum MJ. Unraveling the regulation of hepatic metabolism by insulin. Trends Endocrinol Metab. 2017.
6. Boucher J, Kleinridders A, Kahn CR. Insulin receptor signaling in normal and insulin-resistant states. Cold Spring Harb Perspect Biol. 2014;6(1):231. doi:10.1101/cshperspect.a009191
7. Lewis C. The phosphoinositide 3-kinase pathway. Science. 2002.
8. Leslie M. The insulin receptor substrate (IRS) proteins. Cell Cycle. 2011;10(11):1750–1756. doi:10.4161/cc.10.11.15824
9. O’Neill B, Abel E. Akt1 in the cardiovascular system: friend or foe? J Clin Invest. 2005;115(8):2059–2064. doi:10.1172/JCI25900
10. Cullen MT, Brice E, Kahn CR. Critical nodes in signalling pathways: insights into insulin action. Nat Rev Mol Cell Biol. 2006;7(2):85–96. doi:10.1038/nrm1837
11. Chen Y, Huang L, Qi X, Chen C. Insulin receptor trafficking: consequences for insulin sensitivity and diabetes. Int J Mol Sci. 2019;20(20):5007. doi:10.3390/ijms20205007
12. Boothe T, Lim GE, Cen H, et al. Inter-domain tagging implicates caveolin-1 in insulin receptor trafficking and Erk signaling bias in pancreatic beta-cells. Mol Metab. 2016;5(5):366–378. doi:10.1016/j.molmet.2016.01.009
13. Huang S, Czech MP. The GLUT4 glucose transporter. Cell Metab. 2007.
14. Holman GD, Cushman SW. Subcellular localization and trafficking of the GLUT4 glucose transporter isoform in insulin-responsive cells. Bioessays. 2010;16(10):753–759. doi:10.1002/bies.950161010
15. Vlavcheski F, Baron D, Vlachogiannis I, MacPherson R, Tsiani E. Carnosol increases skeletal muscle cell glucose uptake via ampk-dependent glut4 glucose transporter translocation. Int J Mol Sci. 2018;19(5):1321. doi:10.3390/ijms19051321
16. Fu Q, Xu B, Liu Y, et al. Insulin inhibits cardiac contractility by inducing a gi-biased 2-adrenergic signaling in hearts. Diabetes. 2014;63(8):2676–2689. doi:10.2337/db13-1763
17. Fu Q, Shi Q, West TM, Xiang YK. Cross-talk between insulin signaling and GPCRs. J Cardiovasc Pharmacol. 2017;70(2):74–86. doi:10.1097/FJC.0000000000000481
18. Maja M, Drinovec L, Glisic S, et al. Demonstration of a direct interaction between β2-adrenergic receptor and insulin receptor by BRET and bioinformatics. PLoS One. 2014;9(11):e112664. doi:10.1371/journal.pone.0112664
19. Mangmool S, Denkaew T, Phosri S, et al. Sustained βAR stimulation mediates cardiac insulin resistance in a PKA-dependent manner. Mol Endocrinol. 2016;30(1):118. doi:10.1210/me.2015-1201
20. Mangmool S, Denkaew T, Parichatikanond W, Kurose H. β-adrenergic receptor and insulin resistance in the heart. Biomol Ther (Seoul). 2017;25(1):44–56. doi:10.4062/biomolther.2016.128
21. Jost P, Fasshauer M, Kahn CR, et al. Atypical β-adrenergic effects on insulin signaling and action in β3-adrenoceptor-deficient brown adipocytes. Am J Physiol Endocrinol Metab. 2002;283(1):E146–153. doi:10.1152/ajpendo.00531.2001
22. Morisco C, Condorelli G, Trimarco V. Akt mediates the cross-talk between beta-adrenergic and insulin receptors in neonatal cardiomyocytes. Circ Res. 2005;96(2):180–188. doi:10.1161/01.RES.0000152968.71868.c3
23. Sergey D, Hsien-Yu WH, Malbon CC. Insulin stimulates phosphorylation of the β2-adrenergic receptor by the insulin receptor, creating a potent feedback inhibitor of its tyrosine kinase. J Biol Chem. 2002;277(12):10698–10703. doi:10.1074/jbc.M109432200
24. Ciccarelli M, Chuprun JK, Rengo G, et al. G protein-coupled receptor kinase 2 activity impairs cardiac glucose uptake and promotes insulin resistance after myocardial ischemia. Circulation. 2011;123(18):1953–1962. doi:10.1161/circulationaha.110.988642
25. Wang Z, Gerstein M, Snyder M. RNA-seq: a revolutionary tool for transcriptomics. Nat Rev Genet. 2009;10(1):57–63. doi:10.1038/nrg2484
26. Stefano GB. Comparing bioinformatic gene expression profiling methods: microarray and RNA-seq. Med Sci Monit Basic Res. 2014;20:138–142. doi:10.12659/msmbr.892101
27. Shanrong Z, Wai-Ping F-L, Anton B. Comparison of RNA-seq and microarray in transcriptome profiling of activated T cells. PLoS One. 2014;9. 10.1371/journal.pone.0078644.
28. Fu X, Fu N, Guo S, et al. Estimating accuracy of RNA-SEQ and microarrays with proteomics. BMC Genom. 2009;10(1):161. doi:10.1186/1471-2164-10-161
29. Chan YK, Sung HK, Jahng JW, Kim GH, Han M, Sweeney G. Lipocalin-2 inhibits autophagy and induces insulin resistance in H9c2 cells. Mol Cell Endocrinol. 2016.
30. Xue-Jie LI, Xiao-Fang S, Feng-Ling W. MiR-291b-3p regulates activation of insulin signal pathway in H9C2 cell. Chin J Lab Diagn. 2016.
31. Wen G.
32. Yu G, Wang LG, Han Y, He Q. clusterProfiler: an R package for comparing biological themes among gene clusters. OMICS. 2012;16(5):284–287. doi:10.1089/omi.2011.0118
33. Buday L, Drinovec L, Glisic S, et al. Demonstration of a direct interaction between β2-adrenergic receptor and insulin receptor by BRET and bioinformatics. PLoS One. 2014;9(11):e112664. doi:10.1371/journal.pone.0112664
34. Cipolletta E, Campanile A, Santulli G, et al. The G protein coupled receptor kinase 2 plays an essential role in beta-adrenergic receptor-induced insulin resistance. Cardiovasc Res. 2009;84(3):407–415. doi:10.1093/cvr/cvp252
35. Kim S, Jee K, Kim D, Koh H, Chung J. Cyclic AMP inhibits Akt activity by blocking the membrane localization of PDK1. J Biol Chem. 2001;276(16):12864. doi:10.1074/jbc.M001492200
36. Liguang L, Julie U, Fernando RN, Altschuler D. cAMP inhibition of Akt is mediated by activated and phosphorylated Rap1b. J Biol Chem. 2002;277(36):32799–32806. doi:10.1074/jbc.M201491200
37. Zhiping W, Dillon TJ, Pokala V, et al. Rap1-mediated activation of extracellular signal-regulated kinases by cyclic AMP is dependent on the mode of Rap1 activation. Mol Cell Biol. 2006;26(6):2130–2145. doi:10.1128/MCB.26.6.2130-2145.2006
38. Aguirre V, Uchida T, Yenush L, Davis R, White MF. The c-jun NH2-terminal kinase promotes insulin resistance during association with insulin receptor substrate-1 and phosphorylation of Ser307. J Biol Chem. 2000;275(12):9047. doi:10.1074/jbc.275.12.9047
39. Hirosumi J, Tuncman G, Chang L, et al. A central role for JNK in obesity and insulin resistance. Nature. 2002;420(6913):333–336. doi:10.1038/nature01137
40. Nguyen MTA, Satoh H, Favelyukis S, et al. JNK and tumor necrosis factor-alpha mediate free fatty acid-induced insulin resistance in 3T3-L1 adipocytes. J Biol Chem. 2005;280(42):35361–35371. doi:10.1074/jbc.M504611200
41. Yang R, Trevillyan J. c-Jun N-terminal kinase pathways in diabetes. Int J Biochem Cell Biol. 2008;40(12):2702–2706. doi:10.1016/j.biocel.2008.06.012
42. Belov AA, Mohammadi M. Grb2, a double-edged sword of receptor tyrosine kinase signaling. Sci Signal. 2012;5(249):pe49–pe49. doi:10.1126/scisignal.2003576
43. Lin C, Melo F, Ghosh R, et al. Inhibition of basal FGF receptor signaling by dimeric Grb2. Cell. 2012;149(7):1514–1524. doi:10.1016/j.cell.2012.04.033
44. Skolnik EY, Lee CH, Batzer A, et al. The SH2/SH3 domain-containing protein GRB2 interacts with tyrosine-phosphorylated IRS1 and Shc: implications for insulin control of ras signalling. EMBO J. 1993.
45. Bisson N, James DA, Ivosev G, et al. Selected reaction monitoring mass spectrometry reveals the dynamics of signaling through the GRB2 adaptor. Nat Biotechnol. 2011;29(7):653–658. doi:10.1038/nbt.1905
46. Depetris RS, Hu J, Gimpelevich I, Holt LJ, Daly RJ, Hubbard SR. Structural basis for inhibition of the insulin receptor by the adaptor protein Grb14. Mol Cell. 2005;20(2):325–333. doi:10.1016/j.molcel.2005.09.001
47. Carré N, Goenaga D, Burnol AF. Modulation of insulin sensitivity by the Grb7 family of molecular adaptors. Obésité. 2011;6(2):114. doi:10.1007/s11690-011-0280-y
48. Nouaille S, Blanquart C, Zilberfarb V, et al. Interaction with Grb14 results in site-specific regulation of tyrosine phosphorylation of the insulin receptor. EMBO Rep. 2006;7(5):512–518. doi:10.1038/sj.embor.7400668
49. Ramos F, Langlais P, Hu D, Dong L, Liu F. Grb10 mediates insulin-stimulated degradation of the insulin receptor: a mechanism of negative regulation. Am J Physiol Endocrinol Metab. 2006;290(6):E1262–1266. doi:10.1152/ajpendo.00609.2005
50. Wick KR, Werner ED, Langlais P, et al. Grb10 inhibits insulin-stimulated insulin receptor substrate (IRS)-phosphatidylinositol 3-kinase/Akt signaling pathway by disrupting the association of IRS-1/IRS-2 with the insulin receptor. J Biol Chem. 2003;278(10):8460–8467. doi:10.1074/jbc.M208518200
51. Ding X, Iyer R, Novotny C, et al. Inhibition of Grb14, a negative modulator of insulin signaling, improves glucose homeostasis without causing cardiac dysfunction. Sci Rep. 2020;10(1):3417. doi:10.1038/s41598-020-60290-1
52. Gril B, Vidal M, Assayag F, et al. Grb2-SH3 ligand inhibits the growth of HER2+ cancer cells and has antitumor effects in human cancer xenografts alone and in combination with docetaxel. Int J Cancer. 2010;121(2):407–415. doi:10.1002/ijc.22674
53. Zhang Y, Xu G, Liu G, et al. miR-411-5p inhibits proliferation and metastasis of breast cancer cell via targeting GRB2. Biochem Biophys Res Commun. 2016;476(4):607–613. doi:10.1016/j.bbrc.2016.06.006
54. Ijaz M, Shahbaz M, Jiang W, Fathy AH, Shan WF. The role of Grb2 in cancer and peptides as Grb2 antagonists. Protein Pept Lett. 2017;25.
55. Neelankal John A, Ram R, Jiang F-X. RNA-seq analysis of islets to characterise the dedifferentiation in type 2 diabetes model mice db/db. Endocr Pathol. 2018;29(3):207–221. doi:10.1007/s12022-018-9523-x
56. Li X, Lin Z, Zhan X, et al. RNA-seq analysis of the transcriptome of the liver of cynomolgus monkeys with type 2 diabetes. Gene Int J Focus Gene Cloning Gene Struct Funct. 2018.
57. Satoh JI, Kino Y, Niida S. MicroRNA-seq data analysis pipeline to identify blood biomarkers for alzheimer’s disease from public data. Biomark Insights. 2015.
58. Sutherland GT, Janitz M, Kril JJ. Understanding the pathogenesis of Alzheimer’s disease: will RNA-Seq realize the promise of transcriptomics? J Neurochem. 2015;116.
59. Li J-W, Lee HM, Wang Y, et al. Interactome-transcriptome analysis discovers signatures complementary to GWAS Loci of type 2 diabetes. Sci Rep. 2016;6. doi:10.1038/srep35228
60. Sachs S, Bastidas-Ponce A, Tritschler S, et al. Targeted pharmacological therapy restores β-cell function for diabetes remission. Nat Metab. 2020;2(2):192–209. doi:10.1038/s42255-020-0171-3
 © 2020 The Author(s). This work is published and licensed by Dove Medical Press Limited. The full terms of this license are available at https://www.dovepress.com/terms.php and incorporate the Creative Commons Attribution - Non Commercial (unported, v3.0) License.
By accessing the work you hereby accept the Terms. Non-commercial uses of the work are permitted without any further permission from Dove Medical Press Limited, provided the work is properly attributed. For permission for commercial use of this work, please see paragraphs 4.2 and 5 of our Terms.
© 2020 The Author(s). This work is published and licensed by Dove Medical Press Limited. The full terms of this license are available at https://www.dovepress.com/terms.php and incorporate the Creative Commons Attribution - Non Commercial (unported, v3.0) License.
By accessing the work you hereby accept the Terms. Non-commercial uses of the work are permitted without any further permission from Dove Medical Press Limited, provided the work is properly attributed. For permission for commercial use of this work, please see paragraphs 4.2 and 5 of our Terms.