")
Back to Journals » OncoTargets and Therapy » Volume 15
Survivin Splice Variant 2β Enhances Pancreatic Ductal Adenocarcinoma Resistance to Gemcitabine
Authors Fuller RN , Kabagwira J, Vallejos PA, Folkerts AD, Wall NR
Received 5 October 2021
Accepted for publication 27 September 2022
Published 10 October 2022 Volume 2022:15 Pages 1147—1160
DOI https://doi.org/10.2147/OTT.S341720
Checked for plagiarism Yes
Review by Single anonymous peer review
Peer reviewer comments 3
Editor who approved publication: Dr William C. Cho
Ryan N Fuller, Janviere Kabagwira, Paul A Vallejos, Andrew D Folkerts, Nathan R Wall
Division of Biochemistry, Department of Basic Science, Loma Linda University School of Medicine, Loma Linda, CA, 92350, USA
Correspondence: Nathan R Wall, Center for Health Disparities & Molecular Medicine, 11085 Campus Street, Mortensen Hall 160, Loma Linda University, Loma Linda, CA, 92350, USA, Tel +909-558-4000 x81397, Email [email protected]
Background: Pancreatic ductal adenocarcinoma (PDAC) is a highly lethal disease with poor prognosis, as it is difficult to predict or circumvent, and it develops chemoresistance quickly. One cellular mechanism associated with chemoresistance is alternative splicing dysfunction, a process through which nascent mRNA is spliced into different isoforms. Survivin (Baculoviral IAP Repeat-Containing Protein 5 (BIRC5)), a member of the inhibitor of apoptosis (IAP) protein family and a cell cycle-associated oncoprotein, is overexpressed in most cancers and undergoes alternative splicing (AS) to generate six different splicing isoforms.
Methods: To determine if survivin splice variants (SSV) could be involved in PDAC chemoresistance, a Gemcitabine (Gem) resistant (GR) cell line, MIA PaCa-2 GR, was created and assessed for its SSV levels and their potential association with GR. Cross-resistance was assessed in MIA-PaCa-2 GR cells to FIRINOX (5-fluorouracil (5-FU), irinotecan, and oxaliplatin). Once chemoresistance was confirmed, RT-qPCR was used to assess the expression of survivin splice variants (SSVs) in PDAC cell lines. To confirm the effect of SSVs on chemoresistance, we used siRNA to knockdown all SSVs or SSV 2β.
Results: The MIA PaCa-2 GR cell line was 40 times more resistant to Gem and revealed increased resistance to FIRINOX (5-fluorouracil (5-FU), irinotecan, and oxaliplatin); when compared to the parental MIA-PaCa-2 cells. RT-qPCR studies revealed an 8-fold relative expression increase in SSV 2β and a 2- to 8-fold increase in the other five SSVs in the GR cells. Knockdown of all SSV or SSV 2β only, using small inhibitory RNA (siRNA), sensitized the GR cells to Gem, indicating that these SSVs play a role in PDAC chemoresistance.
Conclusion: These findings provide evidence for the potential role of SSV 2β and other SSVs in innate and acquired PDAC chemoresistance. We also show that the expression of SSVs is not affected by the type of chemoresistance, therefore targeting survivin splice variants in combination with chemotherapy could benefit a wide range of patients.
Keywords: chemoresistance, survivin splice variants, siRNA, FOLFIRINOX, Gemcitabine
Introduction
Although overall cancer death rates continue to decrease in men, women, and children for all major racial and ethnic groups, improvement in pancreatic cancer death rates is yet to be observed. An estimated 60,430 new cases are predicted to arise in the US, from which 48,220 will die in 2021.1 The little progress in pancreatic cancer management is indicated by the alarming rise shown by the prediction that it will be the second most deadly cancer in the US by 2030.2
Chemotherapy is one of the most common treatments for pancreatic ductal adenocarcinoma (PDAC), as it is usually not detected when the tumor would be resectable.3 Many tumors respond to chemotherapy and regress; however, some cancer cells may survive and expand, causing the cancer to come out of remission. These cancer cells are referred to as chemoresistant.4–6 The selective pressures brought about by chemotherapeutics can often cause upregulation of cellular mechanisms involved in chemotherapy resistance.7,8 In pancreatic cancer, these mechanisms can involve drug transport and metabolism,9 a change in the tumor microenvironment,10 exosome release,11,12 micro RNA changes,13–15 as well as alternative splicing.16–20
Survivin is a protein commonly overexpressed in cancer that has shown cell proliferation requirement and is a strong inhibitor of apoptosis (IAP).21–23 Survivin both stabilizes the microtubule spindle formation during cell division and blocks the inhibitors of other IAPs such as XIAP and c-IAP1/2.24–26 In many cancers higher survivin levels are indicative of increased resistance.26–29 This is most likely caused by increased anti-apoptotic pathway activity and proliferation stability by survivin, ultimately leading to higher drug-induced-death tolerance and chemoresistance. We propose that chemotherapeutic stress alters survivin splice variant (SSV) expression which leads to chemoresistance.
SSVs have been shown to play a role in different many cancer processes but their role in pancreatic cancer chemotherapy resistance has not been fully elucidated. The SSVs survivin (birc5, wild type), survivin ΔEx3, survivin 2β and survivin 2α are associated with cancer progression and chemoresistance30–33 while little has been reported in survivin 3α and survivin 3β isoforms.34 Specifically, it has been reported that increased levels of the 2β SSV plays the most prominent SSV role in cancer chemoresistance.35,36
This project aimed to delineate the role of survivin and its known splice variants in pancreatic cancer’s resistance to Gem. To address this need, we developed a GR cell line model from a Gem-sensitive parental cell line and assessed the GR in light of the expression levels of SSVs in both cell lines. Our results show that all six SSVs are expressed in the sensitive PDAC cell line but are overexpressed 2- to 8-fold in the GR cell line. Short inhibitory RNA (siRNA) knockdown of all SSVs in unison resensitized the GR cell line to Gem as did the specific knockdown of survivin 2β, suggesting that targeting SSVs in combination with chemotherapy might improve the outcomes of PDAC treatments.
Methods and Materials
Cell Culture
The PDAC cell line MIA PACA-2 was acquired from the American Type Culture Collection (ATCC, Manassas, VA) and maintained in Dulbecco’s modified Eagle medium (DMEM; ATCC, Manassas, VA) supplemented with Normocin at a final concentration of 100 μg/mL (InvivoGen, San Diego, CA), 100 units of penicillin, 100μg of streptomycin/mL, 300 μg of L-glutamine/mL and 10% United States Department of Agriculture (USDA)-sourced heat-inactivated fetal bovine serum (FBS) as well as 2.5% heat-inactivated horse serum (Mediatech, Manassas, VA). The PANC-1 PDAC cell line was acquired from ATCC and maintained in DMEM (Mediatech, Manassas, VA) supplemented with 100 units of penicillin, 100μg of streptomycin/mL, 300 μg of L-glutamine/mL, and 10% USDA-sourced heat-inactivated FBS (Mediatech, Manassas, VA). In all experiments, cells were cultured at 37°C in a humidified atmosphere containing 5% CO2 to 70–80% confluency prior to use. Cells were suspended and harvested using 0.25% trypsin in HBSS (Genesee Scientific, San Diego, CA). Cells were imaged using a Hoffman microscope during exponential growth in standard media to assess morphology changes.
Generation of a Gemcitabine Resistant (GR) Cell Line
Low passage MIA PaCa-2 cells were plated in duplicate in 10 cm plates at a cell density of 1 × 10⁴ cells/mL in 5 mL media. A control plate was set up separately with duplicate handling. On day two, media with a final concentration of 16nM Gem (initial IC50) was added to drug treatment groups. Drug treated cells were continuously grown in 16nm concentration of Gem until there was a significant reduction in visual cell death, after which the concentration of Gem was incrementally increased to 500 nM and was continuously passaged without changes in proliferation or visual cell death. These cells exhibited a sustained increase in Gemcitabine-resistant and were named Mia-PaCa-2-GR. Mia-PaCa-2-GR cells were then maintained in growth media with a final concentration of 500 nM Gemcitabine until experimental use (Figure 1A).
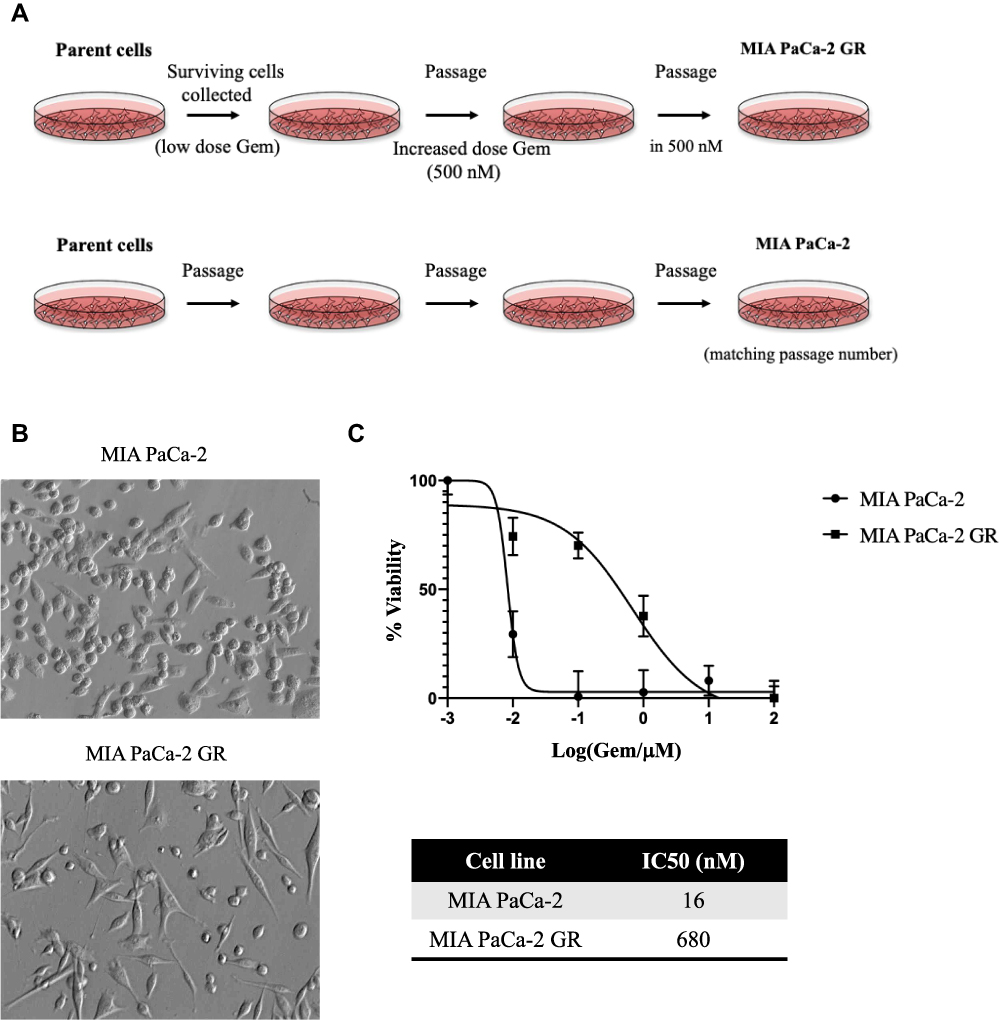 |
Figure 1 Generating a Gemcitabine resistant MIA PaCa-2 GR cell line. (A) Diagram illustrating how the MIA PaCa-2 GR cell line was generated. MIA PaCa-2 cells were grown with low nanomolar (nM) concentrations of Gem. Live cells surviving Gem were regrown in the same concentration. Once cell death was decreased, Gem concentration was steadily increased up to 500 nM in which the cells were maintained continuously. (B) Cellular morphology was visualized using Hoffman Modulation contrast microscopy with a 40x magnification. (C) IC50 of MIA PaCa-2 and MIA PaCa-2 GR cells was calculated by exposing both cells lines to a concentration of Gemcitabine ranging from 0.001–100 µM for 72 hours. At the end of 72 hours, a MTT assay was performed to assess the IC50. IC50 was calculated using GraphPad 8.4.2. |
MTT and Viability
To determine the IC50 values for both PANC-1 and MIA PaCa-2 cell lines, cells were plated in a 96 well plates at a density of 5000 cells/well and grown for 12–16 hours. Gem was introduced at various concentrations (0.001–100 µM), diluted in the cells’ respective media for 24, 48 and 72 hours. MIA PaCa-2 and MIA PaCa-2 GR cells were single-agent as well as multi-agent tested for cross-resistance to the three chemotherapeutic components of FOLFIRINOX a four drug therapy cocktail currently used to treat pancreatic cancer patients: folinic acid, with 5-FU (10 μM), irinotecan (2 μM), and oxaliplatin (10 μM). MIA PaCa-2 GR cells were grown in conditions with and without 500 nM Gem upon drug treatment with FIRINOX.
The cells were incubated with these different agents for 72 hours followed by the trypan blue or MTT assay to determine cell viability. The reduction of the tetrazolium salt, 3-(4,5-dimethylthiazol-2-yl)-2,5-diphenyltetrazolium bromide (MTT), to a blue formazan crystal is facilitated by mitochondrial and NADPH-dependent cellular enzymes. Following treatment for 24, 48 or 72 h, MTT was added, at a final concentration of 0.5mg/mL to each well, and incubated for 2 h at 37°C. The metabolically active cells reduced the MTT to blue formazan crystals, which were dissolved in DMSO. The plates were then centrifuged at 500g for 5 min and MTT solution was eluted from plate. 100ul of DMSO was added to cells to solubilize the formazan crystals in each well. The plates were read using a SpectraMax i3x Multi-Mode Microplate Reader (Molecular Devices, LLC, San Jose, CA) at absorbance wavelength 570nm and reference 630nm. IC50 values were calculated using GraphPad Prism (GraphPad Software, San Diego, CA).
Trypan Blue Cell Viability Assessment
Panc-1, Mia-PaCa-2 ad Mia-PaCa-2 GR cell lines were seeded into 6-well plates at 150,000 (Panc-1) or 200,000 cells and were incubated at 37°C for 12–16h before treatment. Cells were then treated with chemotherapy at IC50 values from MTT or with siRNA. 72h after drug treatment, cells were washed with PBS and suspended with trypsin. Before quantitation, the trypsin-cell suspension was diluted 1:3 with fresh media, centrifuged to a pellet and trypsin removed. Cells were resuspended in 100ul of pbs. 10ul of cell suspension was mixed with 10ul trypan blue (Sigma, Burlington, MA) and was counted using TC20 cell counter (BioRad Laboratories, Hercules, CA) to assess live cell number after treatment. Cell numbers were normalized to controls for quantitation.
Cyquant Cell Viability
Cells were handled in the same way as for the MTT assessment. After 72h of treatment plates were centrifuged at 500g for 5 min and media eluted. Cells were washed with PBS and centrifuged again to elute PBS wash. Plates were then frozen at −80°C until day of assessment, at which time Cyquant proliferation assay kit was used to detect total DNA concentration to assess cell number. Cells were lysed and prior to incubation with detection reagent according to the manufacturer’s protocols and plates were read using SpectraMax i3x Multi-Mode Microplate Reader (Molecular Devices, LLC, San Jose, CA) with fluorescent detection at excitation 480 nm emission 520 nm.
RNA Isolation
Total RNA was isolated using the Trizol reagent (Invitrogen, Carlsbad, CA) according to the manufacturer’s instruction. Briefly, harvested cells were lysed in 500 µL Trizol reagent with the pellet frozen at −80°C. Samples were thawed at room temperature after which 100 µL of chloroform was added and cells were incubated at room temperature. Samples were shaken vigorously for 15 seconds and then allowed to stand for 5 minutes at room temperature prior to centrifuging for 15 minutes at 12,000 × g at 4°C. The aqueous phase was transferred to a fresh tube, and 250 μL of 2-propanol was added, followed by an additional 10-minute centrifugation step. RNA pellets were washed in cold ethanol and the concentration was determined by measuring absorbance at 260/280 nm on a NanoDrop spectrophotometer (Thermo Scientific, Waltham, MA).
Primer Design
Primers specific for each of the six SSVs were designed using unique regions in their sequences and the National Center for Biotechnology Information (NCBI) nucleotide database (https://www.ncbi.nlm.nih.gov/nucleotide) (Table 1).
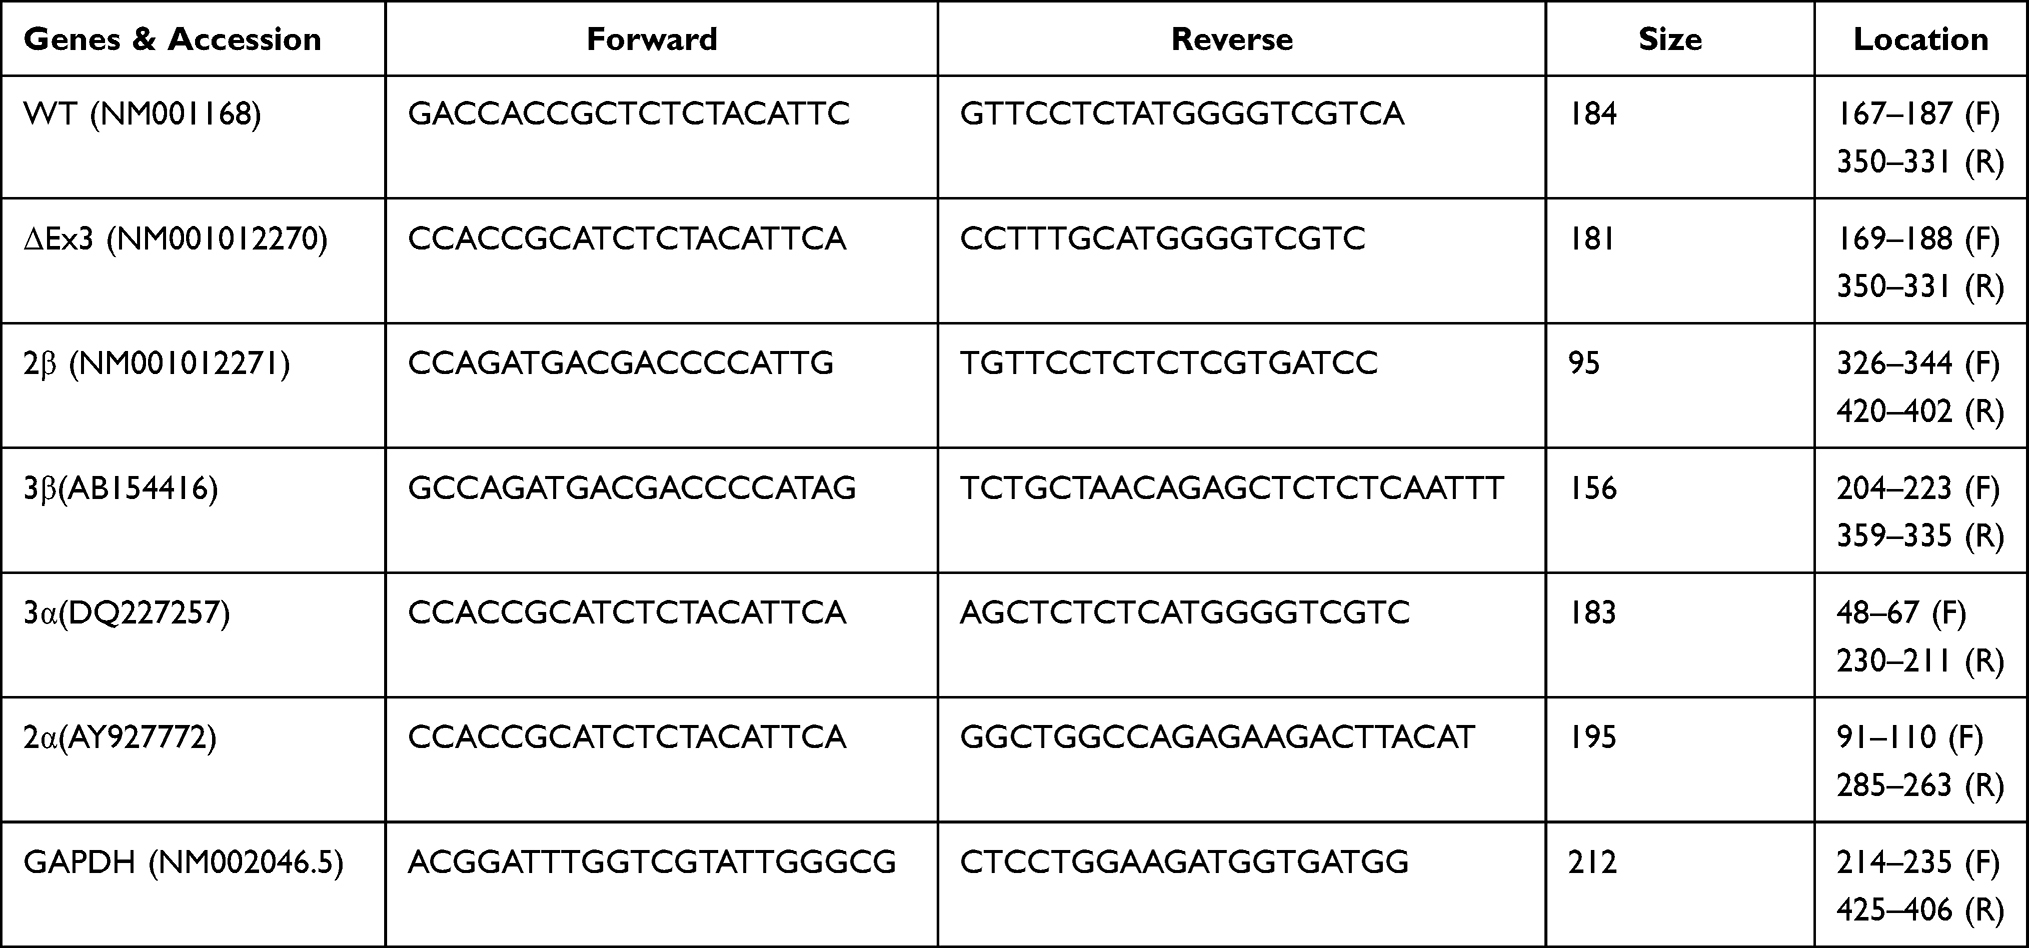 |
Table 1 Survivin Splice Variant Primers |
Rt-Pcr
Total RNA was converted into cDNA using a High-Capacity cDNA Reverse Transcription Kit (Applied Biosystems, Foster City, CA). The synthesized cDNA was diluted to 400 ng, of which 5µL was used as a template for quantitative real-time polymerase chain reaction (RT-qPCR). cDNA was amplified by PCR using a pair of primers specific for each SSV and as listed in Table 1, and GAPDH was used as an internal control. Real-time PCR amplification and analysis were carried out on a CFX96 Real-Time PCR Detection System (Bio-Rad Laboratories, Hercules, CA). PCR conditions were optimized, and 25 µL reactions were prepared using SYBR Green PCR Master Mix (Bio-Rad Laboratories, Hercules, CA), 10 µM of forward/reverse primers, and 50 ng of cDNA. All reactions were run in triplicate using the primers described. The reaction conditions were as follows: 95°C for 3 minutes, 40 cycles of 95°C for 10 seconds, and 60°C for 1 minute, followed by a melting curve ranging from 65°C to 95°C (acquiring fluorescence data every 0.5°C). A negative control reaction without reverse transcription was included in each experiment, and the specificity of the SSV was confirmed. Relative levels of each SSV target sequence was calculated using the comparative CT (crossing threshold) values and each sample was normalized using to GAPDH.
Gene Silencing Experiments
To silence all SSVs, siRNA (5′-CAGACTTGGCCCAGTGTTT-3′) was used, which targets a region in exon 2, a conserved region in SSVs. MISSION siRNA duplexes targeting the 5′-AATACCAGCACTTTGGGAG-3′ sequence in the open reading frame of the human survivin 2β (NM_001012271) and MISSION siRNA universal negative control predesigned oligos were used (Millipore Sigma, St. Louis, MO). Briefly, 150,000 to 200,000 cells/well were plated in 6-well plates for PANC-1, MIA PaCa-2, and MIA PaCa-2 GR cell lines. Sixteen hours later, 3 μg of siRNA was mixed with MISSION transfection reagent (Sigma) at a 1:3 ratio (siRNA: transfection reagents) in 200 ul Opti-MEM (ThermoFisher Scientific, Grand Island, NY). The mixture was incubated for 15 minutes at room temperature and then added to the cells dropwise. MIA-PaCa-2 GR cells were grown in media with and without 500 nM Gem at the time of treatment.
Immunoblot and Protein Quantitation
Cells were harvested 72h after treatment and centrifuged at 500g for 5 min. media and trypsin was eluted and cells were resuspended in 50–100ul of RIPA buffer. A Pierce BCA protein assay kit (Thermo Scientific, Waltham, MA) was used according to manufacturer’s protocol to quantitate total protein in each sample. 20µg of protein sample was resolved using a SDS-page 15% acrylamide-bis gel and transferred to a nitrocellulose membrane (Advansta, San Jose, CA). Membrane was immunostained using rabbit polyclonal anti-survivin (NB500-201, NOVUS Biologicals, 1:1000) for detection of all survivin isoforms, mouse monoclonal anti-p53 (1:1000) (DO-1, sc126, Santa Cruz Biotech), mouse monoclonal anti-YY1 (1:1000) (H-10, sc-7341 Santa Cruz Biotech), rabbit polyclonal anti-sp1 (1:1000) (PEP-2 sc59, Santa Cruz Biotech) and loading controls rabbit monoclonal anti-β-actin (1:5000) (D6A8, Cell Signaling) and mouse monoclonal anti-GAPDH (1:1000) (O411, sc-47724, Santa Cruz Biotech). Dylight 800 Goat-anti-mouse IGG (1:20000) (SA535521, Invitrogen), and goat-anti-rabbit IGG antibodies (1:20000) (SA5-35571, Thermo Scientific) were used for secondary stain and quantitation via Odessey CL-x (LI-COR Lincoln, NE).
Statistics
All experiments were performed using at least three biological replicates with bar graph values expressed as the mean and standard error of the mean (SEM). A repeated-measures two-way ANOVA was used to determine the efficacy of independent intervention variables, following the Wilcoxon signed-rank test. The groups (cell lines/SSVs) and treatment (drug/siRNAs) were the independent variables while viability and normalized relative expression measures were the dependent variables. IC50’s were calculated using GraphPad 8.4.2. P values *p < 0.05, **p < 0.01, and ***p < 0.005 were considered statistically significant.
Results
Generating a Chemoresistance Cell Line MIA PaCa-2 GR
MIA PaCa-2 cells were plated in duplicate into 10 cm dishes at a cell density of 1 × 10⁵ cells/mL in 5 mL media. One plate was left untreated but was passaged alongside the Gem-treatment plate. The cells, initially treated with a sublethal dose of 10 nM Gem, were named MIA PaCa-2-Gem (Figure 1A). The untreated cells were used as a control, as continuous cell culture can alter cellular characteristics, including drug resistance. After one week, the Gem-treated cells showed negligible levels of cell death, and were actively proliferating, so the Gem concentration was increased. Over the next 5 months, drug sensitivity directed the steady increase in Gem levels from 10nM to 50nM to 100nM to 200nM. After multiple passages in 200 nM Gem, negligible cell death was observed. However, approximately 25–40% of the MIA PaCa-2-Gem cells had an observable fibroblast-like phenotype (Figure 1B). This phenotype has been associated with chemoresistance in different cancers.37–39 At this stage, the Gem-treated cells were again actively proliferating in the presence of Gem and the concentration was increased to 500 nM (Figure 1A). MIA PaCa-2-Gem cells have been continuously passaged in this concentration with active proliferation and negligible levels of cell death.
To confirm successful resistance, IC50 values were calculated in both MIA PaCa-2 and MIA PaCa-2-Gem cell lines by exposing the cells to a range of concentrations (0.01–1000 μM) for 72 hours. Using an MTT assay and GraphPad prism version 8.4.2 software, we determined after conditioning for nearly 12 months that the IC50 value had increased to 680 nM for MIA PaCa-2-GR compared to 16 nM for MIA PaCa-2 (Figure 1C). At this point, we ceased further Gem concentration increasing and renamed these Gem-treated cells MIA PaCa-2 GR for Gemcitabine Resistance. It has been our observation that these GR cells are stable both in their cell division and in their resistance to Gem.
Assessing Cross-Resistance of MIA PaCa-2 GR to Other Chemotherapies
To assess whether the MIA PaCa-2 GR cell line was also resistant to other drugs that are used to treat PDAC, MIA PaCa-2 and MIA PaCa-2 GR cells were exposed to three of the drugs that make up FOLFIRINOX: 5-FU, Irinotecan and Oxaliplatin (FIRINOX). We did not test folinic acid as it is used to reduce the side effects in vivo produced by the other 3 components of FOLFIRINOX. We used 10 μM of 5-FU, 2 μM of irinotecan, and 10 μM of oxaliplatin and assessed their effect, in the absence of Gem, on cell viability 72 hours after treatment. Our results indicate that MIA PaCa-2 GR cells are also resistant to these three drugs (Figure 2). When compared to the MIA PaCa-2 GR cell line, the MIA PaCa-2 parent cells experienced 80%, 90%, and 90% more cell death by 5-FU, irinotecan, and oxaliplatin, respectively in the trypan blue exclusion assay (Figure 2B) and a significant decrease in metabolic activity in the MTT assays (Figure 2D and F). When MIA PaCa-2 and MIA PaCa-2 GR cells were treated with the three-drug regimen FIRINOX, GR cells were still more resistant to the combination of agents than the parental cell line, but they too were reduced by approximately 45% whereas the GR cells only experienced a reduction of ~20% (Figure 2A, D and F). In a completely separate experiment, MIA PaCa-2 GR cells were treated in the presence of 500 nM Gem plus 5-FU, irinotecan, oxaliplatin, or FIRINOX. This combination of Gem with any of the components of FIRINOX and with FIRINOX itself resulted in an approximate 40% reduction in cell viability (Figure 2C). Though the addition of Gem to these agents resulted in some GR sensitivity in the trypan blue exclusion assays, the MTT and Cyquant assays showed the chemotherapy combinations with Gem had a similar or slightly improved outcome compared to the Gem deprived GR cells and only had a reduction in cell viability by less than 20% (Figure 2E and G).
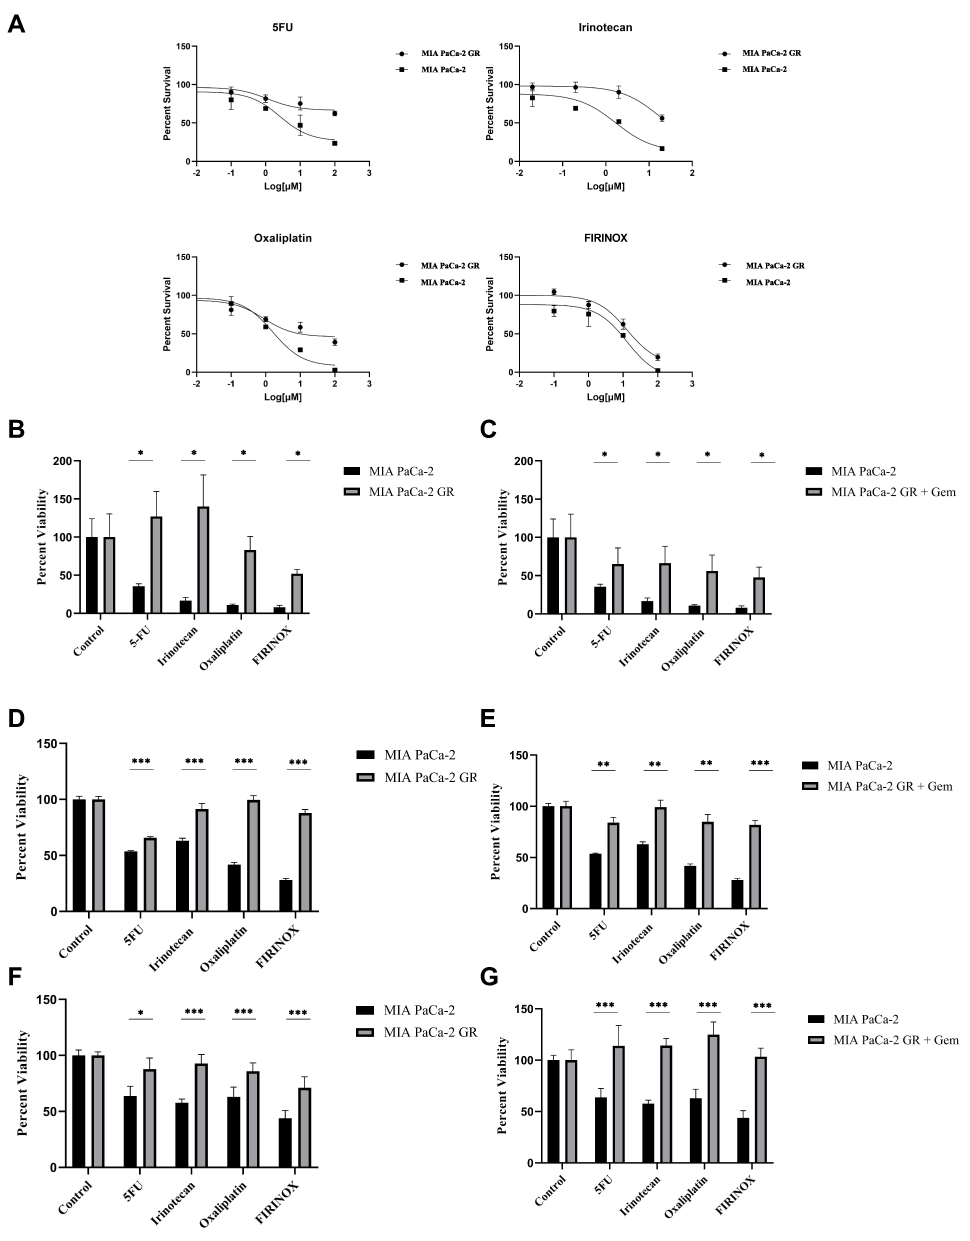 |
Figure 2 Assessing cross-resistance to other chemotherapies. (A) In the absence of Gem, MIA PaCa-2 and MIA PaCa-2 GR were treated with 5-FU (10 μM), irinotecan (2 μM), oxaliplatin (10 μM) or their combination FIRINOX, using the same dosages, for 72 hours after which cell viability was assessed using trypan blue. In the absence (B) Ie or presence (C) of Gem (500 nM), MIA PaCa-2 and MIA PaCa-2 GR were treated with 5-FU (10 μM), irinotecan (2 μM), oxaliplatin (10 μM) or their combination FIRINOX, using the same dosages, for 72 hours after which cell viability was assessed using trypan blue. (D) MTT assay evaluating the effect MIA PaCa-2 IC50 values of each drug on MIA-PaCa-2 GR cells’ viability. (E) MTT assay evaluating the effect of MIA PaCa-2 IC50 values of each drug on MIA-PaCa-2 GR cells’ viability in the presence of Gem. (F) Cyquant assay using DNA detection method for quantitating cell number with MIA PaCa-2 GR cells seeded in the absence of Gem. (G) Cyquant assay using DNA detection method for quantitating cell number with MIA PaCa-2 GR cells seeded in the presence of Gem. For statistical analysis a Wilcoxon’s analysis was performed with data presented as the mean (± SEM) with *p≤0.05, **p≤0.01, and ***p≤0.005. |
Evaluating the Expression of Survivin Splice Variants in MIA PaCa-2 GR Cell Line
To quantitate expression of the SSVs in the MIA PaCa-2 GR cells compared to MIA PaCa-2 cells, we analyzed total transcript levels by RT-qPCR using primers (Table 1) that detect the wild type, ∆ex3, 2β, 3β, 2α, and 3α SSVs transcript variants. This method is often used when antibodies are not available. The RT-qPCR analyses showed that the SSVs above were overexpressed 3.44, 2.67, 7.95, 7.88, 2.13, and 2.85-fold higher in the GR cells compared to parental MIA PaCa-2 cells, respectively (Figure 3A). Protein expression of wild type survivin was also shown to be higher in relative expression Relative quantification was carried out using the comparative (∆∆CT) method (Supplemental Tables 1A–F).
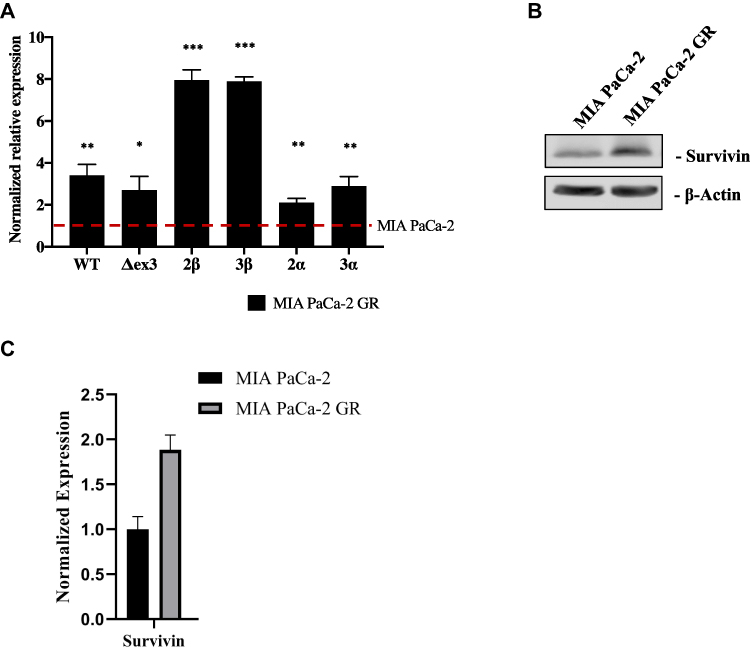 |
Figure 3 Evaluating the expression of SSVs in MIA PaCa-2 GR compared to MIA PaCa-2 parental cells. (A) RT-qPCR was performed with MIA PaCa-2 as a control compared to MIA PaCa-2 GR. The level of expression of SSVs were measured relative to GAPDH and presented as fold increase of SSVs in MIA PaCa-2 GR compared to parental MIA PaCa-2 cells. (B) Immunoblot of survivin expression in MIA PaCa-2 vs MIA PaCa-2 GR. (C) Quantitation of immunoblot using LI-COR software and β-actin as a loading control. For statistical analysis a Wilcoxon’s analysis was performed with data presented as the mean (± SEM) with *p≤0.05, **p≤0.01, and ***p≤0.005. |
Evaluating the Expression of Survivin Splice Variants in PANC-1 Cells
To quantitate expression of the SSVs depicted in the reportedly Gem resistant PANC-1 cell line compared to reportedly Gem sensitive MIA PaCa-2 cells, we again analyzed total transcript levels by RT-qPCR using primers (Table 1) that detect the wild type, ∆ex3, 2β, 3β, 2α, and 3α SSVs transcript variants. Our RT-qPCR results indicated a significant overexpression of all survivin splice variants in PANC-1 cells compared to MIA PaCa-2 cells (Figure 4A). SSVs survivin WT, ΔEx3, 2β, 3β, 3α and survivin 2α were overexpressed 3.14, 4.00, 5.45, 5.88, 2.14, and 2.23-fold more in PANC-1 cells compared to MIA PaCa-2 cells respectively. In addition, we determined that the Gem IC50 was 138 nM for PANC-1 as compared to 16 nM for MIA PaCa-2 cells. This PANC-1 IC50 is 8.6 times higher than the IC50 for the MIA PaCa-2 cells (Figure 4B). Relative quantification was carried out using the comparative (∆∆CT) method as in Figure 3 (Supplemental Tables 1A–F)
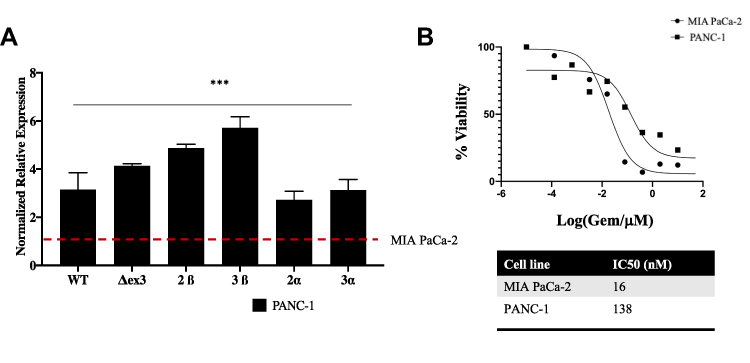 |
Figure 4 Evaluating the expression of SSVs in MIA PaCa-2 compared to PANC-1 cells. (A) RT-qPCR was performed with MIA PaCa-2 as a control compared to PANC-1. The level of expression of SSVs were measured relative to GAPDH and presented as fold increase of SSVs in PANC-1 cells compared to MIA PaCa-2 cells. (B) IC50 of PANC-1 and MIA PaCa-2 cells was calculated by exposing both cell lines to a concentration of Gemcitabine ranging from 0.001–100 µM for 72 hours. At the end of 72 hours, a MTT assay was performed to assess the IC50. IC50 was calculated using GraphPad 8.4.2. For statistical analysis a Wilcoxon’s analysis was performed with data presented as the mean (± SEM) with *p≤0.05, **p≤0.01, ***p≤0.005. |
Survivin 2β Knockdown Sensitizes Resistant Cells to Gemcitabine
Survivin 2β has been linked to chemoresistance40 and in our hands, it was expressed in the parental MIA PaCa-2 cell line. In addition, it was significantly overexpressed in both PANC-1 and MIA PaCa-2 GR (Figures 3 and 4A). We sought to assess SSV 2βs effect on chemoresistance by knocking it down using siRNA as described in the methods section. Cells were exposed to siRNA 24 hours prior to Gem treatment, and cell viability was assessed 72 hours after siRNA treatment or 48 hours after Gem treatment. For control, non-targeting scramble siRNA, and siRNA that targets all SSVs were used with the efficiency and specificity of the knockdown determined using RT-PCR (Figure 5A). In our hands, siSSVs significantly knocked down both WT and 2β in PANC-1 and only WT with limited effect on 2β in the MIA PaCa-2-GR cell lines (Figure 5A). In addition, si2β knocked down only 2β in MIA PaCa-2-GR and PANC-1 cell line and was ineffective on WT in either PANC 1 or MIA PacA-2 GR cells (Figure 5A). Immunoblots on siSSVs reduced overall survivin levels by 83% in MIA PaCa-2 GR cells and 84% in PANC-1 however si2β did not have a significant effect on overall survivin protein expression (Figure 5B and C). Our results indicate that knocking down SSV 2β in MIA PaCa-2 GR and in PANC-1 cells significantly reduced cellular viability in PANC-1 cells by 31% (Figure 5D, lane 4) and MIA PaCa-2 GR cells by 30% (Figure 5E, lane 7). MTT viability showed dramatic loss in metabolic activity with siRNA knockdown, where PANC-1 experienced 49% reduction (Figure 5F, lane 4) and MIA PaCa-2 GR 56% (Figure 5G, lane 7) reduction with si2β. Knockdown of all SSVs (siSSVs) also resulted in significant reduced cellular viability by 55% and by 32% respectively in the PANC-1 and MIA PaCa-2 GR cell lines (Figure 5D, lane 3 and 5E, lane 5). MTT showed similar decreases in metabolic activity with a reduction with a 70% and 51% reduction in PANC-1 and MIA PaCa-2 GR respectively (Figure 5E, lane 3 and Figure 5G, lane 5). Importantly, siRNAs directed against the SSVs in the MIA PaCa-2 GR cell line were able to resensitize these cells to Gem by further increasing cell death with the addition of Gem by an additional 13% with siSSVs (64% reduction overall) and 18% with si2β (75% reduction overall (Figure 5G, lanes 6 and 8). However, there was significant reduction in cell metabolism when treated with the Scramble control compared to untreated cells (45% in MIA PaCa-2 and 36% in PANC-1). Though significant enhanced killing was measured in both MIA PaCa-2 GR and PANC-1 cell lines, the percent killing did not exceed 60%, indicating that factors other than SSVs still have a role in drug resistance. Unfortunately, SSV siRNA did not prove in our hands to potentiate the killing effect of Gem in the MIA PaCa-2 GR cells as their combined efficacy was not significantly better than that recorded by Gem-treatment alone (Figure 5E, lanes 5 and 6).
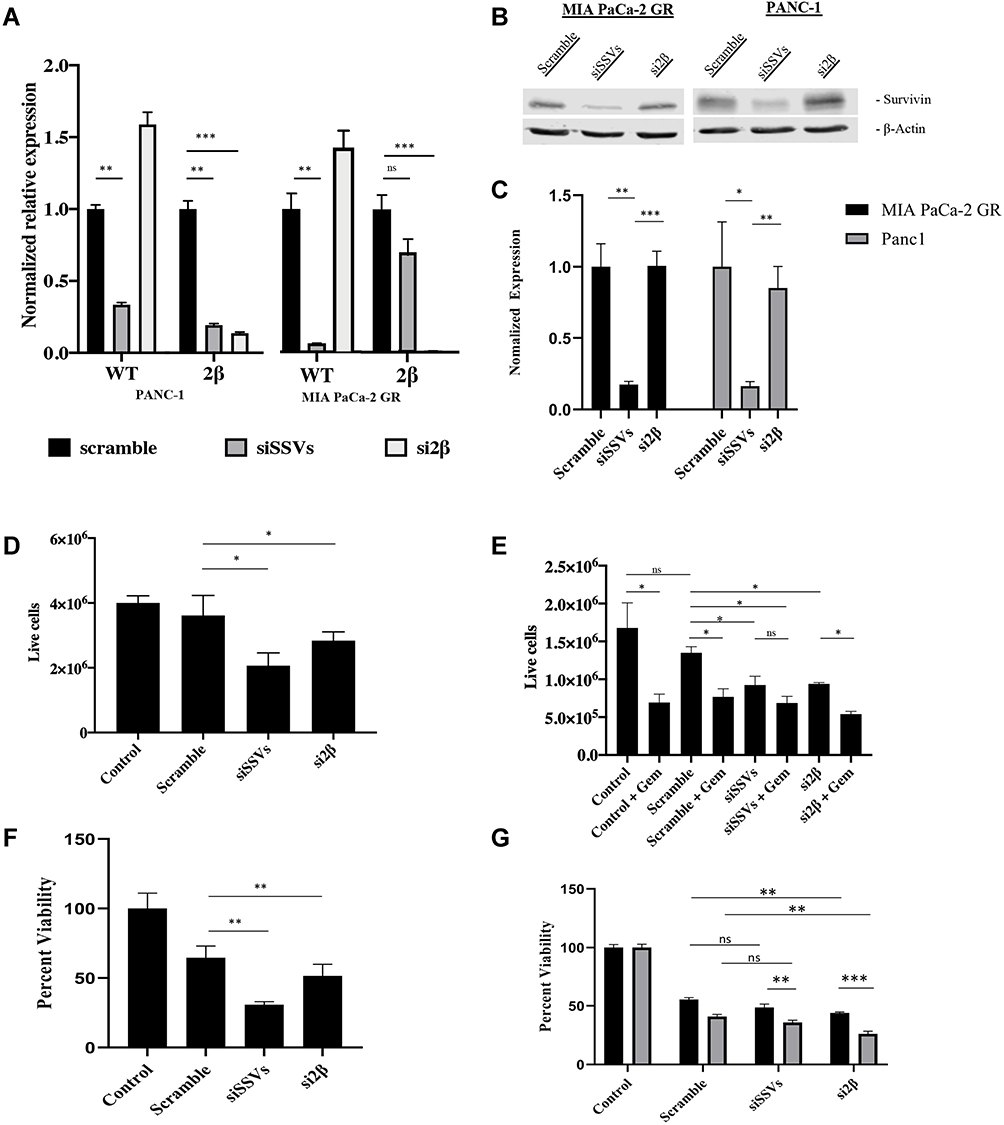 |
Figure 5 Survivin 2β knockdown sensitizes resistant cells to Gemcitabine. (A) RT-qPCR was performed to verify the siRNA knockdown of MIA PaCa-2 GR and PANC-1 cells to either knockdown all SSVs using siSSVs or si2β to knock down only the SSV 2β in MIA PaCa-2 GR and PANC-1. (B) Immunoblot of all survivin splice variants expression in MIA PaCa-2 GR (lanes 1–3) and PANC-1 (lanes 4–6). (C) Quantitation of immunoblot expression by LI-COR software using β-actin as a loading control. (D) Trypan blue exclusion assay for PANC-1 cells treated with siRNA for 72 hours. (E) Trypan blue exclusion assay for MIA PaCa-2 GR with combination of Gem and siRNA. Gem was added 24 hours after siRNA treatment and viability was assessed at the end of 72 hours. (F) MTT assay showing the metabolic activity of siSSVs or si2β knock down on PANC-1 cells after 72h siRNA treatment. (G) MTT assay showing the metabolic activity of siSSVs and si2β knock down on MIA PaCa-2 GR cells with Gem or without Gem. Gem was added 24h after siRNA initial treatment and cell viability was assessed after 72h of siRNA treatment. For statistical analysis, a Wilcoxon’s analysis was performed. Data is presented as mean (± SEM) with *p≤0.05, **p≤0.01, and ***p≤0.005. |
Discussion
Chemoresistance is a major factor and obstacle to improving the sensitivity of pancreatic cancer to chemotherapy and thus improving patient outcomes. Survivin,41 the multifunctional IAP protein, has been shown to be responsible for drug resistance42 but as of yet has not been successfully targeted in order to resensitize chemoresistant cancers to chemotherapy.32,33,41 Though Survivin’s expression has been found to be synonymous with tumor resistance to chemotherapy, resistance to apoptosis, enhanced metastasis, and cell cycle progression,43,44 it is not localized to the cell surface with inhibitable catalytic activity has most likely lowered the enthusiasm for developing specific antagonists.41,45 In addition, few comprehensive studies have fully investigated the six known survivin isoforms (SSVs) and the role they play in chemoresistance,34 let alone the role they play in pancreatic cancer chemoresistance. In fact, in the few existing studies of SSV expression in cancer, it is mostly the role these splice variants play in apoptosis regulation that has been investigated.32,46
Therefore, to the best of our knowledge, this is the first study evaluating all SSVs in respect to chemoresistance, using quantitative RT-PCR, that is often acquired during the treatment of pancreatic malignancy. We found the SSV expression significantly higher in pancreatic cancers that are innately resistant to Gem (PANC-1) and in those that have acquired further Gem resistance (MIA PaCa-2 GR) in comparison to the parental MIA PaCa-2 cell line (Figures 3 and 4). Moreover, we specifically recorded that SSV 2β was elevated more than 5-fold in the PANC-1 and more than 8-fold in the MIA PaCa-2 GR cells in comparison to the parental cell line, suggesting that SSV 2β might be a molecular marker of chemoresistance and a poorer prognosis in PDAC. Recent clinical studies have shown that elevated SSV expression is associated with poor survival in PDAC as well as cancers such as breast, thyroid, and oral.32–34,46–48
Survivin’s main transcript predominates most cancers. However, certain of its alternative splice variants have been recorded in what appears to be tumor specific and even tumor stage specific.31 SSV 2α, for example, if found expressed in most tumors at their most malignant stage.49 It is believed that this SSV, with the propensity to induce apoptosis, is co-expressed with the antiapoptotic Survivin WT, in high grade tumors, as an attempt to attenuate Survivin WT’s antiapoptotic activity.50,51 To state it more specifically, the homodimerization of Survivin occurs in solution and the heterodimerization with its splice variants may be important in further regulation of its function.33,50,51 We hypothesize the chemoresistant potential of SSV 2b in this study is largely due to monomer interactions within the cell; however, heterodimerization of SSVs is largely unknown and may also regulate proliferation and antiapoptotic potential. The Survivin 2b splice variant adds 23 amino acids in between the interacting regions of Smac/Diablo and HSP90.33 Monomeric survivin is typically associated with interactions with the SMAC/Diablo complex, AIF release mechanism, XIAP stability and nuclear export, whereas homodimerization of survivin WT is more commonly associated with microtubule stabilization during proliferation.52,53 We are currently studying the SSV 2β monomeric state as a way of explaining increased antiapoptotic potential over its wildtype variant. Furthermore, splicing regulation, to include both trans and cis regulatory effects need to be investigated in chemosensitivity as well as all the other hallmarks of cancer. The epigenetic regulator, BORIS has been identified to induce multiple transcription initiation sites resulting in multiple mRNA splice variants,54 and it has been hypothesized that the survivin gene may also have the equivalent machinery to create multiple splice variants. Regulatory factors such as Sp1, YY1, and p53 have binding sites in the survivin promoter, along with cell cycle dependent regulatory regions,55–58 but it is p53 alone that has been shown to influence the expression patterns of the splice variants of survivin.58 Specifically, WT p53 suppresses the expression of survivin and its SSVs and an increase in the SSVs in breast cancer has been shown when p53 is mutated.59–61 WT p53’s physical interaction with DNA methyl transferase I (DNMT1) influences the survivin promoter’s methylation, leading to survivin repression in HCT116 cells.62 WT p53 has also been reported interacting with the spliceosome protein SAP145 that affects pre-mRNA splicing sites.31 Together, both spliceosomal and methylation patterns could significantly affect SSV expression and chemoresistance and further investigation of these is ongoing in our laboratory.
SSV 2β has previously been reported in cancers such as ovarian, acute myeloid leukemia (AML),36 gastric carcinoma,63 brain tumors,64 soft tissue sarcoma,65 and in rheumatoid arthritis.35 In addition, siRNA against SSV 2β has led to growth suppression and apoptosis in rheumatoid arthritis (RA) fibroblast-like synoviocytes, and in chemoresistant ovarian cancer cell lines,35 SSV 2β knockdown resensitized these cells to taxanes.40 The strong correlation between SSVs, and SSV 2β in particular, as shown in our study supports the hypothesis that high SSV expression might foretell of Gem chemoresistance in pancreatic cancer. Moreover, our findings also predict that elevated SSVs may correlate with resistance to other agents that may be examined for the treatment of pancreatic cancer such as the multi-agent chemotherapy regimen of FOLFIRINOX (folinic acid, 5-FU, irinotecan, and oxaliplatin).66 In addition, we demonstrate for the first time that knockdown of all SSVs, and more importantly of SSV 2β specifically, resensitized GR pancreatic cancer cells to Gem. Of interest, cells which had become GR simply by continuous propagation in an ever-increasing concentration of Gem were again sensitized by SSV siRNA knockdown. This would support the importance of SSVs, and specifically SSV 2β, in both acquired and innate chemoresistance often recorded in pancreatic cancer. These results suggest that targeting SSVs alone or in combination with chemotherapy might improve the outcomes of PDAC treatments.
Data Sharing Statement
All data is stored and available upon request from NRW.
Acknowledgment
We would like to thank Dr. Amber Gonda, Dr. Rosalia de Necochea-Campion, Dr. Maheswari Senthil and Dr. William Langridge for excellent suggestions and support throughout this project.
Author Contributions
All authors made a significant contribution to the work reported, whether that is in the conception, study design, execution, acquisition of data, analysis and interpretation, or in all these areas; took part in drafting, revising or critically reviewing the article; gave final approval of the version to be published; have agreed on the journal to which the article has been submitted; and agree to be accountable for all aspects of the work.
Funding
This research was funded in part by NCMHD Project EXPORT Program 5P20MD001632/Project 3 (NRW). The funders had no role in study design, data collection and analysis, decision to publish, or preparation of the manuscript.
Disclosure
The authors report no conflicts of interest in this work.
References
1. Siegel RL, Miller KD, Jemal A. Cancer statistics, 2020. CA Cancer J Clin. 2020;70:7–30. doi:10.3322/caac.21590
2. Rahib L, Smith BD, Aizenberg R, et al. Projecting cancer incidence and deaths to 2030: the unexpected burden of thyroid, liver, and pancreas cancers in the United States. Cancer Res. 2014;74:2913–2921. doi:10.1158/0008-5472.CAN-14-0155
3. Ryan DP, Hong TS, Bardeesy N. Pancreatic adenocarcinoma. N Engl J Med. 2014;371:2140–2141. doi:10.1056/NEJMra1404198
4. Zhang S, Gong Y, Li C, Yang W, Li L. Beyond regulations at DNA levels: a review of epigenetic therapeutics targeting cancer stem cells. Cell Prolif. 2021;54:e12963. doi:10.1111/cpr.12963
5. Santofimia-Castano P, Iovanna J. Combating pancreatic cancer chemoresistance by triggering multiple cell death pathways. Pancreatology. 2021;21:522–529. doi:10.1016/j.pan.2021.01.010
6. Martinez-Useros J, Martin-Galan M, Garcia-Foncillas J. The match between molecular subtypes, histology and microenvironment of pancreatic cancer and its relevance for chemoresistance. Cancers. 2021;14:13. doi:10.3390/cancers14010013
7. Lin Z, Fan Z, Zhang X, Wan J, Liu T. Cellular plasticity and drug resistance in sarcoma. Life Sci. 2020;263:118589. doi:10.1016/j.lfs.2020.118589
8. Nunes SC. Tumor microenvironment - selective pressures boosting cancer progression. Adv Exp Med Biol. 2020;1219:35–49.
9. Farrell JJ, Elsaleh H, Garcia M, et al. Human equilibrative nucleoside transporter 1 levels predict response to gemcitabine in patients with pancreatic cancer. Gastroenterology. 2009;136:187–195. doi:10.1053/j.gastro.2008.09.067
10. Buchholz SM, Goetze RG, Singh SK, et al. Depletion of macrophages improves therapeutic response to gemcitabine in murine pancreas cancer. Cancers. 2020;12:1978. doi:10.3390/cancers12071978
11. Muralidharan-Chari V, Kohan HG, Asimakopoulos AG, et al. Microvesicle removal of anticancer drugs contributes to drug resistance in human pancreatic cancer cells. Oncotarget. 2016;7:50365–50379. doi:10.18632/oncotarget.10395
12. Farran B, Nagaraju GP. Exosomes as therapeutic solutions for pancreatic cancer. Drug Discov Today. 2020;25:2245–2256. doi:10.1016/j.drudis.2020.09.037
13. Dhayat SA, Mardin WA, Seggewiss J, et al. MicroRNA profiling implies new markers of gemcitabine chemoresistance in mutant p53 pancreatic ductal adenocarcinoma. PLoS One. 2015;10:e0143755. doi:10.1371/journal.pone.0143755
14. Zhang X, Zhao P, Wang C, Xin B. SNHG14 enhances gemcitabine resistance by sponging miR-101 to stimulate cell autophagy in pancreatic cancer. Biochem Biophys Res Commun. 2019;510:508–514. doi:10.1016/j.bbrc.2019.01.109
15. Jiang W, Zhao S, Shen J, et al. The MiR-135b-BMAL1-YY1 loop disturbs pancreatic clockwork to promote tumourigenesis and chemoresistance. Cell Death Dis. 2018;9:149. doi:10.1038/s41419-017-0233-y
16. Eblen ST. Regulation of chemoresistance via alternative messenger RNA splicing. Biochem Pharmacol. 2012;83:1063–1072. doi:10.1016/j.bcp.2011.12.041
17. Amponsah PS, Fan P, Bauer N, et al. microRNA-210 overexpression inhibits tumor growth and potentially reverses gemcitabine resistance in pancreatic cancer. Cancer Lett. 2017;388:107–117. doi:10.1016/j.canlet.2016.11.035
18. Costa-Silva B, Aiello NM, Ocean AJ, et al. Pancreatic cancer exosomes initiate pre-metastatic niche formation in the liver. Nat Cell Biol. 2015;17:816–826. doi:10.1038/ncb3169
19. Neesse A, Michl P, Frese KK, et al. Stromal biology and therapy in pancreatic cancer. Gut. 2011;60:861–868. doi:10.1136/gut.2010.226092
20. Kha ML, Hesse L, Deisinger F, et al. The antioxidant transcription factor Nrf2 modulates the stress response and phenotype of malignant as well as premalignant pancreatic ductal epithelial cells by inducing expression of the ATF3 splicing variant DeltaZip2. Oncogene. 2019;38:1461–1476. doi:10.1038/s41388-018-0518-3
21. Wall NR, O’Connor DS, Plescia J, Pommier Y, Altieri DC. Suppression of survivin phosphorylation on Thr34 by flavopiridol enhances tumor cell apoptosis. Cancer Res. 2003;63:230–235.
22. Fortugno P, Wall NR, Giodini A, et al. Survivin exists in immunochemically distinct subcellular pools and is involved in spindle microtubule function. J Cell Sci. 2002;115:575–585. doi:10.1242/jcs.115.3.575
23. Giodini A, Kallio MJ, Wall NR, et al. Regulation of microtubule stability and mitotic progression by survivin. Cancer Res. 2002;62:2462–2467.
24. Li F, Ambrosini G, Chu EY, et al. Control of apoptosis and mitotic spindle checkpoint by survivin. Nature. 1998;396:580–584. doi:10.1038/25141
25. Altieri DC. Blocking survivin to kill cancer cells. Methods Mol Biol. 2003;223:533–542. doi:10.1385/1-59259-329-1:533
26. Mesri M, Wall NR, Li J, Kim RW, Altieri DC. Cancer gene therapy using a survivin mutant adenovirus. J Clin Invest. 2001;108:981–990. doi:10.1172/JCI200112983
27. O’Connor DS, Wall NR, Porter AC, Altieri DC. A p34(cdc2) survival checkpoint in cancer. Cancer Cell. 2002;2:43–54. doi:10.1016/S1535-6108(02)00084-3
28. Rauch A, Carlstedt A, Emmerich C, et al. Survivin antagonizes chemotherapy-induced cell death of colorectal cancer cells. Oncotarget. 2018;9:27835–27850. doi:10.18632/oncotarget.25600
29. Wang W, Zhang B, Mani AM, et al. Survivin inhibitors mitigate chemotherapeutic resistance in breast cancer cells by suppressing genotoxic nuclear factor-kappaB activation. J Pharmacol Exp Ther. 2018;366:184–193. doi:10.1124/jpet.118.249151
30. Lorenzetti MA, Mosna MJ, De Matteo EN, et al. Overexpression of survivin in pediatric Hodgkin lymphoma tumor cells: characterization of protein expression and splice-variants transcription profile. Exp Mol Pathol. 2019;108:24–31. doi:10.1016/j.yexmp.2019.03.005
31. Sah NK, Seniya C. Survivin splice variants and their diagnostic significance. Tumour Biol. 2015;36:6623–6631. doi:10.1007/s13277-015-3865-5
32. Khan S, Bennit HF, Turay D, et al. Early diagnostic value of survivin and its alternative splice variants in breast cancer. BMC Cancer. 2014;14:176. doi:10.1186/1471-2407-14-176
33. Necochea-Campion R, Chen CS, Mirshahidi S, Howard FD, Wall NR. Clinico-pathologic relevance of Survivin splice variant expression in cancer. Cancer Lett. 2013;339:167–174. doi:10.1016/j.canlet.2013.06.007
34. Kabagwira J, Wall NR. An argument to examine exosomal survivin splice variant expression and patient survival in pancreatic cancer. Clin Oncol. 2017;2:1–10.
35. Mokuda S, Miyazaki T, Ito Y, et al. The proto-oncogene survivin splice variant 2B is induced by PDGF and leads to cell proliferation in rheumatoid arthritis fibroblast-like synoviocytes. Sci Rep. 2015;5:9795. doi:10.1038/srep09795
36. Moore AS, Alonzo TA, Gerbing RB, et al. BIRC5 (survivin) splice variant expression correlates with refractory disease and poor outcome in pediatric acute myeloid leukemia: a report from the Children’s Oncology Group. Pediatr Blood Cancer. 2014;61:647–652. doi:10.1002/pbc.24822
37. Norton J, Foster D, Chinta M, Titan A, Longaker M. Pancreatic Cancer Associated Fibroblasts (CAF): under-explored target for pancreatic cancer treatment. Cancers. 2020;12:1347.
38. Voulgari A, Pintzas A. Epithelial-mesenchymal transition in cancer metastasis: mechanisms, markers and strategies to overcome drug resistance in the clinic. Biochim Biophys Acta. 2009;1796:75–90. doi:10.1016/j.bbcan.2009.03.002
39. Zhou X, Cao B, Lu H. Negative auto-regulators trap p53 in their web. J Mol Cell Biol. 2017;9:62–68. doi:10.1093/jmcb/mjx001
40. Vivas-Mejia PE, Rodriguez-Aguayo C, Han HD, et al. Silencing survivin splice variant 2B leads to antitumor activity in taxane--resistant ovarian cancer. Clin Cancer Res. 2011;17:3716–3726. doi:10.1158/1078-0432.CCR-11-0233
41. Altieri DC. Targeting survivin in cancer. Cancer Lett. 2013;332:225–228. doi:10.1016/j.canlet.2012.03.005
42. Virrey JJ, Guan S, Li W, et al. Increased survivin expression confers chemoresistance to tumor-associated endothelial cells. Am J Pathol. 2008;173:575–585. doi:10.2353/ajpath.2008.071079
43. Khan S, Aspe JR, Asumen MG, et al. Extracellular, cell-permeable survivin inhibits apoptosis while promoting proliferative and metastatic potential. Br J Cancer. 2009;100:1073–1086. doi:10.1038/sj.bjc.6604978
44. Blanc-Brude OP, Mesri M, Wall NR, et al. Therapeutic targeting of the survivin pathway in cancer: initiation of mitochondrial apoptosis and suppression of tumor-associated angiogenesis. Clin Cancer Res. 2003;9:2683–2692.
45. van der Greef J, McBurney RN. Innovation: rescuing drug discovery: in vivo systems pathology and systems pharmacology. Nat Rev Drug Discov. 2005;4:961–967. doi:10.1038/nrd1904
46. Mishra R, Palve V, Kannan S, Pawar S, Teni T. High expression of survivin and its splice variants survivin DeltaEx3 and survivin 2 B in oral cancers. Oral Surg Oral Med Oral Pathol Oral Radiol. 2015;120:497–507. doi:10.1016/j.oooo.2015.06.027
47. Laka K, Makgoo L, Mbita Z. Survivin splice variants in arsenic trioxide (As(2)O(3))-Induced Deactivation of PI3K and MAPK cell signalling pathways in MCF-7 Cells. Genes. 2019;10:41. doi:10.3390/genes10010041
48. Sawicka-Gutaj N, Waligorska-Stachura J, Andrusiewicz M, et al. Nicotinamide phosphorybosiltransferase overexpression in thyroid malignancies and its correlation with tumor stage and with survivin/survivin DEx3 expression. Tumour Biol. 2015;36:7859–7863. doi:10.1007/s13277-015-3506-z
49. Wajapeyee N, Britto R, Ravishankar HM, Somasundaram K. Apoptosis induction by activator protein 2alpha involves transcriptional repression of Bcl-2. J Biol Chem. 2006;281:16207–16219. doi:10.1074/jbc.M600539200
50. Caldas H, Honsey LE, Altura RA. Survivin 2alpha: a novel Survivin splice variant expressed in human malignancies. Mol Cancer. 2005;4:11. doi:10.1186/1476-4598-4-11
51. Caldas H, Jiang Y, Holloway MP, et al. Survivin splice variants regulate the balance between proliferation and cell death. Oncogene. 2005;24:1994–2007.
52. Pavlyukov MS, Antipova NV, Balashova MV, et al. Survivin monomer plays an essential role in apoptosis regulation. J Biol Chem. 2011;286:23296–23307. doi:10.1074/jbc.M111.237586
53. Engelsma D, Rodriguez JA, Fish A, Giaccone G, Fornerod M. Homodimerization antagonizes nuclear export of survivin. Traffic. 2007;8:1495–1502. doi:10.1111/j.1600-0854.2007.00629.x
54. de Necochea-Campion R, Ghochikyan A, Josephs SF, et al. Expression of the epigenetic factor BORIS (CTCFL) in the human genome. J Transl Med. 2011;9:213. doi:10.1186/1479-5876-9-213
55. Li F, Altieri DC. Transcriptional analysis of human survivin gene expression. Biochem J. 1999;344(Pt 2):305–311. doi:10.1042/bj3440305
56. Galloway NR, Ball KF, Stiff T, Wall NR. Yin Yang 1 (YY1): regulation of survivin and its role in invasion and metastasis. Crit Rev Oncog. 2017;22:23–36. doi:10.1615/CritRevOncog.2017020836
57. Galloway NR, Diaz Osterman CJ, Reiber K, et al. Yin Yang 1 regulates the transcriptional repression of Survivin. Biochem Biophys Res Commun. 2014;445:208–213. doi:10.1016/j.bbrc.2014.01.169
58. Zhu N, Gu L, Findley HW, Li F, Zhou M. An alternatively spliced survivin variant is positively regulated by p53 and sensitizes leukemia cells to chemotherapy. Oncogene. 2004;23:7545–7551. doi:10.1038/sj.onc.1208038
59. Mirza A, McGuirk M, Hockenberry TN, et al. Human survivin is negatively regulated by wild-type p53 and participates in p53-dependent apoptotic pathway. Oncogene. 2002;21:2613–2622. doi:10.1038/sj.onc.1205353
60. Hoffman WH, Biade S, Zilfou JT, Chen J, Murphy M. Transcriptional repression of the anti-apoptotic survivin gene by wild type p53. J Biol Chem. 2002;277:3247–3257. doi:10.1074/jbc.M106643200
61. Vegran F, Boidot R, Oudin C, et al. Association of p53 gene alterations with the expression of antiapoptotic survivin splice variants in breast cancer. Oncogene. 2007;26:290–297. doi:10.1038/sj.onc.1209784
62. Esteve PO, Chin HG, Pradhan S. Human maintenance DNA (cytosine-5)-methyltransferase and p53 modulate expression of p53-repressed promoters. Proc Natl Acad Sci U S A. 2005;102:1000–1005. doi:10.1073/pnas.0407729102
63. Krieg A, Mahotka C, Krieg T, et al. Expression of different survivin variants in gastric carcinomas: first clues to a role of survivin-2B in tumour progression. Br J Cancer. 2002;86:737–743. doi:10.1038/sj.bjc.6600153
64. Yamada Y, Kuroiwa T, Nakagawa T, et al. Transcriptional expression of survivin and its splice variants in brain tumors in humans. J Neurosurg. 2003;99:738–745. doi:10.3171/jns.2003.99.4.0738
65. Kappler M, Kohler T, Kampf C, et al. Increased survivin transcript levels: an independent negative predictor of survival in soft tissue sarcoma patients. Int J Cancer. 2001;95:360–363. doi:10.1002/1097-0215(20011120)95:6<360::aid-ijc1063>3.0.co;2-1
66. Faris JE, Blaszkowsky LS, McDermott S, et al. FOLFIRINOX in locally advanced pancreatic cancer: the massachusetts general hospital cancer center experience. Oncologist. 2013;18:543–548. doi:10.1634/theoncologist.2012-0435
 © 2022 The Author(s). This work is published and licensed by Dove Medical Press Limited. The full terms of this license are available at https://www.dovepress.com/terms.php and incorporate the Creative Commons Attribution - Non Commercial (unported, v3.0) License.
By accessing the work you hereby accept the Terms. Non-commercial uses of the work are permitted without any further permission from Dove Medical Press Limited, provided the work is properly attributed. For permission for commercial use of this work, please see paragraphs 4.2 and 5 of our Terms.
© 2022 The Author(s). This work is published and licensed by Dove Medical Press Limited. The full terms of this license are available at https://www.dovepress.com/terms.php and incorporate the Creative Commons Attribution - Non Commercial (unported, v3.0) License.
By accessing the work you hereby accept the Terms. Non-commercial uses of the work are permitted without any further permission from Dove Medical Press Limited, provided the work is properly attributed. For permission for commercial use of this work, please see paragraphs 4.2 and 5 of our Terms.