")
Back to Journals » International Journal of Nanomedicine » Volume 15
Surfactin-Loaded ĸ-Carrageenan Oligosaccharides Entangled Cellulose Nanofibers as a Versatile Vehicle Against Periodontal Pathogens
Authors Johnson A , He JL , Kong F, Huang YC, Thomas S, Lin HTV , Kong ZL
Received 13 November 2019
Accepted for publication 9 March 2020
Published 9 June 2020 Volume 2020:15 Pages 4021—4047
DOI https://doi.org/10.2147/IJN.S238476
Checked for plagiarism Yes
Review by Single anonymous peer review
Peer reviewer comments 3
Editor who approved publication: Dr Linlin Sun
Athira Johnson,1 Jia-Ling He,1 Fanbin Kong,2 Yi-Cheng Huang,1 Sabu Thomas,3 Hong-Ting Victor Lin,1 Zwe-Ling Kong1
1Department of Food Science, National Taiwan Ocean University, Keelung 20224, Taiwan; 2Department of Food Science and Technology, University of Georgia, GA 30602, U.S.A; 3School of Chemical Sciences, Mahatma Gandhi University, Kottayam, Kerala 686560, India
Correspondence: Zwe-Ling Kong
Department of Food Science, National Taiwan Ocean University, Pei-Ning Road, Keelung City 20224, Taiwan, People’s Republic of China
Tel + 886-2-2462-2192
Fax + 886-2-2463-4203
Email [email protected]
Purpose: Periodontitis is a chronic inflammatory disease associated with microbial accumulation. The purpose of this study was to reuse the agricultural waste to produce cellulose nanofibers (CNF) and further modification of the CNF with κ-carrageenan oligosaccharides (CO) for drug delivery. In addition, this study is focused on the antimicrobial activity of surfactin-loaded CO-CNF towards periodontal pathogens.
Materials and Methods: A chemo-mechanical method was used to extract the CNF and the modification was done by using CO. The studies were further proceeded by adding different quantities of surfactin [50 mg (50 SNPs), 100 mg (100 SNPs), 200 mg (200 SNPs)] into the carrier (CO-CNF). The obtained materials were characterized, and the antimicrobial activity of surfactin-loaded CO-CNF was evaluated.
Results: The obtained average size of CNF and CO-CNF after ultrasonication was 263 nm and 330 nm, respectively. Microscopic studies suggested that the CNF has a short diameter with long length and CO became cross-linked to form as beads within the CNF network. The addition of CO improved the degradation temperature, crystallinity, and swelling property of CNF. The material has a controlled drug release, and the entrapment efficiency and loading capacity of the drug were 53.15 ± 2.36% and 36.72 ± 1.24%, respectively. It has antioxidant activity and inhibited the growth of periodontal pathogens such as Streptococcus mutans and Porphyromonas gingivalis by preventing the biofilm formation, reducing the metabolic activity, and promoting the oxidative stress.
Conclusion: The study showed the successful extraction of CNF and modification with CO improved the physical parameters of the CNF. In addition, surfactin-loaded CO-CNF has potential antimicrobial activity against periodontal pathogens. The obtained biomaterial is economically valuable and has great potential for biomedical applications.
Keywords: periodontitis, cellulose nanofibers, κ-carrageenan oligosaccharides, drug delivery, antimicrobial activity
Introduction
Periodontitis is a chronic inflammatory disease associated with the loss of protective and supportive tissue called the periodontium. During this condition, inflammatory mediators such as interleukin-1β (IL-1β), interleukin-6 (IL-6) and tumor necrosis factor-alpha (TNF-α) are produced.1,2 Periodontitis is characterized by plaque accumulation, calculus formation, gingival redness and swelling, gingival bleeding, and loss of associated tissues.3 World Health Organization (WHO) stated that between 35% and 50% of the world population are affected by periodontitis.4 Age, smoking, sex, tooth level, and genetics, etc. can affect the formation and progression of periodontitis.5 Bacterial colonization and their interaction with host immune responses are responsible for inflammation in the gingiva and periodontium. Porphyromonas gingivalis, Treponema denticola, and Tannerella forsythia are some of the anaerobic bacteria known to promote periodontitis conditions.4 Along with this, Prevotella nigrescens, Eikenella corrodens, Fusobacterium nucleatum, Streptococcus mutans, and Campylobacter rectus play a role in the progression of periodontitis.6 Some of the diseases such as diabetes, atherosclerotic cardiovascular disease, cancer, rheumatoid arthritis, respiratory disease, chronic kidney disease, metabolic syndrome, obesity, and cognitive impairment are linked to periodontitis.7 Usually, the use of antibiotics, surgery, the practice of oral hygiene, subgingival scaling, root planning, etc. are used for periodontitis treatments but most of them are associated with side effects and pain.8
Soybean (Glycine max) is an economically important crop used for the production of various foods such as soy sauce, soymilk, tofu, soybean oil, and soy flour, etc.9 Soybean curd residue (SCR) is the main waste material obtained after the processing of soybean products. It consists of approximately 50–60% carbohydrates, 15–30% proteins, 5–20% fat, and 3% ash.10 It was noted that SCR is rich in cellulose and approximately 50% of the dry weight of soybean-containing cellulose.9 Nowadays, SCR is usually used as a feed for animals or abandoned directly to the soil. It is highly susceptible to putrefaction and produces carbon dioxide (CO2) during burning.9 The reduction of this kind of agricultural waste through the production of biopolymers is considered as a feasible idea for waste reduction and environmental protection.11
Cellulose (C6H10O5)n is the main constituent of the plants and also present in some bacteria, fungi, animals, and algae. It is the most abundant natural polymer in the earth and composed of several hundred to many thousands of β (1→4) linked D-glucose units. Anselme Payen, a French chemist discovered and isolated cellulose from green plants in 1938.12 It is insoluble in water and present in almost all parts of the plant such as stem, leaves, and stalks. Nowadays, different nanostructures are widely synthesized for biomedical applications based on their biocompatibility, stability, and the ability for controlled drug release. The nano form of cellulose (nanocellulose) has certain properties such as the high surface area to volume ratio, flexibility, high mechanical strength, thermostability, and good biodegradability which allow them to act as the suitable material for pharmaceutical applications. Along with this, it overcomes certain disadvantages of the cellulose such the poor thermal stability, absorption of the moisture, and non-compatibility.13 Nanocellulose-based materials have a wide application in biomedical fields such as the production of scaffolds, drug delivery, blood vessel replacement, and tissue regeneration, etc.14 CNF, cellulose nanocrystals (CNC), and bacterial cellulose (BC) are the major types of nanocellulose that existed. CNCs are rod-shaped particles (3–5 nm wide, 50–500 nm in length) and highly crystalline in nature.15 CNF has a length in micrometer and width in the nanometer range and they have the ability to form a network structure.14 CNF can be prepared by chemical (acid digestion, oxidation), physical (using ultrasonication, homogenization, and cryo-crushing), and biological methods (treated with cellulolytic enzymes).13,16 The extraction of nanocellulose from different plant sources such as rice husk fibers, sisal fibers, coconut husk fibers, pineapple leaf, and sugarcane bagasse, etc. has been reported.11,17–19 Currently, nanocellulose-based materials are used for biomedical applications including wound healing, bone regeneration, cartilage regeneration, dental applications, and cancer disease treatment, etc.20 CNF-based films, composites, and gels largely come under clinical applications because of their easy production, low cost, and biocompatibility.21
It has been reported that the surface modification of CNF reduces its agglomeration, enhance reinforcement, limit moisture absorbance, and increase the biocompatibility.22,23 The presence of a large number of hydroxyl (-OH) groups on nanocellulose facilitates surface modification by polymer grafting, esterification, carboxylation, cationization, and silylation.20 Carrageenan is an anionic polymer extracted from certain marine red algae and it is composed of alternating units of D-galactose and 3,6-anhydrogalactose joined by α-1,3 and β-1,4 glycosidic linkage.24 Carrageenan is mainly categorized into iota (two sulfate groups per disaccharide repeating unit), lambda (three sulfate groups per disaccharide repeating unit), and kappa (one sulfate groups per disaccharide repeating unit) carrageenan.24 ĸ-Carrageenan is one form of carrageenan contains a 3, 6-anhydro-α-D-galactopyranose in place of α-D-galactopyranose.25 It has high biocompatibility, hydrophilicity, and biodegradability.26 It is dissolved only in hot water and breakdown in acidic conditions. The gelation property of the carrageenan is primarily due to the presence of anhydrobridges and the chemical reactivity is due to their half-ester sulfate groups which are strongly anionic in nature.24 Both kappa and iota carrageenan form a gel in the presence of potassium or calcium ions. κ-carrageenan-based drug delivery systems are used in tissue engineering, drug delivery, and wound dressing applications.27
Surfactin is an amphiphilic, cyclic, lipopeptide type biosurfactant produced by various strains of Bacillus subtilis. It has a common peptide loop of seven amino acids (l-asparagine, l-leucine, glutamic acid, l-leucine, l-valine, and two d-leucines) with a long hydrophobic fatty acid chain. Surfactin is well known for its anti-inflammatory, antiviral, antifungal, anti-mycoplasma, and antibacterial properties.28 The lipid chain length and charge of hydrophilic head group are the important factors that determining the antimicrobial activity of surfactin. It is also noted that the activity of surfactin is varied according to the type of bacteria.29 The previous study reported the growth inhibition of Klebsiella pneumoniae, Salmonella typhimurium NCTC 74, Staphylococcus aureus ATCC 6538, and Escherichia coli NCTC 10418 by surfactin.30
Drug delivery is a method of administrating pharmaceutical compounds into the human/animal body with enhanced efficacy and controlled release. There are a lot of nanomaterials used for treating dental diseases such as carbon nanotubes, graphene, silica, iron oxide, etc.31 Carbon nanotubes are mainly used for tooth filling. But it induces inflammatory and fibrotic reactions by crossing membrane barriers. Graphene and silica also have toxicity.31 The present study is focused on the extraction of CNF from SCR and its modification with CO for developing a drug delivery system by incorporating surfactin into it. The results from this study provided the primary information about the characterization and biocompatibility of both CNF and ĸ-carrageenan oligosaccharides linked cellulose nanofibers (CO-CNF) and evaluated the potential antimicrobial activity of CO-CNF after the addition of surfactin against periodontal pathogens. We hypothesized that the extraction of CNF from SCR could be an effective method to reduce the agricultural waste and the degradation temperature, crystallinity, swelling property, and biocompatibility of the CNF were improved after the addition of CO. The proposed material has control over surfactin release. Furthermore, surfactin-loaded CO-CNF exhibited a desirable antimicrobial activity against periodontal pathogens. Surfactin-loaded CO-CNF has great potential in drug delivery, because of its hydrophilic nature, biocompatibility, controlled release, antimicrobial activity. It was assumed that this material can be used as an oral formulation in the future. But, further studies such as in vitro anti-inflammatory studies and in vivo studies are required to evaluate the potential of this material.
Materials and Methods
Materials
Streptococcus mutans (ATCC 25175) and Porphyromonas gingivalis (CCUG 25211), RAW 264.7 macrophage cell line were purchased from Bioresource Collection and Research Center (BCRC), Hsinchu, Taiwan. Soybean curd residue was obtained from Kuang Chuan Dairy Co., Ltd, Taipei, Taiwan. ĸ-Carrageenan oligosaccharides were purchased from Dah Chung Trading Co., Ltd, Taipei, Taiwan. Sulfuric acid was purchased from Panreac Química S.L.U., Barcelona, Spain. Sodium hypochlorite was purchased from Honeywell Fluka™, New Jersey, USA. Sodium hydroxide, potassium bromide, uranyl acetate, 3-(4,5-dimethylthiazol-2-yl)-2,5-diphenyl tetrazolium bromide, dimethyl sulfoxide, tryptic soy broth, surfactin, N, N′-Methylenebisacrylamide, 2,2-diphenyl-1-picrylhydrazyl, Trolox, crystal violet, acridine orange, trichloroacetic acid, and thiobarbituric acid were purchased from Sigma-Aldrich, Louis, Missouri, USA. Hydrochloric acid was purchased from Panreac AppliChem, Darmstadt, Germany. Potassium chloride and 1-butanol were purchased from J. T. Baker, Phillipsburg, Texas, USA. Doxycycline was purchased from Swiss Pharmaceuticals Co., Ltd., Tainan, Taiwan. Tween 80 was obtained from Hayashi Pure Chemical Industries Ltd., Japan. Methanol was purchased from Honeywell Burdick & Jackson, Muskegon, Michigan, USA.
Methods
Extraction and Modification of Cellulose Nanofibers (CNF)
Samples of soybean curd residue were analyzed for moisture, ash, hemicellulose, cellulose, and lignin content. The ash and moisture contents were evaluated by following the standard methods published by the Association of Official Analytical Chemists (AOAC).32 The moisture content was estimated by measuring the weight loss after the sample placed at 105°C for 2 h. The ash content was determined by keeping the sample in an oven at 600°C for 2 h. The hemicellulose, cellulose, and lignin content were measured according to Maryana et al.33 Briefly, 2 g (a) of the sample was refluxed with 150 mL of distilled water in a water bath (Buchi 461, Flawil, Switzerland) at 100°C for 1 h. Later, the obtained solution was filtered, washed, dried, and weighed (b). Later, the residue was added to 150 mL of 1 N sulfuric acid (H2SO4) and kept in a water bath at 100°C for 1 h. The resultant was filtered, washed, and dried (c). After, the dried residue was soaked in 10 mL of 72% H2SO4 for 4 h and later refluxed with 150 mL of 1 N H2SO4 for 1 h. Later, the solution was neutralized by adding cold water. The residue was collected, washed, and dried (d). Finally, the obtained residue was kept in an oven at 600°C and weighed (e). All experiments were performed triplicates. Moisture, ash, hemicellulose, cellulose, and lignin content were calculated according to the following equations:
(1) (2) (3) (4) (5)

W1: Weight of the sample before drying (g); W2: Weight of the sample after drying (g); A: Weight of the sample before heating (g); B: Weight of the sample after heating (g).
The extraction of CNF from SCR was performed according to previously reported methods.34–36 20 g of dried soybean residue was stirred with 250 mL of 5% of sodium hydroxide (NaOH) for 2 h at 120°C. The process was repeated once again and washed with distilled water. Later, the obtained residue was treated with 250 mL of 1 M hydrochloric acid (HCl) at 80°C for 2 h. After washing, the above solution was bleached with 250 mL of 5% sodium hypochlorite (NaClO) solution at 50°C. The bleaching was continued until getting a white-colored solution. The solution was then washed with distilled water and hydrolyzed with 250 mL of 64% H2SO4 under strong agitation conditions (45°C for 2 h). The reaction was terminated by adding an excess amount of cold water. After centrifugation (8000 × g, 10 min) (Kubota 5100, Osaka, Japan), the obtained solution was dialyzed against distilled water for 5 days. The dialyzed solution was then homogenized (Polytron Kinematica Homogenizer PT 3000, Luzern Switzerland) at 11,000 rpm for 2 h and freeze-dried (Freeze drying system FD4.5, KINGMECH, Taipei, Taiwan). The extraction yield was calculated from the following equation:
(6)
The modification was done according to Espino-Perez et al, with some alterations.22 One gram of CO was dissolved in 100 mL distilled water and added to 100 mL of CNF (30 mg/mL). The obtained solution was stirred at 80°C for 30 min. Later, 50 mL of 1 M potassium chloride (KCl) solution was added drop-wisely to the above solution under strong agitation conditions (800 rpm, 80°C). The agitation was continued for 3 h. After complete gelation, the solids were collected by centrifugation (8000 × g, 10 min) and sonicated (HOYU Ultrasonic 250, Taiwan). The obtained samples were washed with distilled water and freeze-dried to get CO-CNF.
The particle size, zeta potential, and polydispersity index (PDI) of the samples were measured using zeta sizer (Malvern Panalytical, Malvern, UK). The aqueous suspensions [1:100 (v/v)] of the samples were prepared by dispersing the samples in deionized water and ultrasonicated for 30 min (HOYU Ultrasonic 250, Taiwan).
The morphology of the samples was analyzed by SEM. Samples were placed in a metal stud using double-sided tape and coated with a fine layer of gold using a sputter gold coater (Model-E1010 Ion sputter). Sample micrographs were observed at different magnifications at an accelerating voltage of 15 kV (S-4800 Scanning Electron Microscope, HITACHI, Tokyo, Japan).
For TEM analysis, 30 μL of sample solutions were added to the copper grid and allowed to stand for 5 min. Later, excessive water was removed and negatively stained with 2% (w/v) of uranyl acetate. The grid was dried at 40°C overnight. The grid was analyzed in a TEM (HT7700 Transmission Electron Microscope, HITACHI, Tokyo, Japan) operated with an accelerated voltage of 75Kv.
The FTIR experiments were conducted using an FTIR spectrometer (BRUKER, TENSOR II, Massachusetts, USA) by potassium bromide (KBr) disc method. The samples were dried, ground and pelletized using KBr (1:100, w/w). The film was then introduced in the spectrometer. Each spectrum was analyzed in the range of wavenumber from 400 to 4000 cm−1 with a resolution of 4 cm−1 and a total of 64 scans were performed.
The thermal degradation behavior of samples (5 mg) was evaluated using a TGA instrument (NETZSCH TG 209F3, Germany). The thermal stability of samples was conducted at 40−600°C with a constant heating rate of 20°C/min under nitrogen atmosphere.
The powder X-ray diffraction patterns were measured at ambient temperature using Cu Kα radiation (λ = 0.15418 nm) over the 2θ range of 5° and 40° with a scanning speed of 1.2°/min. The instrument (Bruker, D2 Phaser instrument, Taiwan) was operated at 45 kV and 40 mA with a step size of 0.02°C. The crystallinity index (CI) of the samples was calculated by the following equation:
(7)
I002 is the intensity value for the crystalline cellulose and Iam is the intensity value for the amorphous cellulose.
A 0.3 g of samples were dissolved in 25 mL of distilled water in a centrifuge tube. The solution was shaken for 10 min and centrifuged at 3000 rpm for 30 min. After removing the water, the precipitate with the centrifuge tube has weighed.37 The experiment was performed in triplicates. The WHC was calculated by the following equation:
(8)
The dried samples were immersed in distilled water for 0 to 12 h at room temperature to reach the equilibrium status. Then, the water was removed from the surface and immediately taken to measure the weight. All experiment was performed in triplicate.38 The Swelling ratio was calculated by the following equation:
(9)
Wdry = Weight of hydrogel in dry condition
Wtotal = Weight of swelled hydrogel
The biocompatibility of samples was tested in RAW 264.7 macrophage cells. Cells were cultured in Dulbecco’s modified Eagle medium (DMEM) supplemented with fetal bovine serum (FBS) and maintained at 37°C in a humidified incubator containing 5% CO2 (Napco 5410, Taipei, Taiwan). The cell viability of the samples was evaluated using 3-(4,5-dimethylthiazol-2-yl)-2,5-diphenyl tetrazolium bromide (MTT) reagent. One hundred microliters of cells (1 × 10⁴ cells/well) were cultured in 96-well plate for 24 h in a 5% CO2 (37°C) incubator. Later, the medium was aspirated from each well and the cells were treated with different concentrations of samples (diluted in medium). After 24 h of incubation, 100 µL of MTT (1 mg/mL) was added and incubated for 4 h. The MTT was removed and solubilized the formazan crystals by adding 200 µL of dimethyl sulfoxide (DMSO). After 15 min, the absorbance was measured at 570 nm (ELISA Reader, Thermo Fisher 1510, Germany). The percentage of cell viability was calculated by the following equation:
(10)
Preparation of Surfactin-Loaded CO-CNF Particles
The encapsulation was performed according to Ghaderi-Ghahfarokhi et al,39 with some modifications. Fifty milliliters of CO-CNF (3.2 mg/mL) was prepared by dissolving it in distilled water by sonication. Two hundred μL of tween 80 was added as a surfactant and stirred the solution at 60°C for 1 h to obtain a homogeneous mixture. Stock solutions of surfactin were prepared by dissolving each quantity of surfactin (50,100, and 200 mg) into 2 mL of methanol. Later, the oil phase (CO-CNF) was added to the aqueous phase (surfactin solution) drop by drop under the vigorous stirring condition for 20 min. Afterwards, 8 mL of N, N′-methylenebisacrylamide (MBAA) (1.87 mg/mL) was added as a stabilizer and continued the agitation for 2 h. Nanoparticles [50 SNPs (50 mg surfactin-loaded CO-CNF nanoparticles), 100 SNPs (100 mg surfactin-loaded CO-CNF nanoparticles), and 200 SNPs (200 mg surfactin-loaded CO-CNF nanoparticles)] were obtained after sonication (HOYU Ultrasonic 250, Taiwan) for 1 h. The particles were collected and freeze-dried. DLS, SEM, FTIR, and cell viability were performed according to the above-said methods.
The EE and LC of the nanoparticle were determined by using the centrifugation method. One milliliter of nanoparticle (15 mg/mL) suspension was centrifuged at 3500 rpm for 10 min. The free drugs were taken and performed high-pressure liquid chromatography (HPLC) (JASCO, Eaton, Maryland, USA) to evaluate EE and LC.40 For in vitro drug release, 1 mL of nanoparticle (15 mg/mL) was enclosed in a dialysis bag (12 kDa) and kept in 30 mL phosphate buffer solution (PBS) (pH 6.5) at 37°C for different time intervals (0, 1, 2, 4, 6, 8, 12, and 24 h) under mild agitation condition (100 rpm). At each time interval, 1 mL of medium was withdrawn and replace it with 1 mL of fresh PBS. Each experiment was performed in triplicate and the samples were analyzed by HPLC. The UV detection wavelength for HPLC analysis was set at 210 nm andC18 column Phenomenex (250 mm × 4.6 mm, 5 µm) was used for the analysis. The mobile phase A was consisting of trifluoracetic acid and water (0.05:99.95) (v/v). Mobile phase B was consisting of a mixture of acetonitrile, water, and trifluoracetic acid (80:19.95:0.05) (v/v). The column temperature was kept at 30°C and the flow rate was 1.2 mL/min.40,41
(11) (12)
The radical scavenging activity of samples was conducted according to a previously reported method.42 A 0.004 g of DPPH was dissolved in 100 mL of methanol. One hundred microliters of this solution was mixed with 100 µL of each sample in a 96-well plate. The sample concentration was 10 mg/mL doxycycline, 10 mg/mL surfactin, 20 mg/mL CO-CNF, 20 mg/mL 50 SNPs, 20 mg/mL 100 SNPs, and 20 mg/mL 200 SNPs. Trolox (0.5 mg/mL) was taken as the standard and methanol was used as the blank. After 30 min of incubation in the dark, the absorbance was measured at 517 nm. The DPPH radical scavenging activity of samples was evaluated by the following equation:
(13)
where Acontrol is the mixture of methanol and DPPH solution; Asample is the mixture of tested sample and DPPH solution.
S. mutans (ATCC 25175) and P. gingivalis (CCUG 25211) were purchased from Bioresource Collection and Research Center (BCRC), Hsinchu, Taiwan. The obtained bacteria were transferred separately to a 5 mL tryptic soy broth (TSB) and incubated overnight at 37°C for 3 days.
Ten microliters of vortexed bacterial suspension (1 × 10⁷ CFU/mL) were swabbed on tryptic soy agar (TSA) plate. Poured 100 µL of each sample solution on to a well-prepared agar plate. Water and doxycycline were taken as negative and positive control, respectively. The sample concentration was 10 mg/mL doxycycline, 10 mg/mL surfactin, 20 mg/mL CO-CNF, 20 mg/mL 50 SNPs, 20 mg/mL 100 SNPs, and 20 mg/mL 200 SNPs. The plates were incubated at 37°C for 24 h in the CO2 incubator. The experiment was performed in triplicates and the zone of inhibition was measured.43
The MIC and MBC were determined according to a previously reported method.44 Eighty microliters of samples (serially diluted with sterile TSB) were added to a 96-well plate. Afterwards, it was inoculated separately with 120 μL of bacterial culture (1 × 10⁵ CFUs/mL). Plates were incubated at 37°C overnight, and the MIC was determined as the highest dilution showing no bacterial growth. The MBC was determined by plating 100 μL of culture broth from wells onto the TSA plate and incubated at 37°C overnight. The highest dilution that resulted in a 99.9% reduction in the bacterial cell number was recorded as the MBC. The negative control was sterile deionized water, and doxycycline was used as a positive control. MIC and MBC were expressed in the percentage of the sample.
The antibiofilm activity of each sample was evaluated according to a previously reported method.45 Eighty microliters of each sample was added to a 96-well plate containing 120 µL of bacterial species (1 × 10⁷ CFU/mL). Incubated for 16 h at 37°C. Doxycycline was taken as a positive control. After incubation, the wells were washed three times with 200 μL sterile distilled water. The wells were air-dried and 0.1% (v/v) crystal violet solution (200 µL/mL) in water was added. The plate was kept for 1 h. Later, the wells were washed with sterile distilled water to remove excess stain. Solubilized the adherent dye with 200 μL of 95% (v/v) ethanol. The experiment was performed in triplicates. The absorbance of each well was measured at 595 nm using a microtiter ELISA reader (ELISA Reader, Thermo Fisher 1510, Germany). The percentage inhibition of biofilm activity was calculated using the following equation:
(14)
The metabolic activity of bacteria after treated with drugs was determined by MTT assay. Eighty microliters of each sample was added to a 96-well plate containing 120 µL of bacterial species (1 × 10⁷ CFU/mL) and incubated for 24 h at 37°C. The further procedures were the same as section cell viability determination.
Eighty microliters of each sample was added to a 96-well plate containing 120 µL of bacterial species (1 × 10⁷ CFU/mL) and incubated for 24 h at 37°C. Afterwards, the above-said samples were mixed with 200 µL of MDA reagent (a mixture of 47 mL water, 1 mL HCl, 7.2 g trichloroacetic acid, and 0.18 g thiobarbituric acid) and placed in a water bath (Water Bath, BUCHI 461, Zürich, Switzerland) at 100°C for 15 min. After cooling, 300 µL of 1-butanol was added, shaken vigorously, and centrifuged at 1500 × g for 10 min. 1,1,3,3-Tetramethoxypropane was taken as the standard. The supernatant was collected and the absorbance was measured at 532 nm.46 The MDA level was calculated according to the following equation:
(15)
Four hundred-microliter bacterial cells (1 × 10⁷ CFU/mL) were treated with 100 µL of samples in 1 mL Eppendorf tube and incubated at 37°C for 24 h. The cells were collected by centrifugation (3000 rpm, 3 min) stained with a solution of acridine orange (1 mg/mL). Kept the solution in dark for 10 min. The cells were observed under a microscope.47
All experiments were performed in triplicate (three independent experiments). The data are presented as mean ± SD. (standard deviation) and analyzed by one-way ANOVA followed by Tukey multiple comparison tests using Origin Pro 2018 SR1 b9.5.1.195 (OriginLab Corporation, Northampton, MA 01060 USA) software.
Results
Extraction and Modification of Cellulose Nanofibers (CNF)
Composition of Soybean Curd Residue (SCR)
SCR is a by-product obtained after the processing of soybean products and it was known that China generates about 2.8 million tonnes SCR annually.48 Literature showed that the chemical composition of SCR is depending on the type of soybean, production method, and its water phase.49 The lyophilized SCR contains a large number of carbon-based compounds (46.34%).9 The previous study reported that the unfermented SCR (USCR) contained a high level of carbohydrates (43.53 ± 1.16) in addition to protein (24.93 ± 2.07), fat (12.77 ± 1.35), and ash (3.98 ± 0.72).50 The composition analysis of SCR is listed in Table 1. The results indicated that the dried SCR contained 34% of cellulose, 16% hemicellulose, and 0.8% lignin. The low percentage of moisture (2.58%) and ash (4%) content were also observed. The high percentage of cellulose content in SCR makes it suitable for the extraction of nanocellulose.
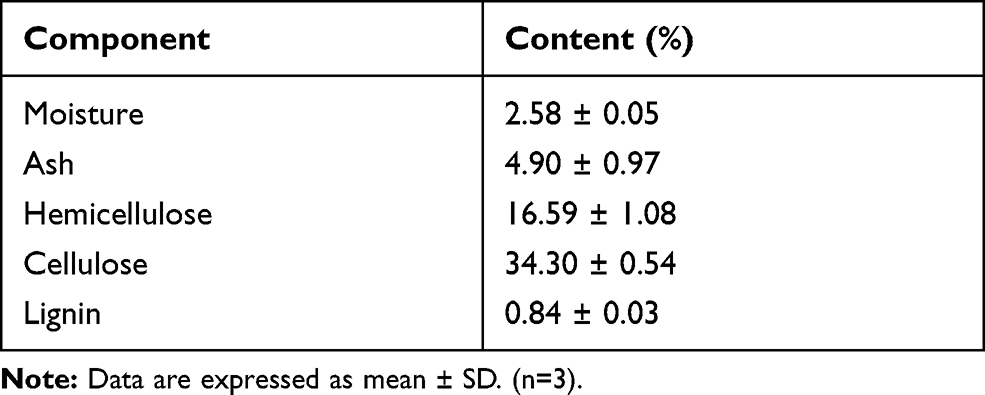 |
Table 1 Composition Analysis of Soybean Curd Residue (Dry Matter) |
Extraction of Cellulose Nanofibers
The extraction of CNF from SCR was done by a chemo-mechanical method illustrated in Figure 1A. The purpose of the chemical treatment is to remove the non-cellulosic parts. Treatment with NaOH removed the lignin and hemicellulose, while acid treatment separates the individual fibers. After this, the bleaching process (with NaClO) was carried out to remove the remaining lignin by oxidative fragmentation.17 Finally, the obtained residue was treated with H2SO4 to reduce the particle size, increases crystallinity, improves tensile strength, and flexibility of the materials.51 Uniform-sizeds fibrils were obtained by subjecting them into the homogenization process. The extraction yield of nanocellulose from SCR was about 6%.
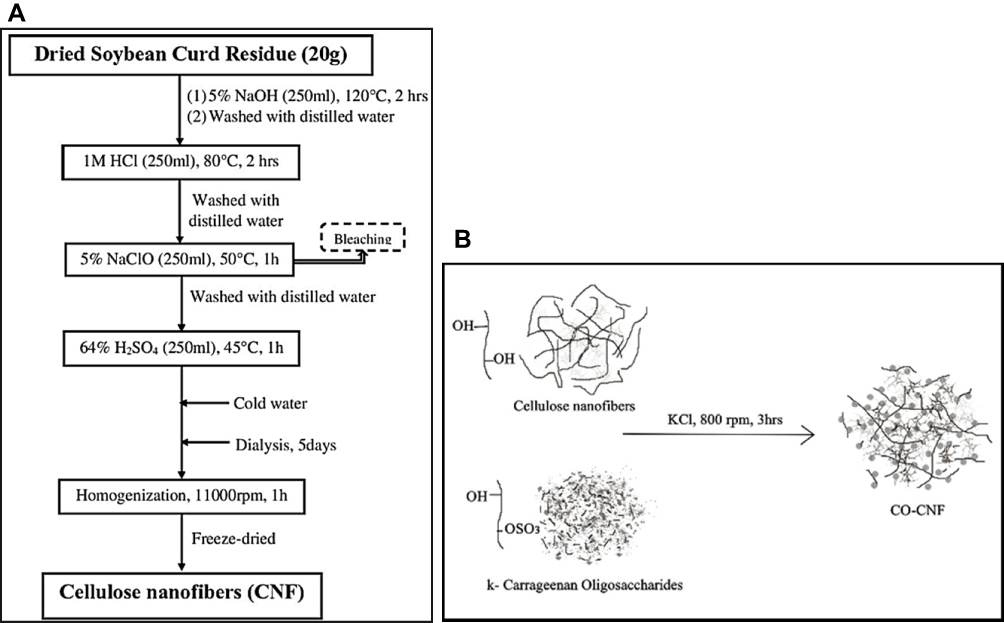 |
Figure 1 (A) schematic diagram showing the extraction of CNF from SCR and (B) diagrammatic illustration of the formation of ĸ-carrageenan oligosaccharides linked cellulose nanofibers (CO-CNF). Abbreviations: CNF, cellulose nanofibers; SCR, soybean curd residue; CO, ĸ-carrageenan oligosaccharides. |
Modification of Cellulose Nanofibers (CNF) with ĸ-Carrageenan Oligosaccharides (CO)
CNF are hydrophilic polar polymers highly susceptible to surface modification because of the presence of hydroxyl groups.52 The grafting of CO into CNF was done by using potassium chloride (KCl) as a cross-linker and is explained in Figure 1B. The -OH and -OSO3 groups on CO make it more available for grafting. ĸ-Carrageenan forms a gel in the presence of K+ ions and it allows two carrageenan segments to form a double-helix structure in a three-dimensional network.53 The formation of CO-CNF was via the bonding between –OH groups of CO and CNF (glycosidic linkage) and also by the involvement of –OSO3 groups. The appearance of the CNF and CO-CNF was shown in Figure S1 (supplementary data). CNF was observed as a white colored solution and was noted that the CO-CNF solution (Figure S1b) was more transparent than CNF solution (Figure S1a) and dried forms of them were observed with a little faded white color. It was also noted that CO-CNF was softer than the CNF (dried form). The grafting of CO into CNF improved softness, dispersion, and porosity of the material and reduced agglomeration of CNF.
Dynamic Light Scattering (DLS) Analysis
During DLS, the molecules are continuously moving in a solution because of the Doppler broadening. The detection of scattering intensity gives the average size of the particle.54 The particle size, zeta potential, and polydispersity index (PDI) of CNF and CO-CNF were analyzed by the DLS method and the results are described in Table 2. The obtained average size of CNF and CO-CNF was 263.60 ± 12.27 nm and 330.66 ± 16.44 nm, respectively. The increase in the size of CO-CNF was due to the presence of more hydrophilic groups (hydroxyl and sulfate groups) and has an affinity towards the water molecule under the DLS measurement condition. Zeta potential is defined as the surface charge of the particle when it is dispersed in a liquid.55 It is influenced by pH, ionic strength, and concentration of the sample.56 The zeta potential of the CNF was about −46.13 ± 1.25 mV and CO-CNF was about −42.10 ± 0.70 mV. The internalization of these negatively charged particles via neutralization of the charge of the membrane through electrostatic interaction and subsequent endocytosis.57 Further, the homogeneity of the particle was analyzed by measuring the PDI. It can range from 0 (monodisperse) to 1 (polydisperse).55 The PDI of both CNF and CO-CNF was about 0.4. So, the DLS analysis showed that the particles were in nanometer size, moderately monodisperse, and negatively charged.
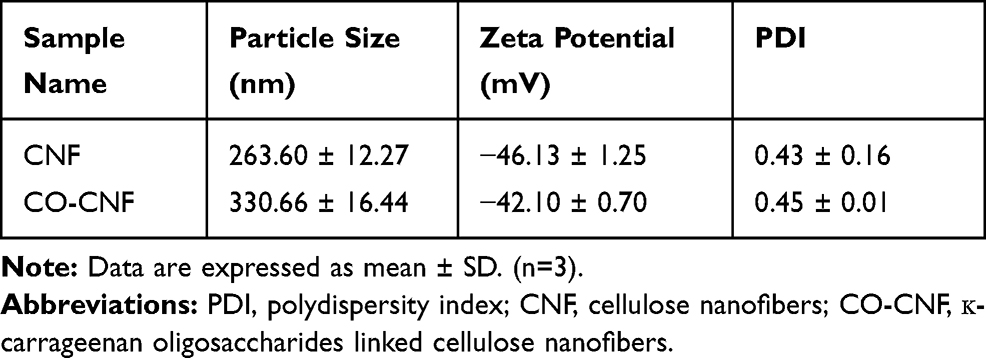 |
Table 2 Dynamic Light Scattering Analysis of Nanoparticles CNF and CO-CNF |
Transmission Electron Microscopy (TEM) Analysis
Transmission electron microscopy is an advanced technique that uses a beam of electrons to transmit across a thin section of the specimen.58 The morphology of both CNF and CO-CNF was evaluated by TEM analysis (Figure 2A). It was observed that the CNF has a long length with short diameter. The average diameter (D) of the CNF was 37.89 ± 3.07 nm and length (L) was about 504.97 ± 82.19 nm. The aspect ratio (L/D) of CNF was about 15.62 ± 1.90. It was observed that CO-CNF formed as a network structure and CO appeared in the form of a spherical particle linked to each other by CNF. The average diameter of the CO beads was 316 ± 0.16 nm.
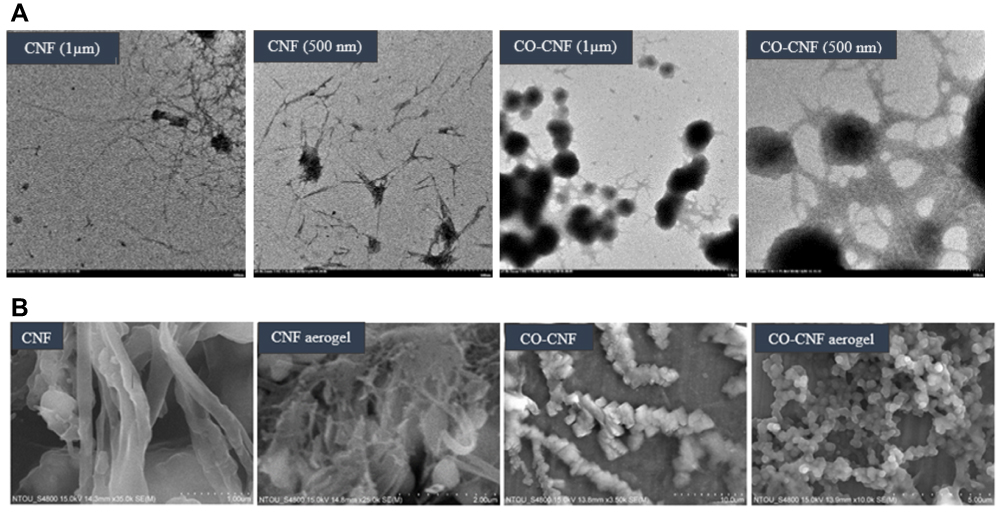 |
Figure 2 (A) Transmission electron micrographs of CNF and CO-CNF and (B) scanning electron micrographs (SEM) of CNF, CO-CNF, CNF aerogel, and CO-CNF aerogel. Abbreviations: CNF, cellulose nanofibers; CO-CNF, ĸ-carrageenan oligosaccharides linked cellulose nanofibers. |
Scanning Electron Microscope (SEM) Analysis
SEM is a sophisticated characterization technique that allows a beam of electrons to scan over the surface of the specimen. SEM of samples is given in Figure 2B. It was observed that the CNF was a long fiber with a short diameter and the surface was appeared as smooth. The morphology of CO-CNF was like a chain, in which the CO beads were attached to the CNF fibers and thereby forming a branched structure. The SEM images of aerogels of CNF and CO-CNF are also given in Figure 2B. The CNF aerogels appeared as a porous structure while CO-CNF aerogels look like several beads connected by each other forming a network structure.
X-Ray Diffraction (XRD) Analysis
X-ray diffraction is a technique used to analyze the crystalline and amorphous nature of the material. It provides quantitative accurate information on the atomic arrangements on different interfaces.59 Higher crystallinity indicated better reinforcement with the polymer matrix. The crystalline nature of CNF and CO-CNF was studied by XRD analysis (Figure 3A). Two characteristics peaks at 22° and 16° found in the CNF diffractogram were likely to be associated with the crystalline structure of cellulose I. The crystalline nature of the CNF indicating the removal of amorphous polymers such as lignin and hemicellulose.11 The crystallinity of the CNF was increased with the addition of CO. The crystalline index of CNF and CO-CNF was about 70% and 85%, respectively. This increase in crystallinity was due to the formation of inter and intramolecular H-bonding by the hydroxyl groups.17 So, it was understood that the addition of CO into CNF reduced the amorphous region and thereby the crystallinity increased.
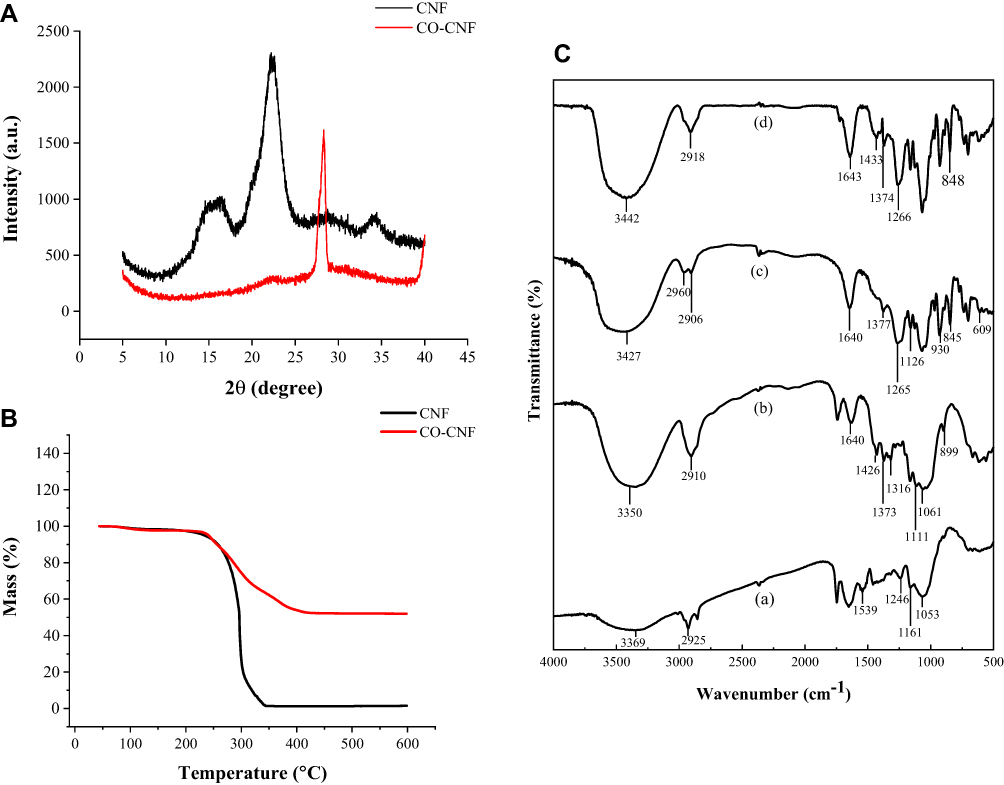 |
Figure 3 (A) X-ray diffraction (XRD) analysis and (B) thermogravimetric analysis (TGA) of CNF and CO-CNF. (C) Fourier-transform infrared spectra (FTIR) of (a) SCR and (b) CNF, (c) CO, and (d) CO-CNF. Abbreviations: SCR, soybean curd residue; CNF, cellulose nanofibers; CO-CNF, ĸ-carrageenan oligosaccharides linked cellulose nanofibers. |
Thermogravimetry Analysis (TGA)
The temperature behavior of both CNF and CO-CNF was evaluated by thermogravimetric analysis. The thermogravimetric curves of samples are shown in Figure 3B. The initial weight loss of both samples was started between 80°C and 100°C due to the evaporation of moisture content from the samples. The degradation was started from 222°C in CNF and the weight was loosened gradually. This degradation was due to the breakdown of glycosidic linkages in cellulose.60 This peak was gradually dropped down and ends at 342°C, the point at which the complete degradation happened. But in the case of CO-CNF, the initial degradation was started at 230°C and gradually loosen the weight until at 417°C. As shown in Figure 3B, grafting of CO into CNF improved the degradation temperature of the CNF.
Fourier-Transform Infrared Spectroscopy (FTIR) Analysis
The FTIR spectra of SCR, CNF, CO, and CO-CNF are shown in Figure 3C. SCR was a complex mixture composed of different components such as proteins, fats, fibers, and carbohydrates, etc. The broad peak at 3369 cm−1 and a sharp peak at 2925 cm−1 in SCR indicated the -OH and C-H stretching vibrations, respectively.61 The peak at 1539 cm−1, 1246 cm−1 (aromatic ring vibration of lignin), 1161 cm−1 (asymmetric stretching of C-O-C hemicellulose and lignin) represented the presence of hemicellulose and lignin whereas the peak at 1748 cm−1 indicated the absorption bands.61–64 Like SCR, the characteristic peak of –OH (broad peak at 3350 cm−1) and C-H (2910 cm−1) was also observed in CNF. The peak at 1640 cm−1 and 1426 cm−1 indicated the absorption and crystalline band of cellulose.17 C-H glycosidic deformation was noted in 899 cm−1 and the peak at 1061 cm−1 represented the C-O valance vibration. It was also noted that the characteristic peak representing lignin and hemicellulose was absent in CNF were indicating their removal. -OH, and C-H stretching vibration was observed in both CO and CO-CNF. In CO, the sulfate stretching was observed at 1377 cm−1 and glycosidic formation was found at 1126 cm−1.65 The peak at 1265 cm−1 (O=S=O asymmetric stretch) and 845 cm−1 (-O-SO3 stretching vibration) were indicating the presence of sulfate groups.65,66 The peak at 1643 cm−1 and 1374 cm−1 in CO-CNF represented absorption band and sulfate stretching, respectively. A glycosidic bond formation (1125 cm−1) in CO-CNF showed that the CO and CNF were linked by a glycosidic bond. The asymmetric stretch of O=S=O (1266 cm−1) and -O-SO3 (848 cm−1) from CO was also seen in CO-CNF. The FTIR analysis revealed the removal of lignin and hemicellulose. In addition, the glycosidic deformation in CO-CNF suggested that the CO and CNF were linked through glycosidic bonds.
Determination of Water Holding Capacity (WHC) of CNF and CO-CNF
The water-holding capacity of a sample depends upon its porosity, chemical, and physical structure.37 The WHC of CNF and CO-CNF was analyzed by the centrifugation method as shown in Figure 4A. It was noted that the CO-CNF possessed more water-holding capacity at room temperature (23°C) and body temperature (37°C). At 23°C, the WHC of CNF was about 13 g/g and it was only increased up to 15 g/g at 37°C. There was no significant difference between the WHC of CNF between 23°C and 37°C. But in the case of CO-CNF, the WHC was significantly increased with increase in temperature. The obtained WHC for CO-CNF was 22 and 25 g/g, respectively, for 23°C and 37°C. The WHC of CO-CNF was significantly higher than the CNF in both temperatures. It was noted that an increase in the WHC was due to the sensitivity or the expansion of CO to the temperature. Literature showed that gel–sol transition temperature of CO is observed at around 30–60°C, but it may vary according to the molecular mass, concentration, and other factors.67
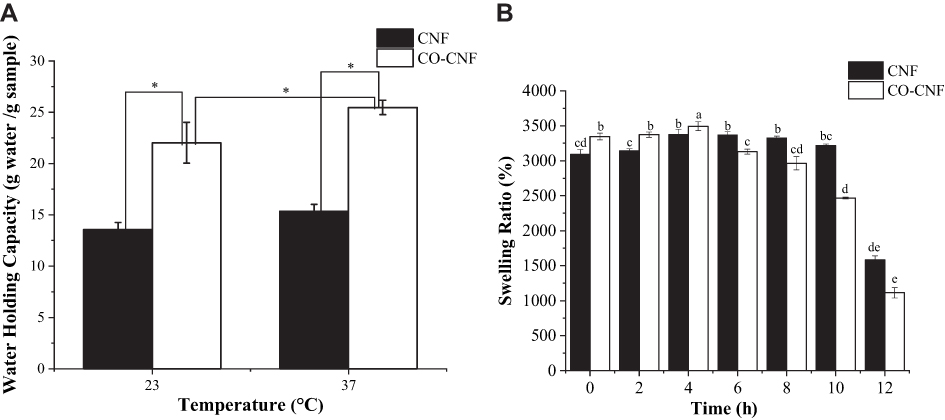 |
Figure 4 (A) Water-holding capacity (WHC) of CNF and CO-CNF. Data are expressed as mean ± SD. (n=3). Differences were considered significant at p < 0.05 analyzed by Tukey’s test and denoted by an asterisk (*). (B) The swelling ratio of CNF and CO-CNF. Data are expressed as mean ± SD. The differences were considered significant at (p < 0.05) analyzed by Tukey’s test and denoted by letters (a–e). Abbreviations: CNF, cellulose nanofibers; CO-CNF, ĸ-carrageenan oligosaccharides linked cellulose nanofibers. |
Determination of Swelling Ratio (SR)
The diffusion of water molecules into the pores of aerogel facilitates the swelling behavior of the material.68 Same as WHC, the swelling index also depends upon the porosity and hydrophilicity of the material. The swelling ratio of both CNF and CO-CNF is demonstrated in Figure 4B. It was observed that both CNF and CO-CNF have absorbed a large amount of water initially (0 h) and the swelling ability was increased slightly with increased time. Initially, the CO-CNF absorbed more water than the CNF, but from 6 h, it was reversed. The reduction in the swelling ability of CO-CNF was due to the collapse of the system and polymers were started broken slightly to form small systems. The CNF aerogel was maintained their swelling ability until 10 h but started to collapse between 10 and 12 h.
Cell Viability of CNF and CO-CNF
The cell viability of both CNF and CO-CNF was evaluated by MTT assay in Raw 264.7 macrophage cells to get rough information about the toxic nature of the samples. It is based on the reduction of MTT (yellow color) into formazan (purple) crystals depending on the NAD(P)H-dependent cellular oxidoreductase enzymes. The high rate of MTT reduction is observed in healthy cells while dead cells are failed to do.69 The cell viability of both CNF and CO-CNF is given in Figure 5. A dramatic decrease in cell viability with increased concentration was observed in both samples. It was understood that a very low concentration of CNF and CO-CNF supported cell proliferation and does not cause any toxicity to the cells. Up to 100 µg/mL, the cell viability of both CNF and CO-CNF was higher than the control group. At a concentration of 200 µg/mL, the cell viability was rapidly decreased in the CO-CNF group. As compared to CNF, CO-CNF possesses a high percentage of cell viability up to 100 µg/mL. Later, the viability of cells was highly reduced in CO-CNF. But, the higher concentration (800 µg/mL) of both samples possessed more than 80% cell viability.
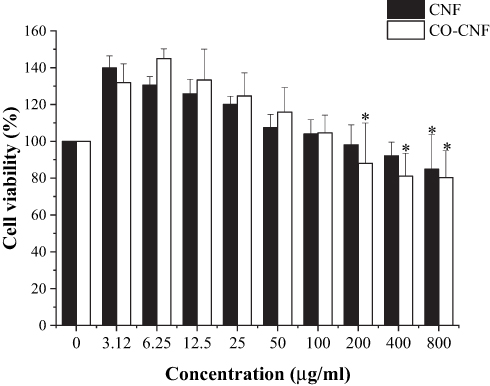 |
Figure 5 Cell viability of CNF and CO-CNF. Data are expressed as mean ± SD. The asterisk (*) indicated the significant differences of the groups from the highest cell viability percentage (6.25 µg/mL of CO-CNF) at p < 0.05 analyzed by Tukey’s test. Abbreviations: CNF, cellulose nanofibers; CO-CNF, ĸ-carrageenan oligosaccharides linked cellulose nanofibers. |
Surfactin-Loaded CO-CNF
Dynamic Light Scattering (DLS) of Particles
As mentioned earlier, DLS is a technique that uses the principle of scattering of light from the particle to provide a description of the size distribution of the particle. The particle size, zeta potential, and PDI of the particle are given in Table 3. In this study, CO-CNF was acting as a carrier and it was loaded with surfactin. It was noted that the average size of 50 SNPs, 100 SNPs, and 200 SNPs was 242.60 ± 16.44 nm, 203.60 ± 9.76 nm, and 232.90 ± 2.58 nm, respectively. The drug-loaded particles were prepared by the emulsion method (W/O). Literature indicated that the size range of the nanoemulsions varies from 10 to 1000 nm. The size of the emulsion can be reduced by using ultrasonication, but there is always a tendency to aggregate each other.70 Zeta potential is a parameter indicating the surface charge of the material.71 The zeta potential of CO-CNF was 42.10 ± 0.70 and the charge was changed after the addition of surfactin. The drug-loaded nanoparticles were more stable than the carrier (CO-CNF). The PDI is an indicator to check the uniformity of the particle. A higher value of PDI will denote the less uniformity.70 As shown in Table 3, the PDI value was improved to 0.2 after the addition of surfactin, indicating more uniformity than the carrier (PDI was 0.4).
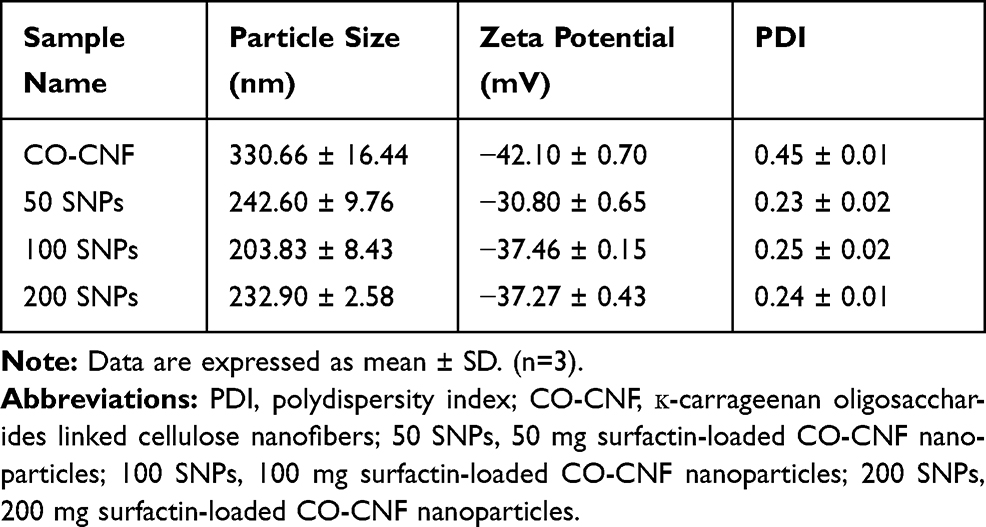 |
Table 3 Dynamic Light Scattering (DLS) Analysis of Surfactin-Loaded CO-CNF |
Entrapment Efficiency (EE), Loading Capacity (LC), and in vitro Drug Release
The ability of nanomedicine is determined by some parameters such as EE, LC, and in vitro drug release. The mass ratio of drugs to nanomedicines is called drug loading while the utilization of drugs during the nanomedicine-preparation process is determined by drug-loading efficiency.72 Sustained or controlled release of the drug can be determined by evaluating the in vitro drug release. The obtained EE and LC of the surfactin-loaded CO-CNF was 53.15 ± 2.36% and 36.72 ± 1.24%, respectively (Figure 6). The dialysis method was performed to evaluate the in vitro drug release of surfactin from CO-CNF. A rapid release of surfactin was observed at 1 h, may be due to the release of physically entrapped drug. After that CO-CNF controlled the drug release and about 68% of the drug was released at 24 h.
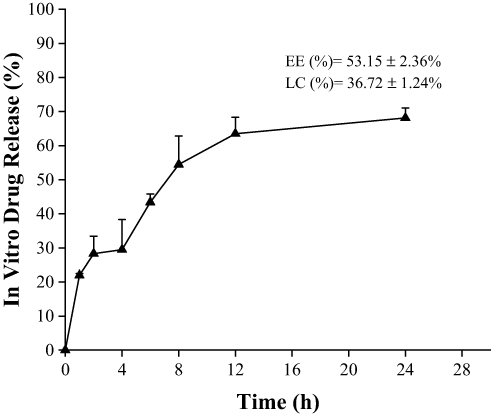 |
Figure 6 In vitro drug release profile of surfactin from CO-CNF. Abbreviation: CO-CNF, ĸ-carrageenan oligosaccharides linked cellulose nanofibers. |
Scanning Electron Microscopy (SEM) of Surfactin-Loaded CO-CNF
SEM images of 50 SNPs, 100 SNP, and 200 SNPs are shown in Figure 7A. Like CO-CNF, all particles were appeared as chain-like structure, in which the CO blocks were connected by CNF chains. It was noted that the CO blocks (oil phase) were surrounded by the surfactin (water phase). 50 SNPs, 100 SNPs, and 200 SNPs shown an almost similar structure. The nanoparticle’s surface appears smooth, but different sizes were observed due to the agglomeration of the particle.
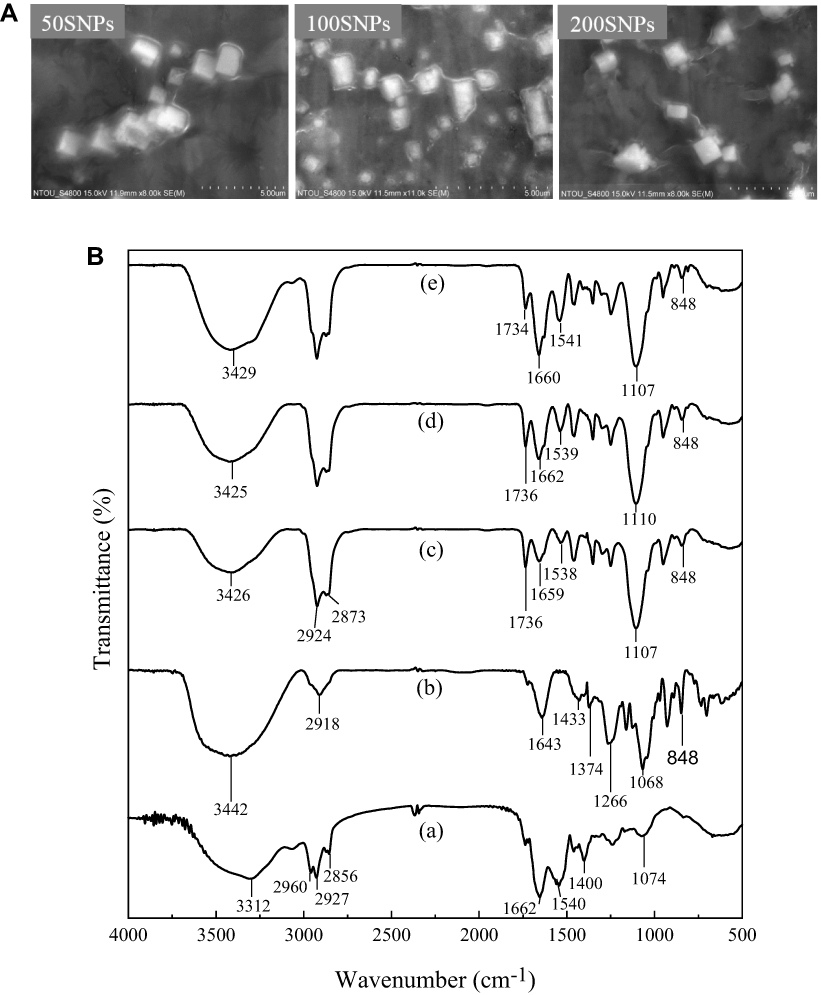 |
Figure 7 (A) Scanning electron microscopic (SEM) images of 50 SNPs, 100 SNPs, and 200 SNPs and (B) Fourier-transform infrared spectroscopy (FTIR) of (a) surfactin, (b) CO-CNF, (c) 50 SNPs, (d) 100 SNPs, and (e) 200 SNPs. Abbreviations: 50 SNPs, 50 mg surfactin-loaded CO-CNF nanoparticles; 100 SNPs, 100 mg surfactin-loaded CO-CNF nanoparticles; 200 SNPs, 200 mg surfactin-loaded CO-CNF nanoparticles. |
Fourier-Transform Infrared Spectroscopy (FTIR) Analysis
Figure 7B shows the FTIR spectra of (a) Surfactin, (b) CO-CNF, (c) 50 SNPs, (d) 100 SNPs, and (e) 200 SNPs. Surfactin is a surfactant that is usually used as an antibiotic. The broad peak at 3312 cm−1 was the characteristic peak of N-H stretching mode and the peak at 2960 cm−1 and 2927 cm−1 was corresponding to the lipopeptide portion of the surfactin [C-H (CH3 and CH2)].73 A small peak at 2856 cm−1 and a deep peak at 1540 cm−1 was corresponding to the presence of aliphatic chain and deformation mode of the N-H bond combines with C-N stretching mode, respectively.74 The peak at 1643 cm−1 and 1374 cm−1 in CO-CNF represented absorption band and sulfate stretching, respectively. The glycosidic bond formation (1125 cm−1) in CO-CNF showed that the CO and CNF were linked by a glycosidic bond. The asymmetric stretch of O=S=O (1266 cm−1) and -O-SO3 (848 cm−1) from CO was also seen in CO-CNF. 50 SNPs, 100 SNPs, and 200 SNPs were the mixture of the above-said materials. It was noted that three of them contained a characteristic peak 3426 (50 SNPs), 3425 (100 SNPs), and 3429 cm−1 (200 SNPs) indicating the -OH stretching vibrations that came from CO-CNF. The common peak at 1660 cm−1 representing the CO-N bond from surfactin. The deformation mode of N-H bond came from surfactin was also seen in all three groups. The formation of a glycosidic bond was also observed in three groups.
Cell Viability
The cell viability of nanoparticles was evaluated by MTT assay (Figure 8). It is a simple method to test the toxicity of the material by evaluating the metabolic activity of the cultured cell while treated with drugs.75 CO-CNF showed the highest percentage of cell viability as compared to other groups. It was understood that the cell viability was decreased with an increase in the concentration of surfactin. Up to 100 µg/mL, all groups showed more than 80% of cell viability. At a concentration of 200 µg/mL, the cell viability of 100 SNPs reduced suddenly and less than 50% of cell viability was observed in 200 SNPs at a concentration of 400 µg/mL. The sudden loss of cell viability in the presence of 100 SNPs at 200 µg/mL may be due to several factors such as MTT reagent, cell density, solvents, and physicochemical properties of nanoparticle.76–78 Previous literature mentioned that the underestimated results of cytotoxicity were observed in MTT assay due to its non-specific intracellular reduction of tetrazolium.77 Physicochemical properties such as Size, particle surface charge, shape, and stability of nanoparticles also have an influence in cell viability.79 50 SNPs group maintained 80% of cell viability up to a concentration of 400 µg/mL together with CO-CNF. It was clearly visible that the addition of surfactin reduced cell viability in a concentration-dependent manner.
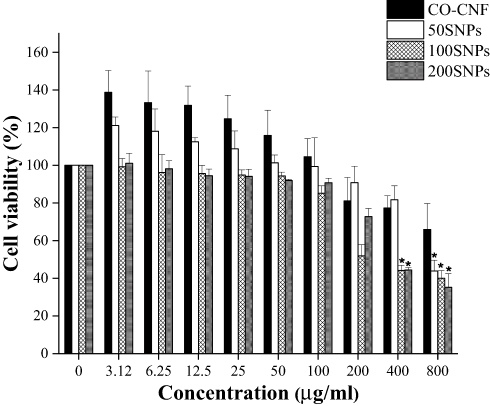 |
Figure 8 Cell viability of CO-CNF, 50 SNPs, 100 SNPs, and 200 SNPs. Data are expressed as mean ± SD. (n=3). The asterisk (*) indicated the significant differences of the groups from the control group (0 µg/mL) at p < 0.05 analyzed by Tukey’s test. Abbreviations: CO-CNF, ĸ-carrageenan oligosaccharides linked cellulose nanofibers; 50 SNPs, 50 mg surfactin-loaded CO-CNF nanoparticles; 100 SNPs, 100 mg surfactin-loaded CO-CNF nanoparticles; 200 SNPs, 200 mg surfactin-loaded CO-CNF nanoparticles. |
DPPH Radical Scavenging Activity Analysis
DPPH is a widely used antioxidant assay based on reducing the ability of antioxidants towards DPPH radical.80 As shown in Figure 9, 200 SNPs showed higher radical scavenging activity as compared to others. Doxycycline also showed better activity but slightly lower than 200 SNPs. CO-CNF has lower reduction ability and surfactin and 100 SNPs showed almost the same results at a concentration of 50 µg/mL. The antioxidant activity of 50 SNPs was increased up to 12.5 µg/mL concentration but the rate was decreased for upcoming concentrations. CO-CNF also produced some antioxidant activity because of the presence of CO. The previous study reported that the κ- carrageenan oligosaccharides have antioxidant activity.81
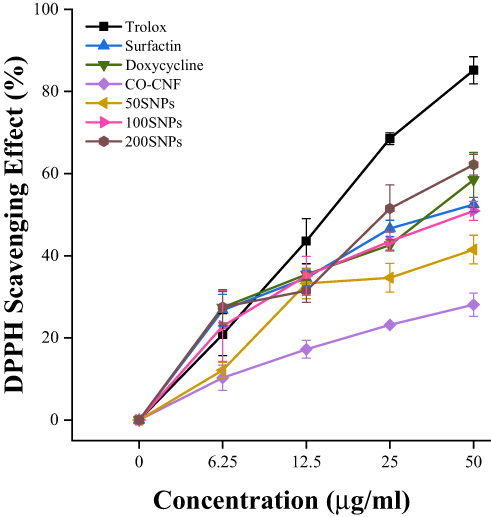 |
Figure 9 2,2-Diphenyl-1-picrylhydrazyl (DPPH) radical scavenging activity. Data are expressed as mean ± SD. (n = 3). Abbreviations: CO-CNF, ĸ-carrageenan oligosaccharides linked cellulose nanofibers; 50 SNPs, 50 mg surfactin-loaded CO-CNF nanoparticles; 100 SNPs, 100 mg surfactin-loaded CO-CNF nanoparticles; 200 SNPs, 200 mg surfactin-loaded CO-CNF nanoparticles. |
Agar Well Diffusion Method
In the agar well diffusion method, antimicrobials in the wells are diffused through the agar medium and inhibiting the growth of microorganisms.82 The inhibition zones will give an idea about the ability of that therapeutic. Two oral pathogens such as S. mutans and P. gingivalis were selected for evaluating the antimicrobial activity of samples. Agar plates of doxycycline were given in Figure S2. Figure 10 indicates that S. mutans were more sensitive to the samples. There was no zone of inhibition was observed for the CO-CNF group in both bacteria. In the case of both microorganisms, the zone was increased according to the increasing concentration of surfactin. The zone of inhibition of each group is given in Table 4. In the case of S. mutans and P. gingivalis, 200 SNPs showed more inhibition zone than CO-CNF, 50 SNPs, and 100 SNPs. The antimicrobial activity of these particles was due to surfactin (12.33 ± 1.15 mm). 200 SNPs showed better activity next to the doxycycline and the activity of nanoparticle was slightly increased with an increase in the concentration of surfactin (P. gingivalis). The results indicated that 200 SNPs has better activity next to doxycycline, for both bacteria.
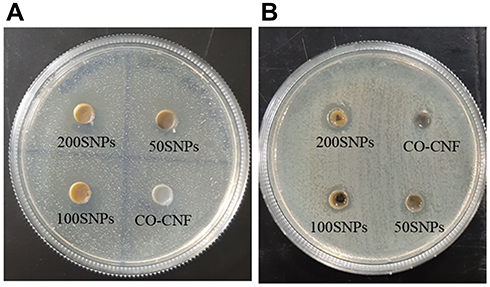 |
Figure 10 Antimicrobial activities of nanoparticles against (A) S. mutans and (B) P. gingivalis. Abbreviations: CO-CNF, ĸ-carrageenan oligosaccharides linked cellulose nanofibers; 50 SNPs, 50 mg surfactin-loaded CO-CNF nanoparticles; 100 SNPs, 100 mg surfactin-loaded CO-CNF nanoparticles; 200 SNPs, 200 mg surfactin-loaded CO-CNF nanoparticles. |
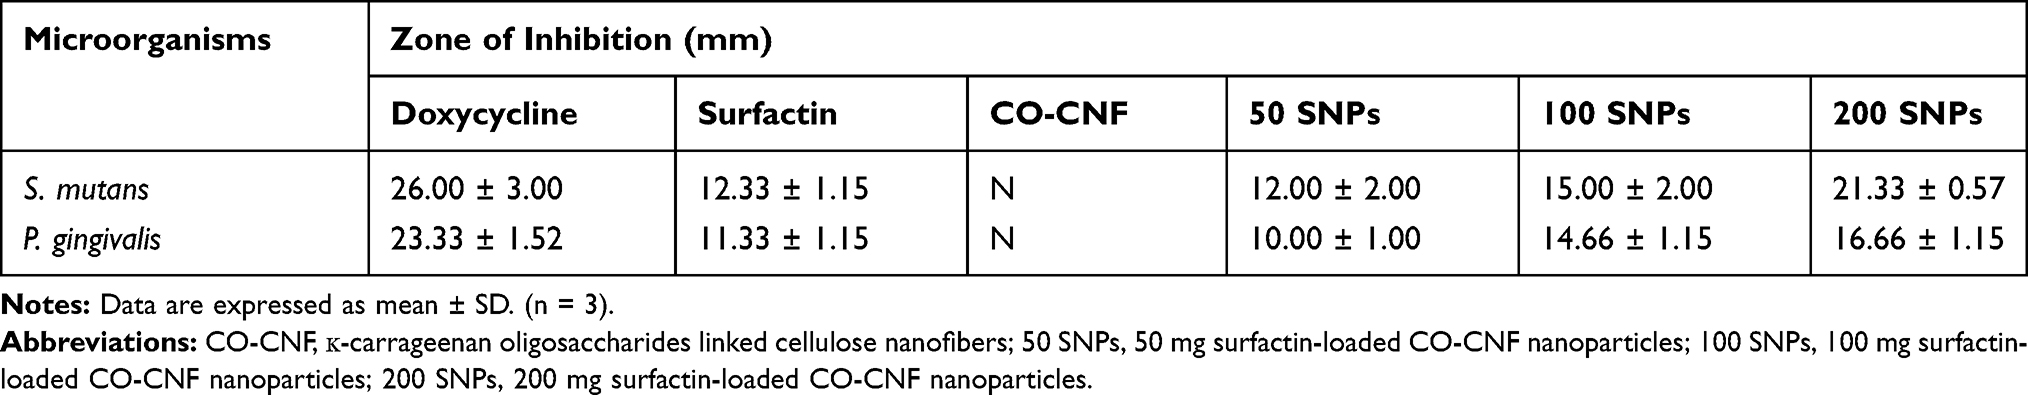 |
Table 4 Zone of Inhibition (ZI) |
Minimum Inhibitory Concentration (MIC) and Minimum Bactericidal Concentration (MBC) of Nanoparticles
The lowest concentration of an antimicrobial that will inhibit the visible growth of a microorganism after overnight incubation called MIC and the lowest concentration of an antimicrobial that will prevent the growth of an organism after subculture on to agar plate is called MBC. Table 5 shows the details of MIC and MBC of the nanoparticles that described on the basis of the percentage of drug concentration. The MIC and MBC of nanoparticle against two types of bacteria were greater than 50% of its concentration. The MIC of 50 SNPs was 100% concentration for two bacteria. MIC of 100 SNPs and 200 SNPs was 80% and 50%, respectively, for S. mutans but it was 90% and 70%, respectively, for P. gingivalis. The MBC of 50 SNPs was 120% for P. gingivalis and 100% for S. mutans. One hundred percent was also obtained for 100SNPs for two bacteria and 80% and 90%, respectively, for S. mutans and P. gingivalis. The MIC values of doxycycline for S. mutans and P. gingivalis were lower than 200 SNPs. But the MBC value of doxycycline and 200 SNPs was similar in the case of P. gingivalis and lower than 200 SNPs in S. mutans. The MBC value of all samples was almost around 100%. So, the actual concentration of each sample (20 mg/mL) was selected for further studies.
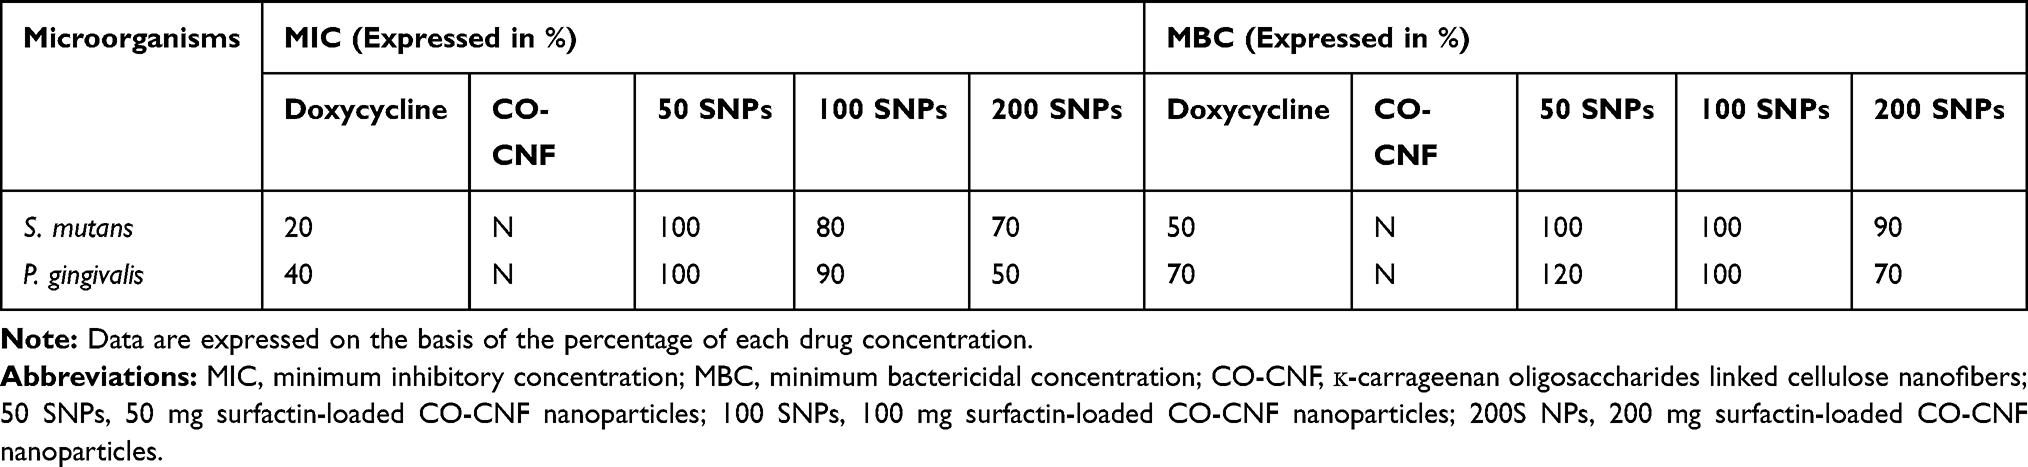 |
Table 5 Minimum Inhibitory Concentration (MIC) and Minimum Bactericidal Concentration (MBC) of Nanoparticles |
Visualization and Quantification of Biofilm by Crystal Violet Assay
Multicellular communities of bacteria are known to produce biofilm enclosed in a matrix composed of polysaccharides, proteins, and DNA.83 Crystal violet (CV) has the ability to bind to the polysaccharide matrix.84 The visualization of antibiofilm activities of nanoparticles was given in Figure S3 (supplementary data). For both bacteria, the control groups displayed more color intensity than other groups indicating the presence of more viable cells. It was observed that doxycycline and 200 SNPs were more active against biofilm formation and the color intensities were decreased with an increase in the concentration of surfactin. The quantification of crystal violet assay is given in Figure 11. In the case of P. gingivalis, 200 SNPs exhibited more biofilm inhibition than the other groups. Doxycycline also came next to the 200 SNPs with about 40% of biofilm inhibition after 24 h. There was no significant difference in the activity of doxycycline, 100 SNPs, and 200 SNPs. More than 50% of biofilm inhibition was given by doxycycline against S. mutans and the activity of nanoparticles in the order of 200 SNPs>100 SNPs>50 SNPs>CO-CNF. It was clear that the nanoparticles have the ability to reduce bacteria growth, thereby preventing the biofilm formation.
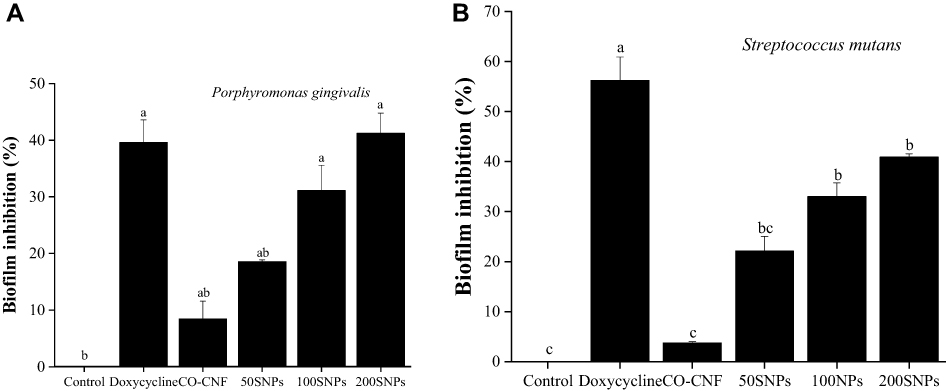 |
Figure 11 Quantification of nanoparticles of biofilm inhibition of (A) P. gingivalis and (B) S. mutans. Data are expressed as mean ± SD. (n=3). The values with different letters (a–c) represent a significant difference (p < 0.001) analyzed by Tukey’s test. Abbreviations: CO-CNF, ĸ-carrageenan oligosaccharides linked cellulose nanofibers; 50 SNPs, 50 mg surfactin-loaded CO-CNF nanoparticles; 100 SNPs, 100 mg surfactin-loaded CO-CNF nanoparticles; 200 SNPs, 200 mg surfactin-loaded CO-CNF nanoparticles. |
Evaluation of the Metabolic Activity of Bacteria After Treatment
The viability of bacterial cells after treated with nanoparticles and doxycycline is seen in Figure 12. In MTT assay, viable cells have the ability to convert MTT into purple-colored formazan with a maximum absorbance at 590 nm.85 The bacterial viability was reduced upon treatment with doxycycline and drug-loaded nanoparticles. Doxycycline reduced about 60% of S. mutans and 45% of P. gingivalis viability. It was observed that CO-CNF possessed more than 80% cell viability for both bacteria indicating that the carrier itself does not have any prominent antimicrobial activity. The viability of cells was decreased with an increase in the content of surfactin. Both doxycycline and 200 SNPs were reduced the S. mutans viability below to 50% after 24 h. P. gingivalis was more resistant to the nanoparticles and doxycycline. There was no significant difference in the activity between 200 SNPs and doxycycline. From Figure 12, it was noted that the nanoparticles can interfere with the metabolic activity of bacteria and subjecting them to cell death.
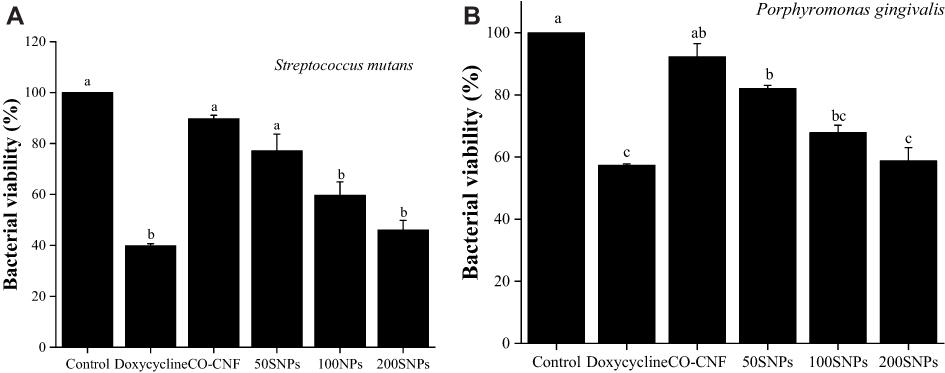 |
Figure 12 Effects of nanoparticles on the metabolic activity of (A) S. mutans and (B) P. gingivalis. Data are expressed as mean ± SD. (n=3). The values with different letters (a–c) represent significant differences (p < 0.05) analyzed by Tukey’s test. Abbreviations: CO-CNF, ĸ-carrageenan oligosaccharides linked cellulose nanofibers; 50 SNPs, 50 mg surfactin-loaded CO-CNF nanoparticles; 100 SNPs, 100 mg surfactin-loaded CO-CNF nanoparticles; 200 SNPs, 200 mg surfactin-loaded CO-CNF nanoparticles. |
MDA Level in Bacteria After Treated with Nanoparticles
MDA is usually measured as a marker of lipid peroxidation and oxidative stress. It is a by-product of lipid peroxidation of polyunsaturated fatty acids caused by the reactive oxygen species.86 The MDA level of S. mutans and P. gingivalis is given in Figure 13. More MDA level was observed in 200 SNPs treated group in both bacteria. Doxycycline came next to 200 SNPs with about 12 and 33 nmol/mL MDA levels in S. mutans and P. gingivalis, respectively. There was no significant difference in the MDA level between CO-CNF and 50 SNPs (S. mutans). As compared to S. mutans, more MDA was produced in P. gingivalis. Additionally, 50 SNPs and 100 SNPs did not show any significant difference in the MDA level. The enhanced production of MDA indicating oxidative stress.
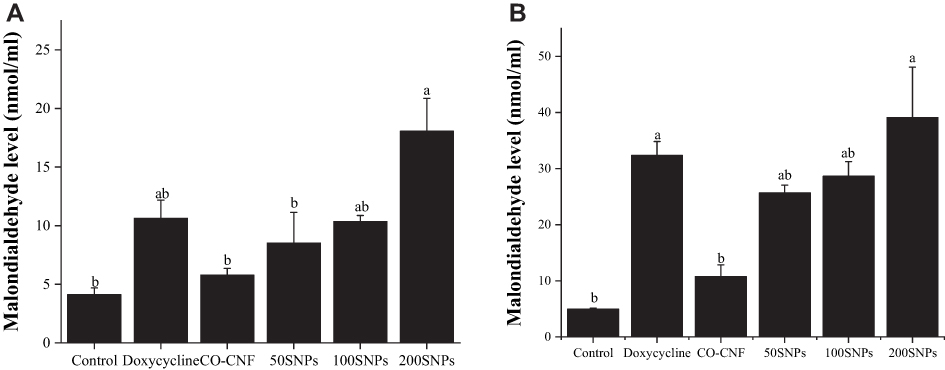 |
Figure 13 Effects of nanoparticles on the MDA level of (A) S. mutans and (B) P. gingivalis. Data are expressed as mean ± SD (n=3). The values with different letters (a–b) represent significantly different (p < 0.05) as analyzed by Tukey’s test. Abbreviations: CO-CNF, ĸ-carrageenan oligosaccharides linked cellulose nanofibers; 50 SNPs, 50 mg surfactin-loaded CO-CNF nanoparticles; 100 SNPs, 100 mg surfactin-loaded CO-CNF nanoparticles; 200 SNPs, 200 mg surfactin-loaded CO-CNF nanoparticles. |
Acridine Orange (AO) Assay
AO is a cell-permeable dye that emits green fluorescence when bound to dsDNA (at 520 nm) and red fluorescence when bound to ssDNA or RNA (at 650 nm).87 The microscopic images of bacteria after drug treatment is given in Figure 14. In Figure 14A (S. mutans), the control group has fully green fluorescence indicating the presence of more viable cells and there was no prominent cell death. It was also similar to CO-CNF, in which only a few dead cells were observed. The number of dead cells was increased from 50 SNPs to 200 SNPs. In 50 SNPs, the viable cells were greater than the dead cells. 100 SNPs showed almost equal viable and dead cells. 200 SNPs have almost all dead cells but it was less than the doxycycline. Figure 14B shows AO assay of P. gingivalis after treatment with nanoparticles. Like Figure 14A, control and CO-CNF group have almost viable cells. Doxycycline and 200 SNPs showed more cell death than the others. In 50 SNPs and 100 SNPs, a smaller number of cells were dead after 24 h. From the AO assay, it was understood that S. mutans was more sensitive towards the proposed therapeutics and 200 SNPs were more effective than the others.
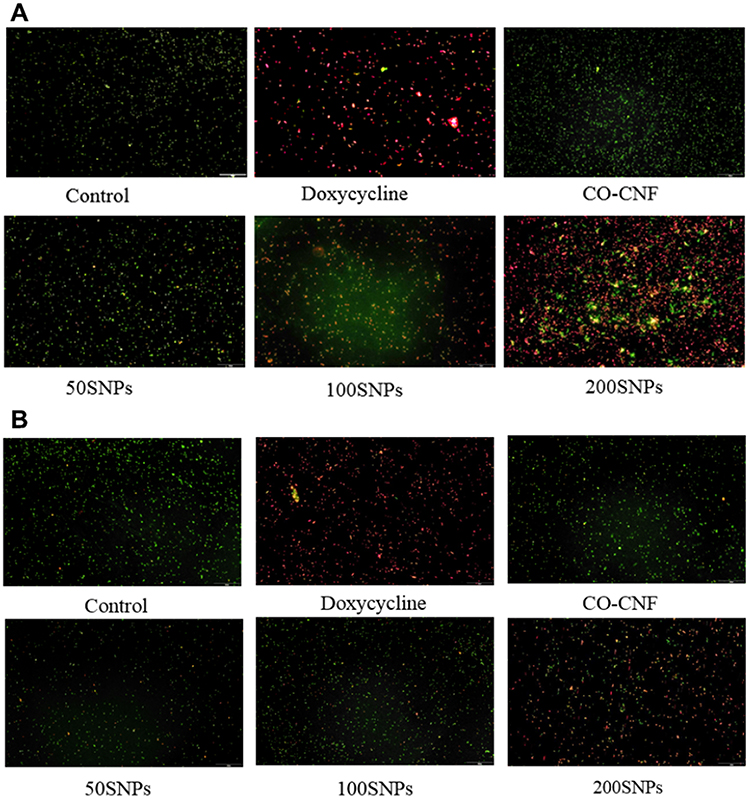 |
Figure 14 Acridine orange (AO) assay of (A) S. mutans and (B) P. gingivalis treated with different samples. Abbreviations: CO-CNF, ĸ-carrageenan oligosaccharides linked cellulose nanofibers; 50 SNPs, 50 mg surfactin-loaded CO-CNF nanoparticles; 100 SNPs, 100 mg surfactin-loaded CO-CNF nanoparticles; 200 SNPs, 200 mg surfactin-loaded CO-CNF nanoparticles. |
Discussion
SCR, also known as Okara, is a by-product obtained after the processing of soy milk and tofu. Annually, about 14 million tons of SCR are produced in China.88 Usually, 1.1 to 1.2 kg of okara were obtained after the processing of 1 kg of soybeans.50 Literature showed that SCR is sometimes used as an animal feed and the remaining was directly sent to the land as waste material.89 Studies reported that it was considered as a typical agricultural waste material because of the difficulties faced during the reuse process. Apart from that, SCR is a highly available low-cost material suitable for the production of functional foods, value-added chemicals, biofuels, and biomaterials.10 SCR contains valuable components that have pharmacological importance, but their use is limited due to its highly fibrous structure. .90 The composition of SCR is varying according to the type of soybean, method of processing, and amount of water-soluble content extracted from the ground soybean.50 The chemical composition of SCR (wet) was found to have 84.50% moisture, 4.73% protein, 1.50% lipid, 7.00% sugars, 1.50% fiber, and 0.40% ash at pH 6.71.89 The dry matter of SCR contains 15.2–33.4 g/100g proteins, 3.8–5.3 g/100g carbohydrates, 42.4–58.1 g/100g dietary fibers, and 3.0–4.5 g/100g ash. About 40–60% of insoluble fibers such as cellulose and hemicellulose were found in SCR. The lipid content was about 8.3–10.9% (dry basis).50 Our study showed the high percentage (34%) of cellulose content in SCR (Table 1), allowed the extraction CNF more effectively and the extraction yield of CNF from SCR was 6%.
Cellulose (C6H10O5)n is a natural fiber present in various biological sources and has advantages such as excellent mechanical properties, low cost, high aspect ratio, biodegradability, and non-toxicity.11 It is a linear polymer composed of β-(1–4) linked d-glucose units. Cellulose has a wide application in paper manufacturing, textile industry, food industry, and pharmaceutical area.51 Cellulose types I (parallel packing of the hydrogen-bond network), II (antiparallel packing of the hydrogen-bond network), III (obtained from the ammonia treatment of cellulose I or II), and IV (modification of cellulose III by heating up to 260 °C in glycerol) are the key allomorphs of the cellulose.91 Nanocellulose-based materials are now extensively extracted for the manufacturing of hydrogel, aerogels, barrier coatings, and polymer reinforcement.92 Nanocellulose fiber has a diameter in the nano range and several micrometers in length. The extraction of nanocellulose from natural sources is mainly accompanied by acid hydrolysis, enzymatic hydrolysis, and mechanical process.91 The extraction of nanocellulose from numerous sources was reported including raw cotton linter, rice straw, rose stem, wheat straw, areca nut husks, and pineapple leaf fiber.11,17,51 Cellulose fibers contain highly ordered (crystalline) and disordered structure (amorphous). In our study, the CNF was extracted from SCR through a chemo-mechanical method which involves both acid and alkali treatment together with homogenization explained in Figure 1A. The lignin and hemicellulose were removed from the source due to the breakdown of ether linkage during alkali treatment.17 Acid treatment partially solubilizes the hemicellulose.10 The remaining lignin and hemicellulose were removed by the bleaching process with NaClO. Lignin reacts with NaClO and forms lignin chloride, which is easily dissolvable.17 Finally, the obtained residue was treated with H2SO4 which reduced the particle size, increases crystallinity, and improves tensile strength, and flexibility of the materials.51 After chemical treatments, the residue was subjected to dialysis followed by homogenization. The dialysis process neutralizes the sulfate ions and the homogenization process makes a uniform sized product.36
The use of nanocellulose is limited due to its agglomeration, entanglement, aggregation, and poor dispersion.93 The CNF can be modified either by using physical interactions or by using chemical approaches. Because of the presence of hydroxyl groups, CNF is more available for surface modification.23 The chemical modification of the CNF is achieved by surface compatibilization or copolymerization. Grafting, radical reactions, or the use of organometallics are the usual ways to perform co-polymerization.94 Grafting of materials into nanocellulose is comprised of two processes called “grafting onto” attachment of pre-synthesized polymer chains) or “grafting from” (polymer brushes can be grown in situ from nanocellulose directly) approach.95 The present study focused on the modification of extracted CNF by grafting with CO in order to improve the dispersion, compatibility, stiffness, and porosity of the material. Carrageenan is an anionic polymer composed of alternating (1→3)-linked β-d-galactopyranose (Galp) and (1→4)-linked α-d-galactopyranose. ĸ-Carrageenan is a type of carrageenan contains a 3,6-anhydro-α-d-galactopyranose (AnGalp) in place of α-d-galactopyranose.25 They have good water solubility and a certain degree of sulfation.96 Literature showed that the carrageenan polysaccharides have anticoagulant, antithrombotic, anti-inflammatory, antiviral, and antitumor activities. It was also reported that the negatively charged sulfate groups play a crucial role in the bioactivity of the material.97 As shown in Figure 1B, the major functional group of CNF was –OH and CO was –OSO3, and -OH groups. They form a network structure through the formation of glycosidic bonds. Apart from this, the CO was formed as a bead-like structure because of the cross-linking between them in the presence of KCl. The grafting of CO into CNF improved softness, dispersion, and porosity and reduced agglomeration (Figure S1). This network structure helps to trap more drugs because of the presence of active sulfate and hydroxyl groups. The aggregation of the ĸ-carrageenan helices is occurred due to the binding of monovalent cations from KCl to the helices.98
DLS is a technique to measure the size of the nanoparticle by analyzing the hydrodynamic radius (RH) of particles in suspension.99 It uses the Brownian motion or illumination of a suspension of the particle by a laser beam.100 The main disadvantage of these techniques is that almost all the particles are considered as spherical particles. But, most of the studies used this technique, because it gives a rough analysis of the sample size and enables the comparison with other characterization techniques.11 CNF and CO-CNF are hydrophilic because of the presence of a large number of hydroxyl groups. Thus, it has a tendency to agglomerate and produce a large sphere. The difference in size as compared to TEM was due to this fact. In TEM, dried form of samples was analysed. Agglomeration and polydispersity of the nanoparticle can be solved by subjecting them into ultrasonication. The method of dispersion is an important parameter that affects the aggregation and surface properties of the particle.101 The average size of the obtained CNF and CO-CNF was 263.60 ± 12.7 nm and 330.66 ± 16.44 nm, respectively, after sonication. CNF has dimensions ranged from 20 to 50 nm for the width and 0.5 to 2 µm in length.102 The previous study reported that the size of CNF that obtained from sugarcane bagasse was between 1 and 0.1 µm and from pineapple leaf fibers was 420 nm.11,103
Zeta potential is the measurement of the electrostatic potential at the electrical double layer surrounding a nanoparticle in solution.104 Zeta potential is less than −30 mV and greater than +30 mV will indicate more stability of nanocellulose.105 The zeta potential of the obtained CNF and CO-CNF was −46.13 ± 1.25 mV and −42.10 ± 0.70 mV, respectively (Table 2). The more negative charge on the particle was due to the presence of sulfate group that was grafted after H2SO4 treatment. A higher negative value of zeta potential can resist aggregation and increase the degree of dispersion.105 The previous study reported that the zeta potential of the CNF obtained from cassava root bagasse and peelings was less than −47.7 mV.106 The PDI is the broadness of the size distribution of particles dispersed in liquids.107 The value of PDI is ranging from 0.1 to 1.0. The PDI value is greater than 0.7 indicating the broad size distribution of the particle.108 The PDI value of both CNF and CO-CNF was 0.4, indicating the narrow and favorable particle size distribution.
SEM provides an idea about the surface topology of the materials109 while the TEM allows the crystallographic and chemical characterization of materials with a high spatial resolution.110 The morphology of both CNF and CO-CNF was evaluated by TEM and SEM analyses. In TEM analysis (Figure 2A), CNF appeared as a long fiber with a short diameter indicating the high aspect ratio of the material. High aspect ratio determining the reinforcing capability of nanofibers.17 The average diameter of the CNF was on the nanometer (37 nm) range and it formed a mesh-like structure. These highly fibrous structures enable drug trapping. The morphology of CO-CNF seemed as a cross-linked network structure, in which CO was formed as bead and each bead was connected by CNF. The gelation mechanism of the CO involves the formation of an infinite three-dimensional network by the coil to helix conformational transition.111 From SEM analysis (Figure 2B), it was observed that the surface of the CNF was smooth and has a short diameter. CO-CNF appeared as a rectangular block that connected to the CNF. The aerogel of CNF has high porosity while CO-CNF aerogels look like several beads connected by each other.
The crystalline nature of the CNF and CO-CNF was studied by XRD (Figure 3A). The crystalline index of CNF and CO-CNF was about 70% and 85%, respectively. The crystalline nature (ordered structure) of the CNF increased after the addition of CO. This was due to the formation of inter and intramolecular H-bonding by the hydroxyl groups.17 It was noted that the addition of CO into CNF reduced the amorphous region and thereby the crystallinity increased. The previous study suggested that the high value of the crystallinity index representing the decomposition of disordered regions such as hemicellulose and lignin.112 TGA analysis indicated that CO-CNF has a higher degradation temperature than CNF (Figure 3B). The extraction of CNF from SCR was evaluated by FTIR spectra (Figure 3C). SCR is a complex mixture contains different components. From the FTIR analysis, it was understood that the peak that representing –OH and C-H stretching vibrations were found in all compounds. The characteristic peaks that indicating the hemicellulose (1161 cm−1) and lignin (1539 cm−1, 1246 cm−1) were absent in CNF, indicating the removal of both of them in the CNF.61–64 The glycosidic bond formation (1125 cm−1) in CO-CNF showed that the CO and CNF were linked by a glycosidic bond.
The porous nature of the biomaterial increases the WHC. WHC enables to understand the loading capacity of the material.113 The water-holding capacity of CNF and CO-CNF was analyzed by conventional centrifugation method (Figure 4A). The centrifugation method depends on the acceleration, duration, and water concentration in the polymer.114 It was noted that the CO-CNF possessed more water-holding capacity at room temperature (23°C) and body temperature (37°C) than CNF. In the case of the wound healing process, increased water retention capacity of the material prevents the wound from dehydration.40 So, the results indicated that CO-CNF has more affinity to the water molecule and retained in its structure because of its porosity and higher surface area. The swelling ratio of both CNF and CO-CNF is demonstrated in Figure 4B. It was observed that both CNF and CO-CNF were absorbed a large amount of water initially (0 h) and the swelling ability was increased slightly with increased time. Initially, the CO-CNF absorbed more water than the CNF and the swelling ability of CO-CNF was started to reduce from 6 h because of the disintegration of the system. The polymers were slightly broken to form small systems. The CNF aerogel was maintained their swelling ability until 10 h but started to disintegrate between 10 and 12 h.
The cell viability of both CNF and CO-CNF is given in Figure 5. It was understood that a very low concentration of CNF and CO-CNF supported cell proliferation and does not cause any toxicity to the cells. A dramatic decrease in cell viability with increased concentration was observed in both samples. As compared to CNF, CO-CNF possesses a high percentage of cell viability up to 50 µg/mL. Later, the viability of cells was slightly reduced in CO-CNF.
Periodontitis is an inflammatory disease characterized by gingival inflammation, tooth loss, the formation of periodontal pockets, tooth mobility, and alveolar bone loss.115 It is the 6th most prevalent oral disease in the world.116 Plaque bacterial product causes direct or indirect damages to the tissues through bacterial induction of the host inflammatory and immune responses.3 Initially, bacteria are colonized to form dental plaque and induce inflammation. It was understood that the primary colonizers of dental plaques are streptococci and actinomyces and later they are replaced by gram-negative anaerobes. P. gingivalis is an anaerobic gram-negative oral bacterium that produces a number of virulent factors and extracellular proteases.117 The virulent factors include enzymes, haemagglutinins, gingipains, lipopolysaccharides, collagenase, aminopeptidase, and fimbriae, etc. It is known as the keystone pathogen of periodontitis and constitutes about 85.75% of plaque in chronic periodontitis.118 P. gingivalis get energy from amino acids and peptides that produced as the result of protein degradation.119 S. mutans is a facultatively anaerobic, gram-positive, dental caries pathogen that causes the dissolution of the enamel in acidic conditions. The previous study reported the increased colonization of S.mutans in chronic periodontitis conditions.120 S.mutans adhered to the surface by water-insoluble glucan and act as binding sites for the latecomer bacteria that originally do not have the ability to attach.121 The main virulent traits of S.mutans include acid tolerance, organic acid production, and biofilm formation.122
In this study, CO-CNF was acting as a carrier system that encapsulated with an antimicrobial called surfactin. Surfactin is a lipopeptide biomolecule has low toxicity, biodegradability, and can thrive in extreme conditions such as high temperature, pH, etc.30 The previous study reported the antimicrobial activity of surfactin-based nanoemulsions against Salmonella typhi, Listeria monocytogenes, and Staphylococcus aureus.123 The addition of surfactin into CO-CNF was done by the emulsion method. The obtained particles have a nanometer size and are stable and uniformly distributed (Table 3). This small size provides controlled and sustained drug release by maintaining long circulation time, less opsonization, and lower detection by macrophages.124 Controlled drug release of surfactin from CO-CNF is observed in Figure 6. The sustained/controlled release of drug was depending on swelling, diffusion, and erosion. Cellulose-based material can interact strongly with water and facilitate the diffusion process. CNF controls the release by forming tight network structure.125 Along with this, the properties such as high negative charge and high aspect ratio also make them favorable for sustained drug release.125 In addition to this, κ- carrageenan promoted the prolonged drug for many hours/or days. It was noted that the higher water-holding capacity of the material increases drug dissolution and thus increases the oral bioavailability.24 SEM images (Figure 7A) revealed that the surface of the particles was appeared smooth and were connected by CNF chains. The incorporation of surfactin was confirmed by FTIR analysis (Figure 7B). All the material showed more than 80% viability up to 100 µg/mL concentration indicated that they are less toxic to the cells (Figure 8).
Oxidative stress induced by ROS can promote cell membrane disintegration, membrane protein damage, and DNA mutations. Antioxidants have the capacity to inhibit the oxidation process and protect the cells from oxidative stress. DPPH (deep violet color) is a stable compound that becomes pale yellow when reduced upon reaction with hydrogen donors.126 The antioxidant activities of each compound are described in Figure 9. 200 SNPs possessed strong antioxidant activity and doxycycline came to the second position.
A variety of laboratory techniques are used to screening a newly developed antimicrobial therapeutic. Among them, the most common one is the agar well (ditch) plate method. In this method, the antimicrobial agents are poured into a well that made in agar plate inoculated with targeted bacteria. The antimicrobial agents are diffusing through the agar plate and inhibit microbial growth. The efficacy of the antimicrobial agents was evaluated by measuring the zone of inhibition.82 The antimicrobial activity of 50 SNPs, 100 SNPs, and 200 SNPs was tested against two oral pathogens such as S. mutans and P. gingivalis. Doxycycline was taken as a positive control. All the material has the ability to inhibit the above said two pathogens except CO-CNF (Figure 10). So, it was understood that CO-CNF only acts as a carrier for the successive release of the drugs and the antimicrobial activity of 50 SNPs, 100 SNPs, and 200 SNPs were coming from the effect of surfactin. 200 SNPs produced a higher zone of inhibition for S. mutans and P. gingivalis next to doxycycline (Table 4). The mechanism of biosurfactant to kill the microorganism by directly disrupting the integrity of the plasma membrane or cell wall.127 The MIC and MBC of each sample given in Table 5 indicated that approximately more than 50% of antimicrobial agents were required for getting positive results. The antimicrobial activity of nanoparticles was further evaluated by performing crystal violet assay, metabolic assay, MDA assay, and AO assay.
Biofilms are the association of microbial communities on a surface and are responsible for about 70% to 80% of diseases in the mouth. Crystal violet assay is a staining method that helps to visualize and quantify the bacteria. It is permeable in both gram-positive and negative cells.128 Quantification of biofilm inhibition is given in Figure 11. 200 SNPs were more beneficial against two bacteria as compared to others. The activity of antimicrobial agents is depending upon the type of species. The inhibition of biofilm activity was increased with an increase in surfactin concentration. Surfactin modifies the bacterial surface hydrophobicity and affects the development of flagella.129 The metabolic activity of bacteria was also evaluated (Figure 12). The metabolic activity was decreased after the addition of surfactin. The generation of ROS is an effective therapeutic method to produce an antimicrobial activity by interacting with the thiol groups in proteins, DNA, and cell membranes.130 The overproduction of ROS creates oxidative stress. MDA is known as the important marker for lipid peroxidation because the reaction between ROS and lipids produce MDA as a by-product. Increased MDA levels in both S. mutans and P. gingivalis indicated that the nanoparticle produced antimicrobial activity by promoting lipid peroxidation and oxidative stress (Figure 13). The potential activity of antimicrobial agents against bacteria was confirmed AO assay (Figure 14). It was understood that bacteria were more sensitive to 200 SNPs.
The present study investigated the extraction and modification of CNF and used it as a potential drug delivery system for periodontal pathogens by incorporating surfactin. The results were shown the successful extraction of CNF and the modification increased its hydrophilicity and temperature tolerance. Antimicrobial studies revealed that the inhibition of S. mutans and P. gingivalis growth was done by inducing oxidative stress and reducing biofilm formation. The drug delivery mechanism of CO-CNF was depending upon its hydrophilicity, charge, and bioavailability. It is proposed that CO-CNF has a major role in the controlled release of surfactin and has been used as a potential drug carrier for biomedical applications.
Conclusion
Periodontitis is an inflammatory disease associated with microbial accumulation. The current study focused on the antimicrobial activity of surfactin-loaded CO-CNF against periodontal pathogens in addition to extraction and modification of CNF. Isolation of CNF from soybean curd residue was confirmed by x-ray diffraction, Fourier-transform infrared spectroscopy, and transmission electron microscopy analysis. Modification of CNF with CO improved the degradation temperature, hydrophilicity, crystallinity, and biocompatibility of the CNF. A sustained drug release of surfactin was also observed from CO-CNF. These results confirmed the use of CO-CNF as a drug carrier. Surfactin-loaded CO-CNF has antioxidant activity and it inhibited the growth of periodontal pathogens such as S. mutans and P. gingivalis by preventing biofilm formation, reducing the metabolic activity, and promoting oxidative stress in a concentration-dependent manner. Overall, the current study has led to the successful extraction of nanocellulose, its modification, and the antimicrobial activity of surfactin-loaded CO-CNF. As suggested by the results, the obtained material has a great potential in the application of periodontitis treatment.
Acknowledgments
This work was financially supported by the Center of Excellence for the Oceans, National Taiwan Ocean University from the Featured Areas Research Center Program within the framework of the Higher Education Sprout Project by the Ministry of Education (MOE) in Taiwan.
Disclosure
The authors declare no conflict of interest.
References
1. Nascimento PC, Castro MML, Magno MB, et al. Association between periodontitis and cognitive impairment in adults: a systematic review. Front Neurol. 2019;10(323):1–9. doi:10.3389/fneur.2019.00323
2. Aminu N, Chan S-Y, Yam M-F, Toh S-M. A dual-action chitosan-based nanogel system of triclosan and flurbiprofen for localised treatment of periodontitis. Int J Pharm. 2019;570:118659. doi:10.1016/j.ijpharm.2019.118659
3. Arigbede AO, Babatope BO, Bamidele MK. Periodontitis and systemic diseases: a literature review. J Indian Soc Periodontol. 2012;16(4):487–491. doi:10.4103/0972-124X.106878
4. Hoare A, Soto C, Rojas-Celis V, Bravo D. Chronic inflammation as a link between periodontitis and carcinogenesis. Mediators Inflamm. 2019;2019:1–14. doi:10.1155/2019/1029857
5. Helal O, Göstemeyer G, Krois J, Fawzy El Sayed K, Graetz C, Schwendicke F. Predictors for tooth loss in periodontitis patients: systematic review and meta-analysis. J Clin Periodontol. 2019;46(7):699–712. doi:10.1111/jcpe.13118
6. Chiranjeevi T, Prasad OH, Prasad UV, et al. Identification of microbial pathogens in periodontal disease and diabetic patients of south indian population. Bioinformation. 2014;10(4):241–245. doi:10.6026/97320630010241
7. Winning L, Linden GJ. Periodontitis and systemic disease. BDJ Team. 2015;2(10):15163. doi:10.1038/bdjteam.2015.163
8. Teughels W, Dhondt R, Dekeyser C, Quirynen M. Treatment of aggressive periodontitis. Periodontol. 2014;65(1):107–133. doi:10.1111/prd.12020
9. Li S, Zhu D, Li K, Yang Y, Lei Z, Zhang Z. Soybean curd residue: composition, utilization, and related limiting factors. ISRN Ind Eng. 2013;2013:1–8. doi:10.1155/2013/423590
10. Torki A, Khalaji-Pirbalouty V, Lorigooini Z, Rafieian-Kopaei M, Sadeghimanesh A, Rabiei Z. Anchusa italica extract: phytochemical and neuroprotective evaluation on global cerebral ischemia and reperfusion. Braz J Pharm. 2018;54:1–9.
11. Ravindran L, Sreekala MS, Thomas S. Novel processing parameters for the extraction of cellulose nanofibres (CNF) from environmentally benign pineapple leaf fibres (PALF): structure-property relationships. Int J Biol Macromol. 2019;131:858–870. doi:10.1016/j.ijbiomac.2019.03.134
12. O’Sullivan AC. Cellulose: the structure slowly unravels. Cellulose. 1997;4(3):173–207. doi:10.1023/A:1018431705579
13. Prakash Menon M, Selvakumar R, Suresh Kumar P, Ramakrishna S. Extraction and modification of cellulose nanofibers derived from biomass for environmental application. RSC Adv. 2017;7(68):42750–42773. doi:10.1039/C7RA06713E
14. Lin N, Dufresne A. Nanocellulose in biomedicine: current status and future prospect. Eur Polym J. 2014;59:302–325. doi:10.1016/j.eurpolymj.2014.07.025
15. Tan K, Heo S, Foo M, Chew IM, Yoo C. An insight into nanocellulose as soft condensed matter: challenge and future prospective toward environmental sustainability. Sci Total Environ. 2019;650:1309–1326. doi:10.1016/j.scitotenv.2018.08.402
16. Giri J, Adhikari R. A brief review on extraction of nanocellulose and its application. BIBECHANA. 2012;9:81–87. doi:10.3126/bibechana.v9i0.7179
17. Chandra J, George N, Narayanankutty SK. Isolation and characterization of cellulose nanofibrils from areca nut husk fibre. Carbohydr Polym. 2016;142:158–166. doi:10.1016/j.carbpol.2016.01.015
18. Hossain M, Zaman H, Rahman T. Derivation of nanocellulose from native rice husk. Chem Eng Res Bull. 2018;20:1–19. doi:10.3329/cerb.v20i1.36926
19. Morán J, Alvarez V, Cyras V, Vázquez A. Extraction of cellulose and preparation of nanocellulose from sisal fibers. Cellulose. 2008;15:149–159. doi:10.1007/s10570-007-9145-9
20. Halib N, Perrone F, Cemazar M, et al. Potential applications of nanocellulose-containing materials in the biomedical field. Materials (Basel). 2017;10(8):1–31. doi:10.3390/ma10080977
21. Trache D. Nanocellulose as a promising sustainable material for biomedical applications. AIMS Mat Sci. 2018;5:201–205. doi:10.3934/matersci.2018.2.201
22. Espino-Pérez E, Domenek S, Belgacem N, Sillard C, Bras J. Green process for chemical functionalization of nanocellulose with carboxylic acids. Biomacromolecules. 2014;15(12):4551–4560. doi:10.1021/bm5013458
23. Missoum K, Belgacem MN, Bras J. Nanofibrillated cellulose surface modification: a review. Materials (Basel). 2013;6(5):1745–1766. doi:10.3390/ma6051745
24. Kalsoom Khan A, Saba AU, Nawazish S, et al. Carrageenan based bionanocomposites as drug delivery tool with special emphasis on the influence of ferromagnetic nanoparticles. Oxid Med Cell Longev. 2017;2017:1–13. doi:10.1155/2017/8158315
25. Yu G, Guan H, Ioanoviciu AS, et al. Structural studies on κ-carrageenan derived oligosaccharides. Carbohydr Res. 2002;337(5):433–440. doi:10.1016/S0008-6215(02)00009-5
26. Azizi S, Mohamad R, Abdul Rahim R, Mohammadinejad R, Bin Ariff A. Hydrogel beads bio-nanocomposite based on kappa-carrageenan and green synthesized silver nanoparticles for biomedical applications. Int J Biol Macromol. 2017;104:423–431. doi:10.1016/j.ijbiomac.2017.06.010
27. Deng Y, Huang M, Sun D, et al. Dual physically cross-linked κ-carrageenan-based double network hydrogels with superior self-healing performance for biomedical application. ACS Appl Mater Interfaces. 2018;10(43):37544–37554. doi:10.1021/acsami.8b15385
28. Chen W-C, Juang R-S, Wei Y-H. Applications of a lipopeptide biosurfactant, surfactin, produced by microorganisms. Biochem Eng J. 2015;103:158–169. doi:10.1016/j.bej.2015.07.009
29. Isa MHM, Shannaq MAHF, Mohamed N, et al. Antibacterial activity of surfactin produced by b.Subtillis msh1. Tran Sci Technol. 2017;4:402–407.
30. Meena KR, Sharma A, Kanwar SS. Therapeutics. Antitumoral and antimicrobial activity of surfactin extracted from bacillus subtilis klp2015. Int J Pept Res Ther. 2019;1–11:423–433. Springer Netherlands.
31. Priyadarsini S, Mukherjee S, Mishra M. Nanoparticles used in dentistry: a review. J Oral Biol Craniofac Res. 2018;8(1):58–67. doi:10.1016/j.jobcr.2017.12.004
32. Horwitz W. Official Methods of Analysis of Aoac International. Gaithersburg, MD: AOAC International; 2000.
33. Maryana R, Ma’rifatun D, Wheni AI, Satriyo KW, Rizal WA. Alkaline pretreatment on sugarcane bagasse for bioethanol production. Energy Procedia. 2014;47:250–254. doi:10.1016/j.egypro.2014.01.221
34. Thiripura Sundari M, Ramesh A. Isolation and characterization of cellulose nanofibers from the aquatic weed water hyacinth—eichhornia crassipes. Carbohydr Polym. 2012;87(2):1701–1705. doi:10.1016/j.carbpol.2011.09.076
35. Wang B, Sain M. Isolation of nanofibers from soybean source and their reinforcing capability on synthetic polymers. Compos Sci Technol. 2007;67(11–12):2521–2527. doi:10.1016/j.compscitech.006.12.015
36. Wulandari WT, Rochliadi A, Arcana IM. Nanocellulose prepared by acid hydrolysis of isolated cellulose from sugarcane bagasse. IOP Conf Ser Mater Sci Eng. 2016;107:1–8. doi:10.1088/1757-899X/107/1/012045
37. Zain NFM, Yusop SM, Ahmad I. Preparation and characterization of cellulose and nanocellulose from pomelo (citrus grandis) albedo. J Nutr Food Sci. 2014;5:226–233.
38. Liu Z, Huang H. Preparation and characterization of cellulose composite hydrogels from tea residue and carbohydrate additives. Carbohydr Polym. 2016;147:226–233. doi:10.1016/j.carbpol.2016.03.100
39. Ghaderi-Ghahfarokhi M, Barzegar M, Sahari MA, Azizi MHJF, Technology B. Nanoencapsulation approach to improve antimicrobial and antioxidant activity of thyme essential oil in beef burgers during refrigerated storage. Food Bioprocess Tech. 2016;9(7):1187–1201. doi:10.1007/s11947-016-1708-z
40. Sun L, Chen Y, Zhou Y, et al. Preparation of 5-fluorouracil-loaded chitosan nanoparticles and study of the sustained release in vitro and in vivo. Asian J Pharm Sci. 2017;12(5):418–423. doi:10.1016/j.ajps.2017.04.002
41. Mubarak MQE, Hassan AR, Hamid AA, Kalil S, Isa MHM. A simple and effective isocratic HPLC method for fast identification and quantification of surfactin. Sains Malays. 2015;44:1–6. doi:10.17576/jsm-2015-4401-16
42. Alara OR, Abdurahman NH, Olalere OA. Optimization of microwave-assisted extraction of flavonoids and antioxidants from vernonia amygdalina leaf using response surface methodology. Food Bioprod Pro. 2018;107:36–48. doi:10.1016/j.fbp.2017.10.007
43. Palaksha M, Ahmed M, Das S. Antibacterial activity of garlic extract on streptomycin-resistant Staphylococcus aureus and Escherichia coli solely and in synergism with streptomycin. J Nat Sci Biol Med. 2010;1(1):12–15. doi:10.4103/0976-9668.71666
44. Hwang YY, Ramalingam K, Bienek DR, Lee V, You T, Alvarez R. Antimicrobial activity of nanoemulsion in combination with cetylpyridinium chloride in multidrug-resistant acinetobacter baumannii. Antimicrob Agents Chemother. 2013;57(8):3568–3575. doi:10.1128/AAC.02109-12
45. Gurunathan S, Han JW, Kwon D-N, Kim J-H. Enhanced antibacterial and anti-biofilm activities of silver nanoparticles against gram-negative and gram-positive bacteria. Nanoscale Res Lett. 2014;9(1):373. doi:10.1186/1556-276X-9-373
46. Kong Z-L, Johnson A, Ko F-C, He J-L, Cheng S-C. Effect of cistanche tubulosa extracts on male reproductive function in streptozotocin⁻nicotinamide-induced diabetic rats. Nutrients. 2018;10(10):1–22. doi:10.3390/nu10101562
47. Goel S, Mishra P. Thymoquinone inhibits biofilm formation and has selective antibacterial activity due to ros generation. Appl Microbiol Biotechnol. 2018;102(4):1955–1967. doi:10.1007/s00253-018-8736-8
48. Zhang L, Loh K-C, Sarvanantharajah S, Tong YW, Wang C-H, Dai Y. Mesophilic and thermophilic anaerobic digestion of soybean curd residue for methane production: characterizing bacterial and methanogen communities and their correlations with organic loading rate and operating temperature. Bioresour Technol. 2019;288:1–9. doi:10.1016/j.biortech.2018.09.080
49. Li B, Qiao M, Lu F. Composition, nutrition, and utilization of okara (soybean residue). Food Rev Int. 2012;28(3):231–252. doi:10.1080/87559129.2011.595023
50. Vong WC, Au Yang KLC, Liu S-Q. Okara (soybean residue) biotransformation by yeast Yarrowia lipolytica. Int J of Food Microbiol. 2016;235:1–9. doi:10.1016/j.ijfoodmicro.2016.06.039
51. Ventura-Cruz S, Tecante A. Extraction and characterization of cellulose nanofibers from rose stems (rosa spp.). Carbohydr Polym. 2019;220:53–59. doi:10.1016/j.carbpol.2019.05.053
52. Yano H, Omura H, Honma Y, Okumura H, Sano H, Nakatsubo FJC. Designing cellulose nanofiber surface for high density polyethylene reinforcement. Cellulose. 2018;25(6):3351–3362. doi:10.1007/s10570-018-1787-2
53. Sankalia MG, Mashru RC, Sankalia JM, Sutariya VB. Physicochemical characterization of papain entrapped in ionotropically cross-linked kappa-carrageenan gel beads for stability improvement using Doehlert shell design. J Pharm Sci. 2006;95(9):1994–2013. doi:10.1002/jps.20665
54. Stetefeld J, McKenna SA, Patel TR. Dynamic light scattering: a practical guide and applications in biomedical sciences. Biophys Rev. 2016;8(4):409–427. doi:10.1007/s12551-016-0218-6
55. Gurpreet K, Singh SK. Review of nanoemulsion formulation and characterization techniques. Indian J Pharm Sci. 2018;80:781–789. doi:10.4172/pharmaceutical-sciences.1000422
56. Bhattacharjee S. DLS and zeta potential – what they are and what they are not? J Control Release. 2016;235:337–351. doi:10.1016/j.jconrel.2016.06.017
57. Honary S, Zahir F. Effect of zeta potential on the properties of nano-drug delivery systems - a review (part 1). Trop J Pharm Res. 2013;12:255–264.
58. Joshi M, Bhattacharyya A. Characterization techniques for nanotechnology applications in textiles. Indian J Fibre Text Res. 2008;33:304–317.
59. Sharma R, Bisen DP, Shukla U, Sharma BG. X-ray diffraction: a powerful method of characterizing nanomaterials. Recent Res Sci Technol. 2012;42:77–79.
60. Chirayil CJ, Joy J, Mathew L, Mozetic M, Koetz J, Thomas S. Isolation and characterization of cellulose nanofibrils from helicteres isora plant. Ind Crop Prod. 2014;59:27–34. doi:10.1016/j.indcrop.2014.04.020
61. Valentim R, Andrade S, Dos Santos M, et al. Composite based on biphasic calcium phosphate (ha/β-TCP) and nanocellulose from the açaí tegument. Materials (Basel). 2018;11:1–16. doi:10.3390/ma11112213
62. Abraham E, Deepa B, Pothan LA, et al. Extraction of nanocellulose fibrils from lignocellulosic fibres: a novel approach. Carbohyd Polym. 2011;86(4):1468–1475. doi:10.1016/j.carbpol.2011.06.034
63. Lamaming J, Hashim R, Leh CP, Sulaiman O, Sugimoto T, Nasir M. Isolation and characterization of cellulose nanocrystals from parenchyma and vascular bundle of oil palm trunk (elaeis guineensis). Carbohydr Polym. 2015;134:534–540. doi:10.1016/j.carbpol.2015.08.017
64. Zeni M, Favero D, Pacheco K, Ana Grisa MC. Preparation of microcellulose (MCC) and nanocellulose (NCC) from eucalyptus kraft ssp pulp. Polym Sci. 2016;1:1–5. doi:10.4172/2471-9935.100007
65. Şen M, Erboz EN. Determination of critical gelation conditions of κ-carrageenan by viscosimetric and ft-ir analyses. Food Res Int. 2010;43(5):1361–1364. doi:10.1016/j.foodres.2010.03.021
66. Liew JWY, Loh KS, Ahmad A, Lim KL, Wan Daud WR. Synthesis and characterization of modified κ-carrageenan for enhanced proton conductivity as polymer electrolyte membrane. PLoS One. 2017;12(9):e0185313–e0185313. doi:10.1371/journal.pone.0185313
67. Iijima M, Hatakeyama T, Hatakeyama H. Gel-sol-gel transition of kappa–carrageenan and methylcellulose binary systems studied by differential scanning calorimetry. Thermochim Acta. 2014;596:63–69. doi:10.1016/j.tca.2014.09.021
68. Gan S, Zakaria S, Chia CH, Chen RS, Ellis AV, Kaco H. Highly porous regenerated cellulose hydrogel and aerogel prepared from hydrothermal synthesized cellulose carbamate. PLoS One. 2017;12(3):e0173743–e0173743. doi:10.1371/journal.pone.0173743
69. Bahuguna A, Khan I, Bajpai VK, Chul S. MTT assay to evaluate the cytotoxic potential of a drug. Bangladesh J Pharmacol. 2017;12:115–118. doi:10.3329/bjp.v12i2.30892
70. Jaiswal M, Dudhe R, Sharma PK. Nanoemulsion: an advanced mode of drug delivery system. 3 Biotech. 2015;5(2):123–127. doi:10.1007/s13205-014-0214-0
71. Vogel R, Pal AK, Jambhrunkar S, et al. High-resolution single particle zeta potential characterisation of biological nanoparticles using tunable resistive pulse sensing. Sci Rep. 2017;7(1):17479. doi:10.1038/s41598-017-14981-x
72. Shen S, Wu Y, Liu Y, Wu D. High drug-loading nanomedicines: progress, current status, and prospects. Int J Nanomed. 2017;12:4085–4109. doi:10.2147/IJN.S132780
73. Sousa M, Dantas IT, Feitosa FX, et al. Performance of a biosurfactant produced by bacillus subtilis lami005 on the formation of oil/biosurfactant/water emulsion: study of the phase behaviour of emulsified systems. Braz J Chem Eng. 2014;31:613–623. doi:10.1590/0104-6632.20140313s00002766
74. de Faria AF, Teodoro-Martinez DS, de Oliveira Barbosa GN, et al. Production and structural characterization of surfactin (c14/leu7) produced by bacillus subtilis isolate lsfm-05 grown on raw glycerol from the biodiesel industry. Process Biochem. 2011;46(10):1951–1957. doi:10.1016/j.procbio.2011.07.001
75. Hansen J, Bross P. A cellular viability assay to monitor drug toxicity. Methods Mol Biol. 2010;648:303–311.
76. Gasque K, Al-Ahj LP, Oliveira RC, Magalhães AC. Cell density and solvent are critical parameters affecting formazan evaluation in mtt assay. Braz Arch Biol Technol. 2014;57:381–385. doi:10.1590/S1516-89132014005000007
77. Jo HY, Kim Y, Park HW, et al. The unreliability of mtt assay in the cytotoxic test of primary cultured glioblastoma cells. Exp Neurobiol. 2015;24(3):235–245. doi:10.5607/en.2015.24.3.235
78. Panariti A, Miserocchi G, Rivolta I. The effect of nanoparticle uptake on cellular behavior: disrupting or enabling functions? Nanotechnol Sci Appl. 2012;5:87–100. doi:10.2147/NSA.S25515
79. Huang Y-W, Cambre M, Lee H-J. The toxicity of nanoparticles depends on multiple molecular and physicochemical mechanisms. Int J Mol Sci. 2017;18(12):2702. doi:10.3390/ijms18122702
80. Chen Z, Bertin R, Froldi G. Ec50 estimation of antioxidant activity in DPPH assay using several statistical programs. Food Chem. 2013;138(1):414–420. doi:10.1016/j.foodchem.2012.11.001
81. Sun Y, Yang B, Wu Y, et al. Structural characterization and antioxidant activities of κ-carrageenan oligosaccharides degraded by different methods. Food Chem. 2015;178:311–318. doi:10.1016/j.foodchem.2015.01.105
82. Balouiri M, Sadiki M, Ibnsouda SK. Methods for in vitro evaluating antimicrobial activity: a review. J Pharm Anal. 2016;6(2):71–79. doi:10.1016/j.jpha.2015.11.005
83. Haney EF, Trimble MJ, Cheng JT, Vallé Q, Hancock REW. Critical assessment of methods to quantify biofilm growth and evaluate antibiofilm activity of host defence peptides. Biomolecules. 2018;8(2):1–22. doi:10.3390/biom8020029
84. Corte L, Casagrande Pierantoni D, Tascini C, Roscini L, Cardinali G. Biofilm specific activity: a measure to quantify microbial biofilm. Microorganisms. 2019;7(3):1–14. doi:10.3390/microorganisms7030073
85. Mohamed MA, Nasr M, Elkhatib WF, Eltayeb WN. In vitro evaluation of antimicrobial activity and cytotoxicity of different nanobiotics targeting multidrug resistant and biofilm forming staphylococci. J BioMed Res Int. 2018;2018:1–7. doi:10.1155/2018/7658238
86. Ong KS, Cheow YL, Lee SM. The role of reactive oxygen species in the antimicrobial activity of pyochelin. J Adv Res. 2017;8(4):393–398. doi:10.1016/j.jare.2017.05.007
87. Neeraja M, Lakshmi V, Padmasri C, Padmaja K. Utility of acridine orange staining for detection of bacteria from positive blood cultures. J Microbiol Methods. 2017;139:215–217. doi:10.1016/j.mimet.2017.06.014
88. Li S, Chen G, Qiang S, et al. Intensifying soluble dietary fiber production and properties of soybean curd residue via autoclaving treatment. Bioresour Technol Rep. 2019;7:100203. doi:10.1016/j.biteb.2019.100203
89. O’Toole DK. Characteristics and use of okara, the soybean residue from soy milk production - a review. J Agric Food Chem. 1999;47(2):363–371. doi:10.1021/jf980754l
90. Kasai N, Murata A, Inui H, Sakamoto T, Kahn RI. Enzymatic high digestion of soybean milk residue (okara). J Agric Food Chem. 2004;52(18):5709–5716. doi:10.1021/jf035067v
91. Phanthong P, Reubroycharoen P, Hao X, Xu G, Abudula A, Guan G. Nanocellulose: extraction and application. Carbon Resour Convers. 2018;1(1):32–43. doi:10.1016/j.crcon.2018.05.004
92. Trifol J, Sillard C, Plackett D, Szabo P, Bras J, Daugaard AEJC. Chemically extracted nanocellulose from sisal fibres by a simple and industrially relevant process. Cellulose. 2017;24(1):107–118. doi:10.1007/s10570-016-1097-5
93. Islam M, Mahbubul Alam M, Zoccola M. Review on modification of nanocellulose for application in composites. Int J Innov Res Sci Eng Technol. 2013;2(10):5444–5451.
94. Börjesson M, Westman G. Crystalline nanocellulose — preparation, modification, and properties. IntechOpen. 2015;159–191.
95. Habibi Y. Key advances in the chemical modification of nanocelluloses. Chem Soc Rev. 2014;43(5):1519–1542. doi:10.1039/C3CS60204D
96. Chen X, Zhao X, Gao Y, Yin J, Bai M, Wang F. Green synthesis of gold nanoparticles using carrageenan oligosaccharide and their in vitro antitumor activity. Mar Drugs. 2018;16(8):277. doi:10.3390/md16080277
97. Hu X, Jiang X, Aubree E, Boulenguer P, Critchley AT. Preparation and in vivo. antitumor activity of κ-carrageenan oligosaccharides. Pharm Biol. 2006;44(9):646–650. doi:10.1080/13880200601006848
98. Liu S, Huang S, Li L. Thermoreversible gelation and viscoelasticity of κ-carrageenan hydrogels. J Rheol. 2016;60(2):203–214. doi:10.1122/1.4938525
99. Rochas C, Geissler E. Measurement of dynamic light scattering intensity in gels. Macromolecules. 2014;47(22):8012–8017. doi:10.1021/ma501882d
100. Kaszuba M, McKnight D, Connah MT, McNeil-Watson FK, Nobbmann U. Measuring sub nanometre sizes using dynamic light scattering. J Nanoparticle Res. 2008;10(5):823–829. doi:10.1007/s11051-007-9317-4
101. Pradhan S, Hedberg J, Blomberg E, Wold S, Odnevall Wallinder I. Effect of sonication on particle dispersion, administered dose and metal release of non-functionalized, non-inert metal nanoparticles. J Nanoparticle Res. 2016;18(9):285. doi:10.1007/s11051-016-3597-5
102. Agwuncha S, Anusionwu C, Owonubi S, Rotimi Sadiku E, Busuguma UA, Ibrahim I. Extraction of Cellulose Nanofibers and Their Eco/Friendly Polymer Composites. Springer; 2019:37–64.
103. Rahimi M, Brown RJ, Tsuzuki T, Rainey T. A comparison of cellulose nanocrystals and cellulose nanofibres extracted from bagasse using acid and ball milling methods. Adv Nat Sci-Nanosci. 2016;7:1–9.
104. Clogston J, Patri AK. Zeta potential measurement. Methods Mol Biol. 2011;697:63–70.
105. Nagarajan KJ, Balaji AN, Ramanujam NR. Isolation and characterization of cellulose nanocrystals from saharan aloe vera cactus fibers. Int J Polym Anal Ch. 2018;1–14.
106. Leite ALMP, Zanon CD, Menegalli FC. Isolation and characterization of cellulose nanofibers from cassava root bagasse and peelings. Carbohydr Polym. 2017;157:962–970. doi:10.1016/j.carbpol.2016.10.048
107. Mosgoeller W, Prassl R, Zimmer A. Chapter seventeen - nanoparticle-mediated treatment of pulmonary arterial hypertension. Methods Enzymol. 2012;508:325–354.
108. Danaei M, Dehghankhold M, Ataei S, et al. Impact of particle size and polydispersity index on the clinical applications of lipidic nanocarrier systems. Pharmaceutics. 2018;10(2):1–17. doi:10.3390/pharmaceutics10020057
109. Vernon-Parry KD. Scanning electron microscopy: an introduction. III-Vs Rev. 2000;13(4):40–44.
110. Gauvin R. Review of transmission electron microscopy for the characterization of materials. SPIE. 1997;10291:200–229.
111. Daniel-da-Silva AL, Pinto F, Lopes-da-Silva JA, Trindade T, Goodfellow BJ, Gil AM. Rheological behavior of thermoreversible κ-carrageenan/nanosilica gels. J Colloid Interf Sci. 2008;320(2):575–581. doi:10.1016/j.jcis.2008.01.035
112. Rani A, Monga S, Bansal M, Sharma A. Bionanocomposites reinforced with cellulose nanofibers derived from sugarcane bagasse. Polym Compos. 2018;39(S1):E55–E64. doi:10.1002/pc.24112
113. Jung Y-S, Lee B-H, Yoo S-H, Gomez-Casati DF. Physical structure and absorption properties of tailor-made porous starch granules produced by selected amylolytic enzymes. PLoS One. 2017;12(7):1–14. doi:10.1371/journal.pone.0181372
114. Thommes M, Baert L, van ’T Klooster G, et al. Improved bioavailability of darunavir by use of κ-carrageenan versus microcrystalline cellulose as pelletisation aid. Eur J Pharm Biopharm. 2009;72(3):614–620. doi:10.1016/j.ejpb.2009.03.004
115. Petit C, Batool F, Bugueno IM, Schwint P, Benkirane-Jessel N, Huck O. Contribution of statins towards periodontal treatment: a review. Mediat Inflamm. 2019;2019:1–33. doi:10.1155/2019/6367402
116. Lasserre JF, Brecx MC, Toma S. Oral microbes, biofilms and their role in periodontal and peri-implant diseases. Materials (Basel). 2018;11(10):1–17.
117. Rafiei M, Kiani F, Sayehmiri F, Sayehmiri K, Sheikhi A, Zamanian Azodi M. Study of porphyromonas gingivalis in periodontal diseases: a systematic review and meta-analysis. Med J Islam Repub Iran. 2017;31(1):62. doi:10.14196/mjiri.31.62
118. How KY, Song KP, Chan KG. Porphyromonas gingivalis: an overview of periodontopathic pathogen below the gum line. Front Microbiol. 2016;7:53. doi:10.3389/fmicb.2016.00053
119. Nakayama M, Ohara N. Molecular mechanisms of porphyromonas gingivalis-host cell interaction on periodontal diseases. Jpn Dent Sci Rev. 2017;53(4):134–140. doi:10.1016/j.jdsr.2017.06.001
120. Dani S, Prabhu A, Chaitra KR, Desai NC, Patil SR, Rajeev R. Assessment of streptococcus mutans in healthy versus gingivitis and chronic periodontitis: a clinico-microbiological study. Contemp Clin Dent. 2016;7(4):529–534. doi:10.4103/0976-237X.194114
121. Laosuwan K, Epasinghe DJ, Wu Z, Leung WK, Green DW, Jung HS. Comparison of biofilm formation and migration of streptococcus mutans on tooth roots and titanium miniscrews. Clin Exp Dent Res. 2018;4(2):40–47. doi:10.1002/cre2.101
122. Scharnow AM, Solinski AE, Wuest WM, Targeting S. mutans biofilms: a perspective on preventing dental caries. Med Chem Comm. 2019;10(7):1057–1067. doi:10.1039/C9MD00015A
123. Joe MM, Bradeeba K, Parthasarathi R, et al. Development of surfactin based nanoemulsion formulation from selected cooking oils: evaluation for antimicrobial activity against selected food associated microorganisms. J Taiwan Inst Chem. 2012;43(2):172–180. doi:10.1016/j.jtice.2011.08.008
124. Shalaby KS, Soliman ME, Casettari L, et al. Determination of factors controlling the particle size and entrapment efficiency of noscapine in PEG/PLA nanoparticles using artificial neural networks. Int J Nanomedicine. 2014;9:4953–4964. doi:10.2147/IJN.S68737
125. Bo S, Min Z, Jing S, Zhibin H, Pedram F, Yonghao N. Applications of cellulose-based materials in sustained drug delivery systems. Curr Med Chem. 2019;26(14):2485–2501. doi:10.2174/0929867324666170705143308
126. Gupta D. Methods for determination of antioxidant capacity: a review. Int J Pharm Sci Res. 2015;6:546–566.
127. Ndlovu T, Rautenbach M, Vosloo JA, Khan S, Khan W. Characterisation and antimicrobial activity of biosurfactant extracts produced by bacillus amyloliquefaciens and pseudomonas aeruginosa isolated from a wastewater treatment plant. AMB Express. 2017;7(1):108. doi:10.1186/s13568-017-0363-8
128. Wilson C, Lukowicz R, Merchant S, et al. Quantitative and qualitative assessment methods for biofilm growth: a mini-review. Res Rev J Eng Technol. 2017;6(4):1–42.
129. Moryl M, Spętana M, Dziubek K, et al. Antimicrobial, antiadhesive and antibiofilm potential of lipopeptides synthesised by bacillus subtilis, on uropathogenic bacteria. Acta biochim Pol. 2015;62:725–732. doi:10.18388/abp.2015_1120
130. Memar MY, Ghotaslou R, Samiei M, Adibkia K. Antimicrobial use of reactive oxygen therapy: current insights. Infect Drug Resist. 2018;11:567–576. doi:10.2147/IDR.S142397
 © 2020 The Author(s). This work is published and licensed by Dove Medical Press Limited. The full terms of this license are available at https://www.dovepress.com/terms.php and incorporate the Creative Commons Attribution - Non Commercial (unported, v3.0) License.
By accessing the work you hereby accept the Terms. Non-commercial uses of the work are permitted without any further permission from Dove Medical Press Limited, provided the work is properly attributed. For permission for commercial use of this work, please see paragraphs 4.2 and 5 of our Terms.
© 2020 The Author(s). This work is published and licensed by Dove Medical Press Limited. The full terms of this license are available at https://www.dovepress.com/terms.php and incorporate the Creative Commons Attribution - Non Commercial (unported, v3.0) License.
By accessing the work you hereby accept the Terms. Non-commercial uses of the work are permitted without any further permission from Dove Medical Press Limited, provided the work is properly attributed. For permission for commercial use of this work, please see paragraphs 4.2 and 5 of our Terms.