")
Back to Journals » International Journal of Nanomedicine » Volume 10 » Issue 1
Surface-enhanced Raman spectroscopy of saliva proteins for the noninvasive differentiation of benign and malignant breast tumors
Authors Feng S, Huang S, Lin D, Chen G, Xu Y, Li Y, Huang Z, Pan J, Chen R, Zeng H
Received 26 July 2014
Accepted for publication 25 October 2014
Published 12 January 2015 Volume 2015:10(1) Pages 537—547
DOI https://doi.org/10.2147/IJN.S71811
Checked for plagiarism Yes
Review by Single anonymous peer review
Peer reviewer comments 5
Editor who approved publication: Professor Lei Yang
Shangyuan Feng,1 Shaohua Huang,1 Duo Lin,2 Guannan Chen,1 Yuanji Xu,3 Yongzeng Li,1 Zufang Huang,1 Jianji Pan,3 Rong Chen,1 Haishan Zeng4
1Key Laboratory of OptoElectronic Science and Technology for Medicine, Ministry of Education, Fujian Normal University, 2Fujian University of Traditional Chinese Medicine, 3Fujian Provincial Tumor Hospital, Fuzhou, People’s Republic of China; 4Imaging Unit – Integrative Oncology Department, British Columbia Cancer Agency Research Centre, Vancouver, BC, Canada
Abstract: The capability of saliva protein analysis, based on membrane protein purification and surface-enhanced Raman spectroscopy (SERS), for detecting benign and malignant breast tumors is presented in this paper. A total of 97 SERS spectra from purified saliva proteins were acquired from samples obtained from three groups: 33 healthy subjects; 33 patients with benign breast tumors; and 31 patients with malignant breast tumors. Subtle but discernible changes in the mean SERS spectra of the three groups were observed. Tentative assignments of the saliva protein SERS spectra demonstrated that benign and malignant breast tumors led to several specific biomolecular changes of the saliva proteins. Multiclass partial least squares–discriminant analysis was utilized to analyze and classify the saliva protein SERS spectra from healthy subjects, benign breast tumor patients, and malignant breast tumor patients, yielding diagnostic sensitivities of 75.75%, 72.73%, and 74.19%, as well as specificities of 93.75%, 81.25%, and 86.36%, respectively. The results from this exploratory work demonstrate that saliva protein SERS analysis combined with partial least squares–discriminant analysis diagnostic algorithms has great potential for the noninvasive and label-free detection of breast cancer.
Keywords: SERS, saliva protein purification, PLS-DA, breast cancer, noninvasive detection
Introduction
Breast cancer is the most common malignancy for women in the world.1 Despite advances in treatments, more than 520,000 people die of this disease annually worldwide.1 Most breast cancers are diagnosed at a late or advanced stage, resulting in high mortality. Early detection and diagnosis, combined with effective treatments, are essential for improving the survival rate of breast cancer patients. A desirable cancer screening test should be noninvasive, highly sensitive, highly specific, and rapid. However, there are many drawbacks in current breast cancer screening methods. For instance, ultrasonography for detecting architectural distortion of breast lesions is a noninvasive and inexpensive technique, but its spatial resolution is not high enough for the detection of early cancers.2 Although the magnetic resonance imaging technique can provide a good comparison of the distinctive soft tissues of people, it requires more time for the examination and it also gives rise to hyperpyrexia or leads to an adverse impact on the kidneys.3 Positron emission tomography combined with F-18 fluorodeoxyglucose enables the visualization of increased glucose metabolism of breast cancer, but the technique’s sensitivity is not good enough to detect tiny breast tumors.4,5 Currently, X-ray mammography remains the major means for breast cancer screening and detection, but its sensitivity and specificity are low, especially for patients with high-density breast tissues.6 This could lead to unsatisfactory levels of false-positive and false-negative consequences, reaching up to 75% and 34%, respectively.6–8 In addition, mammography is not a definite diagnostic technique, as it cannot distinguish benign from malignant breast lesions.9 In brief, the current methods are inaccurate, time consuming, invasive, and impractical for identifying early neoplasia or subtle lesions. Thus, there is an urgency to develop a more sensitive, rapid, and convenient clinical method for differentiating benign from malignant breast tumors.
If a reliable analytical method can be developed, then the saliva test can be a preferred screening test for cancer detection. As an important diagnostic body fluid, saliva contains many kinds of proteins that may be associated with disease transformation and can be very useful for human disease diagnosis.10 In addition, saliva also contains nucleic acids that might be used as tumor biomarkers for diagnosis.11 Compared with other human biological samples, saliva has a number of advantages, such as the fact that it is a noninvasive collection method, and it is easy to store and ship. Saliva samples can be obtained conveniently, nondestructively, and even repeatedly with limited training using simple equipment during the monitoring procedures for high-risk patients.
Based on molecular vibration, Raman spectroscopy (RS) has been regarded as a promising optical technique for the comprehensive investigation of cancer diagnosis over the last 2 decades.12 RS can be used to detect structural and biochemical changes in proteins and nucleic acids, accompanied with important diseased transformation.13 However, there are very few reports using regular RS to study human saliva samples for cancer detection due to its inherently small scattering cross-section and the strong background fluorescence interference. These limitations of regular Raman most likely make the technique not sensitive enough for detecting the subtle biochemical changes in human saliva samples for medical diagnosis.
Surface-enhanced RS (SERS) can overcome the major drawbacks of regular RS and has been developed to dramatically enhance the Raman signal for up to 1013–1015 times and to inhibit the autofluorescence background interference at the same time by utilizing the interaction between the target molecules and the metal nanoparticle (NP) surface.13,14 Recent reports showed that SERS has been extensively applied to a great deal of analytical systems in the research of biological molecules, from DNA,15 RNA,16 to whole proteins.17,18 SERS is especially attractive for application in cancer diagnosis and evaluation utilizing human biological samples such as blood,19 tissues,20 cells,21 and serum.22 As a potential diagnostic media for disease detection, saliva offers main advantages over blood due to the easy and noninvasive sample collection, which eliminates any feelings of pain and discomfort during the process of blood collection. In addition, human saliva contains a rich variety of proteins that may carry several significant biological functions, rendering saliva protein an attractive source of disease biomarkers.
The composition or content of proteins in human saliva may be closely related to metabolic abnormalities when disease afflicts the body, which makes it possible to detect many diseases via the SERS spectral features of saliva. However, due to interferences of other native saliva constituents and exogenous substances, a poor signal-to-noise ratio of the SERS spectra appeared in some reports about oral23 and lung cancer24 detection. Therefore, it is advantageous to perform protein purification of saliva samples prior to SERS spectral analysis in biomedical diagnosis.
The primary aim of this study was to assess the feasibility of a SERS technology combined with membrane protein purification for the biomolecular analysis of saliva for the differentiation of benign and malignant breast tumors. Partial least squares (PLS)–discriminant analysis (PLS-DA) was employed to analyze and distinguish between the saliva protein SERS spectra of healthy subjects, patients with benign breast tumor, and patients with malignant breast tumor. To our knowledge, this is the first report on saliva protein-based SERS for breast cancer detection.
Materials and methods
Subjects and protocol
In this study, a total of 64 saliva samples (33 benign and 31 malignant samples) were obtained from 64 patients with confirmed clinical and histopathological diagnosis of breast lesions. Table 1 shows more detailed clinical information on these subjects. In addition, there are 33 saliva samples acquired from 33 healthy volunteers as the control group. All patients and healthy volunteers were from the Fujian Tumor Hospital (Fuzhou, People’s Republic of China), and they had similar ethnic and socioeconomic backgrounds. All of the study subjects provided written consent to participate in the study. Ethics permission for the study was obtained from the Fujian Provincial Tumor Hospital.
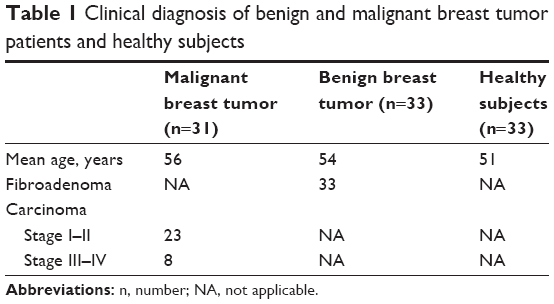 | Table 1 Clinical diagnosis of benign and malignant breast tumor patients and healthy subjects |
Preparation of silver (Ag) colloids and human saliva samples
Ag colloids were prepared using hydroxylamine hydrochloride and Ag nitrate, in accordance with the method reported by Leopold and Lendl.25 In short, a total of 9 mL of 0.1 M sodium hydroxide solution was mixed with 10 mL of 0.06 M hydroxylamine hydrochloride solution to adjust the pH value of hydroxylamine hydrochloride solution. Then, the mixture was quickly added to 180 mL of 0.0011 M Ag nitrate solution, and the resulting mixture was shaken to obtain a homogeneous milky gray mixture. Absorption spectroscopy was utilized to characterize the prepared Ag colloids. The measurement demonstrated an absorption maximum at 418 nm. The particle sizes were determined by transmission electron microscopy, as described in our previous paper.13 The particle sizes followed a normal distribution with a mean diameter of 35 nm and a standard deviation of 5 nm. Finally, the Ag colloids were concentrated by centrifugation at 10,000 rpm for 10 minutes to get high-concentration Ag NPs as the SERS substrate.
To obtain consistent and pure saliva samples, the same procedures were followed for all sample collection procedures. To begin, after 12 hours of overnight fasting, 1.5 mL of saliva was collected from the volunteers, between 6.30–8.30 am, after the participant rinsed his or her mouth three times in order to prevent the interference of food. Then, the saliva was collected into a 2 mL centrifuge tube and was centrifuged at 10,000 rpm for 10 minutes to remove oral impurities, including epithelial cells and any residual food debris. The refrigerated centrifuge was set at a constant temperature of 4°C. Finally, the saliva samples were frozen in liquid nitrogen immediately after centrifugation to reduce degradation.
Saliva membrane protein purification and mixing with Ag nanoparticles
Figure 1A shows the schematic representation of the procedures used to obtain the mixture of purified saliva proteins and Ag NPs. Firstly, 10 μL of a pure saliva sample was blotted onto a cellulose acetate (CA) membrane by a sample applicator, three times. After the saliva sample was completely absorbed in about 15 minutes, the membrane was washed for 6 minutes in 500 mL of a special solution made up of 225 mL of 95% ethanol, 25 mL of glacial acetic acid, and 250 mL of distilled water. This will get rid of any other component contained in the saliva sample other than proteins. The membrane was then transferred onto a filter paper to dry for about 30 minutes. After that, the CA membrane, which contained only saliva proteins, was cut into pieces and collected in a centrifuge tube. Then, 150 μL of acetic acid was added into the tube to dissolve the membrane fragments into a homogeneous transparent gel. Afterwards, 200 μL of a Ag colloids solution, as prepared earlier, was added into the tube. The mixture was agitated until a flocculent precipitate (dissolved CA membrane) appeared. Then, the tubes were placed into 37°C warm water for 30 minutes. Finally, the liquid supernatant (protein–Ag NP mixture) was dripped onto the aluminum plate for SERS measurement.
 | Figure 1 Schematic diagram of the preparation procedure of the saliva protein–Ag NP mixture, and a comparison of the SERS spectrum of the saliva protein–Ag NP mixtures, the regular Raman spectrum of saliva protein without Ag solution, and the blank spectrum of Ag nanoparticles (NPs). |
SERS measurements
All SERS measurements of the saliva protein were performed on a confocal Raman microspectrometer (Renishaw plc, Gloucestershire, UK) equipped with a Peltier cooled charge-coupled device camera for spectral detection and a 785 nm diode laser for Raman excitation. A Leica 50× objective was used to collect the SERS signals from the sample illuminated by 5 mW of incident laser power. Each SERS spectrum was acquired using a 10-second exposure time and with a spectral resolution of 2 cm−1 in the wave number range of 500–1,780 cm−1. Three spectra were measured from different locations for each saliva protein sample to obtain a mean spectrum. The software package WIRE 2.0 (Renishaw plc) was used for spectral acquisition and analysis.
Statistical analysis
Principal component analysis (PCA) was widely applied for simplifying complex datasets. PCA extracts a set of orthogonal principal components in a multidimensional dataset that best accounts for the differences in the observations for RS-based diagnostics.13,19,26 PLS-DA is based on the regression extension of PCA, and was advantageously employed to multiclass classification problems by providing group affinity with the class membership of zeros and ones to maximize the variations between groups. PLS-DA follows the fundamental principle of PCA and further rotates the components (latent variables [LVs]) to achieve the maximum group severance via spectral variation and group affinity. The diagnostically relevant variations can be presented by the LVs, rather than by the significant differences in the dataset.27,28
In this work, to test the capability of saliva protein SERS spectra for differentiating between normal breast tissue, benign breast tumor, and malignant breast tumor, we performed PLS-DA to classify the measured saliva protein SERS spectra with the leave-one-patient-out cross-validation method. In the first step, a modified multipolynomial fitting algorithm was used to deduct the fluorescence background of the initial SERS data. Next, the area normalization method was employed to normalize each spectrum, and after that, the data were fed into the PLS toolbox in the Matlab programming environment for PLS-DA analysis. The two linear discriminant functions with the group centroids were generated to further analyze and classify the saliva protein SERS spectra into three categories: normal; benign breast tumor; and malignant breast tumor.
Results
To assess the enhancement effects on the human saliva protein Raman signal, the regular Raman spectrum and SERS spectrum of saliva protein were obtained from the same protein sample. The SERS spectrum of saliva protein–Ag NP mixtures, the regular Raman spectrum of saliva protein without Ag solution, and the blank spectra of Ag NPs were shown in the last panel of the schematic diagram (Figure 1B). They were measured under the same experimental conditions. Comparison of the SERS spectrum and regular Raman spectrum indicated that the intensity of many predominant vibration bands have been increased remarkably by the SERS-active NPs. In contrast, only a few weak Raman peaks could be observed in the native saliva protein without the Ag colloids due to the fluorescence background overlaying Raman signals. The fluorescence background can be restrained evidently in the SERS spectra, and the remarkable Raman bands can be observed clearly. From the blank spectra of NPs, we can observe only one weak Raman peak at 1,052 cm−1, which ensures that the peaks in the SERS spectrum of saliva proteins were not a result of added Ag NPs.
After eliminating the fluorescence background from the initial saliva protein SERS spectra, all the full protein SERS spectra were normalized to the integrated area under the curve ranging from 500 cm−1 to 1,780 cm−1 for a better comparison of SERS spectral shape in the analysis. Figure 2A shows the mean normalized SERS spectra of saliva proteins from healthy volunteers (number [n]=33), benign breast tumors (n=33), and malignant breast tumors (n=31), with standard deviations (SD) overlying as shaded color fills. The prominent SERS peaks were observed in both normal and breast tumor samples at 621 cm−1, 643 cm−1, 760 cm−1, 831 cm−1, 854 cm−1, 876 cm−1, 1,004 cm−1, 1,033 cm−1, 1,049 cm−1, 1,176 cm−1, 1,208 cm−1, 1,265 cm−1, 1,340 cm−1, 1,447 cm−1, and 1,684 cm−1. Especially for 1,004 cm−1, 1,265 cm−1, 1,447 cm−1, and 1,684 cm−1, they were the strongest Raman signals among the measured saliva protein SERS spectra. The SERS peaks at 621 cm−1, 1,049 cm−1, and 1,176 cm−1 are lower for the malignant tumor group than for the normal group, while SERS bands at 1,004 cm−1, 1,208 cm−1, 1,340 cm−1, and 1,684 cm−1 are more intense in the tumor group. Moreover, the peak position at 1,310 cm−1 in the normal saliva proteins seemingly had shifted to 1,318 cm−1 in cancer saliva proteins. Figure 2B shows the corresponding difference spectra of the different types of saliva proteins, revealing the significant SERS spectral changes, such as SERS peak intensities, positions, and spectral shoulder bands, specifically in the spectral ranges of 600–650 cm−1, 750–950 cm−1, 1,000–1,060 cm−1, 1,100–1,350 cm−1, and 1,440–1,700 cm−1 which primarily could be related to certain protein vibration bonds.
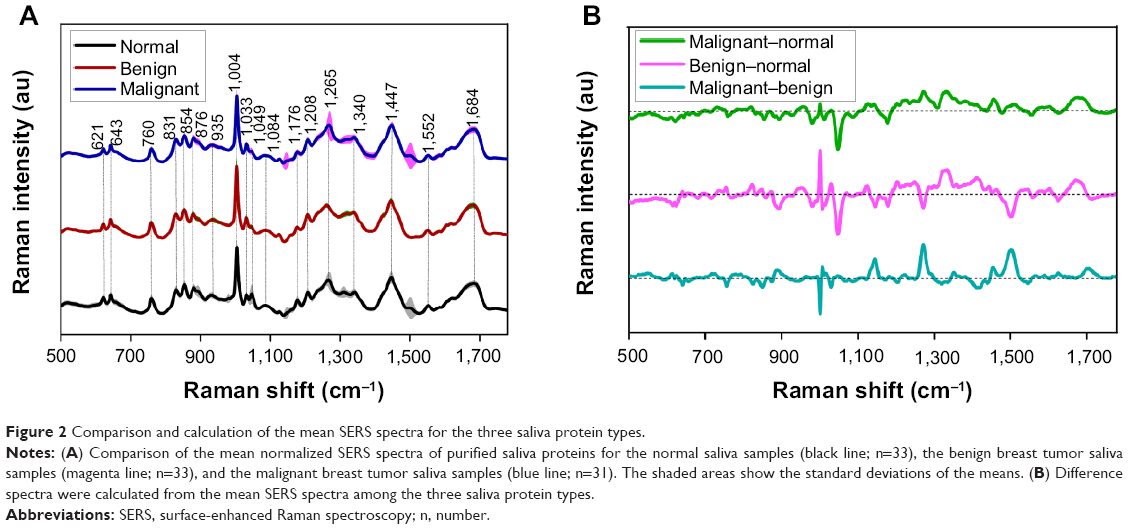 | Figure 2 Comparison and calculation of the mean SERS spectra for the three saliva protein types. |
Comparisons of the SERS intensities and SDs of the six prominent SERS peaks (1,004 cm−1, 1,049 cm−1, 1,176 cm−1, 1,265 cm−1, 1,340 cm−1, and 1,684 cm−1) showed significant differences (P<0.05; pairwise comparison of the saliva protein groups via Student’s t-test) between normal and breast tumor saliva proteins, as illustrated in the box charts (Figure 3). Compared with the normal saliva protein samples, the benign and malignant breast tumor saliva proteins exhibited lower intensities at 1,049 cm−1 and 1,176 cm−1, but they showed much increased SERS signals at 1,004 cm−1, 1,340 cm−1, and 1,684 cm−1. In addition, the unusual SERS intensities associated with the different degrees of diagnostic utility were used for discriminating between the three saliva protein groups (normal, benign breast tumor, and malignant breast tumor) via Student’s t-test. In particular, the malignant breast tumor samples represent greater intensities of SERS peaks at 1,265 cm−1 and 1,684 cm−1, while exhibiting much decreased signals at 1,004 cm−1, 1,176 cm−1, and 1,340 cm−1 when compared with benign breast tumor saliva proteins (Figures 2B and 3). The comparisons between the normal and malignant groups in Figures 3A and D, and the comparisons between the benign and malignant groups in Figures 3B, C, E, and F, have also been done; however, there was no significant difference for those comparisons. The exact P-value is shown in Table S1 in the supplementary materials. These results suggest that there is a remarkable increase and/or decrease in the percentage of biochemical substances involved in the total SERS-active constituents among the three saliva protein groups, indicating the diagnostic potential of SERS for saliva protein identification of the breast tumor.
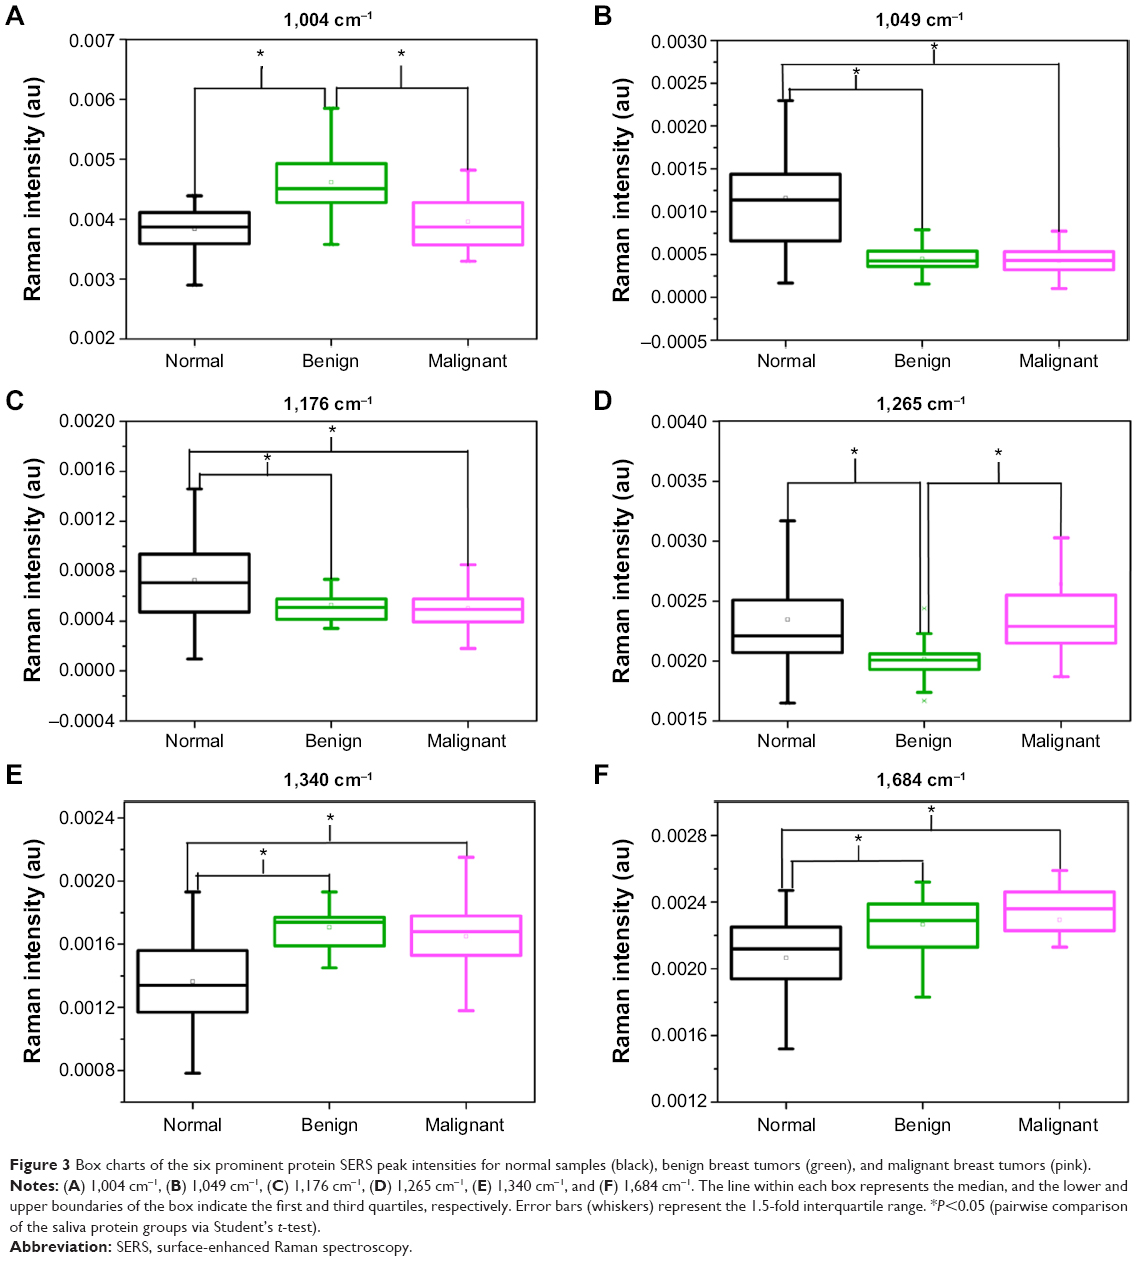 | Figure 3 Box charts of the six prominent protein SERS peak intensities for normal samples (black), benign breast tumors (green), and malignant breast tumors (pink). |
To assess the diagnostic accuracy of saliva protein SERS spectra, SERS spectral differences of the three different types of proteins were further explored in detail by the PLS-DA multivariate algorithm. Saliva protein SERS spectral datasets of the normal, benign, and malignant breast tumor patients were mean centered to exclude the common variances.29 The PLS diagnostic model coupled with the leave-one-patient-out cross-validation method was subsequently utilized as a diagnostic algorithm. The first seven factor LVs were found to be the optimal number of reserved components, as defined by the part minimum of the root mean square error of the cross-validation, as shown in Figure S1, accounting for 91.5% of the whole SERS spectral variances. Linear discriminate analysis was further utilized to generate a diagnostic algorithm using the first seven significant LVs.
Figure 4 shows the scatter plot of the coefficient of each sample according to the two linear discriminant functions with the group centroids for normal, benign, and malignant breast tumor samples, respectively. We can see that they were distributed in three relatively separate areas in spite of some overlap between each other, which indicates that the saliva protein SERS spectra of the three different types of saliva samples could be discriminated and classified for breast tumor detection. The ultimate diagnostic classification of each SERS spectrum is determined by PLS-DA with the leave-one-patient-out cross-validation method. The developed PLS-DA algorithm achieved diagnostic sensitivities of 75.75%, 72.73%, and 74.19%; specificities of 93.75%, 81.25%, and 86.36%; and accuracies of 87.63%, 78.35%, and 82.47%, respectively, when differentiating among normal saliva proteins, benign breast tumor saliva proteins, and malignant breast tumor saliva proteins (Table 2). To further evaluate the performance of the saliva protein SERS PLS-DA algorithm for differentiating between the three saliva groups, the receiver operating characteristic (ROC) curves were generated and are shown in Figure 5. The integration areas under the ROC curve are 0.852, 0.972, and 0.975 for malignant breast tumors versus benign breast tumors, benign breast lesions versus normal tissue, and malignant breast tumor versus normal classification, respectively. These results further demonstrate that the PLS-DA-based saliva protein SERS spectral classification method is powerful for the differentiation of different breast tumor types.
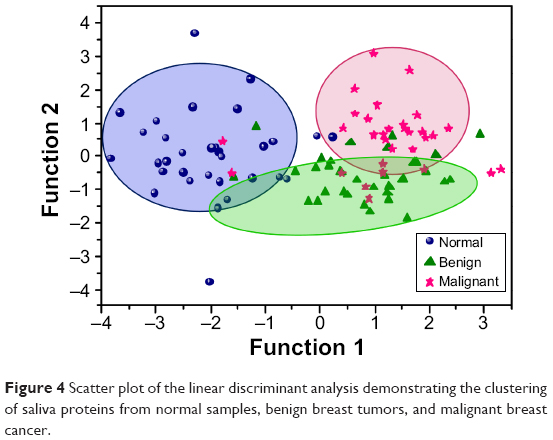 | Figure 4 Scatter plot of the linear discriminant analysis demonstrating the clustering of saliva proteins from normal samples, benign breast tumors, and malignant breast cancer. |
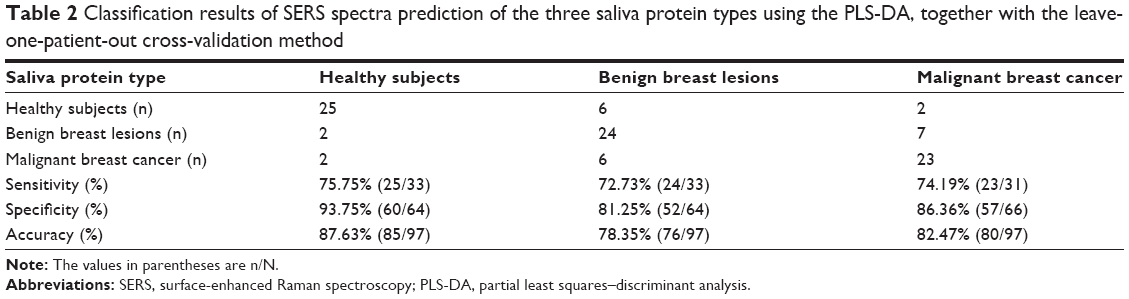 | Table 2 Classification results of SERS spectra prediction of the three saliva protein types using the PLS-DA, together with the leave-one-patient-out cross-validation method |
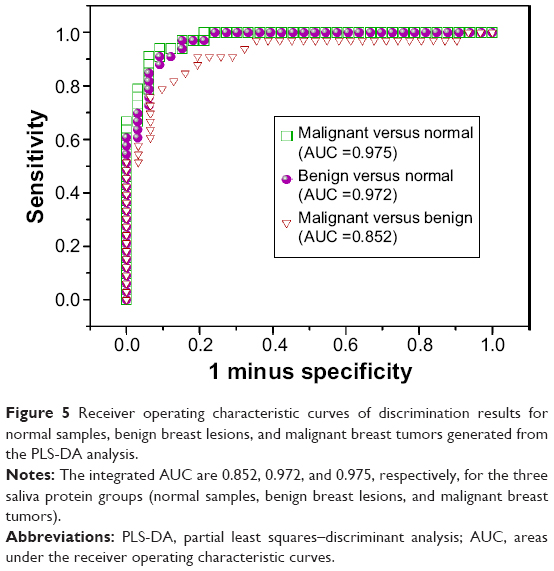 | Figure 5 Receiver operating characteristic curves of discrimination results for normal samples, benign breast lesions, and malignant breast tumors generated from the PLS-DA analysis. |
Discussion
The current screening examination for diagnosing breast cancer mainly relies upon X-ray mammography. However, benign and early malignant indications are often similar, and they are difficult to differentiate by X-ray mammography. Application of the SERS method has been explored for the detection of biochemical changes related to diseases, such as nasopharyngeal cancer13 and cervical cancer.26 In this study, SERS technology, which is capable of offering abundant biochemical information about saliva proteins, was employed as a potential diagnostic tool for the discrimination of normal tissues, benign breast tumors, and malignant tumors at the molecular level. To better comprehend the molecular basis for the observed saliva protein SERS spectra, the tentative assignments of the SERS bands are listed in Table 3, according to the known literature.30–32 The subtle but significant differences in SERS spectra of saliva proteins between healthy subjects, benign breast tumor patients, and malignant breast tumor patients are shown in Figure 2, suggesting the promising potential of the saliva protein SERS method for benign and malignant breast tumor detection and screening applications.
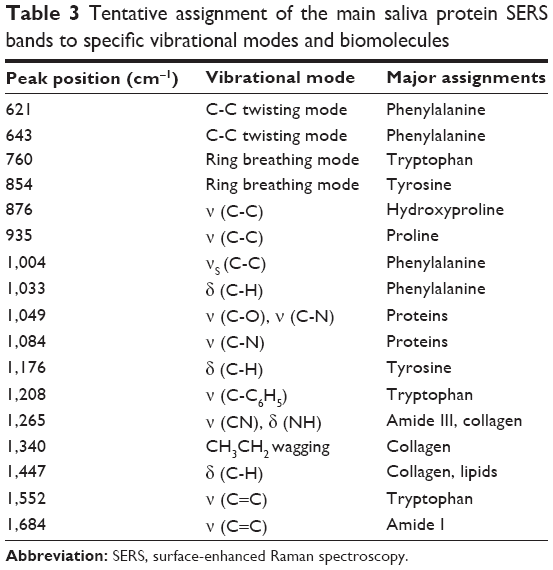 | Table 3 Tentative assignment of the main saliva protein SERS bands to specific vibrational modes and biomolecules |
For instance, the SERS bands at 1,049 cm−1 and 1,084 cm−1 were both related to the C-N stretching mode of proteins, and they showed a lower SERS signal in the malignant tumor samples than in the normal saliva protein samples, indicating that there was aberrant protein structure of C-N stretching bases in the saliva proteins of cancer patients. Our group also observed a similar phenomenon in nasopharyngeal cancer detection.31 Nevertheless, the significant Raman peaks at 1,265 cm−1 and 1,684 cm−1 corresponding to amide III and amide I presented higher SERS signal in malignant breast cancer, which could be attributed to vibrational modes of the amino acid bonds of the secondary structure of proteins.33 This characteristic could infer that the malignant breast tumor saliva may be relevant to an increased concentration of these relative proteins. The SERS peak at 1,340 cm−1 attributed to the CH3CH2 wagging mode of collagen showed greater signal in benign breast tumor samples, indicating that the amount of collagen increases in the saliva proteins of benign breast tumor samples. This is in agreement with the report that the content of collagen in the breast tissue was increased in association with benign transformations.34 These intensity differences were probably related to biomolecular changes, reflecting the constitutional differences of the saliva protein constituents in benign breast tumor patients.33–35
The protein SERS band at 1,265 cm−1, corresponding to amide III and collagen, is stronger in malignant breast tumor saliva protein than in benign breast tumor. This SERS peak intensity variation indicates the different collagen amounts present in normal and breast cancer patients’ saliva. Due to the desmoplastic reaction, the deposition of abundant collagen will occur as a stromal response to breast carcinoma, which may be reflected in the saliva protein SERS spectra. This relative increase in collagen abundance has also been observed in the carcinogenic process of lung and skin cancers.33 Besides, Figure 2 showed a greater SERS peak of 1,004 cm−1, which corresponds to the bond stretching of νs (C-C) of phenylalanine and could be used to identify the large amount of amino acids presented in the saliva proteins of benign breast tumor samples than in the malignant samples. This suggested that there was a decrease in the percentage of a certain phenylalanine relative to the total SERS-active components in malignant breast tumor subjects. Bergholt et al36 also observed this Raman band change by studying the role of ulcers between benign and malignant tumors in the stomach associated with disease transformations. Hence, the protein SERS signals from saliva samples as biomarkers observed between healthy subjects, and benign and malignant breast tumors indicate that saliva protein SERS can be employed to elucidate biomolecular and inherent changes of breast tumor subjects.
However, it should be noted that some of the single-protein SERS peak analyses mentioned earlier only exploit limited SERS bands; a majority of the information contained in the protein SERS spectrum has not been used for diagnostic analysis. Since the structure and composition of saliva proteins is complex, and given that the protein SERS spectra from different pathological types of breast tumors are very similar, it is necessary to develop a more sophisticated and robust diagnostic model based on PLS-DA by utilizing the entire SERS spectrum to determine the most diagnostically significant spectral features for saliva protein analysis for the classification of normal subjects, benign breast tumor patients, and malignant breast tumor patients. Figure 5 shows the scatter plot of the linear discriminant analysis, demonstrating the clustering of saliva proteins from the normal tissue, benign breast tumor, and malignant breast tumor categories using the PLS-DA diagnostic algorithm. Compared with the distribution patterns of the three kinds of protein samples, we can find that a clear separation between the healthy saliva samples and malignant breast tumor groups was achieved, primarily by the first discriminant function. Figure 5 shows that benign samples clearly fell into a region largely separated from healthy saliva samples. Similarly, a separation of benign and malignant breast tumor saliva protein samples could also be observed, although some larger overlap existed, which presumably reflected that there are similar alterations in the saliva protein components in benign breast tumor and malignant breast tumor samples, as compared to normal samples. This indicates that different stages of breast tumor samples still contain some similar constituents, which may be due to the homology of this breast tumor population. Chan and Lieu37 observed similar results in their biochemical analysis of stem cells by RS. ROC analysis further confirms that the saliva protein SERS, together with the PLS-DA diagnostic algorithm employing the entire SERS spectral features, is powerful for the classification of the normal, benign breast tumor, and malignant breast tumor groups.
Conclusion
In summary, we have shown the feasibility of saliva membrane protein purification combined with the Ag colloid-based SERS technique for revealing significant SERS spectral differences between healthy subjects, benign breast tumor patients, and malignant breast tumor patients. Tentative assignments of the measured SERS bands make it clear that benign and malignant breast tumors gave rise to the structural and specific biomolecular changes of saliva proteins, including the relative amounts of amino acids and collagen. These variations may be connected to metabolic changes among breast tumor patients. The combination of SERS technique and multiclass PLS-DA was employed to distinguish the saliva proteins of normal subjects, benign breast tumor patients, and malignant breast tumor patients with diagnostic accuracies of 87.63%, 78.35%, and 82.47%, respectively. These results from this exploratory study demonstrated the great potential of saliva protein SERS analysis, combined with PLS-DA diagnostic algorithms, as a clinical tool for label-free, noninvasive, and convenient breast cancer detection and screening.
Acknowledgments
This work was supported by the National Natural Science Foundation of China (numbers 11104030, 61178090, 81101110, and 61405036), major projects of international cooperation (number 61210016), the program for Changjiang Scholars and Innovative Research Team in University (number IRT1115), the Science and Technology Project of Fujian Province (number 2012J05004), the Project of the Educational Office of Fujian Province (number JA11055), and the Canadian Institutes of Health Research International Scientific Exchange Program.
Disclosure
The authors report no conflicts of interest in this work.
References
Davison Z, de Blacquière GE, Westley BR, May FE. Insulin-like growth factor-dependent proliferation and survival of triple-negative breast cancer cells: implications for therapy. Neoplasia. 2011;13(6):504–515. | ||
Takei J, Tsunoda-Shimizu H, Kikuchi M, et al. Clinical implications of architectural distortion visualized by breast ultrasonography. Breast Cancer. 2009;16(2):132–135. | ||
Le-Petross HT, Shetty MK. Magnetic resonance imaging and breast ultrasonography as an adjunct to mammographic screening in high-risk patients. Semin Ultrasound CT MR. 2011;32(4):266–272. | ||
Abreu MC, Almeida P, Balau F, et al. Clear-PEM: a dedicated PET camera for improved breast cancer detection. Radiat Prot Dosimetry. 2005;116(1–4 Pt 2):208–210. | ||
Avril N, Adler LP. F-18 fluorodeoxyglucose-positron emission tomography imaging for primary breast cancer and loco-regional staging. Radiol Clin North Am. 2007;45(4):645–657, vi. | ||
Surmacki J, Musial J, Kordek R, Abramczyk H. Raman imaging at biological interfaces: applications in breast cancer diagnosis. Mol Cancer. 2013;12:48. | ||
Obi N, Waldmann A, Schäfer F, Schreer I, Katalinic A. Impact of the Quality assured Mamma Diagnostic (QuaMaDi) programme on survival of breast cancer patients. Cancer Epidemiol. 2011;35(3):286–292. | ||
Bird RE, Wallace TW, Yankaskas BC. Analysis of cancers missed at screening mammography. Radiology. 1992;184(3):613–617. | ||
Elmore JG, Barton MB, Moceri VM, Polk S, Arena PJ, Fletcher SW. Ten-year risk of false positive screening mammograms and clinical breast examinations. N Engl J Med. 1998;338(16):1089–1096. | ||
Liu J, Duan Y. Saliva: a potential media for disease diagnostics and monitoring. Oral Oncol. 2012;48(7):569–577. | ||
Bonne NJ, Wong DT. Salivary biomarker development using genomic, proteomic and metabolomic approaches. Genome Med. 2012; 4(10):82. | ||
Li Y, Pan J, Chen G, et al. Micro-Raman spectroscopy study of cancerous and normal nasopharyngeal tissues. J Biomed Opt. 2013;18(2): 27003. | ||
Feng S, Chen R, Lin J, et al. Nasopharyngeal cancer detection based on blood plasma surface-enhanced Raman spectroscopy and multivariate analysis. Biosens Bioelectron. 2010;25(11):2414–2419. | ||
Kneipp K. Surface-enhanced Raman scattering. Physics Today. 2007;60(11):40. | ||
Harper MM, Dougan JA, Shand NC, Graham D, Faulds K. Detection of SERS active labelled DNA based on surface affinity to silver nanoparticles. Analyst. 2012;137(9):2063–2068. | ||
Badr Y, Mahmoud MA. Effect of silver nanowires on the surface-enhanced Raman spectra (SERS) of the RNA bases. Spectrochim Acta A Mol Biomol Spectrosc. 2006;63(3):639–645. | ||
Han XX, Zhao B, Ozaki Y. Surface-enhanced Raman scattering for protein detection. Anal Bioanal Chem. 2009;394(7):1719–1727. | ||
Ochsenkühn MA, Campbell CJ. Probing biomolecular interactions using surface enhanced Raman spectroscopy: label-free protein detection using a G-quadruplex DNA aptamer. Chem Commun (Camb). 2010; 46(16):2799–2801. | ||
Feng S, Chen R, Lin J, et al. Gastric cancer detection based on blood plasma surface-enhanced Raman spectroscopy excited by polarized laser light. Biosens Bioelectron. 2011;26(7):3167–3174. | ||
Chen Y, Zheng X, Chen G, et al. Immunoassay for LMP1 in nasopharyngeal tissue based on surface-enhanced Raman scattering. Int J Nanomedicine. 2012;7:73–82. | ||
Maiti KK, Dinish US, Fu CY, et al. Development of biocompatible SERS nanotag with increased stability by chemisorption of reporter molecule for in vivo cancer detection. Biosens Bioelectron. 2010;26(2): 398–403. | ||
Han HW, Yan XL, Dong RX, Ban G, Li K. Analysis of serum from type II diabetes mellitus and diabetic complication using surface-enhanced Raman spectra (SERS). Appl Phys B. 2009;94:667–672. | ||
Priezzhev AV, Cote GL, editors. Optical Diagnostics and Sensing V (SPIE Proceedings Volume 5702). Bellingham: SPIE; 2005. | ||
Li X, Yang T, Lin J. Spectral analysis of human saliva for detection of lung cancer using surface-enhanced Raman spectroscopy. J Biomed Opt. 2012;17(3):037003. | ||
Leopold N, Lendl B. A new method for fast preparation of highly surface-enhanced Raman scattering (SERS) active silver colloids at room temperature by reduction of silver nitrate with hydroxylamine hydrochloride. J Phys Chem B. 2003;107(24):5723–5727. | ||
Feng S, Lin D, Lin J, et al. Blood plasma surface-enhanced Raman spectroscopy for non-invasive optical detection of cervical cancer. Analyst. 2013;138(14):3967–3974. | ||
Hedegaard M, Krafft C, Ditzel HJ, Johansen LE, Hassing S, Popp J. Discriminating isogenic cancer cells and identifying altered unsaturated fatty acid content as associated with metastasis status, using k-means clustering and partial least squares-discriminant analysis of Raman maps. Anal Chem. 2010;87(7):2797–2802. | ||
De Lucia FC, Gottfried JL, Munson CA, Miziolek AW. Multivariate analysis of standoff laser-induced breakdown spectroscopy spectra for classification of explosive-containing residues. Appl Opt. 2008;47(31):G112–G121. | ||
Smilde A, Bro R, Geladi P. Multi-Way Analysis: Applications in the Chemical Sciences. Sussex, UK: John Wiley & Sons Ltd.; 2004. | ||
Movasaghi Z, Rehman S, Rehman IU. Raman spectroscopy of biological tissues. Applied Spectroscopy Reviews. 2007;42(5):493–541. | ||
Feng S, Lin D, Lin J. Saliva analysis combining membrane protein purification with surface-enhanced Raman spectroscopy for nasopharyngeal cancer detection. Appl Phys Lett. 2014;104(7):073702. | ||
Huang Z, McWilliams A, Lui H, McLean DI, Lam S, Zeng H. Near-infrared Raman spectroscopy for optical diagnosis of lung cancer. Int J Cancer. 2003;107(6):1047–1052. | ||
Bitar RA, Martinho Had S, Tierra-Criollo CJ, Zambelli Ramalho LN, Netto MM, Martin AA. Biochemical analysis of human breast tissues using Fourier-transform Raman spectroscopy. J Biomed Opt. 2006; 11(5):054001. | ||
Haka AS, Shafer-Peltier KE, Fitzmaurice M, Crowe J, Dasari RR, Feld MS. Diagnosing breast cancer by using Raman spectroscopy. Proc Natl Acad Sci U S A. 2005;102(35):12371–12376. | ||
Manoharan R, Shafer K, Perelman L, et al. Raman spectroscopy and fluorescence photon migration for breast cancer diagnosis and imaging. Photochem Photobiol. 1998;67(1):15–22. | ||
Bergholt MS, Zheng W, Lin K, et al. Raman endoscopy for in vivo differentiation between benign and malignant ulcers in the stomach. Analyst. 2010;135(12):3162–3168. | ||
Chan JW, Lieu DK. Label-free biochemical characterization of stem cells using vibrational spectroscopy. J Biophotonics. 2009;2(11): 656–668. |
Supplementary materials
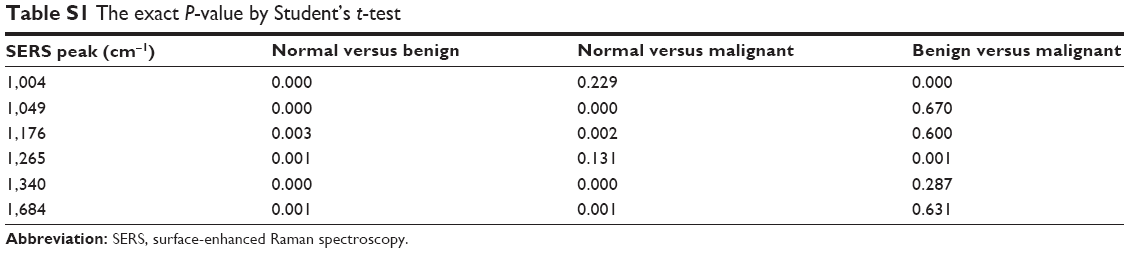 | Table S1 The exact P-value by Student’s t-test |
 | Figure S1 The number of PLS components (LVs) and the RMSECV for obtaining the optimal number of reserved components. |
 © 2015 The Author(s). This work is published and licensed by Dove Medical Press Limited. The full terms of this license are available at https://www.dovepress.com/terms.php and incorporate the Creative Commons Attribution - Non Commercial (unported, v3.0) License.
By accessing the work you hereby accept the Terms. Non-commercial uses of the work are permitted without any further permission from Dove Medical Press Limited, provided the work is properly attributed. For permission for commercial use of this work, please see paragraphs 4.2 and 5 of our Terms.
© 2015 The Author(s). This work is published and licensed by Dove Medical Press Limited. The full terms of this license are available at https://www.dovepress.com/terms.php and incorporate the Creative Commons Attribution - Non Commercial (unported, v3.0) License.
By accessing the work you hereby accept the Terms. Non-commercial uses of the work are permitted without any further permission from Dove Medical Press Limited, provided the work is properly attributed. For permission for commercial use of this work, please see paragraphs 4.2 and 5 of our Terms.