")
Back to Journals » International Journal of Nanomedicine » Volume 12
Surface-enhanced Raman scattering investigation of targeted delivery and controlled release of gemcitabine
Authors Santiago T, DeVaux RS , Kurzatkowska K, Espinal R , Herschkowitz JI , Hepel M
Received 16 August 2017
Accepted for publication 25 September 2017
Published 24 October 2017 Volume 2017:12 Pages 7763—7776
DOI https://doi.org/10.2147/IJN.S149306
Checked for plagiarism Yes
Review by Single anonymous peer review
Peer reviewer comments 2
Editor who approved publication: Professor Carlos Rinaldi
Ty Santiago,1 Rebecca Sinnott DeVaux,2 Katarzyna Kurzatkowska,1 Ricardo Espinal,1 Jason I Herschkowitz,2 Maria Hepel1
1Department of Chemistry, State University of New York at Potsdam, Potsdam, 2Department of Biomedical Sciences, Cancer Research Center, University at Albany, State University of New York, Rensselaer, NY, USA
Abstract: Advanced and metastatic cancer forms are extremely difficult to treat and require high doses of chemotherapeutics, inadvertently affecting also healthy cells. As a result, the observed survival rates are very low. For instance, gemcitabine (GEM), one of the most effective chemotherapeutic drugs used for the treatment of breast and pancreatic cancers, sees only a 20% efficacy in penetrating cancer tissue, resulting in <5% survival rate in pancreatic cancer. Here, we present a method for delivering the drug that offers mitigation of side effects, as well as a targeted delivery and controlled release of the drug, improving its overall efficacy. By modifying the surface of gold nanoparticles (AuNPs) with covalently bonded thiol linkers, we have immobilized GEM on the nanoparticle (NP) through a pH-sensitive amide bond. This bond prevents the drug from being metabolized or acting on tissue at physiological pH 7.4, but breaks, releasing the drug at acidic pH, characteristic of cancer cells. Further functionalization of the NP with folic acid and/or transferrin (TF) offers a targeted delivery, as cancer cells overexpress folate and TF receptors, which can mediate the endocytosis of the NP carrying the drug. Thus, through the modification of AuNPs, we have been able to produce a nanocarrier containing GEM and folate/TF ligands, which is capable of targeted controlled-release delivery of the drug, reducing the side effects of the drug and increasing its efficacy. Here, we demonstrate the pH-dependent GEM release, using an ultrasensitive surface-enhanced Raman scattering spectroscopy to monitor the GEM loading onto the nanocarrier and follow its stimulated release. Further in vitro studies with model triple-negative breast cancer cell line MDA-MB-231 have corroborated the utility of the proposed nanocarrier method allowing the administration of high drug doses to targeted cancer cells.
Keywords: Raman spectroscopic nanocarrier testing, flow cytometry, breast cancer cells, doxorubicin, folate receptor targeting, transferrin
Introduction
The application of nanocarriers as a means of drug delivery is an increasingly attractive approach for the administration of cancer treatments.1–7 Nanocarrier-based drug delivery systems afford key advantages to the conventional treatment modes: controlled release and targeted delivery. The ability to keep the drug inactive, while in transit, and release it in its active form, under the appropriate physiochemical conditions,6–10 mitigates the collateral damage to healthy tissue, which in conventional approaches is an inherent consequence that goes largely unchecked. Additionally, through multifunctionalization, nanocarriers can contain not only anticancer payloads but also ligands that preferentially bind to surface receptor proteins of cancer cells and mediate endocytosis of the nanocarrier. These key advantages have recently attracted considerable interest and led to the development of various nanocarrier-based systems, including micellar,11–13 liposome,14,15 polymer,16–18 noble metal,4,5,19 and other2,20 nanocarriers. Here, we present an investigation into a nanocarrier-based targeted drug delivery system for the anticancer drug gemcitabine (GEM) administration. The nanocarriers, designed with targeting ligands bound to functionalized gold nanoparticles (AuNPs) and loaded with GEM, were investigated using surface-enhanced Raman scattering (SERS) sensors, which we have recently developed for the studies of DNA damage and drug release.2–4
GEM shows a broad spectrum of anticancer activity and has been used as the standard treatment of pancreatic cancer21,22 and metastatic breast cancer,23 as well as in therapy of lung,24 colon,25 and other cancers.26,27 Triple-negative breast cancer, named for the absence of drug targetable estrogen receptor, progesterone receptor, and human epidermal growth factor receptor, has limited treatment options; patients are often limited to cytotoxic paclitaxel or GEM with a durable response rate of <20%.28–30 Improving delivery of cytotoxic drugs could both limit off-target side effects and improve tumor response. GEM, or 2′,2′-fluoro-2′-deoxycytidine (Figure 1), is a cytidine analog that enters cells through integral nucleoside transporter proteins.21 GEM has multiple modes of action inside the cell. It is able to prematurely halt DNA replication through masked chain termination and inhibit ribonucleotide reductase, which results in self-promotion.21 A serious limitation of the drug is its in vivo half-life of ~20 min, resulting from deamination by deoxycytidilate deaminase.21
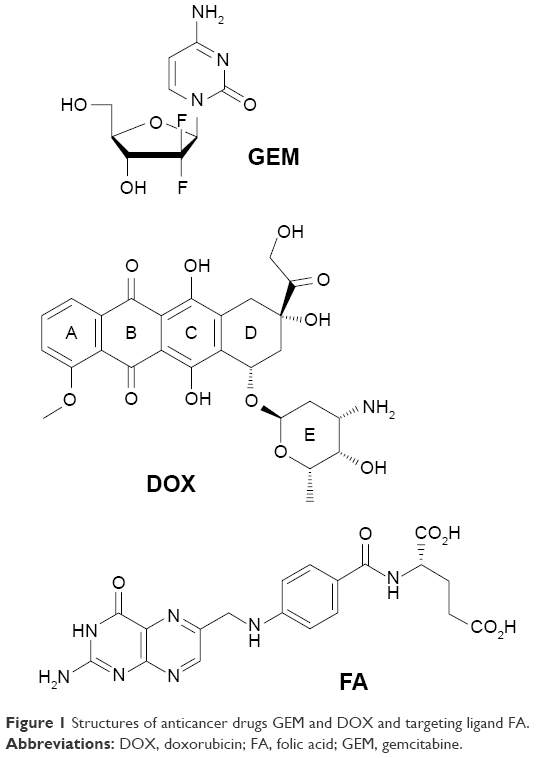 | Figure 1 Structures of anticancer drugs GEM and DOX and targeting ligand FA. |
One approach to controlled release of GEM is based on nanoparticle (NP) carriers. For some time now, NPs such as micelles and metals (Au, Ag, or Cu) have been used as carriers to aid in the delivery of anticancer drugs. In the case of GEM, there have been various attempts to deliver the drug to the tumor cells using micellar NPs,12,22 dendrimeric and polymer NPs,16,31 and magnetic NPs.32–34 Here, we present a method for delivering the drug that offers mitigation of the drug’s side effects, as well as a targeted delivery and controlled release of the drug, to improve its overall efficacy. The AuNPs provide a wealth of surface modification possibilities35–41 and controllable-interface design variability for cancer studies.2–4 The modification of AuNP surface with a self-assembled monolayer (SAM) of functional thiols affords the capability to immobilize GEM on the NPs through a strong, pH-sensitive, amide bond. While healthy tissue typically has a neutral pH of 7.4, the cancer tissue is known for its naturally acidic intercellular environment42 with pH ~6.4–6.6. Upon the internalization by endocytosis and endosome formation, the nanocarrier will see even more acidic environment, pH ~<5.5. Another drug release mechanism is based on the increased level of a biothiol, glutathione (GSH), in cancer cells,43,44 which is able to replace drug molecules bound to mercaptobenzoic acid (MBA) in the AuNP shell.9 As a result, a pH-sensitive bond and replaceable thiolate ligands offer a point of control and specificity as to where the drug is released from the AuNP. Further functionalization of the NPs with folic acid (FA) or transferrin (TF) can afford a targeted delivery, as cancer cells overexpress folate and TF receptors that can anchor the doped NPs to the cell membrane and mediate their endocytosis. Thus, through the modification of AuNPs, we were able to synthesize a nanocarrier containing GEM and folate/TF that is capable of targeted controlled-release delivery of the drug, reducing the side effects of the drug and improving efficacy.
FA is a vitamin that is crucial to a plethora of metabolic pathways including the production of nucleotides. Consequently, it is consumed in large quantities by proliferating cells such as those in tumor tissues. There are several types of tumor tissue, which overexpress folate receptors, including ovary, kidney, uterus, colon, and lung, as a result of this increased degree of consumption.45 Folate receptor, a membrane bound protein, is responsible for binding FA and bringing it into the cell via endocytosis. It has been shown that folate receptors can also mediate the endocytosis of folate-conjugated macromolecules by binding FA and forming an endosome around the entire conjugate.46 The endosome then undergoes an acidification process in which the endosome pH is reduced,47–49 causing the folate receptor to release the folate conjugate as the affinity of the folate receptor to FA drops off considerably in acidic environments.50
TF is a protein that is responsible for transferring iron ions throughout the body. Iron ions play a key role in the functionality of ribonucleotide reductase, which is responsible for catalyzing the formation of deoxyribonucleotides for DNA replication.51 A single TF molecule is composed of two lobes and is capable of binding two iron(III) ions. In combination with TF receptors, embedded in cell membranes, a TF molecule can regulate intercellular iron concentration through receptor-mediated endocytosis. TF receptors are known to be overexpressed in proliferating cells, cells that are iron deficient, and cancer cells.52,53 Similar to folate-mediated endocytosis, TF with carried iron is bound by the TF receptor and then encapsulated by an endosome. The endosome undergoes acidification, which reduces the affinity of TF to iron and subsequently iron is released from the complex. The TF itself, however, remains attached to the receptor until exposed to the higher pH environment on the cell surface.53
In previous works,2–4,19 we have demonstrated that binding MBA to gold NPs as the linker enables covalent attachment of drug molecules by the amide bond formation. This structure, consisting of the MBA Raman marker and the plasmonic AuNP, can serve as a highly sensitive transducer of chemical information to an analytical SERS signal, allowing direct observation of the drug loading and its subsequent release.4
Herein, we present a method for multifunctionalizing colloidal AuNPs with the anticancer drug GEM, alone and in combination with doxorubicin (DOX), as well as TF or FA. The loading of GEM onto the NP via the pH-sensitive bond enables a controlled release, owing to the large disparity between cancer cell pH42,54,55 and that of healthy tissue, while the addition of TF or FA allows to target cancer cells more specifically as they overexpress the receptors of these compounds. By employing Raman spectroscopy, it was possible to determine the presence of each compound on the surface of the NPs as well as observe their subsequent release.
Materials and methods
Chemicals
The anticancer drug, GEM, was received from Selleckchem (Houston, TX, USA), and the anticancer drug, DOX, was purchased from Sigma-Aldrich Co. (St Louis, MO, USA); the drugs were used as received. The MBA, N-(3-dimethylaminopropyl)-N′-ethylcarbodiimide hydrochloride (EDC), N-hydroxysuccinimide (NHS), FA, GSH, 2-morpholinoethanesulfonic acid (MES), ethanolamine hydrochloride, dimethyl sulfoxide (DMSO), and p-aminothiophenol (PATP) were purchased from Aldrich Chemical Co. (Milwaukee, WI, USA). Phosphate-buffered saline (PBS) solution was prepared with the composition of 137 mM NaCl, 2.7 mM KCl, 10 mM KH2PO4, 1.8 mM Na2HPO4 using reagents from Thermo Fisher Scientific (Waltham, MA, USA). Spherical AuNPs with 50 nm diameter were supplied by Nanopartz Inc. (Loveland, CO, USA). All aqueous solutions were prepared with deionized water (resistivity of 18.2 MΩ cm) purified with a Milli-Q reagent grade water system (Merck Millipore, Billerica, MA, USA).
Apparatus
The Raman spectra were recorded using a Nicolet DXR Dispersive Raman Microscope and Spectrometer (Thermo Fisher Scientific). SERS measurements were performed in the high-resolution spectral range of 300–2,000 cm−1 using a stabilized 633 nm He–Ne laser with 8 mW power. For the analysis of spectral changes during an anticancer drug release, signal averaging along 5 μm long line was applied for each spectrum to average chemical information from ~1,000 NP carriers. In addition to that, 10 consecutive spectra, each with 5 s laser exposure, were collected and averaged to increase the signal-to-noise ratio.
Modification of AuNPs with linker molecule SAM
To modify the AuNPs, 1,000 μL of the 50 nm diameter colloidal NP stock solution (50 μg/mL) was centrifuged at 3,200 rpm and the original solvent removed. The obtained AuNP pellet was then treated with a solution of 0.7 mM MBA +0.3 mM PATP in DMSO for 3 h to allow the MBA and PATP to replace the citrate caps on the surface of the NPs and form a mixed thiolate SAM film with composition of MBA:PATP =7:3. Subsequently, the NP solution was centrifuged and the DMSO was removed. The obtained pellet of nanocarriers (denoted as AuNP@MBA,PATP) was washed by dispersing in PBS buffer, pH 7.4, and centrifuging again. The nanocarriers were dispersed in 400 μL of PBS buffer, pH 7.4, and stored at 4°C.
Modification of AuNP@MBA,PATP nanocarriers with GEM and FA
To immobilize GEM and FA on the nanocarriers, 400 μL of the solution of AuNP@MBA,PATP was centrifuged at 3,200 rpm and the solution discarded. Next, an EDC/NHS coupling reaction was performed by first dispersing the nanocarrier pellet in a solution of 2 mM EDC +5 mM NHS in pH 5.5 MES buffer and allowing it to react for 1 h to activate the carboxyl groups of MBA in AuNP shells. Then, the sample was centrifuged and the buffer was removed, followed by addition of a 1 mg/mL solution of GEM in pH 7.0 MES buffer, mixing, and storing at room temperature for 18 h to complete the coupling reaction and forming of amide bonds between MBA and GEM molecules.
The sample was again centrifuged, and the supernatant was discarded. The pellet was dispersed in a solution of 1 mM FA +2 mM EDC +5 mM NHS. The sample was immediately adjusted to pH 7.0 and after thorough mixing allowed to stand at room temperature for 18 h for the coupling between FA and PATP to complete. A graphic representation of the procedure is presented in Figure 2. Finally, the functionalized and drug-loaded nanocarriers were washed and dispersed in 400 μL of the respective buffer solution for the investigation of drug release kinetics. Note that the percent conjugation for GEM and FA is determined by the composition of thiolate SAM film. Hence, for 70% of MBA and 30% of PATP in the SAM, there is 70% of GEM and 30% of FA uploaded onto the nanocarriers. Due to the similarity of the size of MBA and PATP, as well as their affinity to Au surface, a linear combination of the surface fractions of MBA and PATP relating to their concentration ratio in the solution was utilized. Also, the cross-section of GEM molecule is compatible with that of MBA, so that a ratio of GEM:MBA =1:1 can be achieved. The same concerns the cross-section of FA molecule, which is compatible with that of PATP, so that a ratio of FA:PATP =1:1 can also be achieved.
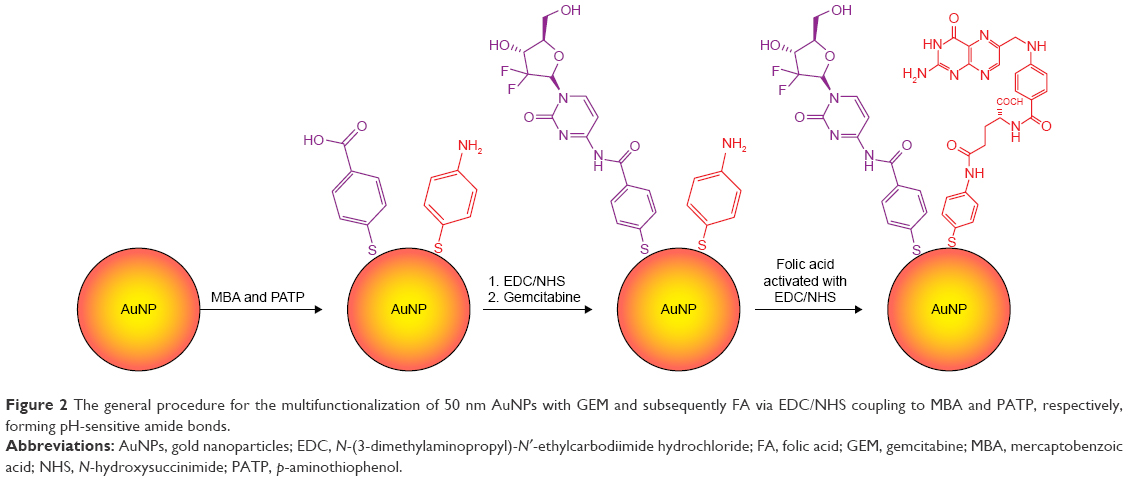 | Figure 2 The general procedure for the multifunctionalization of 50 nm AuNPs with GEM and subsequently FA via EDC/NHS coupling to MBA and PATP, respectively, forming pH-sensitive amide bonds. |
Modification of AuNP@MBA,PATP nanocarriers with GEM and TF
The procedure to multifunctionalize the AuNPs with GEM and TF was similar to the procedure used for the immobilization of GEM and FA on AuNP@MBA,PATP nanocarriers, described in the previous section. After the mixed SAM of MBA and PTPA, replacing the citrate capping of AuNPs, was formed on AuNPs, the GEM was immobilized on MBA by EDC/NHS coupling and amide bond formation. The sample was centrifuged, and the supernatant was removed. The pellet was dispersed in a 100 mg/mL solution of TF +2 mM EDC +5 mM NHS, and the solution pH was adjusted to 7.0. It was left to stand at room temperature for 18 h to allow the coupling between TF and PATP to occur. A graphic representation of the procedure is shown in Figure 3.
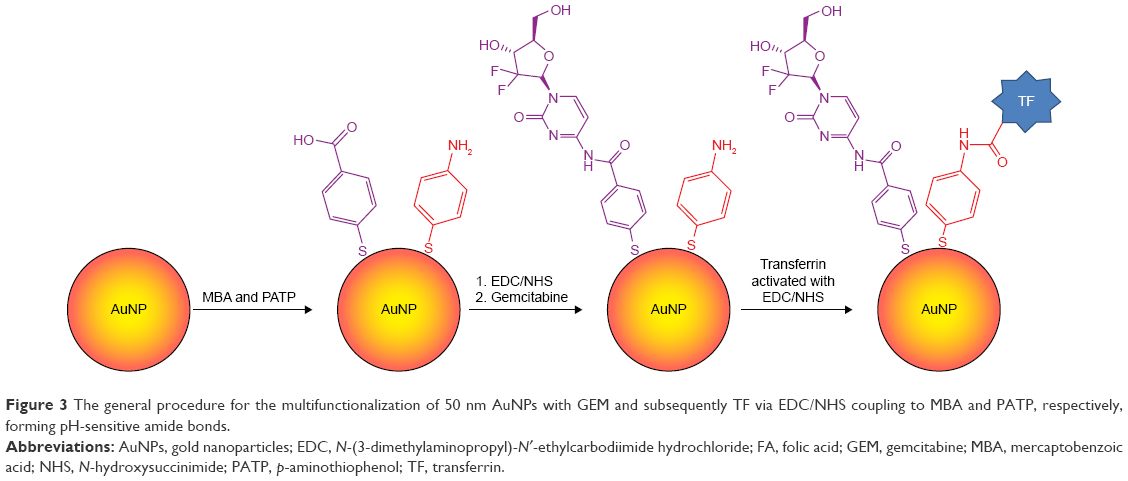 | Figure 3 The general procedure for the multifunctionalization of 50 nm AuNPs with GEM and subsequently TF via EDC/NHS coupling to MBA and PATP, respectively, forming pH-sensitive amide bonds. |
Modification of AuNP nanocarriers with DOX
The procedure for immobilization of DOX on AuNP nanocarriers was similar to that for immobilization of GEM since both drugs have free amino groups available for amide bond formation and attachment to MBA SAM on AuNPs. To control the ratio of the amounts of surface bound GEM:DOX, their concentration ratio in the solution used for drug loading was preset on the basis of linear composition dependence of the uploaded drugs on their solution concentration, ie, (CGEM:CDOX)soln = (xGEM:xDOX)AuNP, where Ci are the concentrations of drugs in solution and xi are the molar fractions of drugs in the surface film on AuNPs. This relationship is consistent with similar size of the two drug molecules. Then, the AuNP functionalization was performed in the same way as described for the preparation of GEM-loaded nanocarriers containing also targeting ligands FA and/or TF, as desired.
Monitoring of drug binding and release by SERS measurements
For the Raman characterization, the AuNP nanocarrier samples to be scanned were isolated from the solution via centrifugation at 3,200 rpm and removal of supernatant and were then re-suspended in the desired buffer solution. The investigations were performed in solutions with pH 4.0, 5.5, 6.0, and 7.4, for both FA and TF multifunctionalized NPs. A glass microscope slide was covered with a clean smooth Al foil backing, onto which ~100 μL of the sample was pipetted. The sample was then positioned under the Raman microscope objective, and a SERS spectrum was taken using the 633 nm laser. For time-dependent measurements, the slide and sample were not moved throughout the duration of the experiment and the spectra were taken incrementally after the prescribed time intervals.
Data treatment
Each SERS spectrum recorded was based on the Raman signals averaged over a spot 1×5 μm on the sample and included ~1,000 AuNP nanocarriers. In addition to that, each spectrum reported is an average of 10 spectra taken. For all experiments relating to the release of the drug over time, the MBA reporter signal intensity was plotted against time. The percent release function R defined by the equation,
|
|
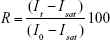
was also calculated for each measurement time, based on experimental values of the SERS peak intensity It at time t, intensity Isat at the beginning of the release experiment (t=0) when the nanocarriers are fully loaded with drug and targeting ligands, and the initial SERS signal intensity I0 of the Raman marker-capped AuNPs measured before drug loading. The values of R were then plotted as a function of time t.
Evidence of modification of the AuNPs
To demonstrate that each component of the multifunctionalized NPs was in fact successfully being loaded onto the NPs, a series of stepwise Raman spectra were taken. Thus, a spectrum was taken after the loading of MBA and PATP, after the addition of GEM, and finally, after loading either TF or FA. The results of these stepwise SERS measurements can be seen in the next section where they are discussed in greater detail.
Cell culture
Human mammary gland breast cancer adenocarcinoma cell line MDA-MB-231 was purchased from American Type Culture Collection (Manassas, VA, USA). These epithelial cells were derived from the metastatic pleural effusion. MDA-MB-231 cells were maintained in DMEM with 10% fetal bovine serum and antibiotic–antimycotic. Cells were validated to be mycoplasma free via abm® PCR Mycoplasma Detection Kit G238 (Applied Biological Materials Inc., Richmond, BC, Canada) and validated via Short Tandem Repeat (STR) analysis.
Gamma-H2AX measurement
GEM, a nucleoside analog, incorporates into replicating DNA, which leads to stalled replication forks and phosphorylation of histone H2AX, at serine 139 (gamma-H2AX), at sites of resulting DNA damage. To measure the efficacy of NP-delivered GEM, MDA-MB-231 cells were plated such that they were 40% confluent 24 h post-plating. Cells were then treated with indicated doses of NPs. A total of 24 h posttreatment, cells were trypsinized and processed for gamma-H2AX analysis by the Muse® Cell Analyzer (EMD Millipore, Billerica, MA, USA) using gamma-H2AX Kit (MCH200101) according to manufacturer’s instructions. Briefly, cells were fixed, permeabilized, and stained with fluorescently labeled antibodies to total H2AX (PECy5) and antiphospho-histone H2A.X (Alexa Fluor 555) (gamma-H2AX). Approximately 5,000 cells were gated for analysis per sample; triplicate biological replicates were analyzed.
Determination of apoptotic and dead cell concentrations
To determine the fraction of dead and apoptotic cells induced by targeted NPs, MDA-MB-231 cells were exposed to the indicated concentrations of NPs for 72 h. Media and cells were then collected, pelleted, and processed according to the Muse™ Cell Analyzer Annexin V and Dead Cell Kit instructions (MCH100105). Briefly, cells were stained with labeled annexin V and 7-aminoactinomycin D (7-AAD). The 7-AAD is a membrane impermanent dye that has a strong affinity for DNA. The 7-AAD cannot enter live cells, but when cells are undergoing apoptosis, 7-AAD can enter the cells and intercalate into the DNA. It can be excited by a 488 laser and emits a maximum wavelength in the far-red spectrum (647 nM). Approximately 5,000 cells were gated for analysis per sample; triplicate biological replicates were analyzed.
Results and discussion
Loading of an anticancer drug GEM and targeting ligand FA onto the modified AuNP nanocarriers
The immobilization of drugs and targeting ligands on AuNP nanocarriers was performed by depositing first a linker molecule SAM composed of MBA and PATP, which provide carboxyl groups suitable for further drug and targeting ligand binding. The attachment of MBA and PATP to AuNPs is based on the strong thiolate bonds that are spontaneously formed between the thiol groups of MBA and PATP molecules and the Au atoms on the surface of AuNPs. We and others have extensively investigated this type of bonding38–40,43 leading to the rapid ligand exchange at the AuNP surface, for instance a replacement of the citrate shell with thiol ligands. The initial modification of the AuNP surface with MBA and PATP yields distinctive markers on the SERS spectra at wavenumbers of the Raman bands at 1,586 and 1,074 cm−1. The immobilization of GEM on the NP, through EDC/NHS coupling between GEM and MBA, causes these signals to drop dramatically. As discussed earlier,4 this can likely be attributed to the GEM influencing the plasmonic field surrounding MBA molecules. which are bound to AuNP. In practice, this effect is manifested as masking of MBA marker signals by the drug loaded onto the nanocarrier and, thus, we will call it the “masking effect”. Similar effect is observed upon further functionalization of the NPs by forming the amide bond between FA and PATP. This decrease in intensity is substantially less significant, which is to be expected considering that the initial ratio of MBA to PATP is 7:3. This ratio was chosen arbitrarily by giving preference to the drug molecules (to be bound to MBA) over targeting ligands (to be bound to PATP). In the translation stage of the research, this ratio can be adjusted to maximize the drug delivery while preserving the effectiveness of cancer cells’ targeting. At the present stage, we have selected one fixed ratio (7:3) to be able to quickly compare the efficacy of different drugs and targeting ligands studied in our laboratory. As shown in Figure 4, the presence of the GEM and FA on the surface of the AuNPs can be observed by following the changes in the MBA/PATP Raman reporter signal. By covalently binding GEM to MBA, one can observe masking of some of the reporter signal and further masking can be achieved by binding FA to PATP.
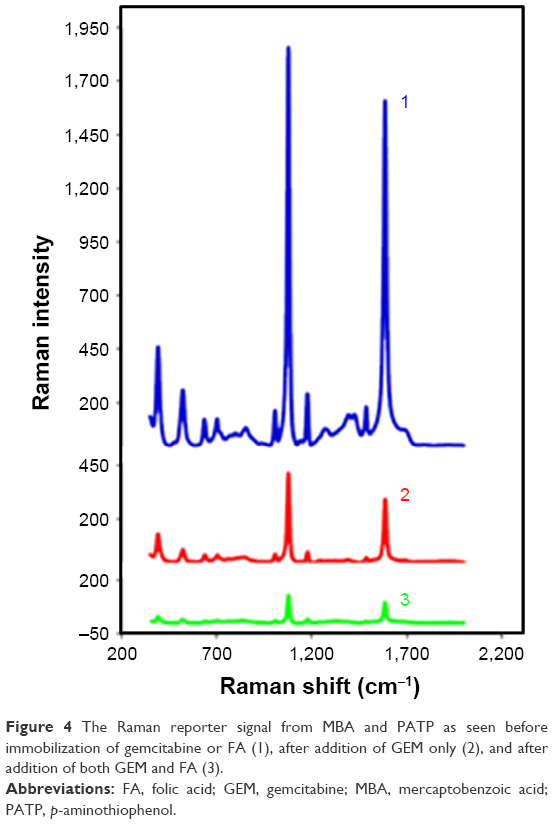 | Figure 4 The Raman reporter signal from MBA and PATP as seen before immobilization of gemcitabine or FA (1), after addition of GEM only (2), and after addition of both GEM and FA (3). |
The drug loading for NP nanocarriers was determined as follows. First, the number of adsorption sites on the surface of AuNP was calculated. For an AuNP with 50 nm diameter d, its surface area, S, is as follows: S = π(d/2)2 =7.85×10⁻¹¹ cm2. The saturation surface coverage of MBA on a gold surface, γMBA, was determined using a quartz crystal nanobalance as γMBA =0.76 nmol/cm2. This corresponds to the maximum number of moles of MBA n adsorbed on a single AuNP, n = γMBAS =5.97×10⁻²⁰ mol/AuNP. The concentration of the original stock solution of AuNPs was CAuNP,ini =65.2 pM (or 50 μg/mL), and after ligand adsorption, washing and centrifugation, and final buffer addition, it was increased by a factor of 2.5 (ie, 1,000 μL of initial solution preconcentrated to 400 μM final solution) to CAuNP =149.5 pM, taking into account 8.29% losses of AuNP in centrifugation. The dispersion of the drug-loaded nanocarriers at that concentration provides the drug at 5.37 μM concentration, where 35,930 drug molecules are immobilized on each single AuNP. For multifunctional nanocarriers, where 70% of the AuNP surface was occupied by drug and 30% by targeting ligand, the effective drug concentration was reduced to 0.7×5.37=3.76 μM.
Modification of AuNP nanocarriers with GEM and TF
In much the same ways as was observed with GEM and FA modified NPs, the reporter signal from the MBA/PATP monolayer can be used as a means to monitor the presence of GEM and TF on the surface of the AuNPs. Just as with the prior experiment, the addition of MBA and PATP yields strong distinct signals at wavenumbers of ~1,586 and 1,074 cm−1.4 The formation of the bond between GEM and MBA shows a substantial decrease in the intensity of these peaks. This decrease is even more prevalent upon further addition of TF, by forming the bond between TF and PATP. As was the case with the prior experiment, the more significant reduction in reporter signal intensity from addition of GEM is likely the result of there being more MBA present than PATP. The stacked spectra in Figure 5 provide a visual representation of the incremental reduction in reporter signal at each step in the loading process. This is evidence that the compounds are present on the surface of the nanocarrier dumping the SERS signals of MBA/PATP shell.
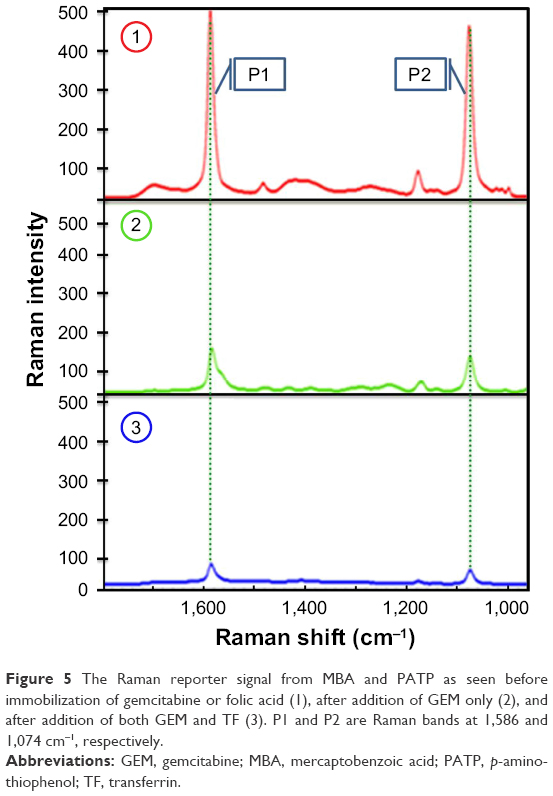 | Figure 5 The Raman reporter signal from MBA and PATP as seen before immobilization of gemcitabine or folic acid (1), after addition of GEM only (2), and after addition of both GEM and TF (3). P1 and P2 are Raman bands at 1,586 and 1,074 cm−1, respectively. |
pH-dependent release of GEM and FA
The concept of using the Raman signals from MBA/PATP shell was advanced upon by using it to quantitatively track the presence of GEM and FA on the AuNPs over the duration of experiment. As reported in prior work,3,4 the amide bond formed between GEM and MBA is pH sensitive and will undergo a slow hydrolysis under acidic conditions. Recent studies indicate that strength of amide bonds depends on the kind of groups on both sides of the bond, which may cause the so-called “bond-twisting”, which decreases amide bond stability and makes it prone to acidolysis.56,57 In addition to that, DNA8,58 and enzymes that have the ability to promote cleaving the amide bonds will contribute to the drug release. The amide bond cleavage allows the GEM to diffuse away from the AuNPs unmasking the MBA Raman signal. This results in an increase in signal intensity from MBA over time. Similar measurements were thus performed using multifunctionalized AuNP nanocarriers with GEM and FA. A sample of the AuNPs was exposed to a pH 7.4 PBS buffer for 2 h with spectra recorded at the starting time, after 60 min, and again after 120 min.
In Figure 6A, the normalized spectra taken at each point in the duration of the experiment are shown. No visible change in the SERS peak intensity at 1,586 cm−1 was found corroborating the nanocarrier stability at the physiological pH of 7.4. The same procedure was then applied using a pH 5.5 acetate buffer, again with spectra recorded at the starting time, after 60 min, and again after 120 min. In Figure 6B, the normalized spectra for the experiment duration are presented, which show an extensive increase in the signal intensity from MBA/PATP monolayer over the 2 h exposure to a medium of pH 5.5. This indicates that the MBA/PATP layer is no longer being masked by GEM and FA, as these compounds diffused away from the nanocarriers after the amide bond breakage. The observation of such a trend makes it possible to plot the Raman signal intensity of the MBA/PATP band at 1,586 cm−1 as a function of time, from which the presence of the GEM and FA on the surface of the AuNPs can be calculated for buffers of different pH and acidolysis time. To analyze the GEM release dynamics in more detail, the drug-loaded nanocarriers were prepared and suspended in buffers of the desired pH for 3 h and the Raman spectrum for the sample was recorded at regular intervals. From these spectra, the Raman reporter signal for the MBA/PATP at 1,586 cm−1 was recorded and compared to the intensity value for that same peak prior to the loading of the GEM and FA, through the use of Equation 1. The values of GEM release function were then plotted as a function of time spent in a given buffer solution, as illustrated in Figure 6C. This plot shows a clear and consistent GEM release dynamics at acidic pH of 5.5 (curve 2) and no release at physiological pH of 7.4 (curve 1). As a result, this plot can be seen as a quantitative depiction of the release of the drug and FA from the surface of the AuNPs over time, which is only observed at acidic pH.
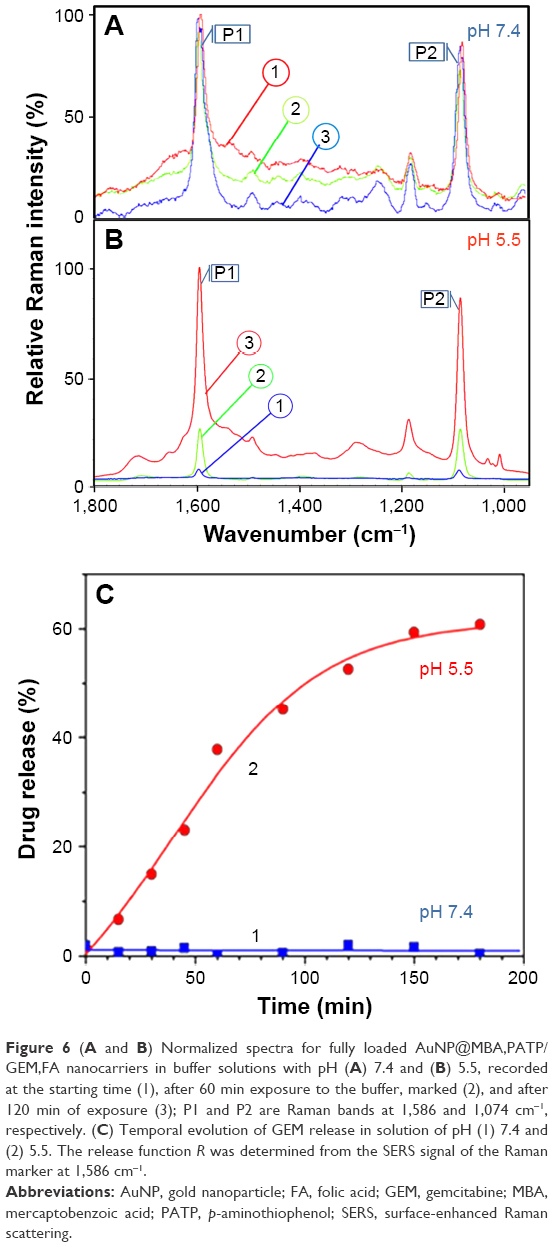 | Figure 6 (A and B) Normalized spectra for fully loaded AuNP@MBA,PATP/GEM,FA nanocarriers in buffer solutions with pH (A) 7.4 and (B) 5.5, recorded at the starting time (1), after 60 min exposure to the buffer, marked (2), and after 120 min of exposure (3); P1 and P2 are Raman bands at 1,586 and 1,074 cm−1, respectively. (C) Temporal evolution of GEM release in solution of pH (1) 7.4 and (2) 5.5. The release function R was determined from the SERS signal of the Raman marker at 1,586 cm−1. |
pH-dependent release of GEM and TF
Similar experiments to those performed with AuNP nanocarriers loaded with GEM and FA targeting ligand were also carried out with nanocarriers loaded with GEM and TF as the targeting agent. In comparison to FA, TF is a much bigger molecule (molecular mass 80 kDa). Thus, it is possible that TF may interfere with the surface coverage and the arrangement of molecules in the nanocarrier shell. The experiments involved exposure of GEM- and TF-loaded AuNP nanocarriers to solutions of pH 7.4 (PBS) and 5.5 (acetate buffer) for 2 h with spectra recorded at the starting time, after 60 min, and again after 120 min.
In Figure 7A, the SERS spectra taken at each point in the duration of experiments performed at pH =7.4 are shown. Virtually no changes in the intensity of the Raman band at 1,586 cm−1 have been observed, confirming the nanocarrier stability at the physiological pH 7.4. However, the spectra shown in Figure 7B for similar experiments performed using a solution with pH 5.5 indicate a strong variation of the intensity of the Raman signal from MBA/PATP over the 2 h spent at pH 5.5. This observation is consistent with earlier measurements performed with AuNP@MBA,PATP/GEM,FA nanocarriers (Figure 6). Once it was demonstrated that the immobilization procedure results in the presence of GEM and TF on the surface of AuNPs (Figure 5), the release of these compounds could be monitored as a function of time. In order to do this, the GEM- and TF-loaded AuNP@MBA,PATP nanocarriers were prepared and suspended in buffers of the desired pH for 3 h and the Raman spectra for the sample were recorded at regular time intervals. The GEM release characteristics were then plotted as a function of time spent in different buffers, to yield Figure 7C. This graph shows a clear tendency of the GEM release at lower pH and negligible release at physiological pH 7.4. Thus, this behavior is consistent with that of AuNP@MBA,PATP/GEM,FA nanocarriers. This experiment demonstrates that by decreasing pH from 7.4 to 6.0, to 5.5, and then to 4.0, the rate and the degree of drug release increased proportionately.
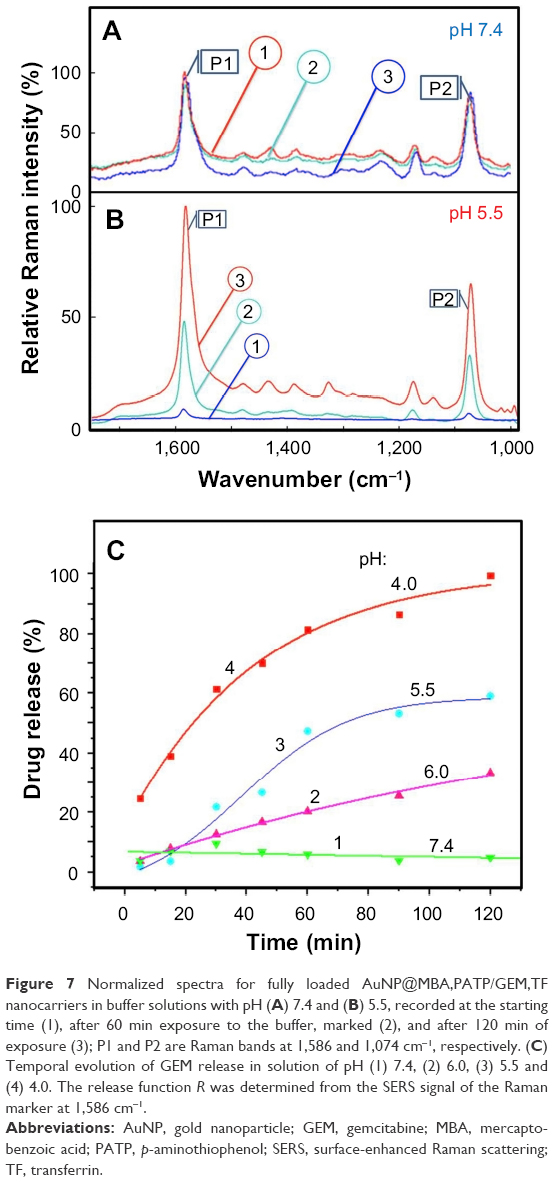 | Figure 7 Normalized spectra for fully loaded AuNP@MBA,PATP/GEM,TF nanocarriers in buffer solutions with pH (A) 7.4 and (B) 5.5, recorded at the starting time (1), after 60 min exposure to the buffer, marked (2), and after 120 min of exposure (3); P1 and P2 are Raman bands at 1,586 and 1,074 cm−1, respectively. (C) Temporal evolution of GEM release in solution of pH (1) 7.4, (2) 6.0, (3) 5.5 and (4) 4.0. The release function R was determined from the SERS signal of the Raman marker at 1,586 cm−1. |
In vitro testing of drug-loaded nanocarriers with MDA-MB-231 cell line
To determine if the nanocarriers were able to deliver functional GEM to target cells, MDA-MB-231 cells, representing a triple-negative highly metastatic breast cancer cell line, were treated with AuNP@MBA/GEM, AuNP@MBA,PATP/GEM,FA, and AuNP@MBA,PATP/GEM,DOX,FA (marked for brevity in Figures 8 and 9 as AuNP + GEM, AuNP + GEM + FA, and AuNP + GEM + FA + DOX, respectively). Since both the GEM and DOX induce DNA damage, initial studies measured the induction of γ-H2A.X histone expression 24 h posttreatment. Nanocarriers targeted to the MDA-MB-231 cells with FA demonstrated a five-fold and two-fold increase in DNA damage at 5 and 25 nM, respectively (Figure 8). By adding DOX to the NP shell containing GEM and FA, we were able to further increase the number of activated cells. Therefore, a combined GEM–DOX treatment is also feasible. In addition to demonstrating the increased DNA damage, FA targeted nanocarriers induced a 10-fold increase in apoptosis at 25 nM nanocarrier concentration relative to nanocarriers loaded with GEM alone (Figure 9).
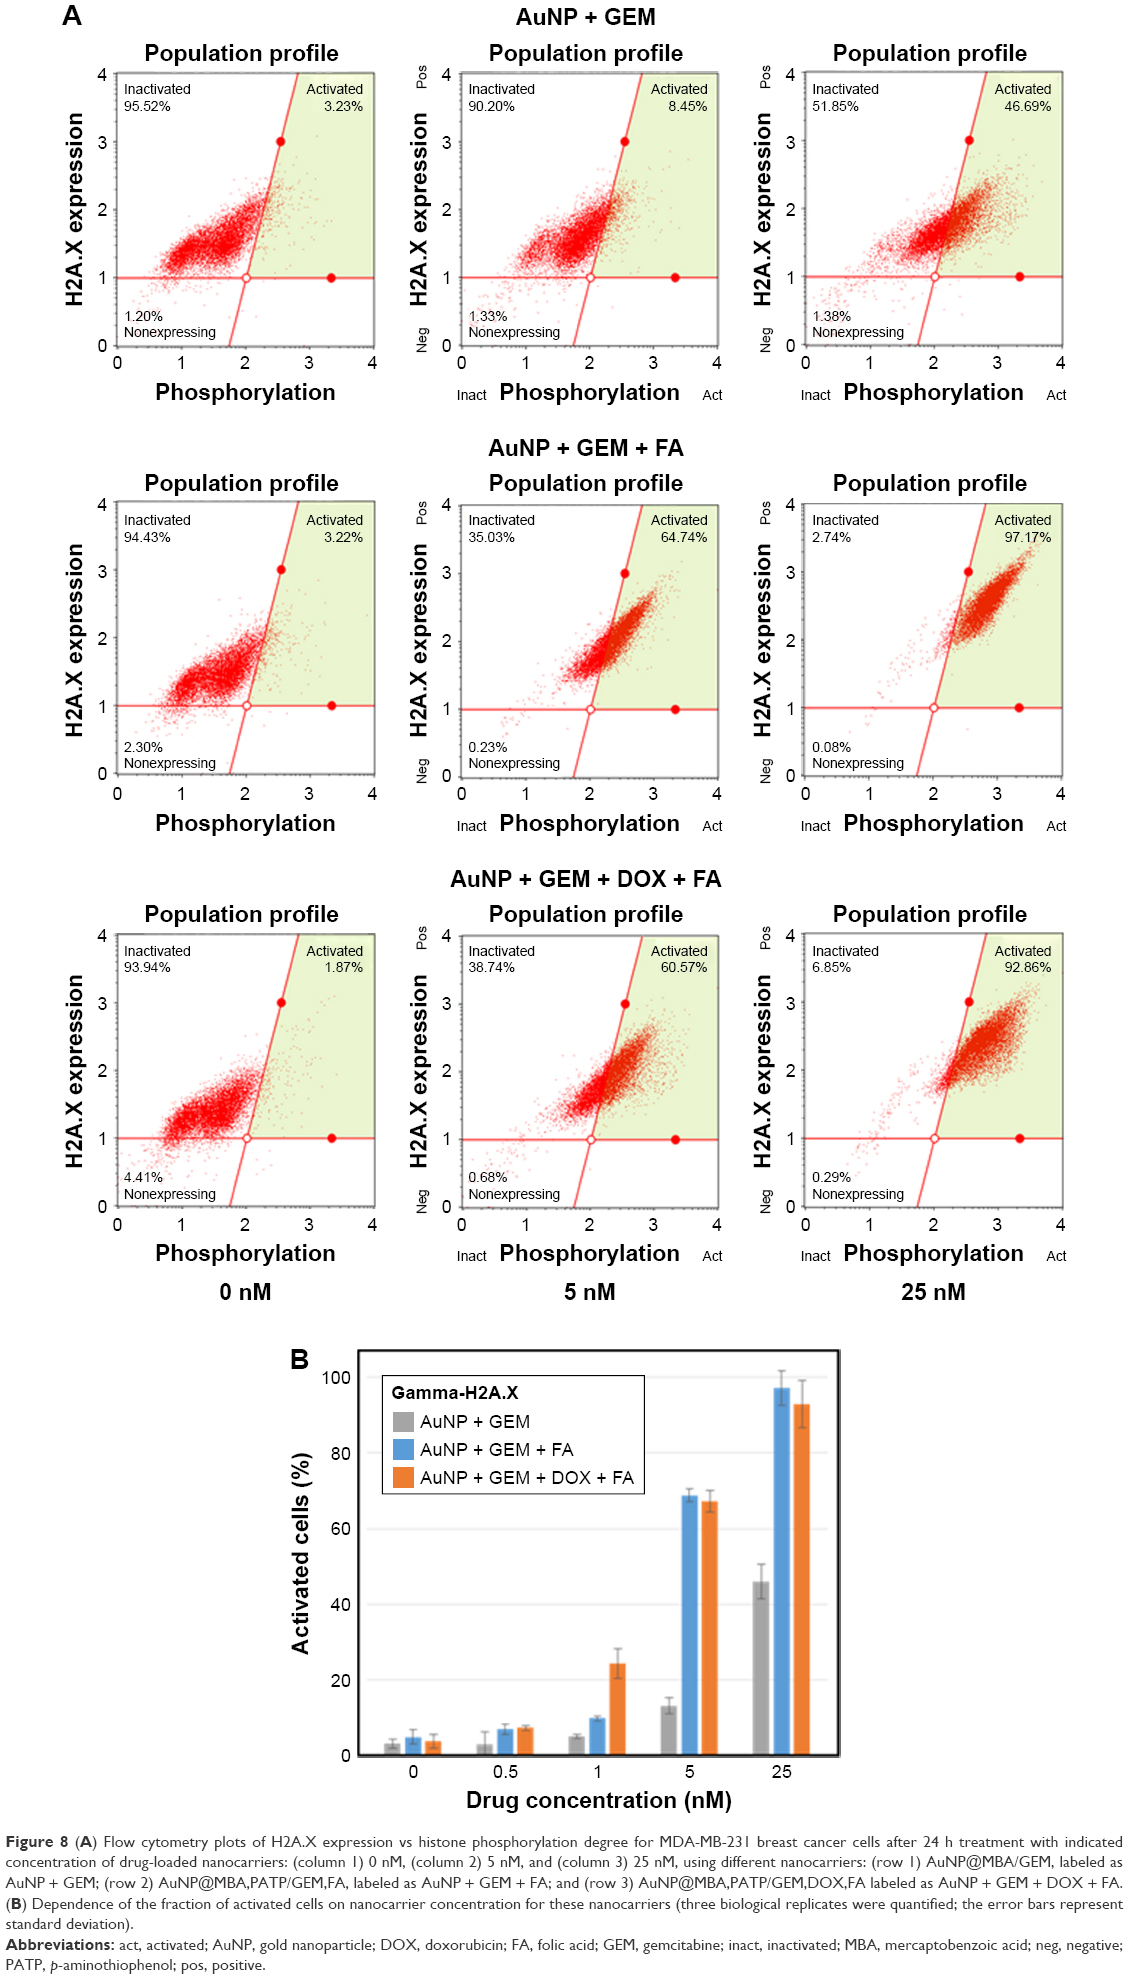 | Figure 8 (A) Flow cytometry plots of H2A.X expression vs histone phosphorylation degree for MDA-MB-231 breast cancer cells after 24 h treatment with indicated concentration of drug-loaded nanocarriers: (column 1) 0 nM, (column 2) 5 nM, and (column 3) 25 nM, using different nanocarriers: (row 1) AuNP@MBA/GEM, labeled as AuNP + GEM; (row 2) AuNP@MBA,PATP/GEM,FA, labeled as AuNP + GEM + FA; and (row 3) AuNP@MBA,PATP/GEM,DOX,FA labeled as AuNP + GEM + DOX + FA. (B) Dependence of the fraction of activated cells on nanocarrier concentration for these nanocarriers (three biological replicates were quantified; the error bars represent standard deviation). |
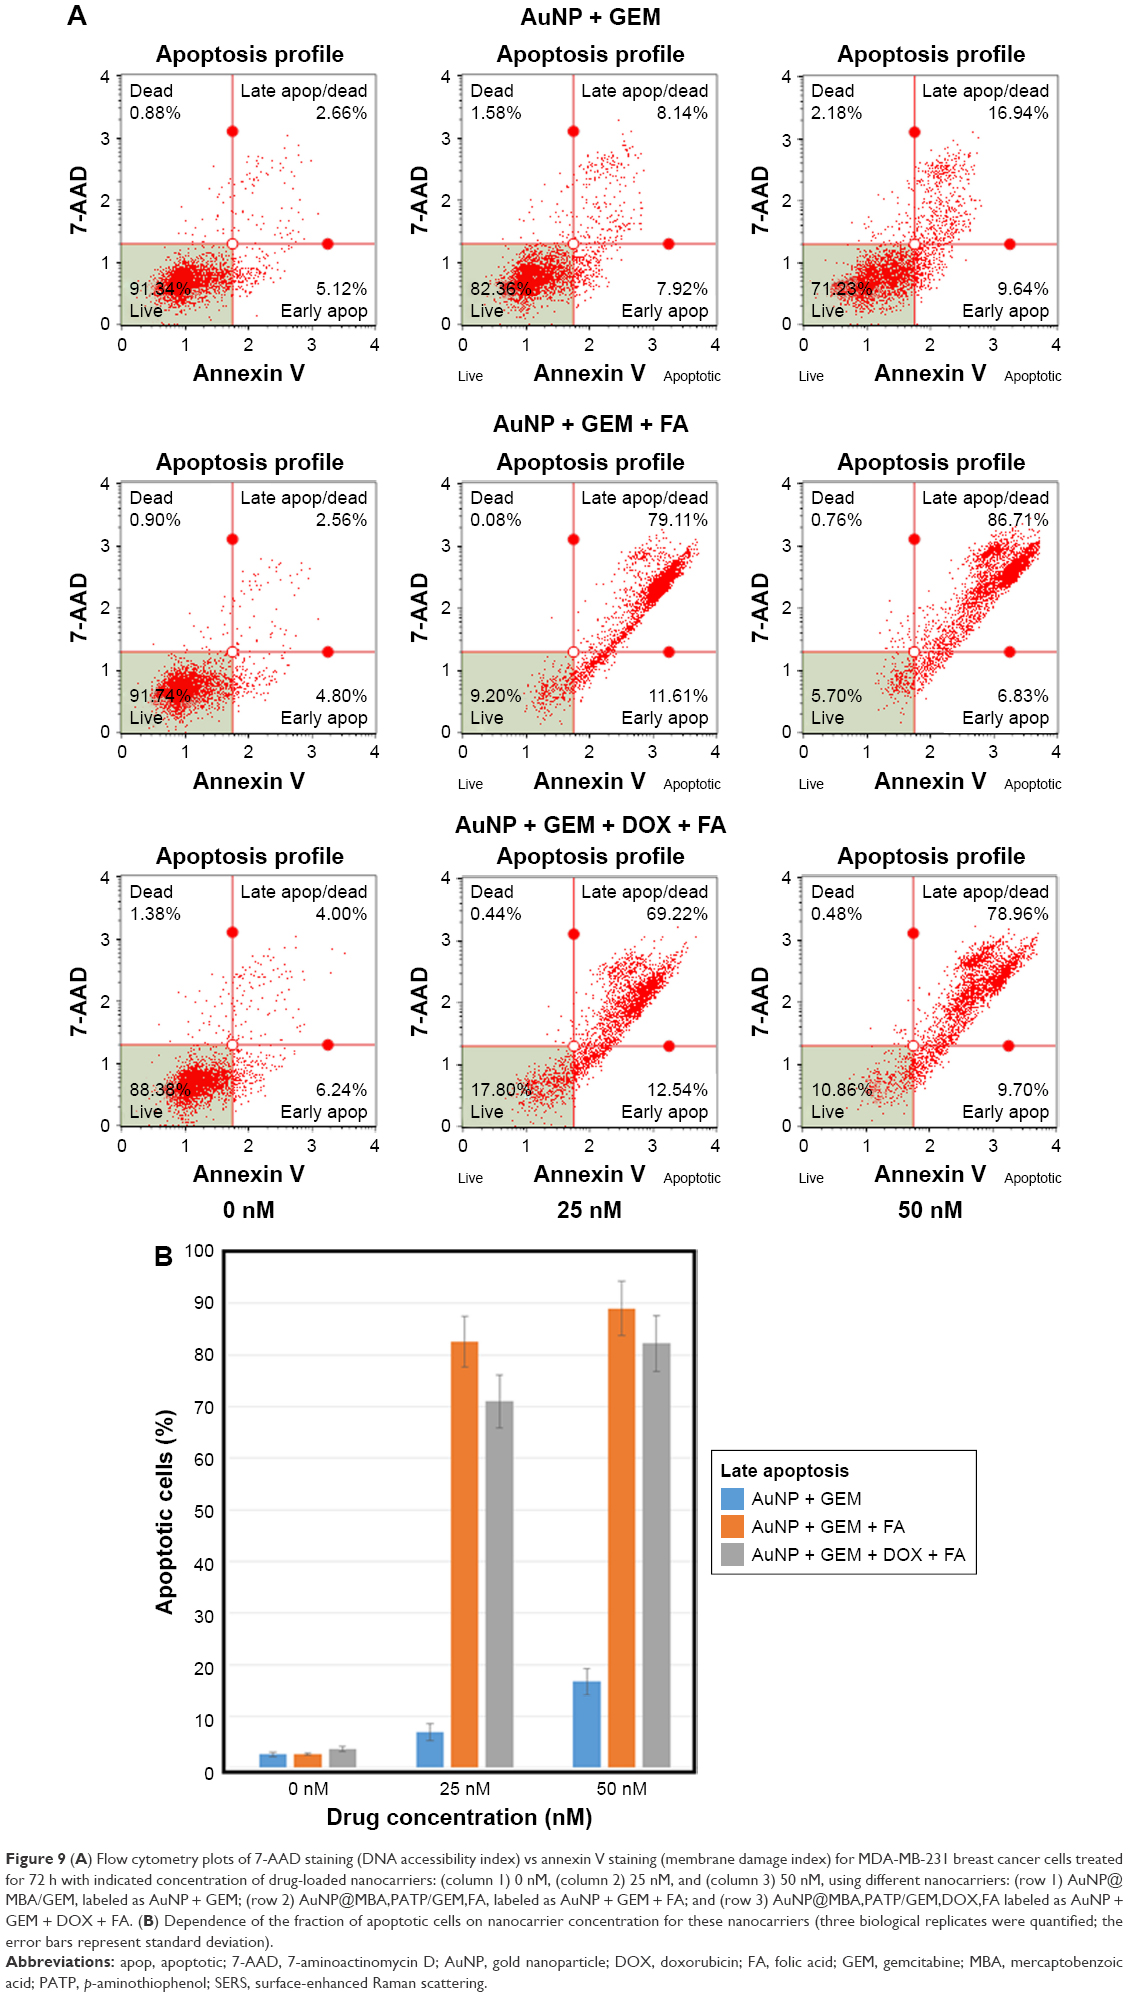 | Figure 9 (A) Flow cytometry plots of 7-AAD staining (DNA accessibility index) vs annexin V staining (membrane damage index) for MDA-MB-231 breast cancer cells treated for 72 h with indicated concentration of drug-loaded nanocarriers: (column 1) 0 nM, (column 2) 25 nM, and (column 3) 50 nM, using different nanocarriers: (row 1) AuNP@MBA/GEM, labeled as AuNP + GEM; (row 2) AuNP@MBA,PATP/GEM,FA, labeled as AuNP + GEM + FA; and (row 3) AuNP@MBA,PATP/GEM,DOX,FA labeled as AuNP + GEM + DOX + FA. (B) Dependence of the fraction of apoptotic cells on nanocarrier concentration for these nanocarriers (three biological replicates were quantified; the error bars represent standard deviation). |
In testing of apoptosis activation (Figure 9), the MDA-MB-231 breast cancer cells were treated with indicated doses of NPs for 72 h. Cells were then collected and stained with annexin V and 7-AAD. Annexin V is a protein that binds phosphatidylserine (PS) with high affinity. PS is normally located on the inside of the cell membrane, but as cells undergo apoptosis, PS migrates to the outside of the membrane. Therefore, live healthy cells would be negative for annexin V, while apoptotic cells would be positive. Similarly, 7-AAD is a fluorescent molecule that binds to DNA with high affinity but cannot penetrate an intact cell membrane. Therefore, 7-AAD is absent in live cells but can easily enter apoptotic cells and bind to DNA. Together, the data of Figures 8 and 9 demonstrate the enhanced efficacy of folate-targeted nanocarriers.
Conclusion
We have demonstrated an approach for functionalizing spherical AuNPs for the controlled release and targeted delivery of the anticancer drug GEM. By using EDC/NHS coupling to link the GEM as well as either FA or TF to a self-assembled thiol monolayer of MBA and PATP on AuNPs, three distinct advantages were achieved. The most notable advantage is the immobilization of the GEM via a pH-sensitive bond, which deactivates the drug and protects it until its release is stimulated by an acidic environment, as seen in endosomes and cytosol of tumor cells. Additionally, the presence of FA or TF grants a targeting effect, as these compounds are recognized by the overexpressed receptors present on the surface of cancer cells and provide the mechanism for internalization by endocytosis. Finally, by using MBA and PATP, it is possible to observe the loading and release of these compounds from the AuNPs surface using the ultrasensitive SERS spectroscopy. The in vitro experiments with breast cancer cell line MDA-MB-231 confirm the utility of the approach. The use of FA targeted nanocarriers shifts the effective dose curve not only in the initial DNA damage but also in the induction of apoptosis with ~80% cell death following 72 h exposure.
Acknowledgments
This work was partially supported by Research Collaboration Fund of the SUNY Network of Excellence, RF Project No 1-114-594. Permanent address to KK: Department of Biosensors, Institute of Animal Reproduction and Food Research of the Polish Academy of Sciences, 10-748 Olsztyn, Poland.
Disclosure
The authors report no conflicts of interest in this work.
References
Shi J, Kantoff PW, Wooster R, Farokhzad OC. Cancer nanomedicine: progress, challenges and opportunities. Nat Rev Cancer. 2017;17(1):20–37. | ||
Li J, Skeete Z, Shan S, et al. Surface enhanced Raman scattering detection of cancer biomarkers with bifunctional nanocomposite probe. Anal Chem. 2015;87:10698–10702. | ||
Ilkhani H, Hughes T, Li J, Zhong CJ, Hepel M. Nanostructured SERS-electrochemical biosensors for testing of anticancer drug interactions with DNA. Biosens Bioelectron. 2016;80:257–264. | ||
Kurzatkowska K, Santiago T, Hepel M. Plasmonic nanocarrier grid-enhanced Raman sensor for studies of anticancer drug delivery. Biosens Bioelectron. 2017;91:780–787. | ||
Stobiecka M, Hepel M. Double-shell gold nanoparticle-based DNA-carriers with poly-L-lysine binding surface. Biomaterials. 2011;32(12):3312–3321. | ||
Wong PT, Choi SK. Mechanisms of drug release in nanotherapeutic delivery systems. Chem Rev. 2015;115(9):3388–3432. | ||
Anderson A, Davis J. Electrochemical actuators: controlled drug release strategies for use in micro devices. Electroanalysis. 2015;27:872. | ||
Zhou C, Avins JL, Klauser PC, Brandsen BM, Lee Y, Silverman SK. DNA-catalyzed amide hydrolysis. J Am Chem Soc. 2016;138(7):2106–2109. | ||
Hong R, Han G, Fernández JM, Kim BJ, Forbes NS, Rotello VM. Glutathione-mediated delivery and release using monolayer protected nanoparticle carriers. J Am Chem Soc. 2006;128(4):1078–1079. | ||
Wu W, Chen M, Wang J, et al. Nanocarriers with dual pH-sensitivity for enhanced tumor cell uptake and rapid intracellular drug release. RSC Adv. 2014;4(58):30780–30783. | ||
Wang N, Wang Z, Nie S, et al. Biodegradable polymeric micelles coencapsulating paclitaxel and honokiol: a strategy for breast cancer therapy in vitro and in vivo. Int J Nanomedecine. 2017;12:1499–1514. | ||
Liu A, Chen Y, Feng X, et al. Micellar nanoparticles loaded with gemcitabine and doxorubicin showed synergistic effect. Colloids Surf B Biointerfaces. 2014;113:158. | ||
Wang JQ, Mao WW, Lock LL, et al. The role of micelle size in tumor accumulation, penetration, and treatment. ACS Nano. 2015;9(7):7195–7206. | ||
Yuan Z, Jia L, Lim LY, et al. Renal-targeted delivery of triptolide by entrapment in pegylated TRX-20-modified liposomes. Int J Nanomedecine. 2017;12:5673–5686. | ||
Wei YM, Liang J, Zheng XL, et al. Lung-targeting drug delivery system of baicalin-loaded nanoliposomes: development, biodistribution in rabbits, and pharmacodynamics in nude mice bearing orthotopic human lung cancer. Int J Nanomedecine. 2017;12:251–261. | ||
Lim JH, You SK, Baek JS, et al. Preparation and evaluation of polymeric microparticulates for improving cellular uptake of gemcitabine. Int J Nanomedecine. 2012;7:2307–2314. | ||
Chen J, Wu Q, Luo L, et al. Dual tumor-targeted poly(lactic-co-glycolic acid)–polyethylene glycol–folic acid nanoparticles: a novel biodegradable nanocarrier for secure and efficient antitumor drug delivery. Int J Nanomedecine. 2017;12:5755–5760. | ||
Nicolas J, Mura S, Brambilla D, Mackiewicz N, Couvreur P. Design, functionalization strategies and biomedical applications of targeted biodegradable/biocompatible polymer-based nanocarriers for drug delivery. Chem Soc Rev. 2013;42(3):1147–1235. | ||
Smith M, Hepel M. Controlled release of targeted anti-leukemia drugs azacitine and decitabine monitored using surface-enhanced Raman scattering (SERS) spectroscopy. Mediterr J Chem. 2017;6(4):125–132. | ||
Stobiecka M, Dworakowska B, Jakiela S, Lukasiak A, Chalupa A, Zembrzycki K. Sensing of survivin mRNA in malignant astrocytes using graphene oxide nanocarrier-supported oligonucleotide molecular beacons. Sens Actuators B. 2016;235:136–145. | ||
Cavalcante L, Monterio GEJ. Gemcitabine: metabolism and molecular mechanisms of action, sensitivity and chemoresistance in pancreatic cancer. Eur J Pharmacol. 2014;741:8. | ||
Luo J, Tan M, Tian Y. Delivering curcumin and gemcitabine in one nanoparticle platform for colon cancer therapy. RSC Adv. 2014;4:61948. | ||
Hu Q, Jiang JX, Luo L, et al. A systematic review of gemcitabine and taxanes combination therapy randomized trials for metastatic breast cancer. Springerplus. 2014;3(293):1–11. | ||
Fantini M, Stocchi L, Affatato A, et al. Carboplatin-gemcitabine in the treatment of elderly patients with non-small cell lung cancer: an outcome analysis. J Cancer Res Ther. 2015;3(10):112–117. | ||
Jiménez-Fonseca P, Solis MP, Garrido M, et al. Gemcitabine plus capecitabine (Gem–Cape) biweekly in chemorefractory metastatic colorectal cancer. Clin Transl Oncol. 2015;17(5):384–392. | ||
Morfouace M, Shelat A, Jacus M, et al. Pemetrexed and gemcitabine as combination therapy for the treatment of Group3 medulloblastoma. Cancer Cell. 2014;25(4):516–529. | ||
Galvão FHF, Pestana JOM, Capelozzi VL. Fatal gemcitabine-induced pulmonary toxicity in metastatic gallbladder adenocarcinoma. Cancer Chemother Pharmacol. 2010;65(3):607–610. | ||
Dent R, Trudeau M, Pritchard K, et al. Triple-negative breast cancer: clinical features and patterns of recurrence. Clin Cancer Res. 2007;13(15 pt 1):4429–4434. | ||
Weigelt B, Reis-Filho JS. Histological and molecular types of breast cancer: is there a unifying taxonomy? Nat Rev Clin Oncol. 2009;6(12):718–730. | ||
Polyak K. Heterogeneity in breast cancer. J Clin Invest. 2011;121(10):3786–3788. | ||
Parrott MC, Finniss M, Luft JC, et al. Incorporation and controlled release of silyl ether prodrugs from PRINT nanoparticles. J Am Chem Soc. 2012;134(18):7978. | ||
Lee GY, Qian WP, Wang L, et al. Theranostic nanoparticles with controlled release of gemcitabine for targeted therapy and MRI of pancreatic cancer. ASC Nano. 2013;7(3):2078. | ||
Viota JL, Carazo A, Munoz-Gamez JA, et al. Functionalized magnetic nanoparticles as vehicles for the delivery of the antitumor drug gemcitabine to tumor cells. Physicochemical in vitro evaluation. Mater Sci Eng C. 2013;33(3):1183. | ||
Yalçin S, Erkan M, Ünsoy G, Parsian M, Kleeff J, Gündüz U. Effect of gemcitabine and retinoic acid loaded PAMAM dendrimer-coated magnetic nanoparticles on pancreatic cancer and stellate cell lines. Biomed Pharmacother. 2014;68(6):737. | ||
Hepel M. Functional gold nanoparticles for biointerfaces. In: Hepel M, Zhong CJ, editors. Functional Nanoparticles for Bioanalysis, Nanomedicine & Bioelectronic Devices. Oxford: Oxford University Press; 2012:147–176. | ||
Hepel M, Stobiecka M. Interactions of Herbicide Atrazine with DNA. New York: Nova Science Publishers; 2010. | ||
Stobiecka M, Hepel M. Multimodal coupling of optical transitions and plasmonic oscillations in rhodamine B modified gold nanoparticles. Phys Chem Chem Phys. 2011;13(3):1131–1139. | ||
Stobiecka M, Deeb J, Hepel M. Ligand exchange effects in gold nanoparticle assembly induced by oxidative stress biomarkers: homocysteine and cysteine. Biophys Chem. 2010;146(2–3):98–107. | ||
Stobiecka M, Hepel M. Rapid functionalization of metal nanoparticles by moderator-tunable ligand-exchange process for biosensor designs. Sens Actuat B. 2010;149:373–380. | ||
Stobiecka M, Coopersmith K, Hepel M. Resonance elastic light scattering (RELS) spectroscopy of fast non-Langmuirian ligand-exchange in glutathione-induced gold nanoparticle assembly. J Colloid Interface Sci. 2010;350(1):168–177. | ||
Hepel M, Stobiecka M. Novel DNA-hybridization biosensors for studies of atrazine interactions with DNA. In: Daniels JA, editor. Advances in Environmental Research. New York: Nova Science Publication; 2011:253–298. | ||
Kato Y, Ozawa S, Miyamoto C, et al. Acidic extracellular microenvironment and cancer. Cancer Cell Int. 2013;13:(1)89. | ||
Hepel M, Stobiecka M. Detection of oxidative stress biomarkers using functional gold nanoparticles. In: Matijevic E, editor. Fine Particles in Medicine and Pharmacy. New York: Springer Sci Publication; 2012:241–281. | ||
Hepel M, Stobiecka M. Comparative kinetic model of fluorescence enhancement in selective binding of monochlorobimane to glutathione. J Photochem Photobiol A. 2011;225:72–80. | ||
Lu Y, Low PS. Folate-mediated delivery of macromolecular anticancer therapeutic agents. Adv Drug Deliv Rev. 2002;54(5):675–693. | ||
Turek JJ, Leamon CP, Low PS. Endocytosis of folate–protein conjugates: ultrastructural localization in KB cells. J Cell Sci. 1993;106:423–430. | ||
Mathias CJ, Wang S, Lee RJ, Waters DJ, Low PS, Green MA. Tumor-selective radiopharmaceutical targeting via receptor-mediated endocytosis of gallium-67–deferoxamine–folate. J Nucl Med. 1996;37:1003–1008. | ||
Hulikova A, Harris AL, Vaughan-Jones RD, Swietach P. Regulation of intracellular pH in cancer cell lines under normoxia and hypoxia. J Cell Physiol. 2013;228(4):743–752. | ||
Kamaly N, Yameen B, Wu J, Farokhzad OC. Degradable controlled release polymers and polymeric nanoparticles: mechanisms of controlling drug release. Chem Rev. 2016;116(4):2602–2663. | ||
Kamen BA, Caston JD. Properties of a folate binding protein (FBP) isolated from porcine kidney. Biochem Pharmacol. 1986;35(14):2323–2329. | ||
Richardson DR, Kalinowski DS, Lau S, Jansson PJ, Lovejoy DB. Cancer cell iron metabolism and the development of potent iron chelators as anti-tumour agents. Biochim Biophys Acta. 2009;1790(7):702–717. | ||
Ryschich E, Huszty G, Knaebel HP, Hartel M, Buchler MW, Schmidt J. Transferrin receptor is a marker of malignant phenotype in human pancreatic cancer and in neuroendocrine carcinoma of the pancreas. Eur J Cancer. 2004;40(9):1418–1422. | ||
Ho K, Li H, Qian Z, Sun H. Targeted drug delivery via the transferrin receptor-mediated endocytosis pathway. Pharmacol Rev. 2002;54(4):561–587. | ||
Swietach P, Vaughan-Jones RD, Harris AL, Hulikova A. The chemistry, physiology and pathology of pH in cancer. Philos Trans R Soc Lond B Biol Sci. 2014;369(1638):20130099. | ||
Vaupel P, Kallinowski F, Okunieff P. Blood flow, oxygen and nutrient supply, and metabolic microenvironment of human tumors: a review. Cancer Res. 1989;49(23):6449–6465. | ||
Samaritoni JG, Copes AT, Crews DK, et al. Unexpected hydrolytic instability of N-acylated amino acid amides and peptides. J Org Chem. 2014;79:3140–3151. | ||
Szostak M, Yao L, Aubé J. Stability of medium-bridged twisted amides in aqueous solutions. J Org Chem. 2009;74(5):1869–1875. | ||
Brandsen BM, Hesser AR, Castner MA, Chandra M, Silverman SK. DNA-catalyzed hydrolysis of esters and aromatic amides. J Am Chem Soc. 2013;135(43):16014–16017. |
 © 2017 The Author(s). This work is published and licensed by Dove Medical Press Limited. The full terms of this license are available at https://www.dovepress.com/terms.php and incorporate the Creative Commons Attribution - Non Commercial (unported, v3.0) License.
By accessing the work you hereby accept the Terms. Non-commercial uses of the work are permitted without any further permission from Dove Medical Press Limited, provided the work is properly attributed. For permission for commercial use of this work, please see paragraphs 4.2 and 5 of our Terms.
© 2017 The Author(s). This work is published and licensed by Dove Medical Press Limited. The full terms of this license are available at https://www.dovepress.com/terms.php and incorporate the Creative Commons Attribution - Non Commercial (unported, v3.0) License.
By accessing the work you hereby accept the Terms. Non-commercial uses of the work are permitted without any further permission from Dove Medical Press Limited, provided the work is properly attributed. For permission for commercial use of this work, please see paragraphs 4.2 and 5 of our Terms.