")
Back to Journals » Cancer Management and Research » Volume 11
Suppressing growth and invasion of human hepatocellular carcinoma cells by celecoxib through inhibition of cyclooxygenase-2
Authors Tai Y, Zhang LH, Gao JH, Zhao C, Tong H, Ye C, Huang ZY, Liu R, Tang CW
Received 10 August 2018
Accepted for publication 23 January 2019
Published 9 April 2019 Volume 2019:11 Pages 2831—2848
DOI https://doi.org/10.2147/CMAR.S183376
Checked for plagiarism Yes
Review by Single anonymous peer review
Peer reviewer comments 4
Editor who approved publication: Dr Beicheng Sun
Yang Tai, 1,* Lin-Hao Zhang, 1,* Jin-Hang Gao, 1, 2 Chong Zhao, 2 Huan Tong, 1 Cheng Ye, 1 Zhi-Yin Huang, 1 Rui Liu, 2 Cheng-Wei Tang 1, 2
1Laboratory of Gastroenterology & Hepatology, State Key Laboratory of Biotherapy, West China Hospital, Sichuan University, Chengdu 610041, Sichuan, People’s Republic of China; 2Department of Gastroenterology, West China Hospital, Sichuan University, Chengdu 610041, Sichuan, People’s Republic of China
*These authors contributed equally to this work
Purpose: Biomarkers are lacking in hepatocellular carcinoma (HCC). Cyclooxygenase-2 (COX-2) and its metabolites play crucial roles in the process of inflammation-tumor transformation. This study was aimed to detect COX-2 expression in HCC tissues and evaluate the effects of a COX-2 inhibitor, celecoxib, on biological behaviors of HCC cell lines in vitro.
Methods: COX-2 expression was detected by immunohistochemistry on a human HCC tissue microarray. The correlations of COX-2 expression with tumor clinicopathological variables and overall survival were analyzed. The proliferation, apoptosis, cell cycle distribution, invasion capacity, and related signaling molecules of HCC cells after incubated with COX-2 inhibitor celecoxib were evaluated in vitro.
Results: Expression levels of COX-2 in HCC tissues were significantly higher than those in paracancerous tissues. The TNM stage III-IV, tumor size > 5 cm, lymphovascular invasion and distant metastasis was higher in high COX-2 expression group compared with that in low COX-2 expression group. Patients with low COX-2 expression achieved better 5-year overall survival than those with high COX-2 expression. Treatment with celecoxib was sufficient to inhibit cell proliferation, promote apoptosis, and induce G0/G1 cell cycle arrest in HCC cells with concentration- and time-dependent manners. Celecoxib up-regulated E-cadherin protein through inhibiting COX-2-prostaglandin E2 (PGE2)-PGE2 receptor 2 (EP2)-p-Akt/p-ERK signaling pathway to suppress HCC cells migration and invasion.
Conclusion: High COX-2 expression was associated with advanced TNM stage, larger tumor size, increased lymphovascular invasion and short survival. Targeting inhibition of COX-2 by celecoxib exhibited anti-tumor activities by suppressing proliferation, promoting apoptosis, and inhibiting the aggressive properties of HCC cells.
Keywords: cyclooxygenase-2, hepatocellular carcinoma, celecoxib, survival
Corrigendum for this paper has been published
Introduction
Liver cancer is the second leading cause of cancer death worldwide, with 782,500 new cases and 745,500 deaths annually.1 The incidence rates of liver cancer are highest in Eastern Asian, and China alone accounts for about 50% of the world total number of cases and deaths.1 Hepatocellular carcinoma (HCC) accounts for the vast majority of primary liver cancer cases.2 According to the Barcelona Clinic Liver Cancer Staging Classification,3 tumor size, vascular invasion, and metastasis are pivotal factors in the determination of clinical staging and prediction of prognosis in patients with HCC. Consequently, identification of key molecules and signal pathways associated with tumor growth, invasion, and metastasis could facilitate our understanding of the pathogenesis of HCC. Meanwhile, these molecules might also serve as biomarkers to predict prognosis and novel targets for anti-cancer therapy, which is lacking to date clinically in HCC.2
Liver fibrosis is an essential pathological process involved in various chronic hepatic diseases that may deteriorate into liver cirrhosis and HCC. It is well established that inflammation initiates liver fibrosis and HCC ensues in many cases, known as hepatic inflammation-fibrosis-cancer axis.4,5 Cyclooxygenase-2 (COX-2) is a rate-limiting enzyme in the sequential oxygenation of arachidonic acid (AA) to synthesize prostaglandins and thromboxanes, which play important roles in the process of inflammation-tumor transformation.6 Indeed, our previous studies have proved that COX-2 was up-regulated in fibrotic liver tissues and COX-2 expression increased along with the severity of fibrosis,7,8 indicating it is a pivotal molecule in the carcinogenesis of HCC evolved from fibrosis. However, few studies have evaluated COX-2 expression levels in tumor and corresponding paracancerous tissues in human HCC. Besides, the correlation of COX-2 levels with clinicopathological characteristics and prognosis remained controversial.9–12
Nevertheless, COX-2 inhibitors have shown potent anti-tumor effects, probably via anti-inflammation, inhibition of proliferation and angiogenesis, and regulation of immunity.13–16 Celecoxib, a selective COX-2 inhibitor, has been proved to alleviate liver fibrosis and portal hypertension through suppressing gut-liver inflammation,17 intrahepatic angiogenesis,18 and epithelial–mesenchymal transition of hepatocytes.19 Based on the inflammation-fibrosis-cancer axis, the anti-fibrotic effects of celecoxib make it a novel non-cytotoxic drug candidate in the prevention and treatment of HCC. More recently, a randomized clinical trial has shown that adjuvant celecoxib following transarterial chemoembolization enhanced tumor response and prolonged overall survival in unresectable HCC patients.20 Therefore, the anti-tumor effect and mechanism of celecoxib against HCC deserves further investigation.
This study was aimed to evaluate the expression of COX-2 in human HCC tissues and investigate its correlations with tumor clinicopathological features and prognosis. Additionally, the effects of celecoxib on the biological characteristics of HCC cells were evaluated in vitro. We found high COX-2 expression was associated with advanced TNM stage, larger tumor size, increased lymphovascular invasion and short survival. Moreover, targeting inhibition of COX-2 by celecoxib exhibited anti-tumor activities by suppressing proliferation, promoting apoptosis, and inhibiting the aggressive properties of HCC cells.
Materials and methods
Tissue microarray
HCC TMA applied in the study was obtained from the National Engineering Centre for Biochip (Shanghai, China). TMA samples included a total of 95 patients with HCC who had undergone a complete surgical resection of the hepatic carcinoma between August 2006 and November 2009. Detailed clinical and pathologic information of these 95 patients were collected (Table 1). All patients were followed up from the date of surgery until September 2013. Written informed consent forms for the tissue specimens were received from all participants, and the study was approved by the ethical committee of Taizhou Hospital of Zhejiang Province, which was the biobank center related hospital. Investigations were carried out following the rules of the Declaration of Helsinki of 1975 revised in 2008.
Immunohistochemistry and scoring
For IHC staining, the sections of TMA were deparaffinized in xylene and rehydrated with graded ethanol dilutions. Antigen retrieval was performed at high temperature under high pressure in sodium citrate buffer (10 mM, pH=6.0) for 15 mins. After blocked with H2O2 and 10% goat serum, the sections were incubated with primary antibodies (Table S1) overnight at 4°C followed by incubation with biotin-streptavidin horseradish peroxidase (HRP) detection kit (ZSGB-BIO, Beijing, China) at 37°C for 30 mins. Finally, the sections were stained with a solution of 3, 3ʹ-diaminobenzidine (DAB, ZSGB-BIO) and counterstained with hematoxylin. Negative control slides, in which the primary antibody was omitted, were included in all assays. The sections were examined under an optical microscope (CX41, Olympus, Tokyo, Japan) equipped with a digital camera system (DP72, Olympus).
Each slide was assessed independently by two pathologists who were blinded to the clinical and pathologic information. The expression of COX-2, Ki-67, CD34, p53 and AFP in tissues were semi-quantitatively scored on the basis of positive percentage and intensity of stained preparation as described previously56 (staining index = positive score ×intensity score). The positive percentage of stained tumor cells was scored as: 0, no staining; 1, <20%; 2, 20–75%; 3, >75%. The intensity of stained tumor cells was graded on the following scale: 0, negative; 1, weak; 2, moderate; 3, strong staining. According to the staining index, a final total score of 0–4 was considered to be low COX-2 expression, whereas a total score of 5–9 was defined as high COX-2 expression.
Cell culture and treatments
Normal human liver cell line L02 and five human HCC cell lines (HepG2, Bel7402, MHCC97L, MHCC97H, and HCCLM3) with different metastatic potentials were obtained from the American Type Culture Collection (ATCC, Manassas, VA, USA), the Type Culture Collection of the Chinese Academy of Sciences (Shanghai, China), or the Liver Cancer Institute, Zhongshan Hospital, Fudan University (Shanghai, China). Use of these cell lines was approved by the institutional review board of West China Hospital. All cell lines were routinely maintained in high-glucose DMEM (HyClone, Logan, UT, USA) supplemented with 10% fetal bovine serum (FBS, Biological Industries, Cromwell, CT, USA), 100 U/mL penicillin, and 100 μg/mL streptomycin (HyClone) in a humidified atmosphere at 37°C with 5% CO2 in air.
The cells were starved with serum-free DMEM for 16 hrs before reagent treatments. All treatments in the corresponding concentration were performed in serum-free DMEM for additional 24 or/and 48 hrs. Celecoxib (10 μM), PGE2 (1 μM), EP2 antagonist (AH6809, 10 μM), Akt inhibitor (MK2206, 3 μM), and MAPK-ERK inhibitor (AZD6244, 1 μM) were dissolved in DMSO. The final concentration of DMSO was 0.1% in each treated cell. PGE2 and corresponding inhibitors were obtained from Sigma-Aldrich (St Louis, MO, USA), Selleck Chemical (Houston, TX, USA), or MedChem Express (Monmouth Junction, NJ, USA).
Plasmid transfection
The open reading frame (ORF) of COX-2 in pIRES2-EGFP (COX-2-pIRES2, Hanbio Biotechnology, Shanghai, China) and empty vector pIRES2-EGFP (Empty-pIRES2, Hanbio Biotechnology) were transfected into Bel7402 cells by using LipoFiter (Hanbio Biotechnology) following the manufacturer’s protocol. Briefly, Bel7402 cells in logarithmic growth phase were seeded on 6-well plates with a density of 5×10⁵ per well. COX-2-pIRES2 or Empty-pIRES2 DNA (3 μg) and LipoFilter (12 μL) dissolved in serum-free medium were added to each well when cells were grown to approximately 60–70% confluence. The serum-free medium was subsequently replaced with a fresh complete medium after 6 hrs of transfection and cultured for an additional 48 hrs followed by subsequent experiments. COX-2 mRNA and protein over-expression were verified by quantitative real-time PCR (qRT-PCR) and Western blot, respectively. The diagram and sequencing data of the plasmid is also provided in Figure S1 .
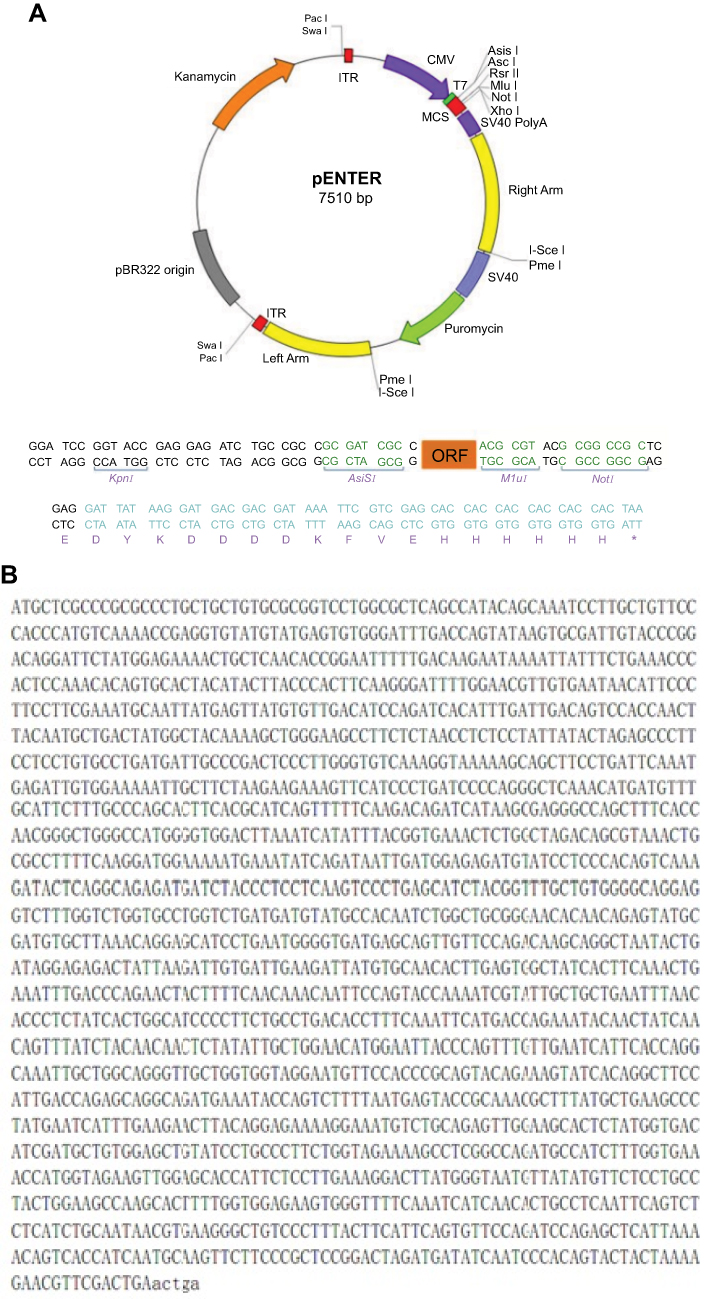 | Figure S1 Diagram and sequencing data of COX-2-pIRES2 plasmid. Diagram of COX-2-pIRES2 plasmid (A). sequencing data of COX-2-pIRES2 plasmid (B). |
CCK8 assay for cell viability
The cell viability was determined by using CCK8 (Dojindo, Kumamoto, Japan) according to the manufacturer's instruction. Bel7402 and HepG2 cells were seeded at a density of 104 cells/well in 96-well plates for 24 hrs. Then the cells were treated with serial concentration (0, 10, 30, 50, and 70 μM) of celecoxib for 24 and 48 hrs. A 10 μL of CCK8 solution was added to each well, and the plates were incubated at 37°C for 1 hrs in the dark. The optical density of each well was measured at 450 nm using the Thermo microplate reader (Thermo Fisher Scientific, Waltham, MA, USA).
Flow cytometric analysis for cell cycle and apoptosis
Bel7402 and HepG2 cells were cultured in 6-well plates and treated with a serial concentration of celecoxib for 24 hrs. For cell cycle detection, the cells were collected and fixed with 70% ethanol overnight at −20°C. Then the cells were incubated with RNase A at 37°C for 30 mins and stained with PI (Keygen Biotech, Nanjing, China) at 4°C for 30 mins in the dark. The cell cycle data were collected and analyzed by flow cytometry (CytoFLEX, Beckman Coulter, Indianapolis, IN, USA) using ModFit LT 5.0 software (Verity Software House, Topsham, ME, USA). The apoptosis of Bel7402 and HepG2 was examined using an Annexin V-FITC/PI dual staining kit (BD Biosciences, San Jose, CA, USA) according to the manufacturer’s instructions. Briefly, the cells were washed by cold phosphate buffered saline (PBS), trypsinized, and collected by centrifugation. Then, the cells were stained with Annexin V-FITC and PI in 400 μL of binding buffer in the dark at room temperature for 15 mins and quantified by flow cytometry (CytoFLEX).
TUNEL for cell apoptosis
Bel7402 and HepG2 cells were cultured on coverslips at the bottom of 24-well plates. After cells were treated with a serial concentration of celecoxib for 24 hrs, the apoptosis was detected by TUNEL assay kit (Roche Diagnostics, Basel, Switzerland) according to the manufacturer’s instructions. Briefly, the cells were fixed with 4% paraformaldehyde before permeabilization with 0.1% Triton X-100. Then the coverslips were incubated with TUNEL reaction mixture in the dark for 60 mins at 37°C. After cell nuclei were stained with 4′, 6-diamino-2-phenylindole (DAPI, Roche, Basel, Switzerland), the coverslips were mounted with anti-fading medium and visualized under a fluorescence microscope (BX41, Olympus). For quantification of apoptosis index, five random fields at ×100 magnification were selected and the numbers of TUNEL-positive cells were calculated for each section.
Wound-healing assay for cell migration
For the wound-healing assay, Bel7402 cells were seeded in 6-well plates to form a confluent monolayer. A wound was created by scraping confluent cell monolayer with a 200 μL micropipette tip to denude a strip of monolayer ~100 μm width. Cells were then washed for three times with PBS and incubated with corresponding treatments for 24 and 48 hrs. The images were taken under the inverted microscope at 0, 24, and 48 hrs after scratching, and the average gap of the wound was calculated using Image-Pro Plus 6.0 software (Media Cybernetics, Rockville, MD, USA). The motility was calculated by the formula: (width 0 h-width 24 h/48 h)/width 0 h×100%.
Transwell assay for cell invasion
The transwell invasion assay was performed in 24-well plates with Matrigel (BD Biosciences)-coated polycarbonate filters with 8-mm pores (Millipore, Billerica, MA, USA). Briefly, 5×10⁴ Bel7402 cells with 100 μL of serum-free medium were seeded into the top chamber. The bottom chamber was filled with 600 μL of medium containing 10% FBS. After 48 hrs of incubation with corresponding treatments, the cells of upper chamber were removed by a cotton swab, and the cells in the bottom were fixed with methanol, stained with crystal violet, and then counted by microscope in 12 random fields at ×400 magnification. For quantification, the average cell number per field for each membrane was calculated.
Immunofluorescence staining
The cells were cultured on coverslips at the bottom of 24-well plates and incubated with corresponding treatments. Then the cells were fixed with 4% paraformaldehyde before permeabilization with 0.1% Triton X-100. After blocked with 10% goat serum, the cells were incubated with primary antibodies (Table S1) overnight at 4°C followed by incubation with TRITC-conjugated secondary antibodies (1:200, Santa Cruz Biotechnology, Santa Cruz, CA, USA) at room temperature for 30 mins. Then the cells were stained with DAPI and mounted with anti-fading medium before examined under a fluorescence microscope. Negative controls, in which the primary antibody was omitted, were included in all assays.
Western blot analysis for protein expression
The whole proteins were extracted by using a protein extraction kit (Keygen Biotech). An equal amount of proteins (30 μg) from each sample were separated by 8% or 10% SDS-PAGE and transferred to PVDF membrane (Millipore). Nonspecific binding sites in the membrane were blocked with 5% non-fat dry milk before incubated with primary antibodies (Table S1) overnight at 4°C. Blots were washed and incubated with appropriate HRP-conjugated secondary antibodies (1:20000, Santa Cruz Biotechnology) for 2 hrs at room temperature. Protein bands were visualized by using an ECL detection kit (Engreen Biosystem, Beijing, China). The autoradiographs were scanned after exposing the membranes to Kodak XAR film (Eastman Kodak, Rochester, NY, USA). The intensity of the bands was measured by Quantity One software 4.6.2 (Bio-Rad, Hercules, CA, USA). Relative protein expression levels were normalized to GAPDH.
Statistical analysis
All data were expressed as mean ± standard deviation and were analyzed by SPSS 19.0 software (SPSS, Chicago, IL, USA). Quantitative data were analyzed by using two-tailed Student’s t test or one-way ANOVA with Least Significant Difference (LSD) as a post hoc test. The χ2 test was applied to analyze the difference of clinicopathological parameters between low and high COX-2 expression groups. Survival curves were evaluated by using the Kaplan–Meier method and compared by the log-rank test. A value of p<0.05 was considered significant.
Results
Patient characteristics
The clinicopathological characteristics of the patients enrolled in the study are summarized in Table 1. The tissue microarray (TMA) consisted of 95 patients with a diagnosis of HCC, including 10 females (10.5%) and 85 males (89.5%) with an average age of 53.9±9.9 years old. Among these HCC patients, 64 (67.4%) cases showed α-fetoprotein (AFP) positive expression. Histologically, 61 cases (64.2%) were in grade I ~ II, while the remaining 34 cases (35.8%) were in grade II ~ III. According to the TNM staging system, 45 (47.4%) cases were in stage I ~ II and 50 (52.6%) cases were in stage III ~ IV. The average tumor size was 7.8 cm, with 42 (44.2%) tumors ≤5 cm and 53 (55.8%) tumors >5 cm. Tumor number revealed that 80 (84.2%) tumors were single and 15 (15.8%) tumors were multiple. Positive lymphovascular invasion or distant metastasis was observed in 17 cases (17.9%).
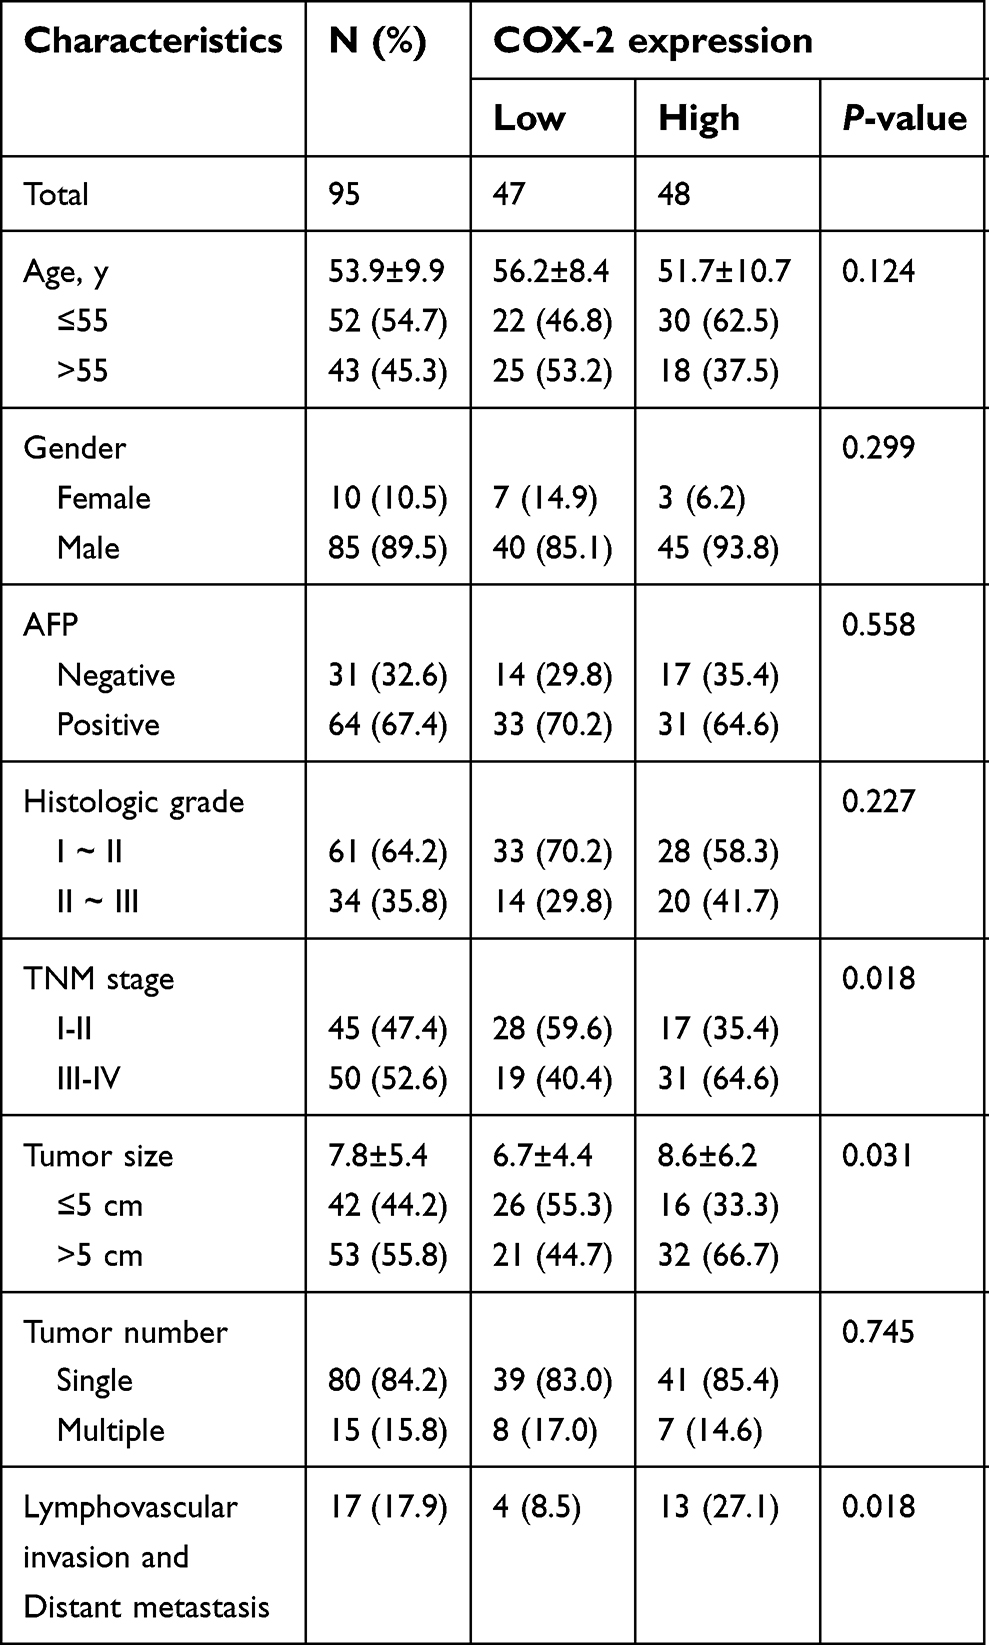 | Table 1 Relationships between COX-2 expression and clinicopathological characteristics in 95 hepatocellular carcinoma cases |
COX-2 expression in HCC tissues and corresponding paracancerous tissues
In TMA slide, the positive staining of COX-2 was mainly localized to the hepatocellular cytoplasm in both tumor tissues and paracancerous tissues (Figure 1A). Based on the staining index described in the methods, there was a significant difference in the expression levels of COX-2 between human HCC tissues and paracancerous tissues (6.8±2.3 vs 6.1±2.1, P=0.039, Figure 1B).
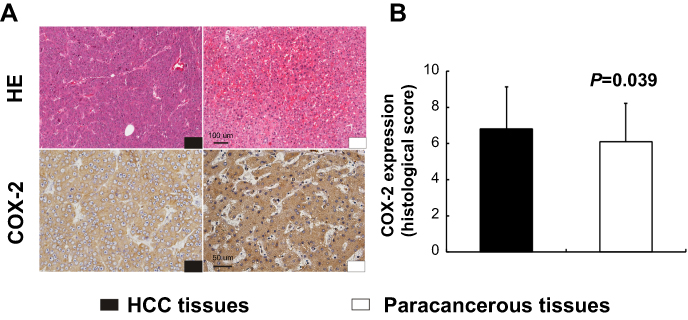 | Figure 1 Expression of COX-2 in human hepatocellular carcinoma (HCC) tissues and paracancerous tissues. Immunohistochemistry (IHC) for COX-2 displayed cytoplasmic expression of hepatocytes in both HCC tissues and paracancerous tissues (A). There was a significant difference in the expression levels of COX-2 between human HCC tissues and paracancerous tissues (B, P=0.039, n=95). Scale bar =100 µm for HE staining; scale bar =50 µm for IHC staining. |
Correlation between COX-2 expression and clinicopathological features in HCC
Among 95 HCC patients, 47 (49.5%) cases were identified with low COX-2 expression and 48 (50.5%) cases with high COX-2 expression. The relationships between COX-2 expression and clinicopathological features were analyzed (Table 1). A significantly positive correlation was observed between COX-2 expression and TNM stage (P=0.018, Figure 2A). The rate of patients with TNM stage I ~ II was higher in the low COX-2 expression group (59.6%) than that in the high COX-2 expression group (35.4%). However, the rate of patients with TNM stage III ~ IV was lower in the low COX-2 expression group than that in the high COX-2 expression group (40.4% vs 64.6%). Besides, COX-2 expression was significantly associated with tumor size. The rate of patients with tumor size >5 cm was lower in the low COX-2 expression group compared with that in the high COX-2 expression group (44.7% vs 66.7%, P=0.031). Furthermore, high COX-2 expression increased the risk of lymphovascular invasion and distant metastasis (27.1% vs 8.5%, P=0.018). Additionally, COX-2 expression was significant positively correlated with Ki-67 (r=0.224, P=0.029, Figure 2A and B) and CD34 expression (r=0.3, P=0.003, Figure 2A and C) in HCC tissues. In contrast, there was no significant correlation between COX-2 expression and other clinicopathological factors, including age, gender, histologic grade, tumor number, AFP, and p53 expression (P>0.05, Table 1).
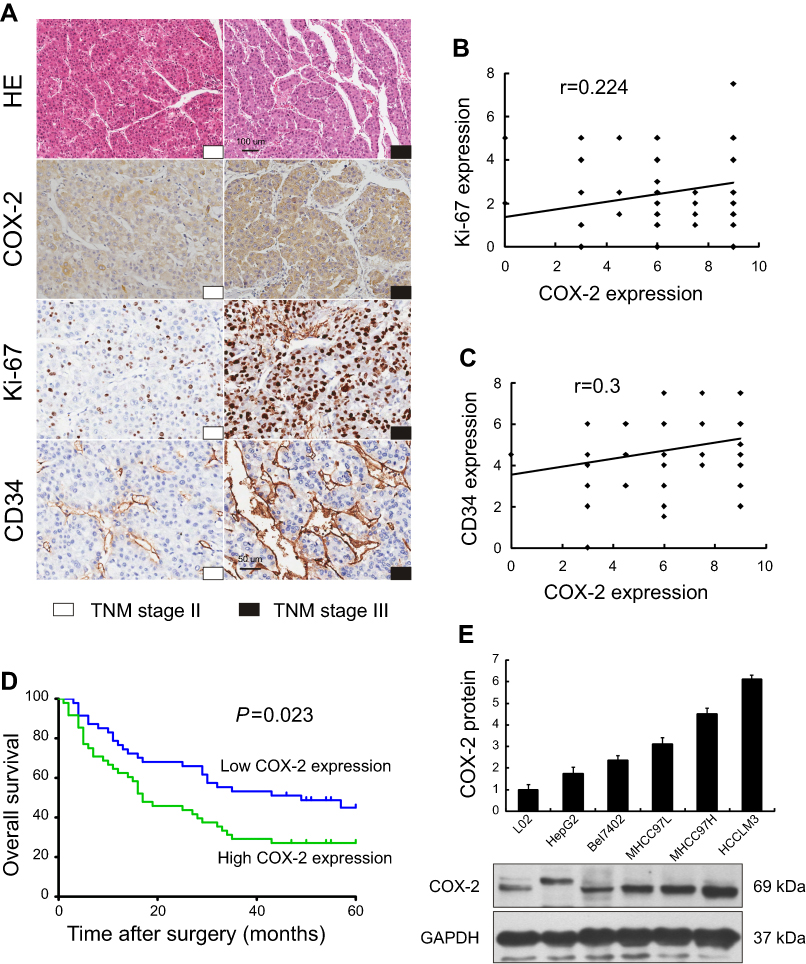 | Figure 2 Association of COX-2 expression between clinicopathological features and 5-year overall survival in human HCC, and expression of COX-2 in the normal human liver cell and HCC cell lines. IHC for COX-2, Ki-67, and CD34 in HCC patients with TNM stage II and III (A) have shown that COX-2 expression was significant positively correlated with Ki-67 (B, r=0.224, P=0.029, n =95) and CD34 expression (C, r=0.3, P=0.003, n=95) in HCC tissues. The 5-year overall survival was better in patients with low COX-2 expression when compared with those with high COX-2 expression (D, P=0.023, n=95). The expression levels of COX-2 in normal human liver cell and HCC cell lines increased along with the metastatic capacity by Western blot (E). |
Correlation between COX-2 expression and prognosis in HCC
The survival analysis showed that the 5-year survival rate of all HCC patients enrolled was 36.8%. The 5-year survival rate in low COX-2 expression group was much higher than that in the high COX-2 expression group (46.8% vs 27.1%). Moreover, the median survival time was 49 months for low COX-2 expression group and 17 months for high COX-2 expression group. A significant association between COX-2 expression and tumor prognosis in HCC had been established. Patients with low COX-2 expression achieved better 5-year overall survival than those with high COX-2 expression (P=0.023, Figure 2D).
COX-2 expression in human HCC cell lines
COX-2 expression was evaluated in the normal human liver cell line (L02) and five human HCC cell lines with different metastatic potentials. Western blot showed that both normal human liver cell line and human HCC cell lines expressed COX-2 protein, and the expression levels of COX-2 increased along with the metastatic capacity (L02<HepG2<Bel7402<MHCC97L<MHCC97H<HCCLM3, Figure 2E).
Inhibition of cell proliferation by celecoxib
CCK8 assay was employed to evaluate cell viability after treatment with different concentrations of celecoxib. In CCK8 assay, treatment with celecoxib in concentrations of 30, 50 and 70 μM for both 24 and 48 hrs exhibited a notable suppressing effect on Bel7402 and HepG2 cells (Figure 3A and B). The cell proliferation was determined by the immunofluorescence (IF) staining of Ki-67. Celecoxib inhibited the proliferation of Bel7402 and HepG2 cells in both concentration- and time-dependent manner (Figure 3C–F). Treatment with high concentrations (30, 50, and 70 μM) of celecoxib was sufficient to inhibit the proliferation of both Bel7402 (Figure 3C–E) and HepG2 (Figure 3D–F) cells for 24 and 48 hrs, whereas it had no inhibition effect on the proliferation of HCC cells in the concentration of 10 μM.
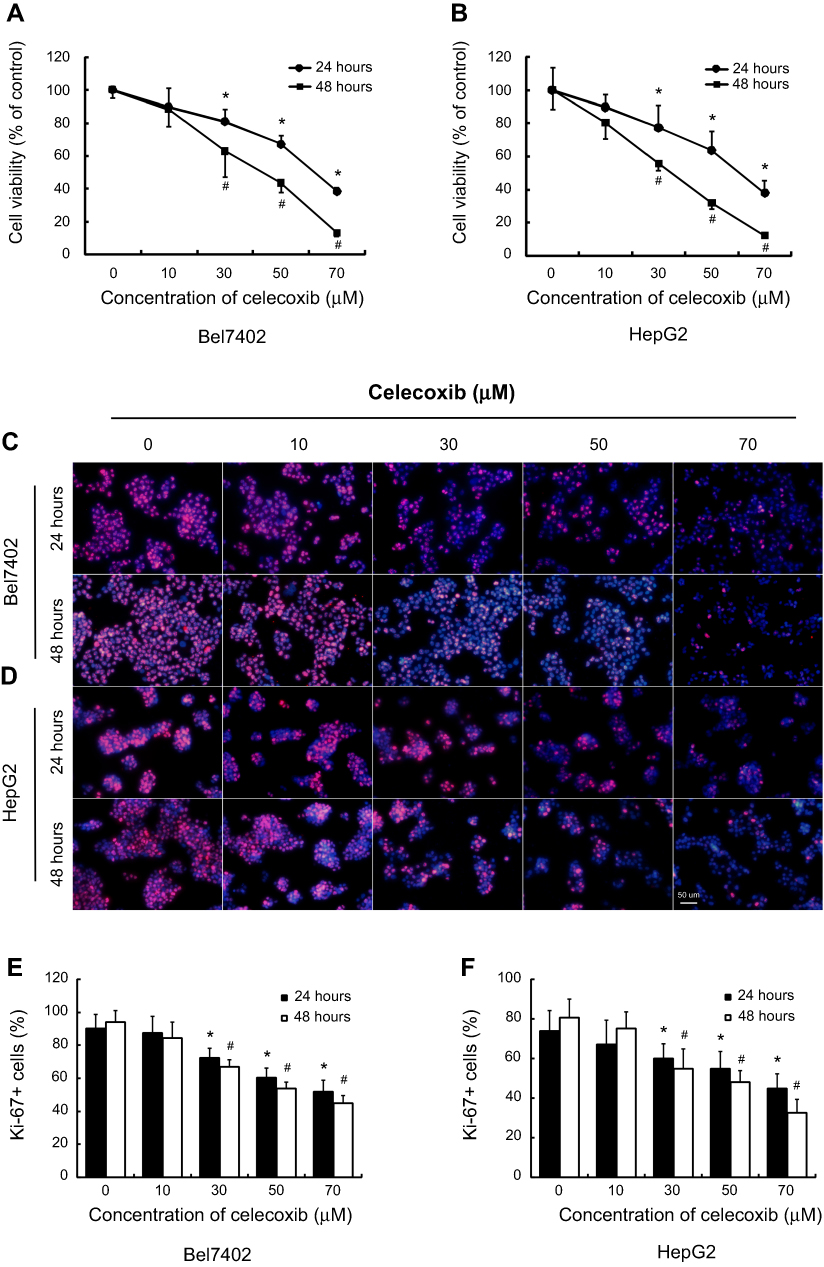 | Figure 3 Celecoxib inhibited cell proliferation in Bel7402 and HepG2 cells. The CCK8 assay (A and B) was carried out to evaluate cell viability, and cell proliferation was determined by immunofluorescence (IF) of Ki-67 (C–F). Compared with the vehicle-treated cells, the cell viability and proliferation of both Bel7402 (A, C, E) and HepG2 (B, D, F) cells were significantly inhibited with a high concentration of celecoxib (30, 50 and 70 μM) in both concentrations- and time-dependent manner. *P<0.05 vs vehicle-treated cells for 24 hrs; #P<0.05 vs vehicle-treated cells for 48 hrs; scale bar =50 µm. |
Cell cycle arrest induced by celecoxib
Cell cycle was analyzed by flow cytometry with propidium iodide (PI) staining after treatment with a serial concentration of celecoxib in Bel7402 (Figure 4A and C) and HepG2 (Figure 4B and D) cells for 24 hrs. Low concentrations of celecoxib (10 and 30 μM) caused a slight elevation in the percentage of both cells at the G0/G1 phase (P>0.05). Treatment with celecoxib at high concentrations (50 and 70 μM) significantly increased the percentage of both cells at the G0/G1 phase, compared with the control group (P<0.05). At the same concentrations, the percentage of both cells at S phase and G2/M phase were significantly decreased than that of the control group (P<0.05). Thus, celecoxib treatment induced G0/G1 cell cycle arrest in both Bel7402 and HepG2 cells.
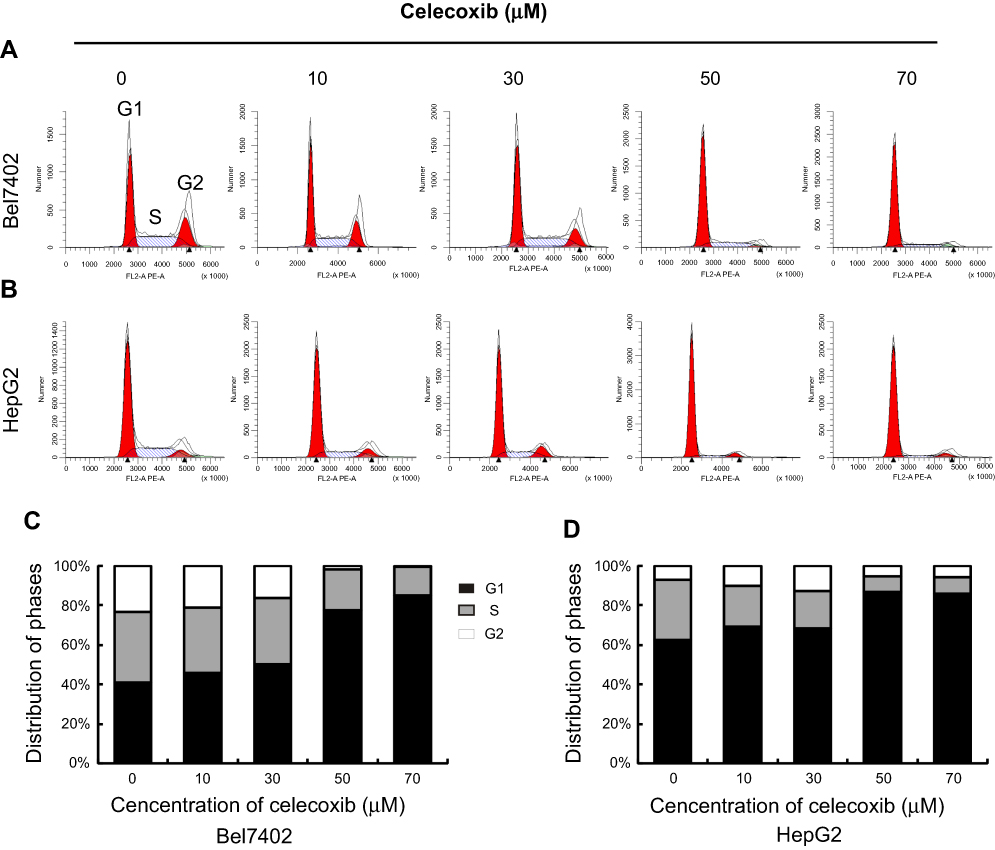 | Figure 4 Celecoxib-induced cell cycle arrest in Bel7402 and HepG2 cells. The cell cycle distribution of Bel7402 and HepG2 cells was determined by flow cytometry. Celecoxib-induced G0/G1 cell cycle arrest in both Bel7402 (AC) and HepG2 (B, D) cells at higher doses (50 and 70 μM) in a dose-dependent way for 24 hrs (P<0.05). |
Induction of cell apoptosis by celecoxib
According to the flow cytometry staining by Annexin V-fluorescein isothiocyanate (FITC) and PI, celecoxib induced concentration-dependent apoptosis in both Bel7402 and HepG2 cells. Dramatically increased apoptosis was observed in Bel7402 and HepG2 cells by celecoxib in a concentration of 30, 50 and 70 μM for 24 hrs (Figure 5A–D). Impressively, the maximal apoptosis index of Bel7402 and HepG2 cells was 37.6% and 24.2%, respectively. No significant difference of cell apoptosis was observed in HCC cells treated with 10 μM celecoxib, compared with that in vehicle-treated cells. Similar results were obtained in the deoxynucleotidyl transferase dUTP nick end labeling (TUNEL) assay for Bel7402 and HepG2 cells (Figure 5E–H).
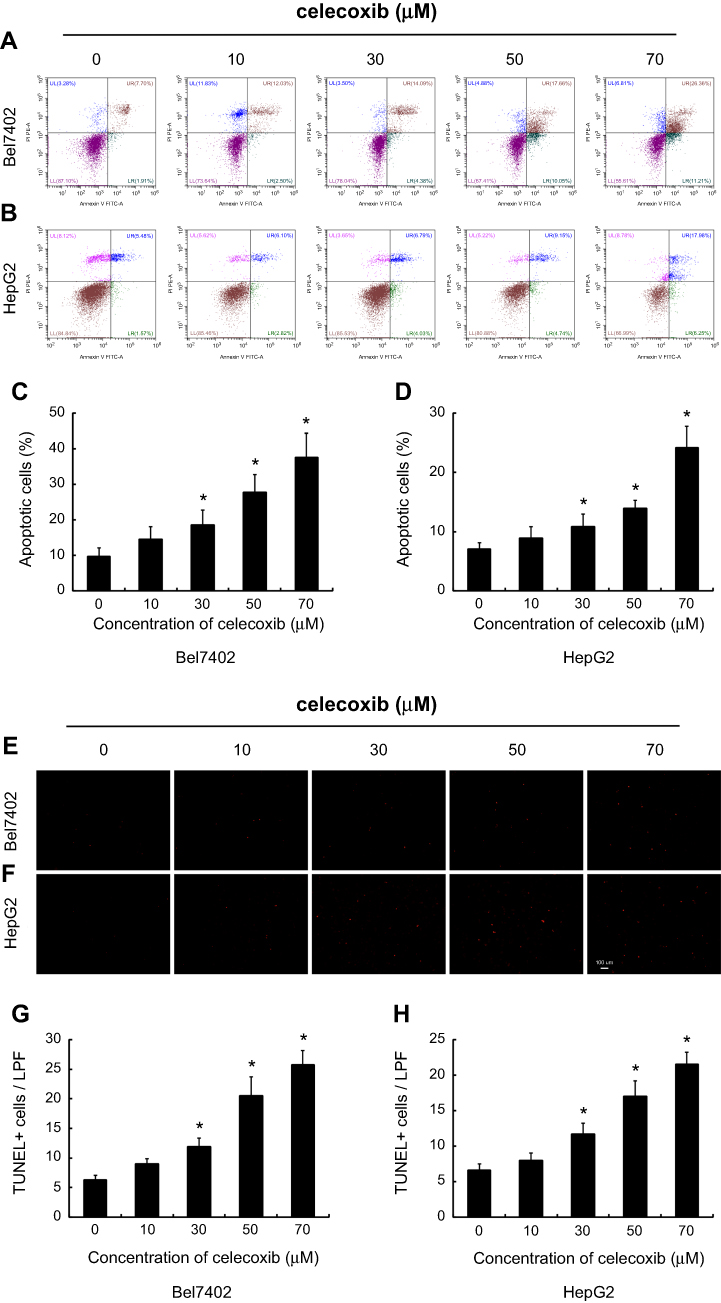 | Figure 5 Celecoxib-induced cell apoptosis in Bel7402 and HepG2 cells. The apoptosis of HCC cells Bel7402 and HepG2 was determined by flow cytometry (A–D) and TUNEL staining (E–H). Celecoxib-induced cell apoptosis in both Bel7402 (A, C, E, G) and HepG2 cells (B, D, F, H) at a concentration of 30, 50 and 70 μM in a dose-dependent way for 24 hrs. *P<0.05 vs vehicle-treated cells; scale bar =100 µm. |
Inhibition of migration and invasion by celecoxib
The migration and invasion capacity were evaluated in Bel7402 cells by wound-healing and transwell assay in vitro (Figure 6). Compared with dimethyl sulfoxide (DMSO)-treated cells, the wound-healing rate and invasion cells through Matrigel were significantly decreased after inhibition of COX-2 by celecoxib (P<0.05). Similar results were observed in cells treated with AH6809, a prostaglandin E2 (PGE2) receptor 2 (EP2) inhibitor (P<0.05). Compared with DMSO and celecoxib, PGE2 significantly increased the wound-healing rate and invasion cells (P<0.05), which could be inhibited after blocking EP2 by AH6809 (P<0.05, Figure 6A, C, E, and G). Since PI3K-Akt and MAPK-ERK pathways are known to affect cancer invasion, and COX-2 expression was also correlated with PI3K-Akt and MAPK-ERK pathways,21–23 we sought to determine whether COX-2-PGE2-EP2-p-Akt/p-ERK signaling could regulate the behavior of HCC. In accordance with our expectation, the wound-healing rate and invasion could also be inhibited after blockage of PI3K-Akt and MAPK-ERK signaling pathway by MK2206 and AZD6244, respectively (P<0.05, Figure 6B, D, F, and H).
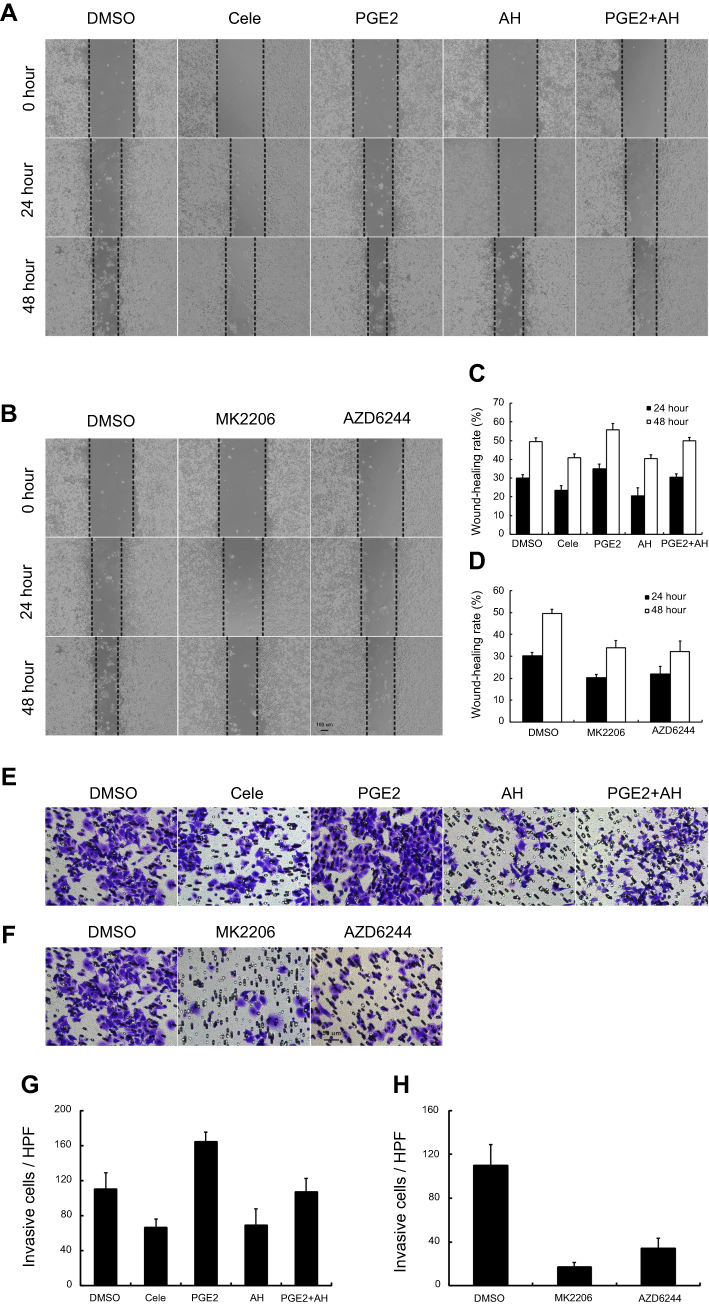 | Figure 6 Celecoxib inhibited cell migration and invasion in Bel7402 cells. Compared with DMSO-treated Bel7402 cells, the migration rate (A–D) and invasion cells (E–H) were significantly inhibited by Celecoxib, EP2 inhibitor AH6809, Akt inhibitor MK2206, and ERK inhibitor AZD6244, but exacerbated by PGE2, which could be reversed by AH6809 (P<0.05). Scale bar =100 µm for wound-healing assay; scale bar =50 µm for transwell assay. |
Up-regulation of E-cadherin protein through inhibiting COX-2-PGE2-EP2-p-Akt/p-ERK pathway by celecoxib
Compared with DMSO-treated and empty plasmid-transfected Bel7402 cells, overexpression of COX-2 by using COX-2 plasmid induced reduction of E-cadherin expression and increase of p-Akt and p-ERK expression (Figure 7A and D). Compared with DMSO-treated cells, protein levels of E-cadherin were significantly up-regulated by celecoxib, EP-2 inhibitor AH6809, Akt inhibitor MK2206, and ERK inhibitor AZD6244 (P<0.05, Figure 7B, C, E, and F). In contrast, PGE2 significantly induced reduction of E-cadherin expression (P<0.05), which could be reversed by AH6809 (P<0.05, Figure 7B and E). Meanwhile, the expression of p-Akt and p-ERK was significantly suppressed by treatment with celecoxib and AH6809 (P<0.05) but was enhanced by treatment with PGE2 (P<0.05), which could be inhibited after blockage of EP2 by AH6809 (P<0.05, Figure 7E). Additionally, p-Akt and p-ERK expression were remarkably suppressed by MK2206 and AZD6244, respectively (P<0.05, Figure 7F). Furthermore, no significant difference was observed in Akt and ERK protein among all treatment groups (P>0.05).
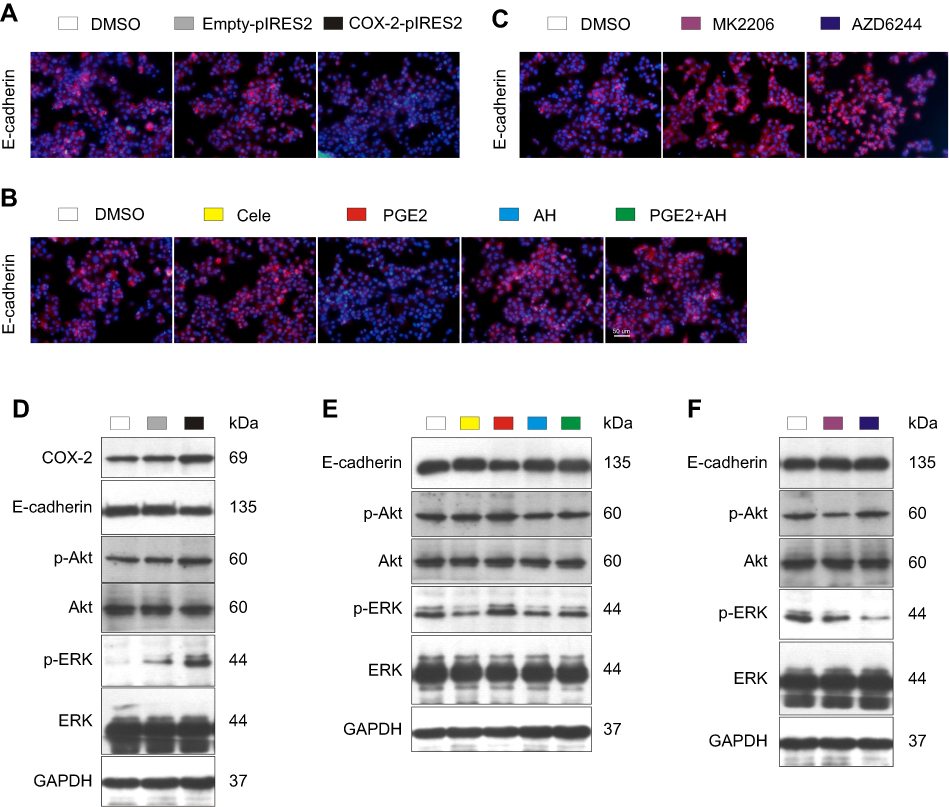 | Figure 7 Celecoxib up-regulated E-cadherin via inhibition of COX-2–PGE2–EP2–p-Akt/p-ERK in Bel7402 cells. Compared with DMSO-treated and empty plasmid-transfected Bel7402 cells, overexpression of COX-2 by using COX-2 ORF plasmid induced reduction of E-cadherin expression and increase of p-Akt and p-ERK expression determined by IF (A) and Western blot (D). Compared with DMSO-treated cells, the expression of E-cadherin quantified by IF (B, C) and Western blot (E, F) was up-regulated by EP2 inhibitor AH6809, Akt inhibitor MK2206, and ERK inhibitor AZD6244, but down-regulated by PGE2, which could be reversed by AH6809. Meanwhile, the expression of p-Akt and p-ERK was significantly suppressed by treatment with celecoxib and AH6809 but was enhanced by treatment with PGE2, which could be inhibited by AH6809 (E). Scale bar =50 µm for IF. |
Discussion
It is crucial to identify molecular biomarkers for HCC in clinical strategy.2 However, less reliable biomarkers for HCC have been verified. The association between COX-2 expression and the carcinogenesis of many types of cancer, including HCC, has been recognized. Both basic research and clinical trials have shown the antineoplastic effects the COX-2 inhibitor, celecoxib, on HCC.20,24,25 Whereas, the mechanisms by which suppressing COX-2 functions to inhibit HCC and whether COX-2 could apply as a molecular biomarker of HCC are largely unknown. In the current study, it seems rational that COX-2 might be a molecular biomarker of HCC. It is showed in this study that high expression of COX-2 in HCC indicates advanced cancer and poor prognosis. Consistently, the in vitro study also demonstrated that the expression levels of COX-2 were in line with metastatic capacity, and down-regulation of COX-2 by celecoxib could effectively suppress malignant biological behaviors of HCC cell lines. These findings provided new insights into the role of COX-2 in HCC carcinogenesis, and it could potentially work as a biomarker in prediction of prognosis and effective target for anti-cancer therapy.
COX-2 is expressed in liver cancer tissues, which might be related with the biological behaviors of liver cancer.26 Some researchers have found when COX-2 is expressed in paracancerous tissues, it might be a predictor of recurrence of HCC,27,28 highlighting the role of COX-2 in the progression of HCC. However, there were limited studies comparing COX-2 expression between HCC tissues and corresponding paracancerous tissues. In the current study, COX-2 expression in liver cancer tissues was higher than that in the corresponding paracancerous tissues, suggesting that COX-2 expression could influence the clinicopathological features and prognosis of liver cancer.
According to the definition of cancer biomarker, it should be measurable and distinguish normal and pathological processes.29 To verify whether COX-2 is an applicable biomarker in HCC, its expression was explored in TMA and the relevancy between COX-2 and clinicopathological features were analyzed. We detected that higher COX-2 expression was associated with larger tumor size, and more invasion and metastasis in HCC. It was not surprising that increased COX-2 expression was in association with increased Ki-67 and CD34 expression since COX-2 influences growth, angiogenesis, invasion, and metastasis.13–16 Accordantly, several in vivo studies have verified the effects of COX-2 inhibitors on proliferation and angiogenesis in HCC models, which showed suppression of COX-2 could delay HCC growth.30–32 Consistent with our findings in HCC tissues, levels of COX-2 expression were in line with the metastatic capacity in vitro, with the lowest potential of migration in normal human liver cell line L02 and highest in high-invasive HCC cell line HCCLM3. Association of histologic grade with COX-2 expression was not observed in our study. However, some reported well-differentiated liver cancer was linked with increased COX-2 expression.11,33 This disparity might be attributed to differences in methodology. For example, Schmitz et al scored COX-2 staining solely according to number of positive cells,11 but our staining index utilized both percentage and intensity of staining. Moreover, Bae et al enrolled lower number of HCC cases and did not use TMA to guarantee the homogeneity of immunohistochemistry (IHC) staining.33
Furthermore, we found an inverse correlation between COX-2 expression and prognosis. In favor of our results, other studies and a meta-analysis found increased COX-2 level was associated with worse prognosis in HCC.9,34 In support of this, a positive correlation between COX-2 expression and TNM stage was established, and TNM stage III-IV usually predicts poor survival. These still might be ascribed to the fact that COX-2 could facilitate growth, angiogenesis, invasion, and metastasis of cancer.13–16 In contrast to the results in this study, there were some studies which suggest that increased COX-2 expression in HCC was not indicative of poor survival35 or even could predict a favorable outcome.11 The differences between Yildirim’s study and ours were sample size (only 31 patients enrolled in their study) and criterion to define COX-2 expression levels (percentage of positive cells in their study).35 Besides, we used TMA instead of separate slides to ensure the synchronicity of the IHC staining, which may explain the discrepancies of the results between Schmitz’s and our study.11
These observations remind us that COX-2 can be a feasible molecular biomarker to treat HCC, whose effects might play important roles in the growth and invasiveness of HCC. Thus, the effects of celecoxib on HCC cell lines, Bel7402 and HepG2 were further discovered. In CCK8 assay, viability of both cell lines was reduced by celecoxib, suggesting a considerable trend towards cell death after treatment. The following experiments found celecoxib could suppress proliferation and induce cell cycle arrest as well as apoptosis in both cell lines, which is accordant with the correlation between COX-2 expression and tumor size. In our experiment, up to 70 μM of celecoxib was used, whose effect might not only be mediated by its specific inhibition on COX-2 but its own toxicity at the high concentration. However, Makhdoumi et al pointed out that high dose of celecoxib could still decrease PGE2 production in a time- and dose-dependent manner, which proved that even when celecoxib is used in high concentration, its mechanism is still COX-2 dependent.36 Similar results were obtained in studies applying other COX-2 inhibitors, such as meloxicam and NS-398, to treat HCC cells, which could also inhibit HCC cell proliferation, and induce apoptosis and cell cycle arrest.37–40 Our results were also in line with findings demonstrating the effects of celecoxib on tumor growth in variable other cancer cells.21,22,41,42
Since high COX-2 expression indicated increased invasion and metastasis, we sought to further determine the role of COX-2 in invasion and migration and underlying mechanisms. COX-2 is a rate-limiting enzyme in the sequential oxygenation of AA to prostaglandins (PGs) and thromboxanes. Our previous study has established that inhibition of COX-2 suppressed migration of vascular endothelial cells by the blockage of PGE2 binding to its specific receptor EP2.18 Thus, wound-healing and transwell assay were performed to address whether COX-2-PGE2-EP2 signaling could affect invasion and migration in HCC cells. We found celecoxib and an EP2 antagonist, AH6809 could inhibit invasion and migration, but PGE2, the downstream product of COX-2 potentiated invasion and migration, whose effect could be reversed by AH6809. Thus, celecoxib might inhibit invasion and migration via COX-2-PGE2-EP2 pathway. Furthermore, PI3K-Akt and MAPK-ERK are pivotal signaling pathways during tumor migration, invasion, and metastasis. The present study also confirmed the hypothesis in Bel7402 cells. The aggressive properties of HCC cells significantly decreased after inhibition of PI3K-Akt or MAPK-ERK by MK2206 or AZD6244, respectively.
The invasion and migration of HCC were associated with cell-cell adhesion proteins such as E-cadherin,43,44 and PGE2/EP2 pathway is involved in the regulation of E-cadherin expression.17 Our study has come to similar conclusions using COX-2- transfected plasmid, agonist and antagonist. Overexpression of COX-2 and addition of PGE2 decreased E-cadherin protein levels. However, the expression of E-cadherin was up-regulated after inhibition of COX-2 or EP2 with celecoxib or AH6809, respectively. Moreover, it was evidenced by our experiment as well as others that COX-2 expression was correlated with PI3K-Akt and MAPK-ERK pathways.21–23 The phosphorylation levels of Akt and ERK were suppressed by celecoxib but were enhanced by COX-2 overexpression. By using EP2 agonist or antagonist, p-Akt and p-ERK were up-regulated by PGE2 but down-regulated by AH6809, suggesting both PI3K-Akt and MAPK-ERK pathways could be regulated by COX-2-PGE2-EP2. Besides, the phosphorylation of Akt and ERK are known to affect E-cadherin expression.45–48 Consistently, inhibition of PI3K-Akt or MAPK-ERK by MK2206 or AZD6244 treatments also did up-regulate E-cadherin. Hence, the results suggest that celecoxib up-regulated E-cadherin protein through inhibiting COX-2-PGE2-EP2-p-Akt/p-ERK signaling pathway to suppress HCC cells migration and invasion.
Akt and ERK1/2 pathways are well known for their indispensable roles in cell proliferation, pro-survival, invasion, and drug resistance of tumor cells, whose effects and key components are largely conserved.49–51 Since Akt and ERK are frequently mutated or hyperactivated, targeting these pathways have been thought as possible solutions to cancer therapy.52,53 Indeed, inhibitors against Akt and ERK have shown promising improvement in some tumor types. For example, MK-8353, an ERK1/2 inhibitor has been known to exhibit partial therapeutic effect against advanced BRAFV600-mutant melanoma.54 GDC-0068, also known as ipatasertib, a selective inhibitor of AKT, could lead to stable disease or incomplete response in many types of advanced solid tumors, such as colon, ovarian, prostate, breast, and lung cancer with activation of AKT signaling.55 Though the results were encouraging, these drugs are still undergoing early clinical study and their long-term effects should be carefully evaluated. Thus, to explore innovative approaches to inhibit these pathways might be needed. Also, an alternative is to discover new applications of an old drug in order to achieve this goal, which is more cost-effective. It seems that celecoxib might be one of the options. In the present study, we confirmed that the expressions of p-Akt and p-ERK were significantly suppressed after inhibition of COX-2 with celecoxib treatment, indicating these molecules may be involved in the regulation of aggressive biologic behaviors of tumor cells by COX-2. Based on these findings in in vitro study, we proposed the hypothesis that Akt/ERK pathway might be the common pathways targeted by celecoxib for its effect on HCC cell proliferation, apoptosis, migration, invasion, and metastasis. Further research is needed to clarify the exact regulatory mechanism in in vivo studies with conditional knock out models.
In conclusion, COX-2 expression was substantially up-regulated in human HCC tissues. High COX-2 expression was associated with advanced TNM stage, larger tumor size, increased lymphovascular invasion and poor survival. Targeting inhibition of COX-2 with celecoxib exhibited anti-tumor activities by suppressing proliferation, promoting apoptosis, and inhibiting the invasion of HCC cells. COX-2 may be a potential biomarker and therapeutic target in HCC. However, the anti-HCC effects of celecoxib in vivo need further investigated before clinical application.
Ethics approval and informed consent
Written informed consent forms for the tissue specimens were received from all participants, and the study was approved by the ethical committee of Taizhou Hospital of Zhejiang Province, which was the biobank center related hospital. Investigations were carried out following the rules of the Declaration of Helsinki of 1975 revised in 2008.
Abbreviation list
AA, arachidonic acid; AFP, α-fetoprotein; ATCC, American Type Culture Collection; COX-2, cyclooxygenase-2; DAB, 3ʹ-diaminobenzidine; DAPI 4′, 6-diamino-2-phenylindole; DMSO, dimethyl sulfoxide; EP2, prostaglandin E2 receptor 2; FBS, fetal bovine serum; FITC, fluorescein isothiocyanate; HCC, hepatocellular carcinoma; HRP, horseradish peroxidase; IF, immunofluorescence; IHC, immunohistochemistry; PBS, phosphate buffered saline; PGE2, prostaglandin E2; PI, propidium iodide; TMA, tissue microarray; TUNEL, terminal deoxynucleotidyl transferase dUTP nick end labelling.
Data sharing statement
The datasets generated during and/or analyzed during the current study are available from the corresponding author on reasonable request.
Acknowledgments
This work was supported by the National Natural Science Foundation of China under grant numbers 81670551, 81873584, and U1702281; Chinesisch-Deutsches Zentrum fṻr Wissenschaftsfὅrderung under grant number GZ 1065; National Key R&D Program of China under grant number 2017YFA0205400; and the Science and Technology Support Program of Sichuan province under grant number 2016SZ0041.
Disclosure
The authors report no conflict of interests in this work.
References
1. Torre LA, Bray F, Siegel RL, Ferlay J, Lortet-Tieulent J, Jemal A. Global cancer statistics, 2012. CA Cancer J Clin. 2015;65(2):87–108. doi:10.3322/caac.21262
2. Sia D, Villanueva A, Friedman SL, Llovet JM. Liver cancer cell of origin, molecular class, and effects on patient prognosis. Gastroenterology. 2017;152(4):745–761. doi:10.1053/j.gastro.2016.11.048
3. Llovet JM, Bru C, Bruix J. Prognosis of hepatocellular carcinoma: the BCLC staging classification. Semin Liver Dis. 1999;19(3):329–338. doi:10.1055/s-2007-1007122
4. Ding YF, Wu ZH, Wei YJ, Shu L, Peng YR. Hepatic inflammation-fibrosis-cancer axis in the rat hepatocellular carcinoma induced by diethylnitrosamine. J Cancer Res Clin Oncol. 2017;143(5):821–834. doi:10.1007/s00432-017-2364-z
5. Elsharkawy AM, Mann DA. Nuclear factor-kappaB and the hepatic inflammation-fibrosis-cancer axis. Hepatology. 2007;46(2):590–597. doi:10.1002/hep.21802
6. Salvado MD, Alfranca A, Haeggstrom JZ, Redondo JM. Prostanoids in tumor angiogenesis: therapeutic intervention beyond COX-2. Trends Mol Med. 2012;18(4):233–243. doi:10.1016/j.molmed.2012.02.002
7. Gao JH, Wen SL, Yang WJ, et al. Celecoxib ameliorates portal hypertension of the cirrhotic rats through the dual inhibitory effects on the intrahepatic fibrosis and angiogenesis. PLoS One. 2013;8(7):e69309. doi:10.1371/journal.pone.0069309
8. Tang SH, Gao JH, Wen SL, et al. Expression of cyclooxygenase-2 is correlated with lncRNA-COX-2 in cirrhotic mice induced by carbon tetrachloride. Mol Med Rep. 2017;15(4):1507–1512. doi:10.3892/mmr.2017.6161
9. Yang Y, Zhu J, Gou H, Cao D, Jiang M, Hou M. Clinical significance of COX-2, Survivin and BCL-2 expression in hepatocellular carcinoma (HCC). Med oncol. 2011;28(3):796–803. doi:10.1007/s12032-010-9519-y
10. Yang HJ, Jiang JH, Yang YT, et al. Cyclooxygenase-2 expression is associated with initiation of hepatocellular carcinoma, while prostaglandin receptor-1 expression predicts survival. World J Gastroenterol. 2016;22(39):8798–8805. doi:10.3748/wjg.v22.i39.8798
11. Schmitz KJ, Wohlschlaeger J, Lang H, et al. Cyclo-oxygenase-2 overexpression is a feature of early and well-differentiated hepatocellular carcinoma with a favourable prognosis. J Clin Pathol. 2009;62(8):690–693. doi:10.1136/jcp.2009.065888
12. Giannitrapani L, Ingrao S, Soresi M, et al. Cyclooxygenase-2 expression in chronic liver diseases and hepatocellular carcinoma: an immunohistochemical study. Ann N Y Acad Sci. 2009;1155:293–299. doi:10.1111/j.1749-6632.2009.03698.x
13. Xu L, Stevens J, Hilton MB, et al. COX-2 inhibition potentiates antiangiogenic cancer therapy and prevents metastasis in preclinical models. Sci Transl Med. 2014;6(242):242ra284. doi:10.1126/scitranslmed.3008455
14. Regulski M, Regulska K, Prukala W, Piotrowska H, Stanisz B, Murias M. COX-2 inhibitors: a novel strategy in the management of breast cancer. Drug Discov Today. 2016;21(4):598–615. doi:10.1016/j.drudis.2015.12.003
15. Gobel C, Breitenbuecher F, Kalkavan H, et al. Functional expression cloning identifies COX-2 as a suppressor of antigen-specific cancer immunity. Cell Death Dis. 2014;5:e1568. doi:10.1038/cddis.2014.531
16. Kurtova AV, Xiao J, Mo Q, et al. Blocking PGE2-induced tumour repopulation abrogates bladder cancer chemoresistance. Nature. 2015;517(7533):209–213. doi:10.1038/nature14034
17. Gao JH, Wen SL, Tong H, et al. Inhibition of cyclooxygenase-2 alleviates liver cirrhosis via improvement of the dysfunctional gut-liver axis in rats. Am J Physiol Gastrointest Liver Physiol. 2016;310(11):G962–G972. doi:10.1152/ajpgi.00428.2015
18. Gao JH, Wen SL, Feng S, et al. Celecoxib and octreotide synergistically ameliorate portal hypertension via inhibition of angiogenesis in cirrhotic rats. Angiogenesis. 2016;19(4):501–511. doi:10.1007/s10456-016-9522-9
19. Wen SL, Gao JH, Yang WJ, et al. Celecoxib attenuates hepatic cirrhosis through inhibition of epithelial-to-mesenchymal transition of hepatocytes. J Gastroenterol Hepatol. 2014;29(11):1932–1942. doi:10.1111/jgh.12641
20. Tong H, Wei B, Chen S, et al. Adjuvant celecoxib and lanreotide following transarterial chemoembolisation for unresectable hepatocellular carcinoma: a randomized pilot study. Oncotarget. 2017;8(29):48303–48312. doi:10.18632/oncotarget.15684
21. Wu T, Leng J, Han C, Demetris AJ. The cyclooxygenase-2 inhibitor celecoxib blocks phosphorylation of Akt and induces apoptosis in human cholangiocarcinoma cells. Mol Cancer Ther. 2004;3(3):299–307.
22. Leng J, Han C, Demetris AJ, Michalopoulos GK, Wu T. Cyclooxygenase-2 promotes hepatocellular carcinoma cell growth through Akt activation: evidence for Akt inhibition in celecoxib-induced apoptosis. Hepatology. 2003;38(3):756–768. doi:10.1053/jhep.2003.50380
23. Abiru S, Nakao K, Ichikawa T, et al. Aspirin and NS-398 inhibit hepatocyte growth factor-induced invasiveness of human hepatoma cells. Hepatology. 2002;35(5):1117–1124. doi:10.1053/jhep.2002.32676
24. Marengo A, Rosso C, Bugianesi E. Liver cancer: connections with obesity, fatty liver, and cirrhosis. Annu Rev Med. 2016;67:103–117. doi:10.1146/annurev-med-090514-013832
25. Chu TH, Chan HH, Kuo HM, et al. Celecoxib suppresses hepatoma stemness and progression by up-regulating PTEN. Oncotarget. 2014;5(6):1475–1490. doi:10.18632/oncotarget.1745
26. Breinig M, Schirmacher P, Kern MA. Cyclooxygenase-2 (COX-2)–a therapeutic target in liver cancer? Curr Pharm Des. 2007;13(32):3305–3315.
27. Campillo A, Solanas E, Morandeira MJ, et al. Angiogenesis and proliferation markers in adjacent cirrhotic tissue could predict hepatocellular carcinoma outcome after liver transplantation. Eur J Gastroenterol Hepatol. 2014;26(8):871–879. doi:10.1097/MEG.0000000000000131
28. He YF, Jin J, Wei W, et al. Overexpression of cyclooxygenase-2 in noncancerous liver tissue increases the postoperative recurrence of hepatocellular carcinoma in patients with hepatitis B virus-related cirrhosis. Can J Gastroenterol. 2010;24(7):435–440.
29. Mazzone PJ, Sears CR, Arenberg DA, et al. Evaluating molecular biomarkers for the early detection of lung cancer: when is a biomarker ready for clinical use? An Official American Thoracic Society Policy Statement. Am J Respir Crit Care Med. 2017;196(7):e15–e29. doi:10.1164/rccm.201708-1678ST
30. Sui W, Zhang Y, Wang Z, et al. Antitumor effect of a selective COX-2 inhibitor, celecoxib, may be attributed to angiogenesis inhibition through modulating the PTEN/PI3K/Akt/HIF-1 pathway in an H(2)(2) murine hepatocarcinoma model. Oncol Rep. 2014;31(5):2252–2260. doi:10.3892/or.2014.3093
31. Kern MA, Schoneweiss MM, Sahi D, et al. Cyclooxygenase-2 inhibitors suppress the growth of human hepatocellular carcinoma implants in nude mice. Carcinogenesis. 2004;25(7):1193–1199. doi:10.1093/carcin/bgh110
32. Cui W, Hu SX, Tang ZY, Hu KQ. In-vivo effects and mechanisms of celecoxib-reduced growth of cyclooxygenase-2 (COX-2)-expressing versus COX-2-deleted human HCC xenografts in nude mice. Anticancer Drugs. 2008;19(9):891–897. doi:10.1097/CAD.0b013e32830ef8ca
33. Bae SH, Jung ES, Park YM, et al. Expression of cyclooxygenase-2 (COX-2) in hepatocellular carcinoma and growth inhibition of hepatoma cell lines by a COX-2 inhibitor, NS-398. Clin Cancer Res. 2001;7(5):1410–1418.
34. Chen G, Li X, Yang J, et al. Prognostic significance of cyclooxygenase-2 expression in patients with hepatocellular carcinoma: a meta-analysis. Arch Med Sci. 2016;12(5):1110–1117. doi:10.5114/aoms.2016.61916
35. Yildirim Y, Ozyilkan O, Bilezikci B, Akcali Z, Haberal M. Lack of influence of cyclooxygenese-2 expression in hepatocellular carcinomas on patient survival. Asian Pac J Cancer Prev. 2008;9(2):295–298.
36. Makhdoumi P, Zarghi A, Daraei B, Karimi G. Evaluation of cytotoxicity effects of chalcone epoxide analogues as a selective COX-II inhibitor in the human liver carcinoma cell line. J Pharmacopuncture. 2017;20(3):207–212. doi:10.3831/KPI.2017.20.024
37. Li T, Zhong J, Dong X, et al. Meloxicam suppresses hepatocellular carcinoma cell proliferation and migration by targeting COX-2/PGE2-regulated activation of the beta-catenin signaling pathway. Oncol Rep. 2016;35(6):3614–3622. doi:10.3892/or.2016.4764
38. Li J, Chen X, Dong X, Xu Z, Jiang H, Sun X. Specific COX-2 inhibitor, meloxicam, suppresses proliferation and induces apoptosis in human HepG2 hepatocellular carcinoma cells. J Gastroenterol Hepatol. 2006;21(12):1814–1820. doi:10.1111/j.1440-1746.2006.04366.x
39. Baek JY, Hur W, Wang JS, Bae SH, Yoon SK. Selective COX-2 inhibitor, NS-398, suppresses cellular proliferation in human hepatocellular carcinoma cell lines via cell cycle arrest. World J Gastroenterol. 2007;13(8):1175–1181.
40. Park MK, Hwang SY, Kim JO, et al. NS398 inhibits the growth of Hep3B human hepatocellular carcinoma cells via caspase-independent apoptosis. Mol Cells. 2004;17(1):45–50.
41. Wang G, Li J, Zhang L, Huang S, Zhao X, Zhao X. Celecoxib induced apoptosis against different breast cancer cell lines by down-regulated NF-kappaB pathway. Biochem Biophys Res Commun. 2017;490(3):969–976. doi:10.1016/j.bbrc.2017.06.148
42. Kang KB, Zhu C, Yong SK, Gao Q, Wong MC. Enhanced sensitivity of celecoxib in human glioblastoma cells: induction of DNA damage leading to p53-dependent G1 cell cycle arrest and autophagy. Mol Cancer. 2009;8:66. doi:10.1186/1476-4598-8-66
43. Fransvea E, Angelotti U, Antonaci S, Giannelli G. Blocking transforming growth factor-beta up-regulates E-cadherin and reduces migration and invasion of hepatocellular carcinoma cells. Hepatology. 2008;47(5):1557–1566. doi:10.1002/hep.22201
44. Zhou L, Wang DS, Li QJ, Sun W, Zhang Y, Dou KF. The down-regulation of Notch1 inhibits the invasion and migration of hepatocellular carcinoma cells by inactivating the cyclooxygenase-2/Snail/E-cadherin pathway in vitro. Dig Dis Sci. 2013;58(4):1016–1025. doi:10.1007/s10620-012-2434-7
45. Tashiro E, Henmi S, Odake H, Ino S, Imoto M. Involvement of the MEK/ERK pathway in EGF-induced E-cadherin down-regulation. Biochem Biophys Res Commun. 2016;477(4):801–806. doi:10.1016/j.bbrc.2016.06.138
46. Fung TM, Ng KY, Tong M, et al. Neuropilin-2 promotes tumourigenicity and metastasis in oesophageal squamous cell carcinoma through ERK-MAPK-ETV4-MMP-E-cadherin deregulation. J Pathol. 2016;239(3):309–319. doi:10.1002/path.4728
47. Barber AG, Castillo-Martin M, Bonal DM, et al. PI3K/AKT pathway regulates E-cadherin and Desmoglein 2 in aggressive prostate cancer. Cancer Med. 2015;4(8):1258–1271. doi:10.1002/cam4.463
48. Lau MT, Leung PC. The PI3K/Akt/mTOR signaling pathway mediates insulin-like growth factor 1-induced E-cadherin down-regulation and cell proliferation in ovarian cancer cells. Cancer Lett. 2012;326(2):191–198. doi:10.1016/j.canlet.2012.08.016
49. Adlung L, Kar S, Wagner MC, et al. Protein abundance of AKT and ERK pathway components governs cell type-specific regulation of proliferation. Mol Syst Biol. 2017;13(1):904. doi:10.15252/msb.20167258
50. Sze KM, Wong KL, Chu GK, Lee JM, Yau TO, Ng IO. Loss of phosphatase and tensin homolog enhances cell invasion and migration through AKT/Sp-1 transcription factor/matrix metalloproteinase 2 activation in hepatocellular carcinoma and has clinicopathologic significance. Hepatology. 2011;53(5):1558–1569. doi:10.1002/hep.24232
51. Shin S, Dimitri CA, Yoon SO, Dowdle W, Blenis J. ERK2 but not ERK1 induces epithelial-to-mesenchymal transformation via DEF motif-dependent signaling events. Mol Cell. 2010;38(1):114–127. doi:10.1016/j.molcel.2010.02.020
52. Mayer IA, Arteaga CL. The PI3K/AKT Pathway as a Target for Cancer Treatment. Annu Rev Med. 2016;67:11–28. doi:10.1146/annurev-med-062913-051343
53. Samatar AA, Poulikakos PI. Targeting RAS-ERK signalling in cancer: promises and challenges. Nat Rev Drug Discov. 2014;13(12):928–942. doi:10.1038/nrd4281
54. Moschos SJ, Sullivan RJ, Hwu WJ, et al. Development of MK-8353, an orally administered ERK1/2 inhibitor, in patients with advanced solid tumors. JCI Insight. 2018;3(4). doi:10.1172/jci.insight.92352
55. Saura C, Roda D, Rosello S, et al. A first-in-human phase i study of the ATP-competitive AKT inhibitor ipatasertib demonstrates robust and safe targeting of AKT in patients with solid tumors. Cancer Discov. 2017;7(1):102–113. doi:10.1158/2159-8290.CD-16-0512
56. Gao JH, Wang CH, Tong H, Wen SL, Huang ZY, Tang CW. Targeting inhibition of extracellular signal-regulated kinase kinase pathway with AZD6244 (ARRY-142886) suppresses growth and angiogenesis of gastric cancer. Sci Rep. 2015;5:16382. doi:10.1038/srep16382
Supplementary materials
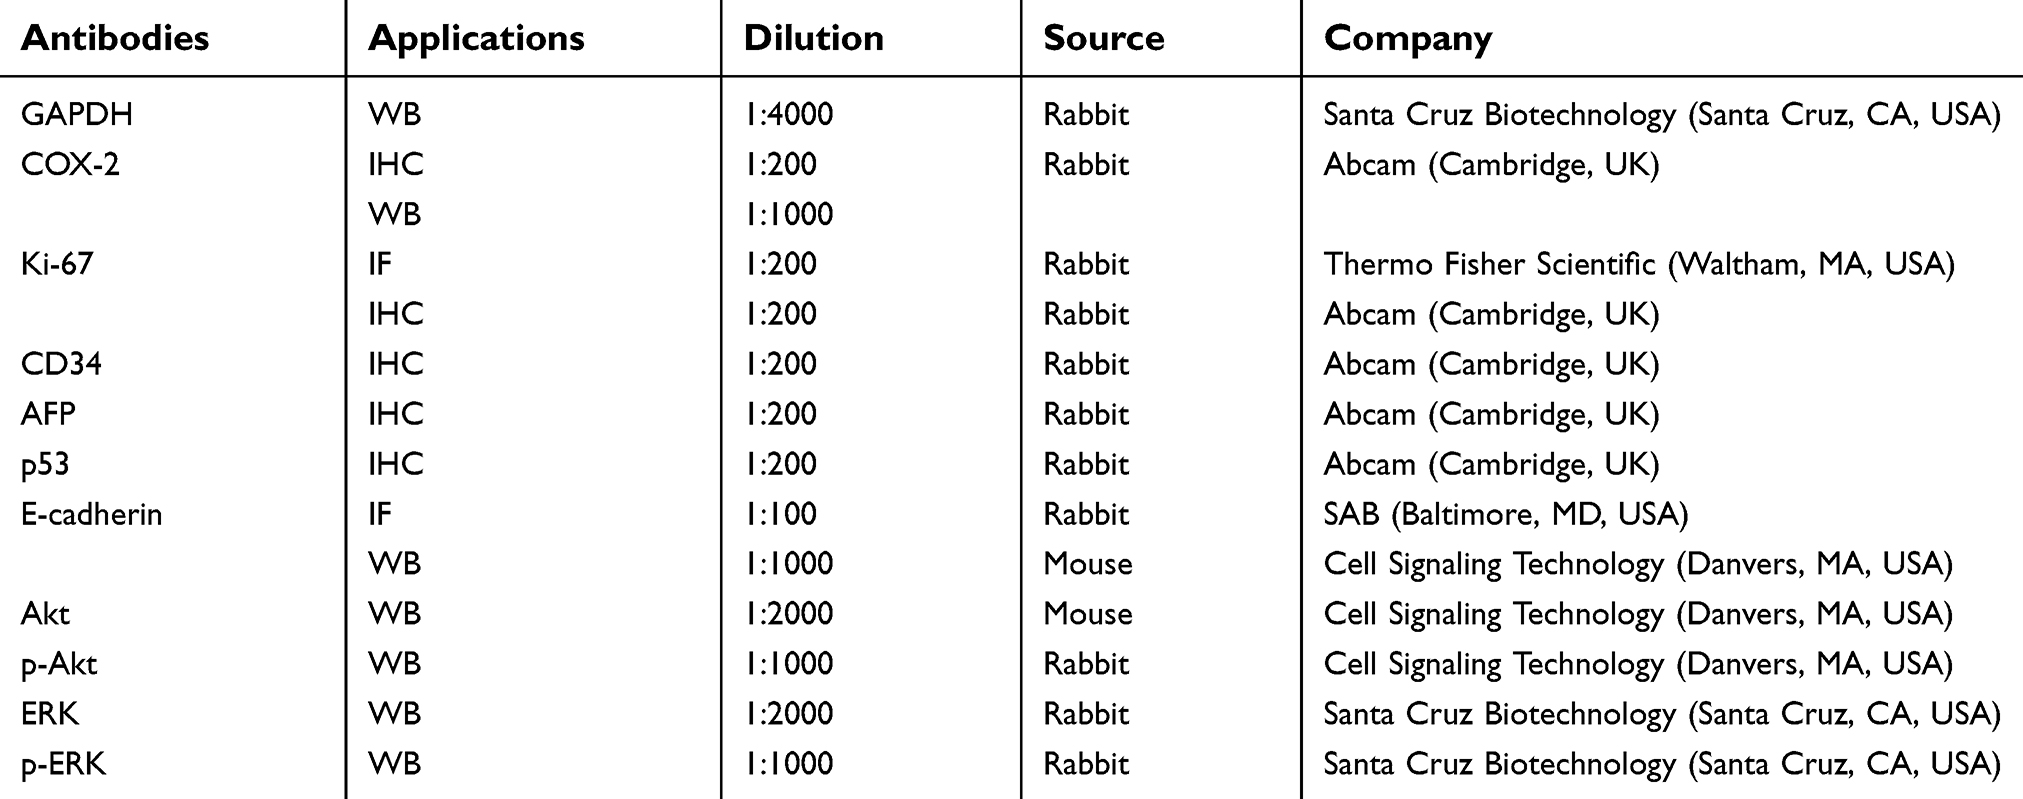 | Table S1 The antibody list for immunohistochemistry, immunofluorescence, and Western blot |
 © 2019 The Author(s). This work is published and licensed by Dove Medical Press Limited. The full terms of this license are available at https://www.dovepress.com/terms.php and incorporate the Creative Commons Attribution - Non Commercial (unported, v3.0) License.
By accessing the work you hereby accept the Terms. Non-commercial uses of the work are permitted without any further permission from Dove Medical Press Limited, provided the work is properly attributed. For permission for commercial use of this work, please see paragraphs 4.2 and 5 of our Terms.
© 2019 The Author(s). This work is published and licensed by Dove Medical Press Limited. The full terms of this license are available at https://www.dovepress.com/terms.php and incorporate the Creative Commons Attribution - Non Commercial (unported, v3.0) License.
By accessing the work you hereby accept the Terms. Non-commercial uses of the work are permitted without any further permission from Dove Medical Press Limited, provided the work is properly attributed. For permission for commercial use of this work, please see paragraphs 4.2 and 5 of our Terms.