")
Back to Journals » Integrated Pharmacy Research and Practice » Volume 9
Supply Chain Management Performance of HIV/AIDS Commodities and Factors Affecting It at Health Facilities of SNNPRS of Ethiopia; from the Perspective of Achieving 90-90-90 Strategies
Authors Damtie TA , Ibrahim AJ , Yikna BB
Received 21 August 2019
Accepted for publication 27 December 2019
Published 10 January 2020 Volume 2020:9 Pages 11—21
DOI https://doi.org/10.2147/IPRP.S228162
Checked for plagiarism Yes
Review by Single anonymous peer review
Peer reviewer comments 2
Editor who approved publication: Professor Jonathan Ling
Teklewold Abiye Damtie, 1 Awol Jemal Ibrahim, 2 Berhan Begashaw Yikna 3
1Department of Pharmacy, Arba Minch College of Health Science, Arba Minch, Ethiopia; 2School of Pharmacy, Faculty of Health Science, Jimma University, Jimma, Ethiopia; 3Department of Pharmacology, School of Pharmacy, College of Medicine, Debre Berhan University, Debre Berhan, Ethiopia
Correspondence: Berhan Begashaw Yikna Email [email protected]
Background: Health facilities (HFs) need an extensive range of antiretroviral (ARV) drugs and related HIV/AIDS commodities for diagnosis, prevention, and treatment of HIV/AIDS. This study was aimed to assess supply chain management performance from the perspective of achieving 90-90-90 treatment strategy at HFs of Southern Nations, Nationalities and People’s Regional State (SNNPRS), Ethiopia.
Methods: Facilities based cross sectional study design in 30 HFs (9 hospitals and 21 health centers) and five pharmaceuticals fund and supply agencies (PFSAs) was conducted. The HFs were selected randomly. Semi-structured questionnaires and observation checklists with logistic indicators assessment tools (LIATs) were used to collect data for HIV/AIDS related services from November 2016 to May 2017. In addition, we used in-depth face to face interview and thematic approach. Quantitative data were entered into Epi-Data version 3.1 and transported to SPSS version 20 to analyze the result. Qualitative data were analyzed using thematic approach.
Results: Only 9 (30%) HFs had received their orders from PFSA on time from date of report. Average lead time for ARV drugs was 46.4 days in hospitals and 59.2 days in health centers (HCs). Sixteen (60.7%) HFs reported their completed report and requisition format (RRF). From this, 53.3% HFs order was refilled correctly in quantity from that they need. Inventory accuracy rate was 77%. Major HFs, 20 (66.7%) faced at least one-time emergency order for ARV drugs, HIV test kits and viral load (VL) supplies. Whereas, 9 (30%) hospitals and 5 (16.67%) HCs were out of stock two and three times respectively. Sixteen (53.3%) commodities stocked out at least once in six months. Nevirapine (NVP) 10 mg/5 mL in 240 mL was the most stocked out (13 times) for an average 22 days. Uni gold was stocked out (16 times) with average of 34.5 days. Wastage rate was 2.5%. Twenty-five (83.3%) facilities had good storage conditions (> 80% to the standard).
Conclusion: Unsatisfactory data records, stock-outs, interrupted reports, inaccurate inventory and wastage rates were indicators for defective supply chain management of HIV/AIDS commodities. Respective organizations should improve their responsible activities to secure commodities availability.
Keywords: HIV/AIDS, supply chain management, Ethiopia
Background
Human Immunodeficiency Virus/Acquired Immune Deficiency Syndrome (HIV/AIDS) continues to be a major global public health issue. In 2015, an estimated 36.7 million people were living with HIV/AIDS. Since the start of the epidemic, an estimated 78 million people have become infected with HIV and 39 million people have died of HIV/AIDS-related illnesses. Around 40% of all people living with HIV/AIDS do not know that they have the virus. The coverage of antiretroviral therapy (ART) is around 60%.1,2
Sub-Saharan Africa is the world’s severely affected region. It constitutes about two thirds of the total number of people living with HIV/AIDS globally. Ethiopia, Kenya, Malawi, Mozambique, Nigeria, South Africa, Uganda, United Republic of Tanzania, Zambia and Zimbabwe account for 81% of people living with HIV in the region. Nigeria and South Africa account for half of this figure.1–3 In 2014, United Nations Programs on HIV/AIDS (UNAIDS) proposed ambitious new targets to accelerate the HIV treatment scale-up in low- and middle-income countries. The targets described as “90-90-90”, proposes that 90% of all people living with HIV will know their HIV status, 90% of all people with diagnosed HIV infection will receive sustained ART and 90% of all people receiving ART will have viral suppression by 2020. Unimaginable a decade ago, the prospect of an AIDS-free world may finally be within reach by 2030.2,4
To cope up this plan, the world requires a reliable supply of greater volumes of HIV/AIDS products to achieve the scale globally targeted. Both multisectorial and multiprogrammatic actions should be taken with a variety of programs that address prevention, treatment and care. These programs require continual supplies of different condoms, ART, viral load monitoring (VLM) reagents and HIV testing kits.5,6 Supply chain management encompasses the planning, coordination and collaboration of staffs for all logistics management activities such as quantification, procurement, inventory management, transportation, data collection, and reporting.7 Supply chain activity needs to be controlled by making the supply chain transparent and measurable for performance improvements.8 In Ethiopia, Pharmaceuticals Fund and Supply Agency (PFSA) is a legal entity established under the law of Federal Democratic Republic of Ethiopian Government to overcome the problems and assure uninterrupted supply of pharmaceuticals to the public in September 2007.
Generally, performance measurement is the process of quantifying and comparing the efficiency and effectiveness of action with pre-seated goals by known standards. When analyzing the performance of the system, qualitative evaluations such as good, fair, adequate and poor are vague and difficult to utilize in any meaningful way. As a result, quantitative performance measures are often preferred to such qualitative evaluations. A numerical performance measure might be utilized, because the data are readily available or it has been used for a long time based on logistic activities.9
Although, it has been over a decade since ART became accessible in resource-limited countries, most health information systems are still lagging, making it difficult to produce useful forecasts.10 According to the research conducted in Addis Ababa, 84.2% of the health centers (HCs) have one or more emergency order whereas all hospitals have emergency order of ARV drugs more than three times in the past six months which indicates supply chain management performance unmet.11 In relation to stock control and record-keeping, the study done in East Shewa Zone shows that average updating practice and inventory accuracy are 59.5% and 28.5% respectively.12 Almost similar findings in Addis Ababa shows that only 61.5% of health facilities (HFs) update their bin cards regularly.13 Ethiopia national survey also revealed that the percentage of facilities filled with the quantities ordered are about 60% with correct product 37% at both the hospitals and HCs level.14
Another study conducted in Addis Ababa, 60.5% of HFs reported that they usually run out of at least one ART monitoring product before resupply and 37.2% have stock out at the time of visit for at least one laboratory commodity.15 Interruption of supplies and ARV drugs put an individual patient at risk of drug resistance development, disease progression, death, and diminishes the credibility of ART program in the eyes of patients, community, healthcare providers and generally puts the public health in danger.11 For public HFs of Ethiopia, in the case of Southern Nations, Nationalities and People’s Regional States (SNNPRS), challenges of performance of HIV/AIDS commodities supply chain management such as stock out, occurrence of emergency orders, storage conditions, stock management, order fill rate, and wastage rates are not well known. There were no studies done before on performance and challenges of HIV/AIDS commodities supply chain management at HFs of SNNPRS. Therefore, this study aimed to assess level of performance of supply chain management of HIV/AIDS commodities and associated factors from the perspective of 90-90-90 treatment strategic plan by using different indicators (Figure 1) through the system like order fill rate, lead time, frequency of emergency order, Logistic Management Information System (LMIS) data quality, stock out rate, inventory accuracy rate, wastage rates and storage conditions of HFs. The findings from this study will help to formulate strategic plans that could help to minimize these problems so as to ensure constant and uninterrupted supply of HIV/AIDS commodities at the public HFs. The findings are also expected to be much more significant to health facility managers, regional health bureau, PFSA, donors and program supporting groups through planning for on-the-job training of health workers.
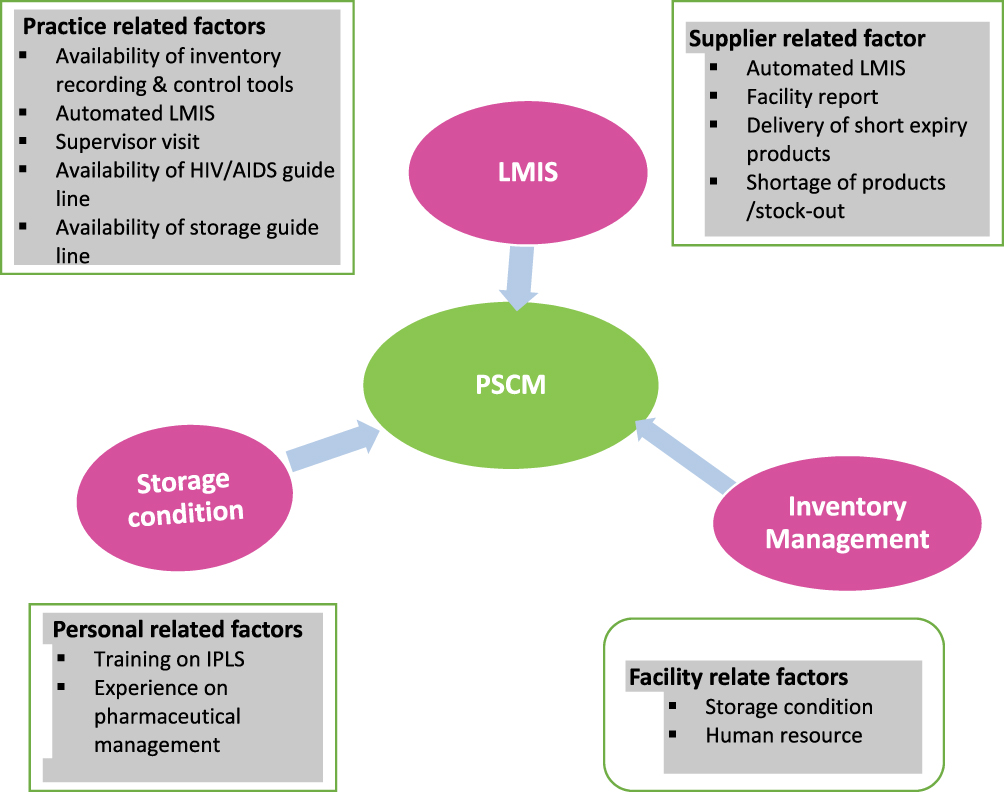 |
Figure 1 Conceptual framework of the study. |
Methods and Materials
Study Area
The study was conducted at selected HFs in SNNPRS of Ethiopia. The region’s population is estimated more than 15 million and its administrative city is Hawassa. It has 60 hospitals and 784 HCs. Among HFs, 56 hospitals and 133 HCs are providing ART, Prevention of Mother to Child Transmission (PMTCT), Voluntary Counseling and Testing (VCT) services. Four PFSA branches are providing commodities for SNNPRS.14
Study Population
Thirty HFs providing VCT, PMTCT and ART services, health professionals working in ART clinics, pharmacy and laboratory units involved in the management of HIV/AIDS commodities, 20 ARV drugs, five HIV test kits, five VL supplies, one central PFSA, four PFSA hubs, two VL monitoring sites, logistic records and reports in the facilities were the study population.
Study Design
Health facilities based cross-sectional and explorative study designs were used for quantitative and qualitative data collection respectively. For quantitative study, sample size of HFs based on Logistic Indicators Assessment Tool (LIAT) suggested taking 15% of the HFs.16 So, (189⨰15% =28.35) plus 5% none respondents or absence during data collection time (28.35⨰5% =1.5). Therefore, 30 HFs, 4 PFSA hubs, one central PFSA and two VL monitoring sites were selected by random sampling technique. For qualitative data; heads of pharmacy, three central PFSA directorates and two coordinators from PFSA hubs and VL monitoring sites were interviewed purposively based on their experience and position in the organization. Data collection instrument was developed from LIAT.16,17,18 Then, 20 ARV drugs, five HIV test kits and five VL supplies were included from November 2016 to May 2017 bin cards and RRF reports. Open-ended and closed semi-structured questionnaire face-to-face interview with key informants with some probes were used for qualitative data collection.
Data Entry and Analysis
The quantitative data were entered into Epi-data version 3.1 and used SPSS version 20 (IBM Corporation, Armonk, NY, USA) software. Descriptive statistics and advanced statistical analysis by chi-squared and Spearman correlation test were used. Qualitative data were analyzed based on coding the thematic area.
Data Quality Assurance
We have given training for data collectors. Data collection tools were pretested. TA discussed with AJ and BB on regular activities and reviewed tools for completeness. Quality assurance of qualitative data was done by conceptual framework by TA. AJ and BB supervised overall activities.
Ethical Considerations
Ethical approval was obtained from the Ethics Review Board of Institute of Health, Jimma University (Ref.No.IHRPGC/797/207). Both written and verbal consent from respondents was obtained prior to conducting the study. Participants were assured about confidentiality. Personal identifiers were not used to ensure the anonymity of respondents. The authors confirm that the study was carried out in accordance with the principles of the Declaration of Helsinki.
Results
Sociodemography of HFs
From HFs, 36 store managers were involving in managing HIV/AIDS commodities. Among HFs, 28 (93.7%) had obtained supportive supervision. Store managers, 26 (72.2%) and 29 (80.6%) were dissatisfied in their current job and had not participated in training on storage for new commodities incorporated to the system (Table 1).
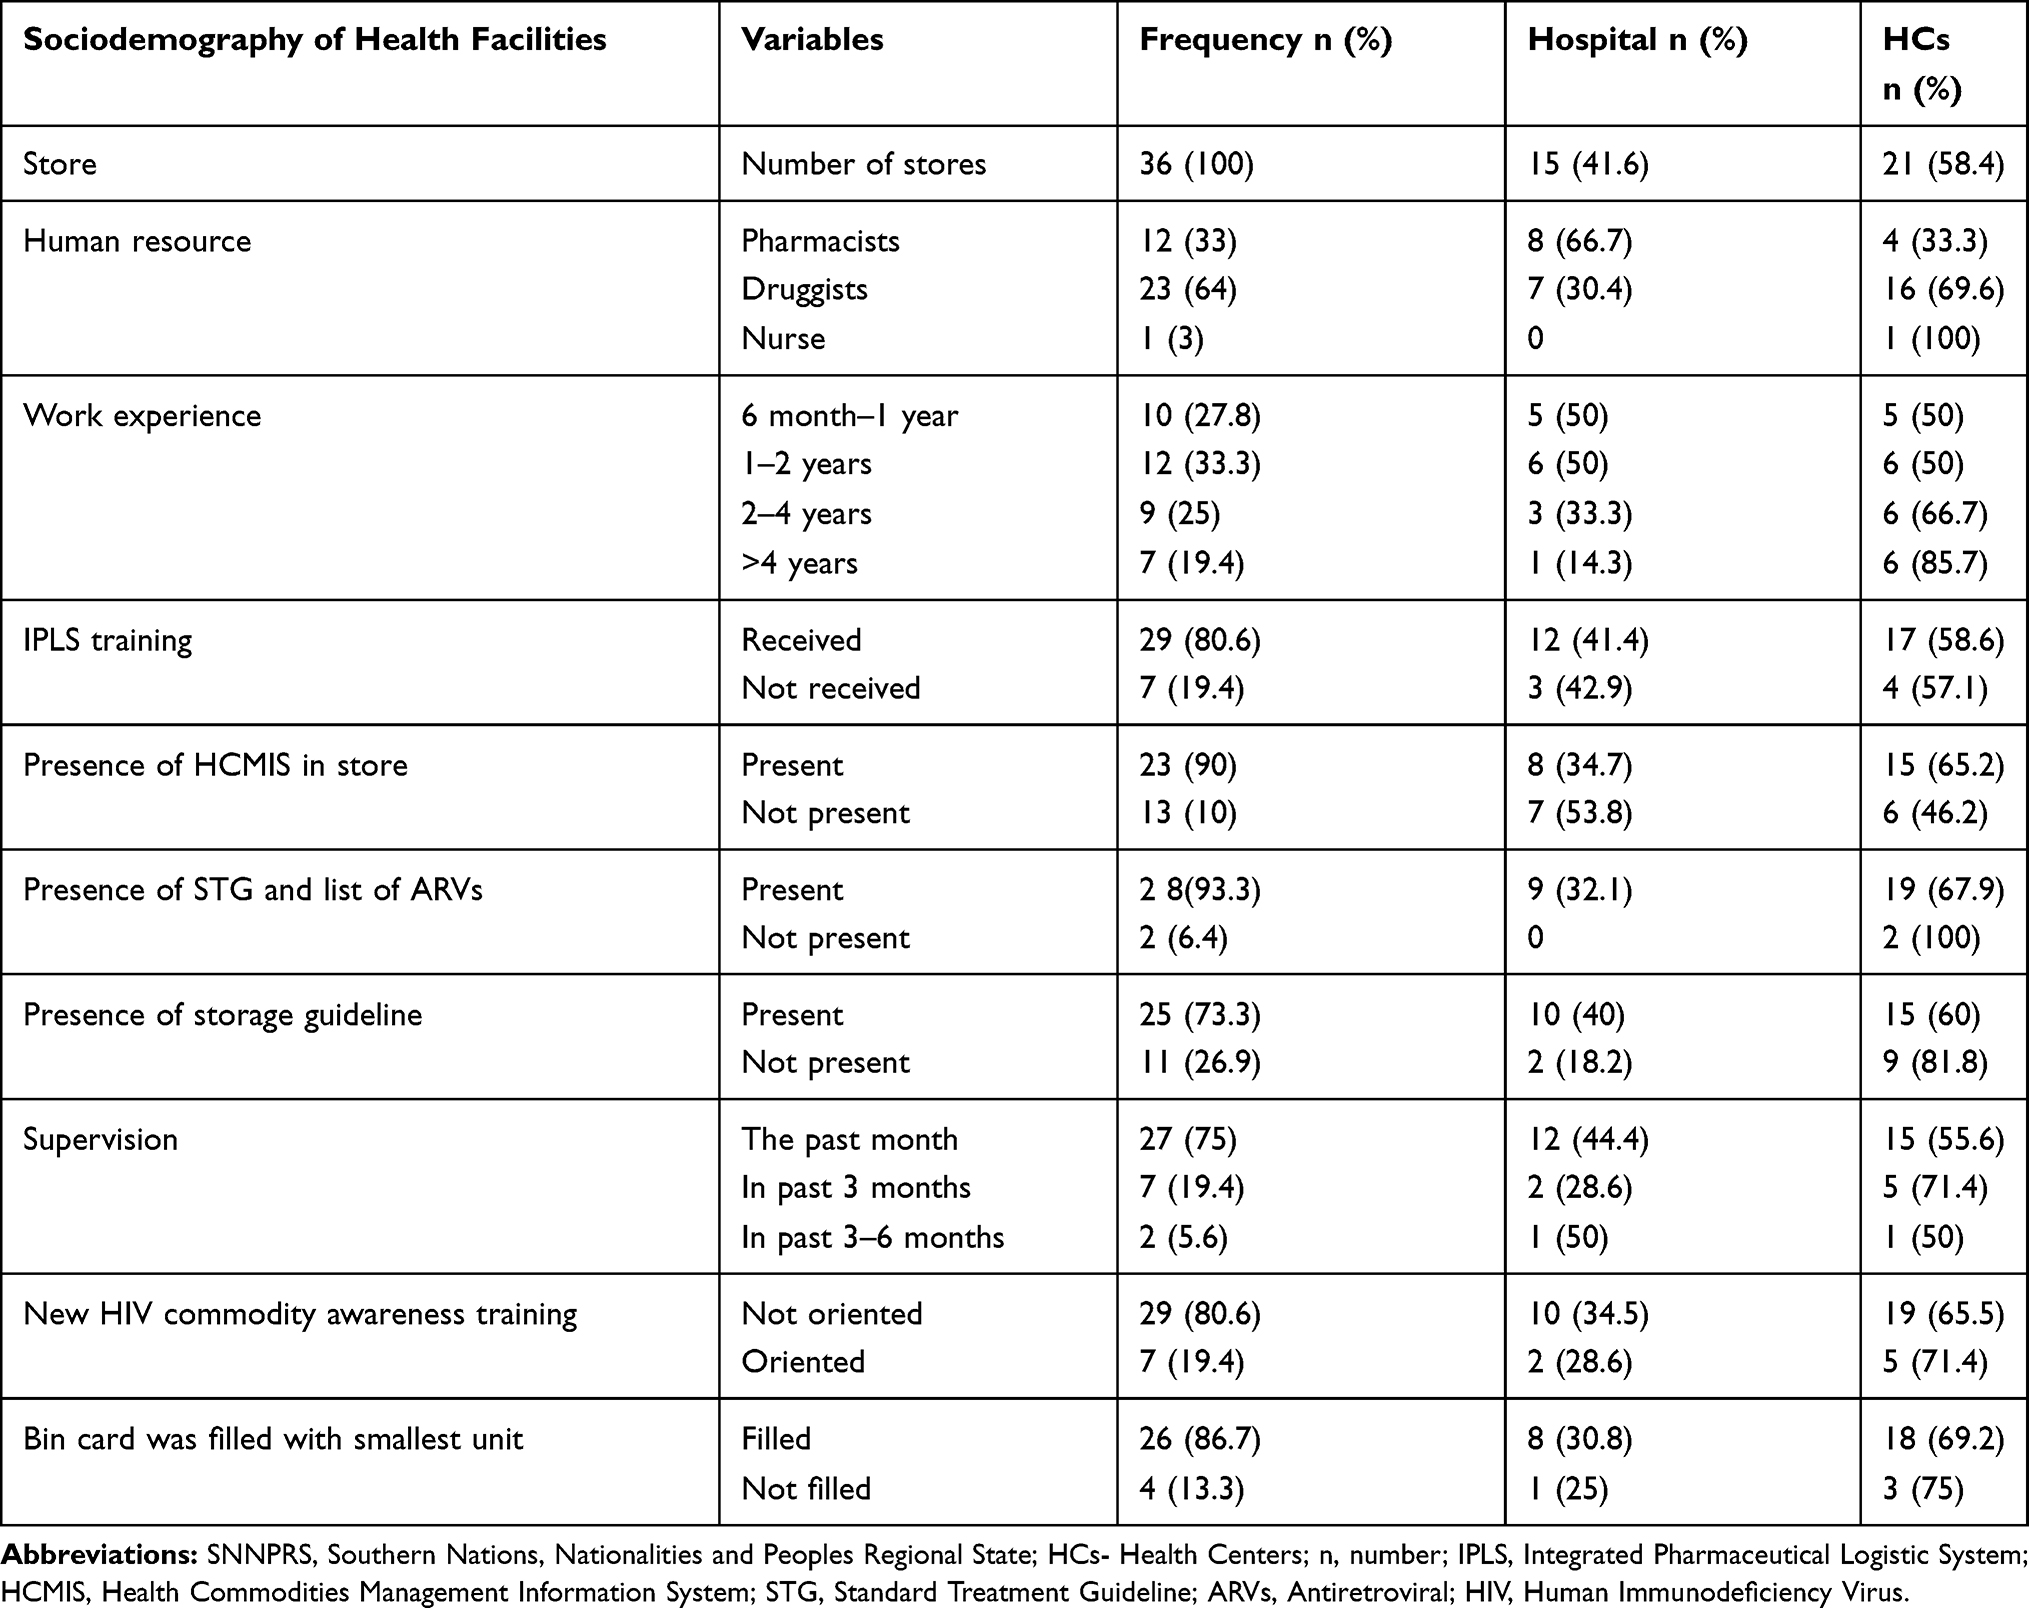 |
Table 1 Sociodemography and Infrastructure of the Selected Health Facilities of SNNPRS, May, 2017 |
Stock Status and Performance of PFSA
Three PFSA hubs and central PFSA faced at least one stock out. Only 9(30%) HFs received orders from their date of report. Average lead time for ARV drugs was 46.4 days at hospitals and 59.2 days at HCs. Sixteen (53.3%) facilities orders were refilled properly. Sixteen (44.4%) and 14 (38.9%) commodities were refilled insufficiently and near expiry respectively (Table 2).
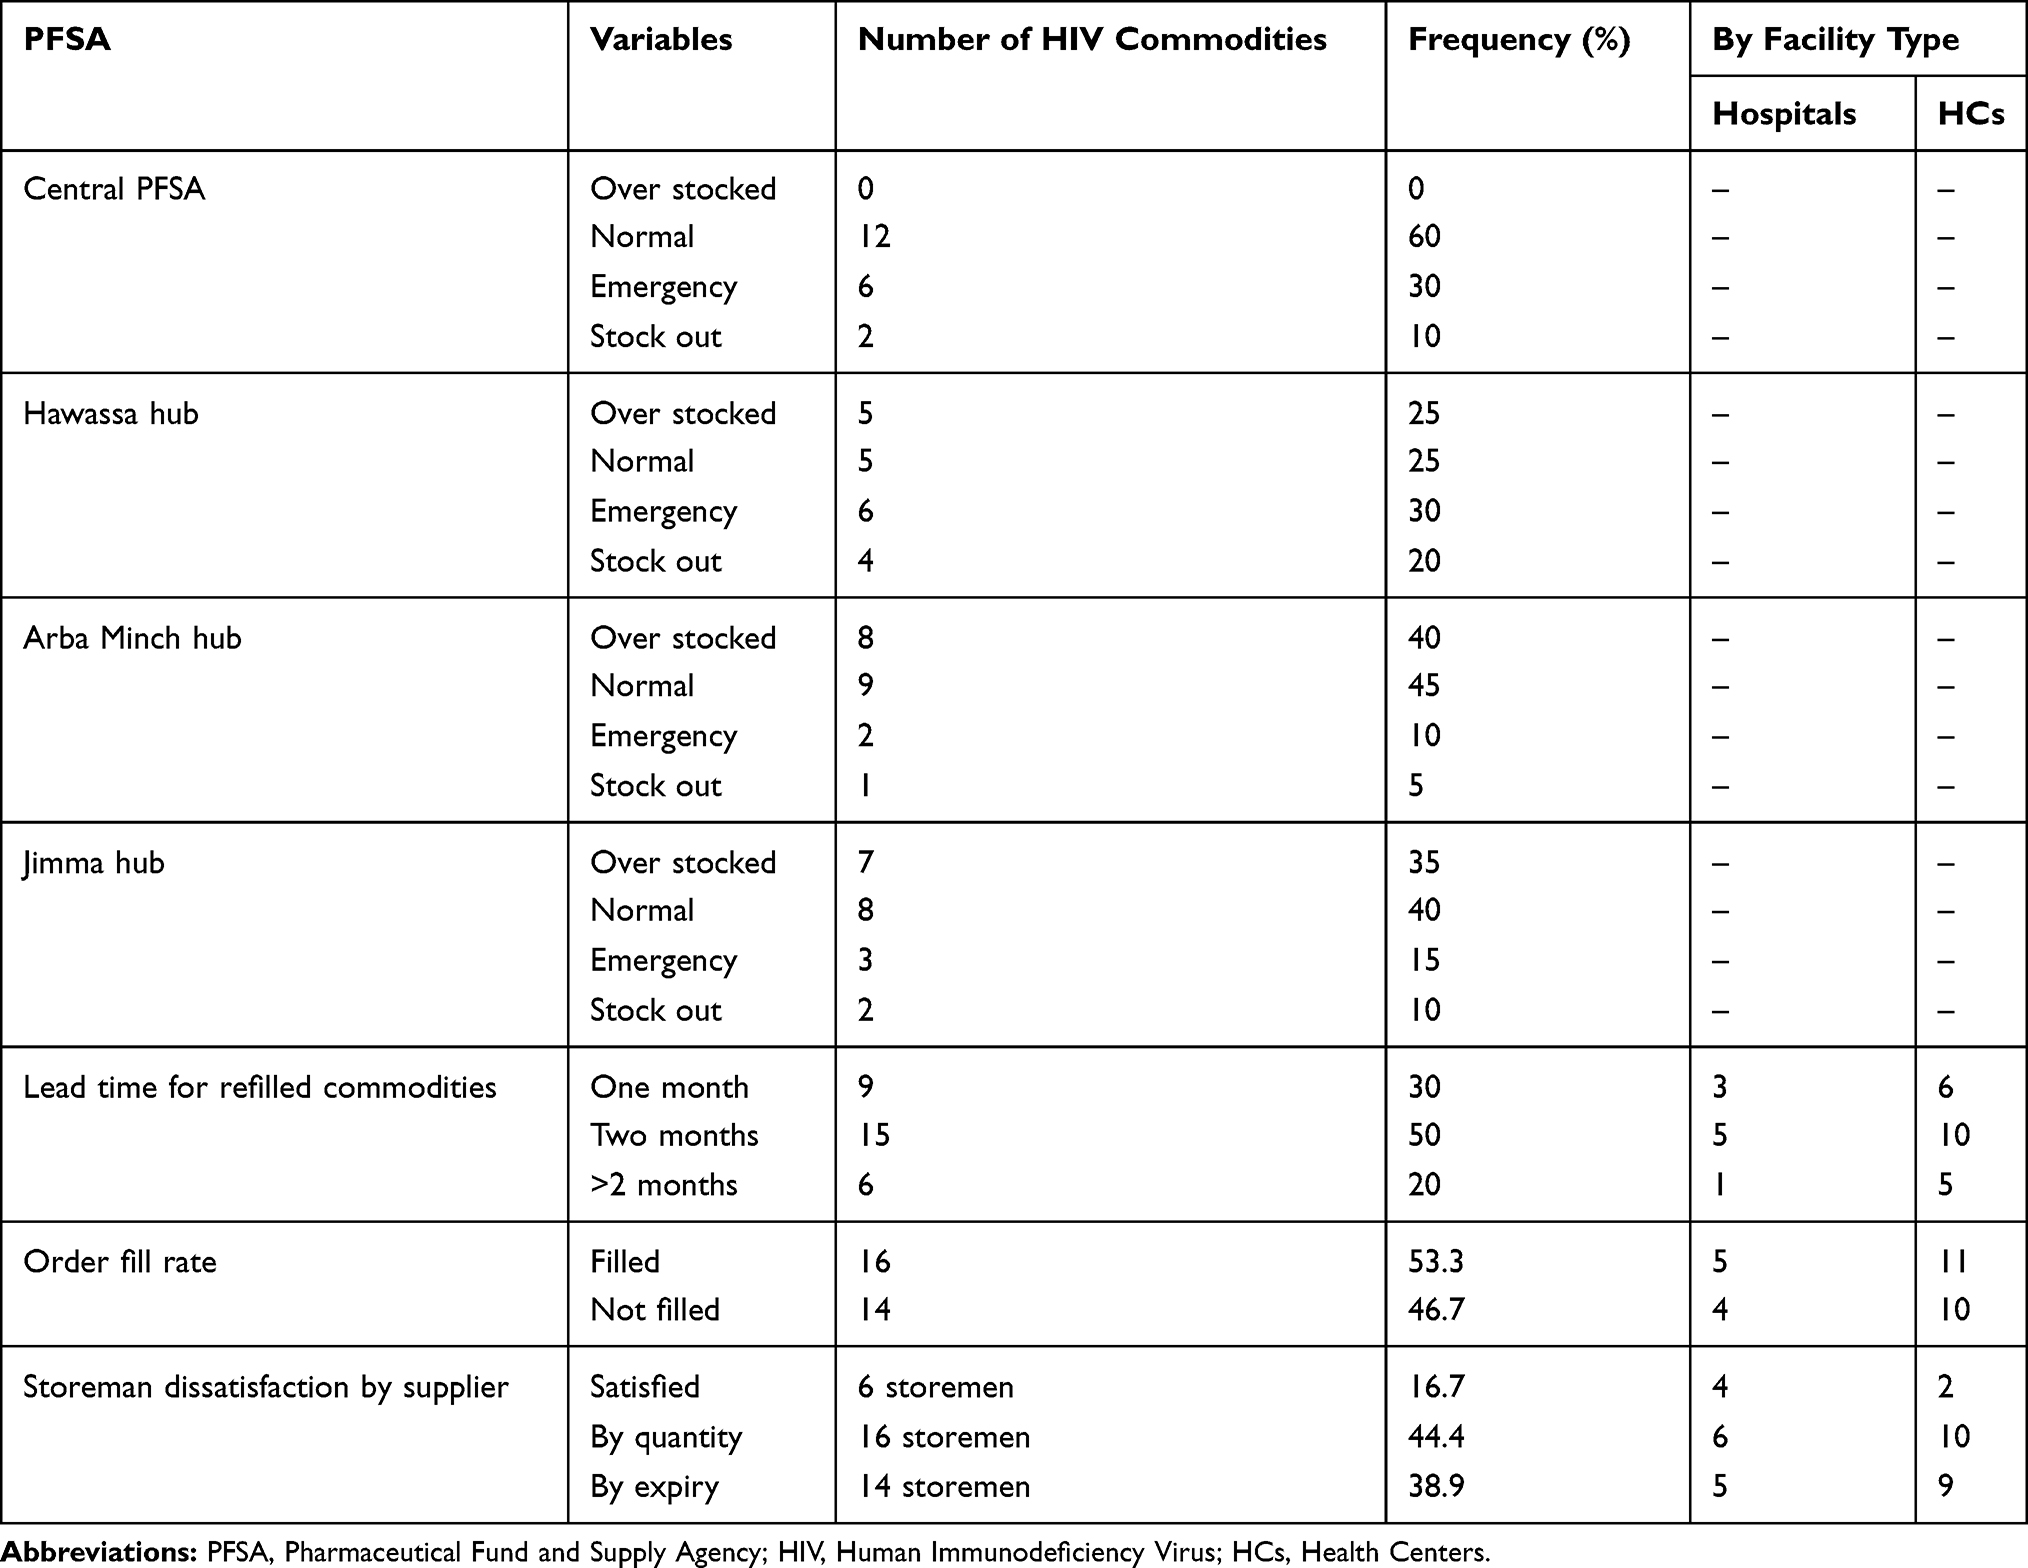 |
Table 2 Stock Status and Performance of Three PFSA Hubs and Central PFSA, May, 2017 |
Availability and Update of Recording Tools
Average availability of bin card was 86.1% at HFs; 81.3% hospitals and 88.8% HCs of them were updated. Unavailability and defective updating performance were observed for LPV/r (100+25) mg in hospitals (75%) and EFV 50 mg in HCs (77.8%) as shown in Table 3. Availability of bin card for HIV test kits and VL supplies was 96.8% in hospitals and 80.8% in HCs and 90.3% and 86.1% of bin cards were updated respectively. Updating practices showed significant association with work experiences, IPLS training and job satisfaction (P <0.05). Strength of linear relationship among bin card update, IPLS training and job satisfaction was positive moderate correlation(r=0.472, P <0.020 and 0.034) but with experience and qualification there was weak correlation (r=0.381, P <0.038 and r=0.392, P <0.029) as indicated in Table 4.
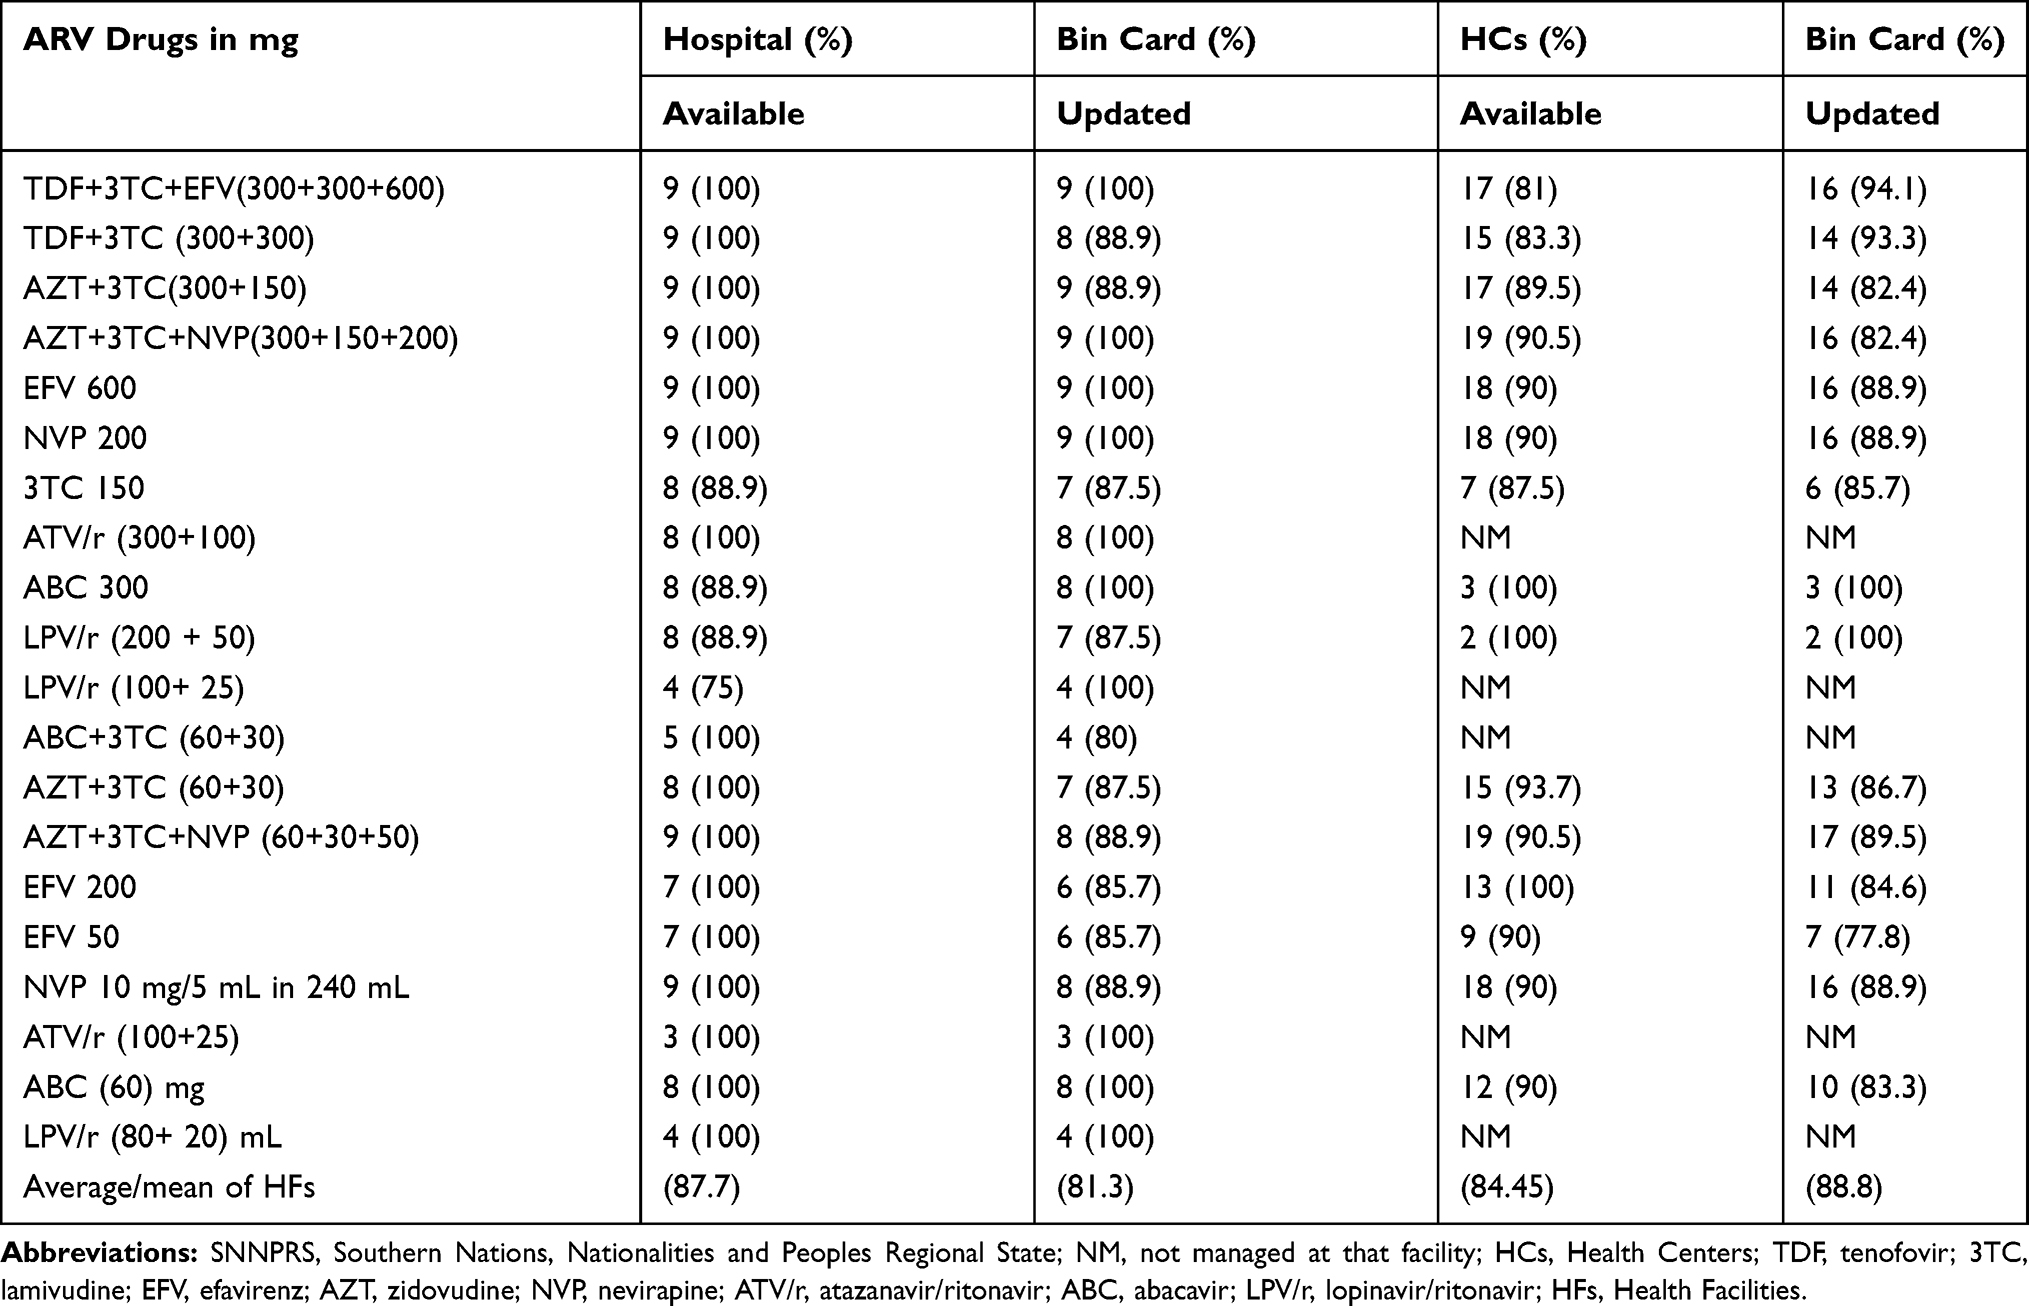 |
Table 3 Bin Card Availability and Updating Practices of ARV Drugs at Health Facilities of SNNPRS, May, 2017 |
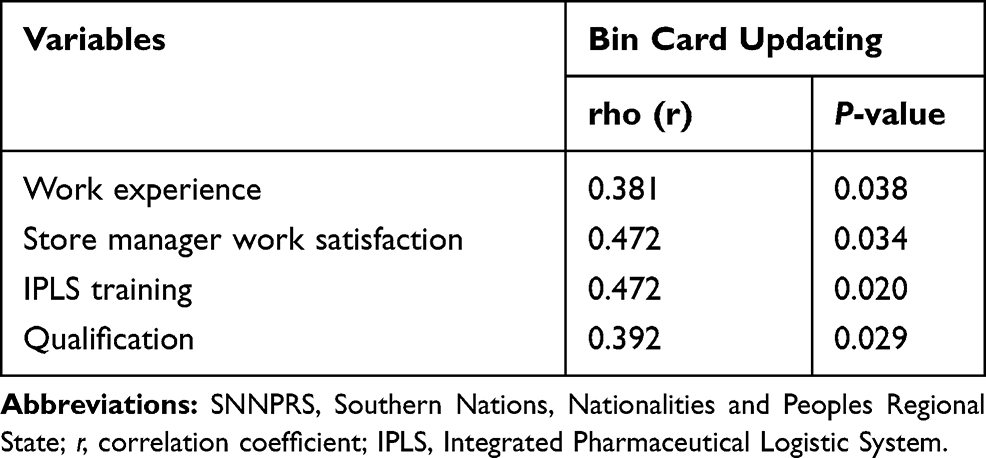 |
Table 4 Association of Bin Card Updating Practices and Contributing Factors at Health Facilities of SNNPRS, May, 2017 |
Report and Requisition Format (RRF) Data Quality
Among HFs; 17 (56.7%) of them sent RRF on time, 8 (26.7%) sent out of reporting time and 5 (16.7%) did not send at all. Five (62.5%) hospitals and 10 (58.8%) HCs sent complete RRF (Figure 2). RRF data quality showed significant association with IPLS training and HCMIS use (P<0.05). Quality and IPLS training or use of HCMIS was positive moderate correlation (r=0.449, P<0.013 and 0.472, P<0.008) respectively.
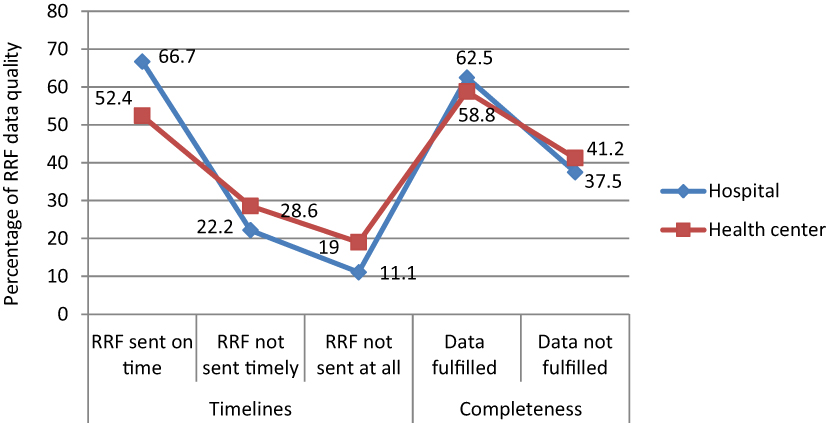 |
Figure 2 Percentage of RRF data quality of health facilities of SNNPR, May, 2017. |
Inventory Accuracy Rate
Among assessed HFs, 23 (76.7%) properly filled their bin cards with stock on hand and reported RRFs. Pearson chi-squared test evidenced that inventory accuracy rate showed significant association with storeman dissatisfaction (P <0.008) and supportive supervision (P<0.035).
Emergency Order of HIV/AIDS Commodities
Majority of the HFs, 20 (66.7%) had at least one-time emergency order in past six months for ARV drugs, test kits and VL supplies (Figure 3). Frequency of emergency order had significant association (P<0.05) with HCMIS software update, length of lead time and on time report. Strength of association between frequency of emergency order and lead time or HCMIS software update was positively weak (r=0.372, 0.39, P<0.043 and 0.031). Relationship between frequency of emergency order and on time report had negatively week association (r=−0.382, P<0.037) as shown in Table 5.
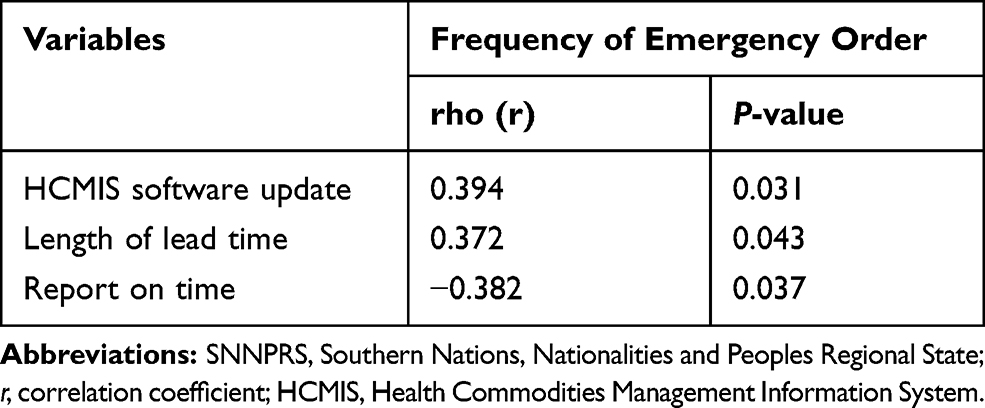 |
Table 5 Association of Frequency of Emergency Order and Contributing Factors at Health Facilities of SNNPRS, May, 2017 |
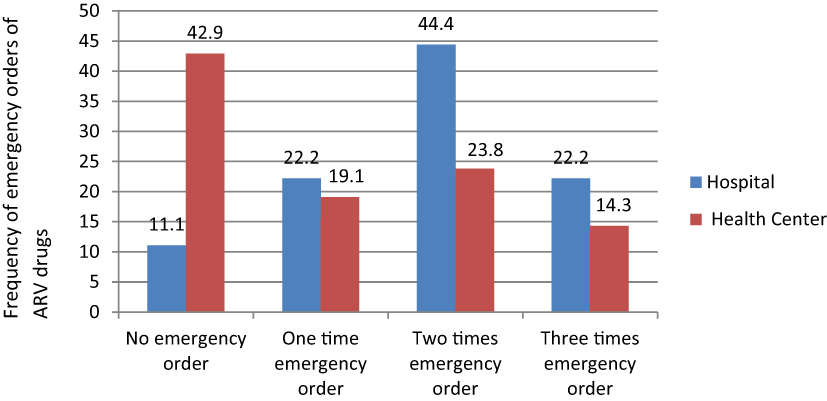 |
Figure 3 Frequency of emergency orders of ARV drugs by facility types of SNNPR, May, 2017. |
Stock Out Rate of HIV/AIDS Commodities
Sixteen (53.3%) commodities were stocked out at least once within the last six months. Nevirapine 10 mg/5 mL in 240 mL was the most stock out (13 times) with duration of 22 days. Uni gold was stock out 16 times with duration of 34.5 days (Table 6). Stock out rate showed significant association (P <0.05) with order fills rate and IPLS training. Strength of relationship between stock out and order fill rate or IPLS training was negatively moderate correlation (r=−0.432, −0.472, P<0.017, 0.009) respectively.
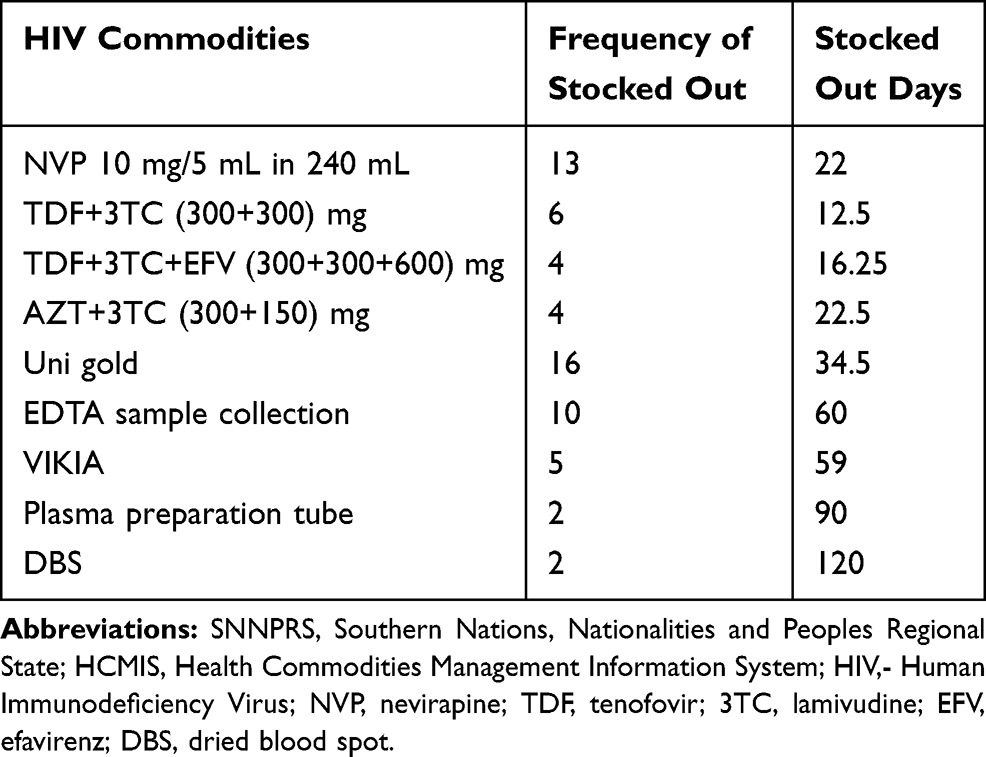 |
Table 6 Frequency of Stocked Out and Stocked Out Duration of HIV Commodities at Health Facilities of SNNPRS, May, 2017 |
Availability of HIV/AIDS Commodities
Majority of HFs (95%) had most ARV drugs on the day of visit. Availability with 78% were observed for both LPV/r (100+ 25) mg and LPV/r (80+ 20) mL at hospitals and for ABC 300 mg (67%) at HCs respectively (Table 7). Availability of test kits and VL supplies was 80% for all facilities. Availability of commodities had slightly significant association with lead time (P <0.05). Strength of relation of availability and number of emergency order was negatively moderate correlation (r=−0.428, P<0.018) and relation between availability and use of HCMIS or IPLS training was positively moderate (r=472, r=0.449, P<0.008, 0.013) respectively.
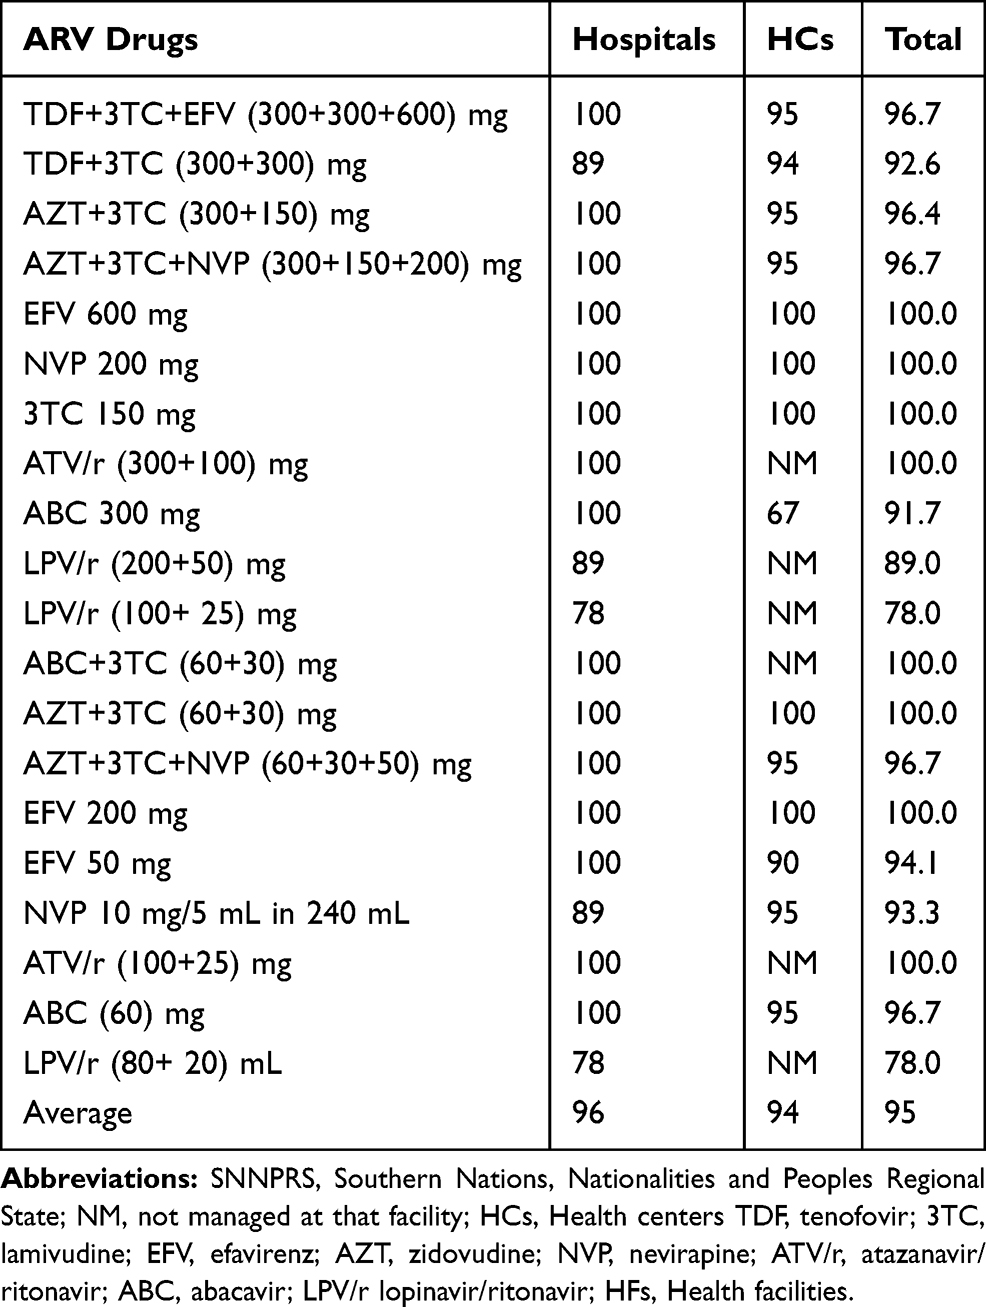 |
Table 7 Percentage of Availability of ARV Drugs by Facility Type at Health Facilities of SNNPRS, May, 20,117 |
Wastage of HIV/AIDS Commodities
Totally, 942,067.40 Ethiopian birr were recorded due to expired, damaged and lost from HFs. It covered 2.5% of wastage rate. Mainly, 649,370.70 birr were from hospitals. Majorly, 3TC +TDF (300+300) mg accounted 739,603.08 (78.51%) birr. Spearman correlation test showed that strength of association between wastage rate with presence of HCMIS was negatively moderate relation (r =−0.437, P<–0.020) and with store man dissatisfaction was positively relation(r=0.411, P<–0.030).
Storage Condition of HFs
The storage practice was assessed using the indicators as per good pharmacy practice standards stipulated in LIAT.18 Among HFs, 25 (83.3%) have fulfilled good storage condition (>80% to the standard). Accordingly, 26 (86.7%) facilities stored by using first-expire, first-out and 27(90%) arranged products with arrows pointing up. Only 12 (40%) facilities had expiry tracking charts (Table 8).
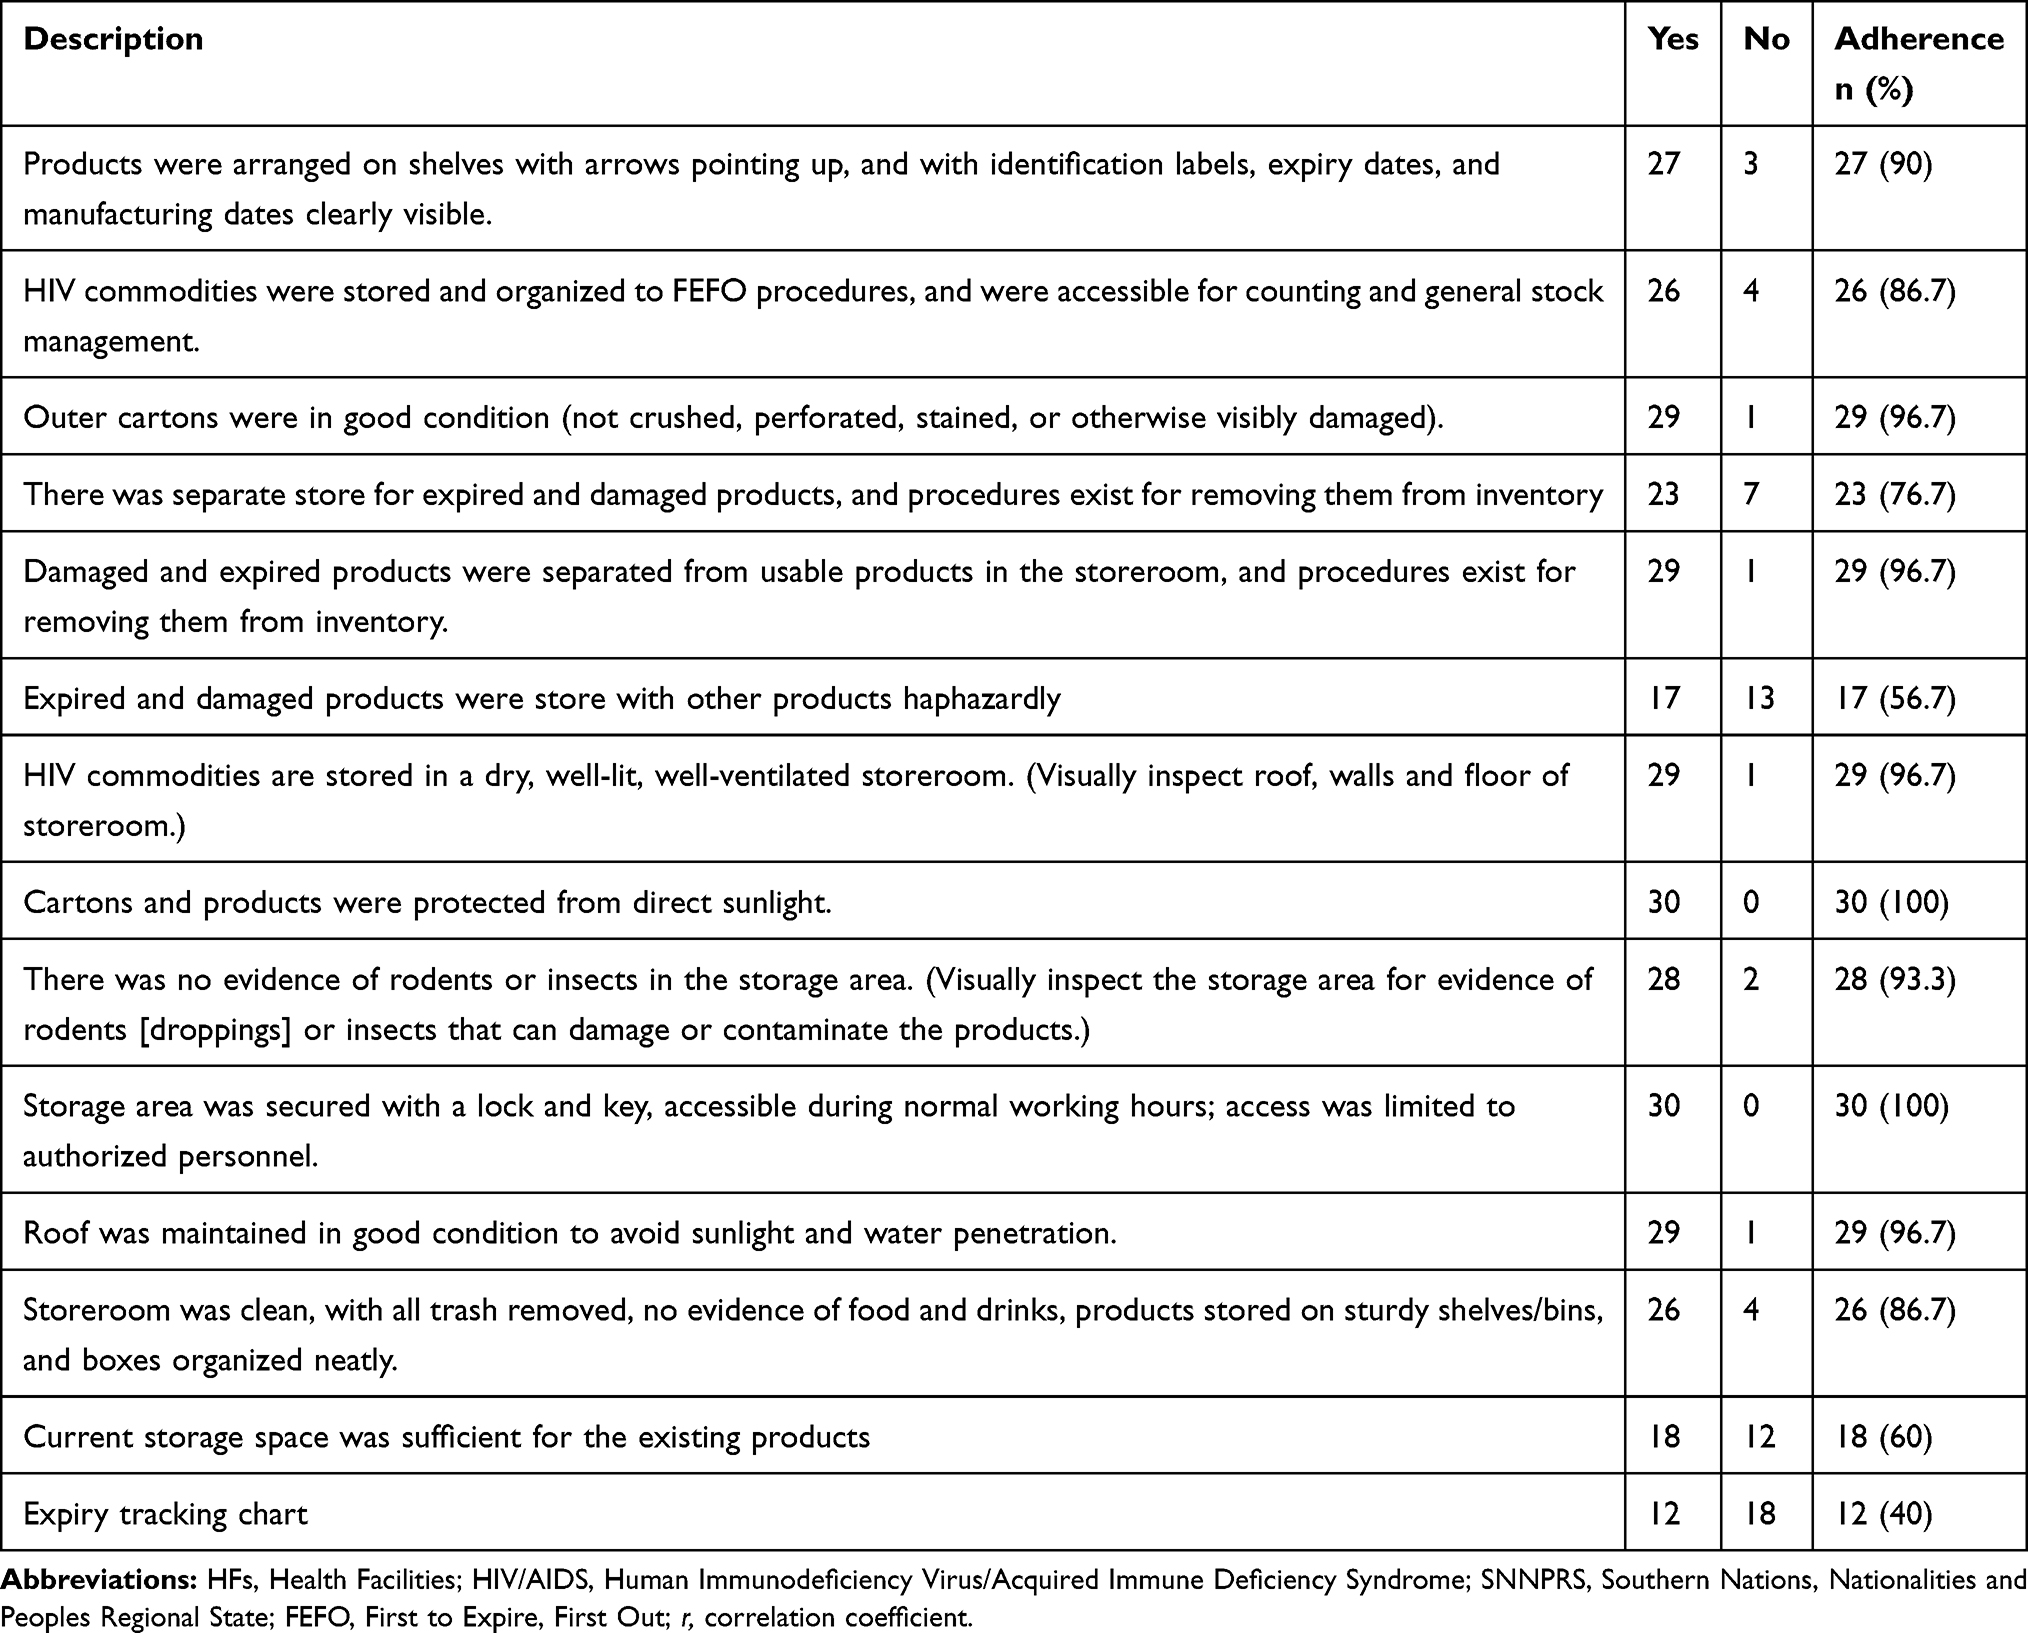 |
Table 8 HFs Adherence to Good Pharmacy Practice Standards for the Storage of HIV/AIDS Commodities at Health Facilities of SNNPRS, May, 2017 |
Challenges for Quantification, Procurement, Reporting and Resupply of HIV/AIDS Commodities
Central PFSA complained about on time quantification for early forecasting planning on HIV test kits. Mostly, requested demand and actual consumption were not similar. Most HFs preferred to request many products than actual demand. According to central PFSA procurement personnel explanation, most of HIV/AIDS commodities have monopolistic source (there were no competitive suppliers on the market for better commodities supply guarantee) and 90 days lead time were the major problems to process international competitive bidding. Therefore, PFSA preferred waiting for the bidder response than other alternative. Occasionally, the bid winner might terminate agreement due to different problems, so these would create shortage of products and occurrence of emergency order.
As a new program for the country, viral load supplies were repeatedly stocked out at HFs and VL monitoring sites. One VL monitoring personnel stated that filling and reporting RRF were for formality. Refilled amount was not depending on facilities request. There were product awareness problems both at HFs and PFSA hubs. For example, one facility asked exposed infant diagnosis kit to PFSA hub to resupply, but PFSA hub distribution worker sent dry blood spot (DBS) kit to VL monitoring site. Most store managers reported that re-supply was not done on time. Sometimes, second reporting period occurs without resupplied previous request. According to the storeman from the hospital, PFSA offered unrequested near expiry HIV/AIDS commodities together with the requested items which are causes for expiry commodities at HFs.
Discussion
The average availability of bin cards was 86.1% at HFs which was slightly lower than the study conducted in East Shewa12 and Addis Ababa (100%),19 but similar to the national IPLS survey, 90% in hospitals and 80% in HCs.14 Utilization of bin card 81.3% at hospitals and 88.8% at HCs was slightly lower than a study conducted in Addis Ababa (85.7% at HCs, 96.9% at hospitals).11 But it was higher than a study conducted in East Shewa Zone and national IPLS survey 59.5% and 75% respectively.12,14 Quality RRF is unquestionable for effective decision making and quality, 55.6% at hospitals and HCs 57.1%, was slightly higher than 46% of facilities14 and 2 (50%) hospitals; but lower than 15 (78.9%) HCs (11).
Healthy inventory control system has been important to maintain appropriate stock levels. Among HFs, 23 (76.7%) properly filled bin cards was similar to 77% of other HFs14 but was higher than East Shewa Zone (28.5%).12 Storeman dissatisfaction and supportive supervision were factors for underperformance of inventory accuracy rate. Emergency order, 20 (66.7%) of ARV drugs had slight difference with in Addis Ababa, at HCs 16 (84.2%).11 Order fill rate of ARV drugs 5 (55.6%) at hospitals and 11 (52.4%) HCs had slight difference with 60%.14 Performance of HIV test kits and VL supplies order fill rate indicated only 2 (22.2%) at hospitals and 4 (19%) HCs had similarity with a studied in Addis Ababa, 22 (84.6%) facilities.13 Average lead time for refilled ARV drugs was 46.4 days in hospitals and 59.2 days in HCs. Other in Addis Ababa; 13 (75%) of the hospitals and 13 (68.4%) of HCs received products between two weeks and one month.11 This might be one of the causes for continuous stock out and frequent emergency orders. Commodities availability (95%) for all facilities was similar with national IPLS survey 96%.14 Availability of HIV test kits and VL supplies was 81% for hospitals and 76% for HCs was higher than Addis Ababa 27 (62.7%).15 That was why most of HFs faced frequent stock out and emergency orders recorded even in PFSA hubs.
Sixteen (53.3%) HFs stock out had slight difference with in Addis Ababa 26 (60.5%).15 Another study also shows that all hospitals and HCs faced stock out one or more ARV drugs within six months.11 All HIV test kits and VL supplies were stock out at least once within six months and were higher than 24 (92.6%) facilities.13 From ARV drugs, nevirapine (NVP) 10 mg/5 mL in 240 mL was the most stock out followed by TDF+3TC (300+300) mg as shown on the result part. Stock out for NVP 10 mg/5 mL was due to national expiry batch. Uni gold was the most stock out with similar findings in Addis Ababa11 followed by EDTA sample collection tube due to algorithm change.
Wastage rate, 942,067.40 birr was higher than studied in East Shewa Zone of 174,366.98 birr.12 Some possible reasons were suppliers refilled near expiry commodities and improper HCMIS use. This study showed 25 (83.3%) facilities have fulfilled good storage condition (>80% to the standard) similar to East Shewa Zone12 and better than IPLS survey (55%) of HFs.14 Compared to hospitals; HCs had good storage condition (85.7%). But the study conducted in Addis Ababa; hospitals had better storage condition than HCs.11 Most facilities did not have expiry tracking charts and might be the possible causes for expiration of commodities at HFs.
Conclusion
From this study, performance of supply chain management of HIV/AIDS commodities was found defective. The main contributing factors were order fill rate, lead time and refill of near expiry, job dissatisfaction, IPLS training gap and improper HCMIS use. From the perspective of 90-90-90 treatment strategy, particularly the first 90 and third 90 treatment strategies still need more work and collaboration with responsible stakeholders compared to the performance of the second 90 target.
Abbreviations
ARV, Antiretroviral; HCMIS, Health Commodities Management Information System; HCs, Health Centers; IPLS, Integrated Pharmaceutical Logistic System; PFSA, Pharmaceutical Fund and Supply Agency; RRF, Report and Requisition Format; SNNPRS, Southern Nations, Nationalities and People’s Regional State; VLM, Viral Load Management.
Ethics Approval and Consent to Participate
Ethical approval was obtained from the Ethics Review Board of Institute of Health, Jimma University and given to the SNNPR Health Bureau.
Data Sharing Statement
Data can be obtained from the corresponding author upon request.
Acknowledgments
We are grateful to Jimma University and SNNPRS Health Bureau for their kind support. We would also like to thank health facilities (Hospitals and Health Centers), central PFSA and PFSA hubs for their kind and cooperative response to our inquiries information.
Author Contributions
All authors contributed towards the idea and designing, data analysis, interpretation, drafting and critically revising the manuscript. All authors read and approved the final manuscript and agree to be accountable for all aspects of the work.
Disclosure
The authors report no conflicts of interest in this work.
References
1. World Health Organization. Global HIV and AIDS statistics; 2016. Available from https://www.who.int/hiv/pub/arv/global-AIDS-update-2016_en.pdf.
2. UNAIDS. 90-90-90. An ambitious treatment target to help end the AIDS epidemic; 2014. Available from https://www.who.int/hiv/pub/arv/global-AIDS-update-2016_en.pdf.
3. UNAIDS. Fast-tracking to zero UNAIDS strategy for 2016–2021; 2016. Available from https://www.unaids.org/sites/ … /20151027_UNAIDS_PCB37_15_18_EN_rev1.pdf.
4. UNAIDS. HIV treatment: parliamentary action and policy options; 2015. Available from https://www.unaids.org/en/resources/documents/2015/2015IPUHIVtreatment.
5. Global Fund. Improving health outcomes through strategic sourcing of ARVs & Viral load technologies short version: PartI; 2016. Available from https://www. the global fund. org/ … /psm_2016-07-global fund strategic sourcing short part.
6. JSI. Guidelines for managing the HIV/AIDS supply chain. 2005. Available from https://pdf.usaid.gov/pdf-dos/PNADF424.pdf.
7. USAID | DELIVER progect to 1. The logistics handbook; A practical guide for the supply chain management of health commodities; 2011. Available from http://apps.who.int/medicinedocs/documents/s20211en/s20211en.pdf.
8. Van HRI. “Measuring the unmeasurable” - measuring and improving performance in the supply chain. An Int J. 1998;3(4):187–192. doi:10.1108/13598549810244232
9. Beamon B. Measuring supply chain performance. Int J Oper Prod Manag. 1999;19(3):275–292. doi:10.1108/01443579910249714
10. Mabirizi D, Embrey M, Saleeb S, Aboagye N. Pharmaceutical System Strengthening Interventions to Improve Access to Antiretroviral Treatment. System for Improved Access to Pharmaceutical and Services (SIAPS) Program. Arlington, VA: MSH; 2014:1–24.
11. Berhanemeskel E, Beedemariam G, Gedif T. HIV/AIDS related commodities supply chain management in public health facilities of Addis Ababa, Ethiopia: a cross sectional survey. J Pharm Policy Pract. 2016;9(11):1–10. doi:10.1186/s40545-016-0060-z
12. Gurmu TG, Ibrahim AJ. Inventory management performance of key essential medicines in health facilities of East Shewa Zone, Ethiopia. Cukurova Med J. 2017;42(2):277–291. doi:10.17826/cutf.322908
13. Tilahun A, Geleta D, Abeshu M, Geleta B, Taye B. Assessment of integrated pharmaceutical logistic system for the management HIV/AIDS and tuberculosis laboratory diagnostic commodities in public health facilities in Addis Ababa, Ethiopia. J Pharma Care Health Sys. 2016;3(2):1–11.
14. Shewarega A, Dowling P, Necho W, Tewfik S, Yigezu Y Ethiopia: national survey of the integrated pharmaceutical logistics system. Popline org. 2015; Available from https://www.popline.org/node/626778.
15. Adino D, Bineyam T, Getachew BA, Alemayehu N. Assessment of laboratory logistics management information system practice for HIV/AIDS and tuberculosis laboratory commodities in selected public health facilities in Addis Ababa, Ethiopia. Pan Afr Med J. 2013;15(46):1–8. doi:10.11604/pamj.2013.15.1.2228
16. USAID | DELIVER Project to 1. Logistics indicators assessment tool (LIAT). Arlington; 2008. Available from https://pdf.usaid.gov/pdf_docs/Pnade735.pdf.
17. USAID | DELIVER Project to 1. Quantification of health commodities: HIV test kit companion guide forecasting consumption of HIV test kits to be used in conjunction with; 2009. Available from: www.psmtoolbox.org/ … /export-tool %7C Quantification -of-Health-Co.
18. Agency US, Development I. Logistics indicators Assessment Tool(LIAT)0; 2005. https://pdf. usaid.gov/pdf_docs/Pnade735.pdf.
19. Mezid M Assessment of pharmaceutical logistics system in health centers of Addis Ababa, Addis Ababa University.2014. Available from http://etd.aau.edu.et/handle/123456789/1862.
 © 2020 The Author(s). This work is published and licensed by Dove Medical Press Limited. The full terms of this license are available at https://www.dovepress.com/terms.php and incorporate the Creative Commons Attribution - Non Commercial (unported, v3.0) License.
By accessing the work you hereby accept the Terms. Non-commercial uses of the work are permitted without any further permission from Dove Medical Press Limited, provided the work is properly attributed. For permission for commercial use of this work, please see paragraphs 4.2 and 5 of our Terms.
© 2020 The Author(s). This work is published and licensed by Dove Medical Press Limited. The full terms of this license are available at https://www.dovepress.com/terms.php and incorporate the Creative Commons Attribution - Non Commercial (unported, v3.0) License.
By accessing the work you hereby accept the Terms. Non-commercial uses of the work are permitted without any further permission from Dove Medical Press Limited, provided the work is properly attributed. For permission for commercial use of this work, please see paragraphs 4.2 and 5 of our Terms.