")
Back to Journals » International Journal of Nanomedicine » Volume 9 » Issue 1
Sulfatide-containing lipid perfluorooctylbromide nanoparticles as paclitaxel vehicles targeting breast carcinoma
Authors Li X, Qin F, Yang L, Mo L, Li L, Hou L
Received 7 May 2014
Accepted for publication 10 June 2014
Published 18 August 2014 Volume 2014:9(1) Pages 3971—3985
DOI https://doi.org/10.2147/IJN.S67343
Checked for plagiarism Yes
Review by Single anonymous peer review
Peer reviewer comments 2
Xiao Li, Fei Qin, Li Yang, Liqian Mo, Lei Li, Lianbing Hou
Department of Pharmacy, Nanfang Hospital, Southern Medical University, Guangzhou, People’s Republic of China
Abstract: Targeted nanoparticle (NP) delivery vehicles are emerging technologies, the full potential of which has yet to be realized. Sulfatide is known to bind to extracellular matrix glycoproteins that are highly expressed in breast tumors. In this study, we report for the first time the combination of sulfatide and lipid perfluorooctylbromide NPs as a targeted breast cancer delivery vehicle for paclitaxel (PTX). PTX-sulfatide-containing lipid perfluorooctylbromide NPs (PTX-SNPs) were prepared using the emulsion/solvent evaporation method. PTX-SNPs exhibited a spherical shape, small particle size, high encapsulation efficiency, and a biphasic release in phosphate-buffered solution. The cytotoxicity study and cell apoptosis assay revealed that blank sulfatide-containing lipid perfluorooctylbromide NPs (SNPs) had no cytotoxicity, whereas PTX-SNPs had greater EMT6 cytotoxicity levels than PTX-lipid perfluorooctylbromide NPs (PTX-NPs) and free PTX. An in vitro cellular uptake study revealed that SNPs can deliver greater amounts of drug with more efficient and immediate access to intracellular targets. In vivo biodistribution measured using high-performance liquid chromatography confirmed that the PTX-SNPs can target breast tumor tissues to increase the accumulation of PTX in these tissues. The in vivo tumor inhibition ability of PTX-SNPs was remarkably higher than PTX-NPs and free PTX. Furthermore, toxicity studies suggested that the blank SNPs had no systemic toxicity. All results suggested that SNPs may serve as efficient PTX delivery vehicles targeting breast carcinoma.
Keywords: perfluorooctylbromide nanoparticles, paclitaxel, drug delivery, targeting, antitumor efficacy
Introduction
Breast carcinoma, characterized by a high incidence among women, is a major global health problem, particularly in low- and middle-income countries.1 Paclitaxel (PTX) is a clinically effective antitumor drug for various solid tumors, including non-small-cell lung cancer, breast cancer, and ovarian cancer.2–5 It has been reported that PTX can bind to the microtubules and stabilize microtubule structure,6 induce apoptosis by suppressing the mitotic spindle dynamics,7 and inhibit tumor-angiogenesis.8 However, the use of PTX has been limited due to serious side effects caused by Kolliphor EL,9 poor selectivity, and low uptake efficiency in breast carcinoma. A satisfactory targeted delivery vehicle for PTX may improve its efficiency and tolerability.
A satisfactory targeted delivery vehicle should not cause serious side effects, should enhance the internalization of the drug into the targeted cells, and achieve a high selectivity for the targeted tissue. To achieve the above goals, the first requirements are for biologically safe delivery vehicles that can entrap the drug. Lipid perfluorooctylbromide (PFOB) nanoparticles (NPs) comprise a lipid monolayer surrounding a dense lipophobic and hydrophobic PFOB core. The lipid PFOB NPs can additionally serve as drug delivery vehicles, where lipophilic drugs can be dissolved into the outer lipid monolayer, or complexed to lipid anchors in the monolayer for subsequent delivery to target cells for site-targeted therapy.10,11 In addition, PFOB emulsions have already been proven safe for clinical use as blood substitutes.12 The NPs are cleared by reticuloendothelial cells in the liver and spleen.13 Then the PFOB core is eliminated unmetabolized through exhalation with a 3-day biological half-life.14
Next, the vehicle must be able to bind to the targeted tissue with a suitable ligand that can actively incorporate the drug carrier and interact with the corresponding binding sites on breast carcinoma. Sulfatide consists of monogalactosylceramide in which the C (3) of the galactosyl head group is sulfated.15 Furthermore, sulfatide is known to bind several extracellular matrix glycoproteins (ECM), including tenascin-C (TN-C) in particular.16 TN-C is highly upregulated in many different cancers including breast, ovarian, and prostate cancer.17 However, most targeted moieties such as antibodies have inherent disadvantages such as relatively poor instability and potential immunogenicity.18 Sulfatide, a non-antibody ligand, is often readily available, easy to handle,19 and has been used as the minor lipid component of various liposomes as drug delivery vehicles.20–22 Hence, sulfatide, a type of lipid, can actively incorporate with other lipids and act as a part of the outer lipid monolayer component of the targeted ligand. Based on this information, we first combined the sulfatide and NPs described above, called sulfatide-containing lipid PFOB NPs (SNPs), for the targeted delivery of PTX to breast carcinoma cells. Therefore, PTX-SNPs are expected to locate in breast cancer tissue, facilitate the delivery of the drug to the targeted breast cancer cells, and improve the therapeutic outcome of PTX. The primary goal of this study was to justify this hypothesis.
In this study, we mixed sulfatide with egg phosphatidylcholine (EPC) together as the outer lipid monolayer component and optimized the best preparation method of PTX-SNPs using an orthogonal design. The PTX-SNPs were characterized with respect to their morphology, drug encapsulation efficiency, and in vitro drug release. Cytotoxicity, cell apoptosis rate, and cellular uptake studies were analyzed in EMT6 cells. In vivo biodistribution and frozen slices were also studied in female mice bearing EMT6 breast tumors. The in vivo therapeutic effect of PTX-SNPs was studied and compared with that of Taxol® and conventional PTX-lipid PFOB NPs (PTX-NPs) without sulfatide. In vivo toxicity studies suggested that blank SNPs had no systemic toxicity. As a result, we can conclude that the PTX-SNPs presented a better therapeutic outcome compared with both Taxol® and PTX-NPs.
Materials and methods
Materials and experimental animals
PFOB was purchased from Tokyo Chemical Industry Co. Ltd. (Tokyo, Japan). EPC was purchased from Lipoid GmbH (Steinhausen, Switzerland). Cholesterol, coumarin 6, and Thiazolyl Blue Tetrazolium Bromide (MTT) was obtained from Sigma-Aldrich Co. (St Louis, MO, USA). PTX (purity >99%) was purchased from South Pharmaceutical (Fujian, People’s Republic of China). Taxol® was purchased from Bristol-Myers Squibb (New York, NY, USA). Roswell Park Memorial Institute medium 1640 (RPMI-1640), 0.25% trypsin-ethylenediaminetetraacetic-acid solution, and fetal bovine serum (FBS) were purchased from Thermo Fisher Scientific (Waltham, MA, USA). Annexin V-FITC Apoptosis Detection Kit was purchased from Nanjing KeyGen BioTECH Co. Ltd. (Nanjing, People’s Republic of China). Anti-Bad antibody and anti-CD31 antibody were obtained from Abcam plc (Cambridge, England). All other chemicals and solvents were analytical grade, except acetonitrile and ethyl acetate, which were high-performance liquid chromatography (HPLC) grade.
Female BALB/c mice, weighing approximately 18 g (5-weeks-old), were obtained from South Medical University Experimental Animal Center (Guangzhou, People’s Republic of China). The mice had free access to chow and water in a 25°C±1°C environment with regular light and 55%±5% relative humidity. All procedures conformed to the Guiding Principles for the Care and Use of Experiment Animals in South Medical University. The animal study protocols were reviewed and approved by the Institutional Animal Care and Use Committee at South Medical University.
The preparation of PTX-SNPs
PTX-SNPs were prepared by the emulsion/solvent evaporation method. The concentration of lipids, the ratio of EPC and sulfatide, and the concentration of the PFOB and PTX were identified as critical factors, and the best preparation method was optimized using an orthogonal design. The optimal formulation was comprised of PFOB (15%, volume/volume [v/v]), surfactant lipids (1.5%, weight/volume [w/v]), glycerin (2.0%, w/v) and PTX (1.3 mg/mL). The surfactant lipids included EPC and sulfatide in a weight ratio of 40:1. The PTX-SNPs were prepared specifically as follows:23 briefly, the surfactant lipids and PTX were dissolved in chloroform, evaporated under reduced pressure at 50°C for at least 6 hours, and dispersed in phosphate-buffered solution (PBS) by sonication, resulting in a liposome suspension. Next, the liposome suspension was coupled with PFOB, and emulsified for 4 minutes. Then, the emulsified mixture was transferred to a nano homogenizer (AH2010 high pressure homogenizer and liposome extruder; ATS Engineering Incorporated, Shanghai, People’s Republic of China) and continuously processed at 800 bar for 3 minutes. Finally, the completed product was filtered through a 0.8 μm membrane to remove insoluble PTX and placed in vials and blanketed with nitrogen until use. The PTX-NPs were prepared by the same method without the addition of sulfatide. The blank SNPs were prepared without the addition of PTX. Coumarin 6-SNPs were prepared similarly to the above application by replacing the PTX with coumarin 6.
Characterization of the SNPs
Particle size, size distribution, and zeta potential
Particle size and zeta potential were measured by dynamic light scattering using a Malvern Zetasizer Nano ZS (Malvern Instruments, Malvern, UK). Experiments were performed in triplicate.
Transmission electron microscopy morphology
Transmission electron microscopy (TEM) was used to observe the morphology of the PTX-SNPs by the phosphotungstic acid negative dyeing method. One drop of PTX-SNPs was placed on a copper grid, then the excess liquid was drained by filter paper and dried at room temperature. The copper grid was stained in a 2% phosphotungstic acid solution (pH 7.0) for 2 minutes. Observations were carried out at 80 kV with a transmission electron microscope (HITACHI 7650; Hitachi Ltd., Tokyo, Japan).
Evaluation of drug encapsulation efficiency
PTX-SNPs were filtered through a 0.8 μm membrane to remove insoluble PTX. One milliliter of the filtered PTX-SNPs was placed in the centrifuge tube and centrifuged at a speed of 12,000 rpm for 10 minutes. The PTX-SNPs were precipitated and destroyed by adding an equal volume of acetonitrile and appropriately diluted. The testing solution was filtered through a 0.45 μm organic membrane filter before being detected by HPLC (LC-20A; Shimadzu Corporation, Kyoto, Japan). The mobile phase was a mixture of acetonitrile and water (50:50) at the flow rate of 1.0 mL/minute, and the detection wavelength was 227 nm. Separation was achieved using a C18 BDS HYPERSIL column (5 μm, 150 mm ×4.6 mm; Thermo Fisher Scientific). The encapsulation efficiency (EE%) was evaluated using the following formula:
EE% = PTX weight measured in NPs/PTX weight added ×100%. | (1) |
In vitro release study
To study the PTX release rate, 1 mL of PTX-SNPs, PTX-NPs, and Taxol® injection at an equivalent PTX concentration (1.24 mg/mL) were placed in a dialysis bag (molecular weight cut-off: 14 kDa). Each dialysis bag was immersed in 1,000 mL PBS (pH 7.4) containing 0.1% (w/v) Tween 80, kept at 37°C and shaken at a speed of 100 rpm under sink conditions. At predetermined time intervals, a volume of 2 mL of release medium was sampled and replaced with an equal volume of fresh release medium. The release rate of PTX was determined by HPLC at 227 nm. The cumulative released percentage of PTX was calculated using the following formula:24
Cumulative PTX released percentage = [CiV+Ve(Ci–1+ Ci–2+…+C1)]/T ×100%, | (2) |
where Ci represents the ith sampling concentration of PTX, V is the total volume of released medium, Ve is the sampling volume, and T is the total weight of PTX in the dialysis bag.
Cytotoxicity study
EMT6 cells were cultured in RPMI-1640 supplemented with 10% FBS in a CO2 incubator (5% CO2 at 37°C; Galaxy S+; RS Biotech Laboratory Equipment, Irvine, UK). The EMT6 cells were seeded into 96-well plates (Corning Incorporated, Corning, NY, USA) at a density of 8×10³ cells/well and incubated for 12 hours. Free PTX was dissolved in 100 μL dimethyl sulfoxide (DMSO) and diluted with RPMI-1640 (without FBS) to 50, 30, 20, 15, 10, and 5 μg/mL. The final DMSO concentration was maintained at less than 0.1% (v/v). Blank SNPs, PTX-SNPs, and PTX-NPs were diluted with RPMI-1640 to the same concentration gradient as the free PTX. After incubation for 24, 48, and 72 hours, 10 μL of 5 mg/mL MTT in PBS was added and incubated for an additional 4 hours. The reaction was stopped by removing MTT, and the formazan product was solubilized by the addition of 100 μL of DMSO. The absorbance of the formazan solution was measured at 490 nm with a microplate reader (SpectraMax M5; Molecular Devices, Sunnyvale, CA, USA).
Cell apoptosis assay
EMT6 cells were seeded into 6-well plates (Corning Incorporated) at a density of 4×10⁵ cells/well and incubated for 12 hours. Free PTX was dissolved in 100 μL DMSO and diluted with RPMI-1640 (without FBS) to 10 μg/mL and 30 μg/mL, respectively. The final DMSO concentration was maintained at less than 0.1% (v/v). Blank SNPs, PTX-SNPs, and PTX-NPs were diluted with RPMI-1640 to the same concentration as the free PTX. After incubation for 48 hours, the cells were trypsinized, centrifuged, and washed twice with ice-cold PBS and resuspended in 500 μL of binding buffer. Next, 5 μL of Annexin V-FITC and propidium iodide were added and mixed for 15 minutes in the dark. Then, the stained cells were analyzed using a flow cytometer (FACSCalibur; BD Biosciences, San Jose, CA, USA).
Cellular uptake of payload in SNPs
Coumarin 6 was chosen to be a fluorophore to compare the cellular uptake efficiency between free coumarin 6, coumarin 6-SNPs, and coumarin 6-NPs. Quantitative analysis of the relative level of the cellular uptake of coumarin 6 in EMT6 cells was measured using a flow cytometer (FACSCalibur; BD Biosciences). Briefly, 3×10⁵ cells/well were seeded in 6-well plates and incubated for 12 hours. Later on, free coumarin 6, coumarin 6-SNPs, and coumarin 6-NPs were added into each well with the final coumarin 6 concentration of 50 μg/mL and incubated for 0.5, 1, and 12 hours, respectively. To confirm the function of sulfatide in coumarin 6-SNPs, excessive free sulfatide (0.2 mg/mL) was also added and incubated for 2 hours before coumarin 6-SNPs application. To quantitate the fluorescent uptake into the EMT6 cells correctly, we needed to separate the distribution of coumarin 6 in cells and adhesion to the cell membrane. The appropriate concentration of trypan blue could quench the fluorescence of coumarin 6.24 After incubation, cells were washed three times with cold PBS and covered with trypsin to allow complete detachment from the wells. After quenching the trypsin activity, the suspension of cells was transferred into tubes. The fluorescence intensity was measured using a flow cytometer (FACSCalibur; BD Biosciences) equipped with an argon ion laser (488 nm) as the excitation source and detection with a 490–525 nm filter.25
Biodistribution study
Murine breast cancer EMT6 cells (1.5×10⁷) were injected into the right side of the back of female BALB/c mice at the age of 5 weeks. The experiment was initiated when the mice had developed palpable tumors with diameters of 5–8 mm 2 weeks after inoculation. A total of 72 female tumor-bearing mice were used to assess the biodistribution of PTX in different forms. Mice were randomly divided into three groups (n=18) and injected intravenously through the tail vein with Taxol®, PTX-NPs, and PTX-SNPs at an equivalent PTX dose of 10 mg/kg. Six mice from each group were sacrificed at 1, 8, 12, and 24 hours, respectively. The tumors, hearts, livers, spleens, lungs, kidneys, and brains of each of the mice were harvested, immediately washed twice with normal saline, weighed, and frozen at −80°C before the assessment of drug concentration by HPLC. The drug concentration was calculated as the percentage of the amount of PTX distributed in the tissues and the weight of tissues used in the assay.
Frozen slices of breast cancer tissue
Two weeks after the inoculation with murine breast cancer EMT6 cells (1.5×10⁷), 6 female BALB/c mice were divided into three groups and administered free coumarin 6, coumarin 6-NPs, and coumarin 6-SNPs, with the dose of coumarin 6 of 0.1 mg/kg. Next, at 1 and 8 hours later, the mice were anesthetized, followed by heart perfusion with PBS and 4% paraformaldehyde, then the tumors were collected, frozen at −80°C and sectioned at 10 μm. The tumor slices were stained with 4′,6-diamidino-2-phenylindole and the distribution of fluorescence was analyzed using the fluorescence microscope.
In vivo antitumor efficiency and tumor apoptosis detection
The experiment was initiated when the female BALB/c mice had developed palpable tumors with diameters of 5–8 mm 2 weeks after the inoculation with murine breast cancer EMT6 cells (1.5×10⁷). The mice were randomly divided into five groups with six mice per group. An equivalent PTX dose of 10 mg/kg was injected intravenously through the tail vein with either saline (control), blank SNPs, Taxol®, PTX-NPs, or PTX-SNPs. Drug administration was performed once every 4 days until the 20th day. Tumor volumes were monitored before each administration by computing with the following formula:
0.5 (a × b2), | (3) |
where a is the largest and b is the smallest diameter.26 The tumor volume doubling time (DT) was utilized as a primary endpoint of antitumor efficiency, which was estimated according to the following formula:27
DT = T × log 2/(logVf–logVi), | (4) |
where Vf is the final tumor volume, Vi is the initial tumor volume, and T is the time interval (days) between Vf and Vi measurements. On the 20th day, the mice were sacrificed and the tumors were weighed and compared. The tumor inhibition ratio (TIR) was calculated as follows:
TIR (%) = (1–Wt/Wc) ×100%, | (5) |
where Wt and Wc represent the average tumor weight of the treatment and control groups, respectively.28
After weighing, the tumor tissue of each group was collected and fixed with paraformaldehyde for 48 hours and embedded in paraffin. Each section was cut into 5 μm. Terminal deoxynucleotidyl transferase-mediated deoxyuridine triphosphate nick end labeling (TUNEL) was carried out with an in situ Cell Death Detection Kit (Nanjing KeyGen BioTECH Co. Ltd., Nanjing, People’s Republic of China) for quantitative assessment of apoptosis. Cell apoptosis percentages were determined using IPP6.0 software (Media Cybernetics; Silver Spring, MD, USA) from six randomly chosen fields at 200× magnification in a blinded manner.
For microvessel density (MVD) and Bad analysis, the sections (5 μm) were fixed in acetone, incubated, and stained with anti-CD31 antibody or anti-Bad antibody, respectively, according to the manufacturer’s protocol. The positive rate of MVD and Bad were determined using IPP6.0 software from six randomly high-power fields at 200× magnification in a blinded manner.
In vivo toxicity
Twenty healthy BALB/c mice were randomly divided into two groups (n=10). Each group of mice received 200 μL of blank SNPs or saline every day for 2 weeks. The mice were weighed and visually monitored daily. On the 15th day, the mice were sacrificed at 24 hours after the last administration, then the blood and serum samples were collected for hematologic tests. The quantities of white blood cells, red blood cells, platelets, and lymphocytes (%) were measured using the HST 302 Automated Hematology Analyzer (Sysmex Corporation, Kobe, Japan). The serum aspirate transaminase, alanine transaminase, and total bilirubin were analyzed using the AU2700 Automated Analyzer (Olympus Corporation, Tokyo, Japan). The major organs (liver, heart, lungs, kidneys, and spleen) were also harvested, fixed with paraformaldehyde, and embedded in paraffin. The 5 μm histological sections were stained with hematoxylin and eosin. The histological sections were observed for toxicity under a microscope.
Statistical analysis
Data were presented as the mean ± standard deviation. Data were determined by one-way analysis of variance (ANOVA). Differences were considered significant at a value of P<0.05.
Results
Preparation and characterization of the PTX-SNPs
As shown in Figure 1I, sulfatide acted as a part of the outer lipid monolayer component of the targeted ligand. To assess the localization of sulfatide on SNPs, the SNPs were collected at the bottom layer after 10 minutes centrifugation at 12,000 rpm and detected by HPLC equipped with an evaporative light scattering detector. The percentage of sulfatide localized on the SNPs was approximately 97.11%±1.68%, suggesting a good localization. PTX was dissolved into the outer lipid monolayer of the SNPs. The particle size of various NPs is shown in Table 1. The average diameter of the PTX-SNPs was approximately 237.5 nm±6.47 nm with a PDI of 0.28±0.045. There was no significant difference in particle size between PTX-SNPs and PTX-NPs, while the PTX-SNPs were larger than the blank SNPs. To better examine cellular uptake efficiency, we also loaded coumarin 6 into the NPs as a model drug. The particle size of coumarin 6-SNPs was 226.9 nm±2.78 nm with a PDI of approximately 0.18±0.056. The zata potential of various NPs ranged from −2.2 mV to −32.4 mV, depending on the composition of the various NPs. The size distribution (Figure 1A–F) of the various NPs was uniform.
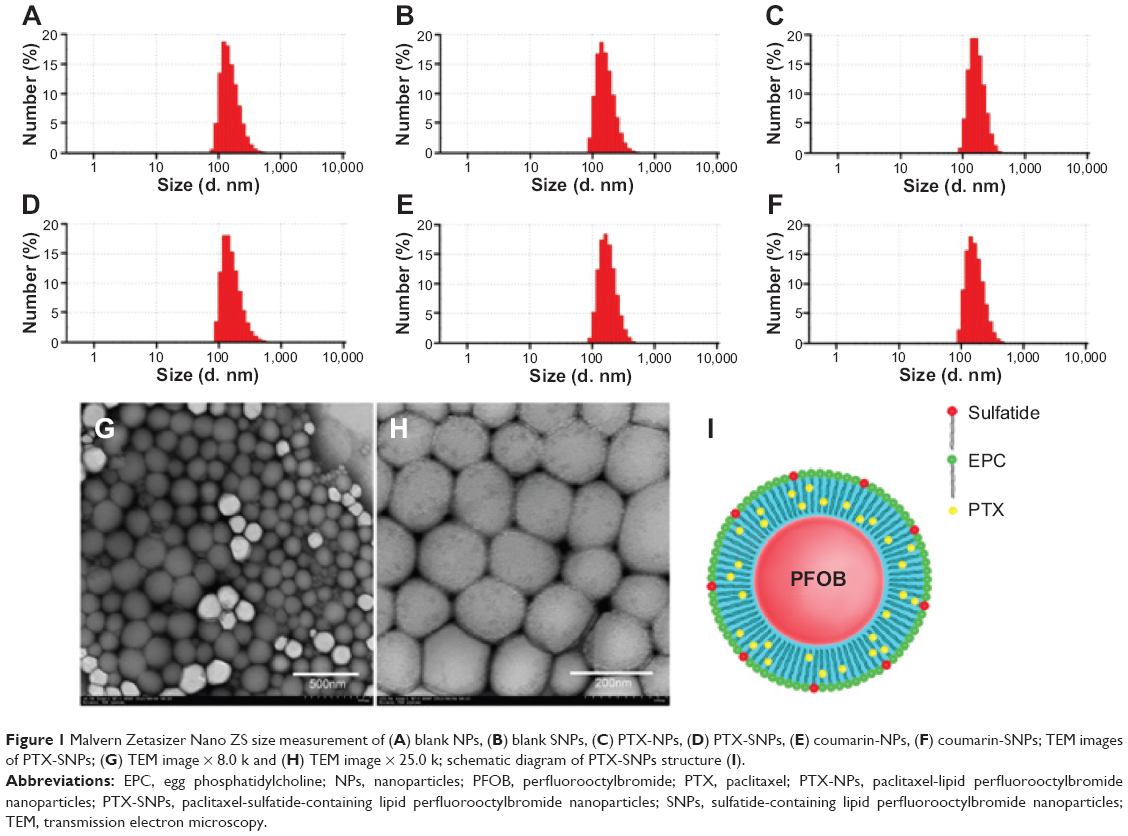 | Figure 1 Malvern Zetasizer Nano ZS size measurement of (A) blank NPs, (B) blank SNPs, (C) PTX-NPs, (D) PTX-SNPs, (E) coumarin-NPs, (F) coumarin-SNPs; TEM images of PTX-SNPs; (G) TEM image × 8.0 k and (H) TEM image × 25.0 k; schematic diagram of PTX-SNPs structure (I). |
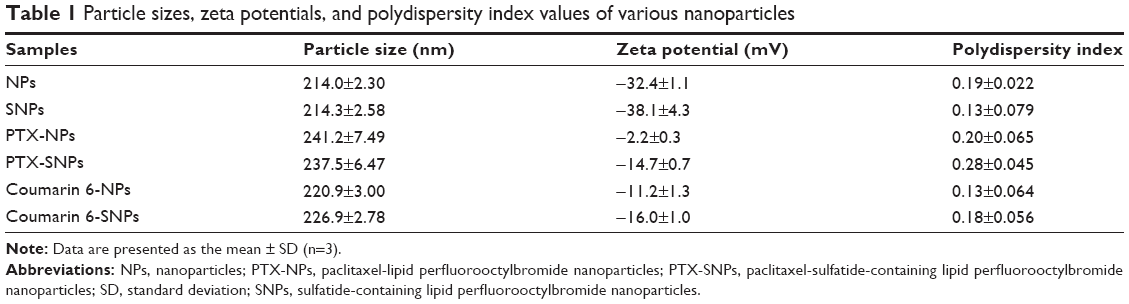 | Table 1 Particle sizes, zeta potentials, and polydispersity index values of various nanoparticles |
TEM showed that PTX-SNPs had a spheroidal surface (Figures 1G and H). No distinct differences in shape were observed between the different NPs (data not shown). The particle size measured from the TEM images matched with the results measured by the Malvern Zetasizer Nano ZS.
Drug encapsulation efficiency and in vitro release study
The optimal PTX encapsulation efficiency of PTX-SNPs was 95.20%±0.14%. The in vitro PTX release of PTX-SNPs, PTX-NPs, and pure drug solution (Taxol®) are shown in Figure 2. Within the first 14 hours, approximately 52.78%±1.29% and 49.78%±1.28% of PTX were released from PTX-SNPs and PTX-NPs, respectively, while PTX was completely released from the Taxol® solution at 14 hours. After 60 hours, the total amounts of PTX released from the PTX-SNPs and PTX-NPs were 87.44%±1.78% and 80.80%±1.74%, respectively. Drug release patterns from the PTX-NPs and PTX-SNPs at pH 7.4 exhibited nonlinear release profiles characterized by a burst release at the initial stage followed by slower and continuous release in the later periods.
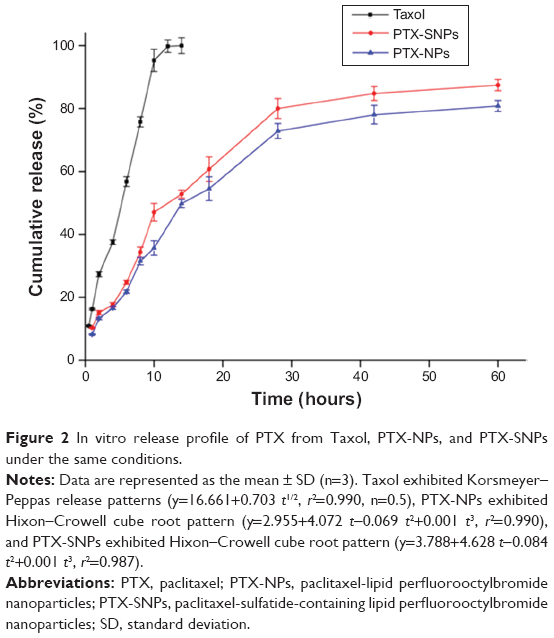 | Figure 2 In vitro release profile of PTX from Taxol, PTX-NPs, and PTX-SNPs under the same conditions. |
Cytotoxicity study
In our preliminary study, the cytotoxicities of 0.1% DMSO and blank NPs were evaluated. All cell viabilities were greater than 90% after being incubated with 0.1% DMSO and blank NPs, which indicated that they had low cytotoxicity against EMT6 cells (data not shown). All cell viabilities were greater than 90% after being incubated with blank SNPs, which indicated that blank SNPs did not cause significant cytotoxicity against EMT6 cells (Figure 3). The PTX-SNPs appeared to have significantly higher levels of cytotoxicity at 24, 48, and 72 hours than PTX-NPs and free PTX. The in vitro antitumor activity of PTX-SNPs, PTX-NPs, and free PTX to EMT6 cells showed significant concentration and time dependence.
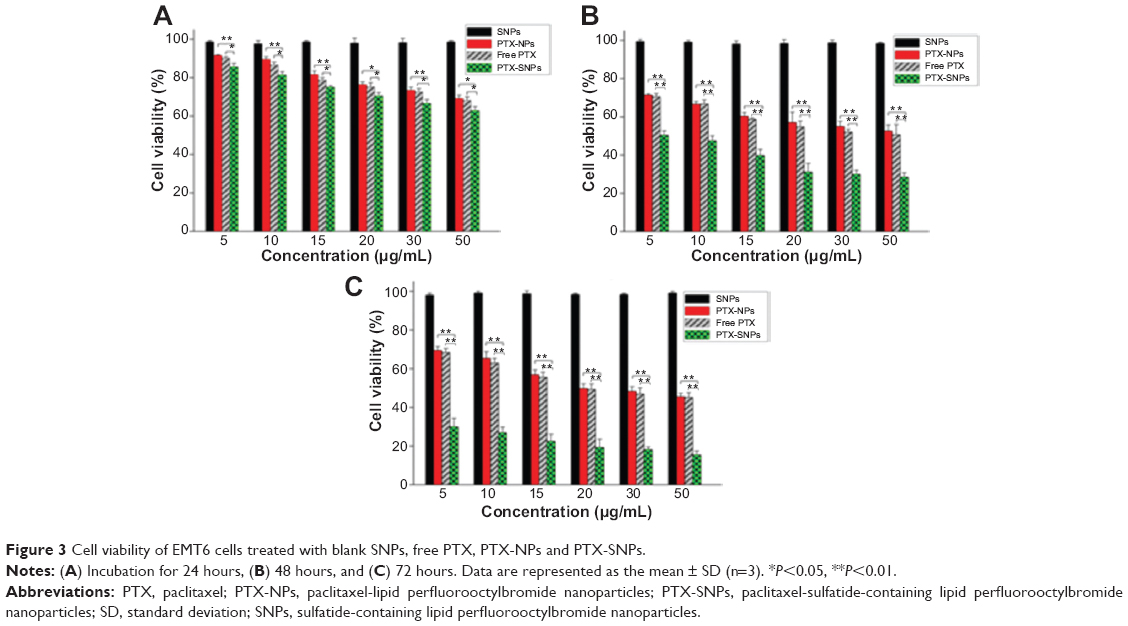 | Figure 3 Cell viability of EMT6 cells treated with blank SNPs, free PTX, PTX-NPs and PTX-SNPs. |
Cell apoptosis assay
To quantify the apoptotic effect of different PTX formulations, the percentage of cell apoptosis was determined by flow cytometry. As shown in Figure 4, the percentage of early apoptosis of EMT6 incubated with free PTX, PTX-NPs, and PTX-SNPs (10 μg/mL) were 3.9%±0.3%, 4.6%±0.6%, and 13.6%±0.5%, respectively (Figure 4A, C, and E). The percentage of early apoptosis increased to 13.1%±0.2%, 13.3%±0.2%, and 44.9%±1.7%, respectively, when the concentration of the PTX was 30 μg/mL (Figure 4B, D, and F). The results showed that the percentage of early apoptosis of EMT6 cells treated with PTX-SNPs was significantly higher than that of the EMT6 cells treated with PTX-NPs and free PTX (P<0.05), which was consistent with the results of antitumor efficacy in vitro. The percentage of cell apoptosis treated with PTX-SNPs, PTX-NPs, and free PTX also showed significant concentration dependence.
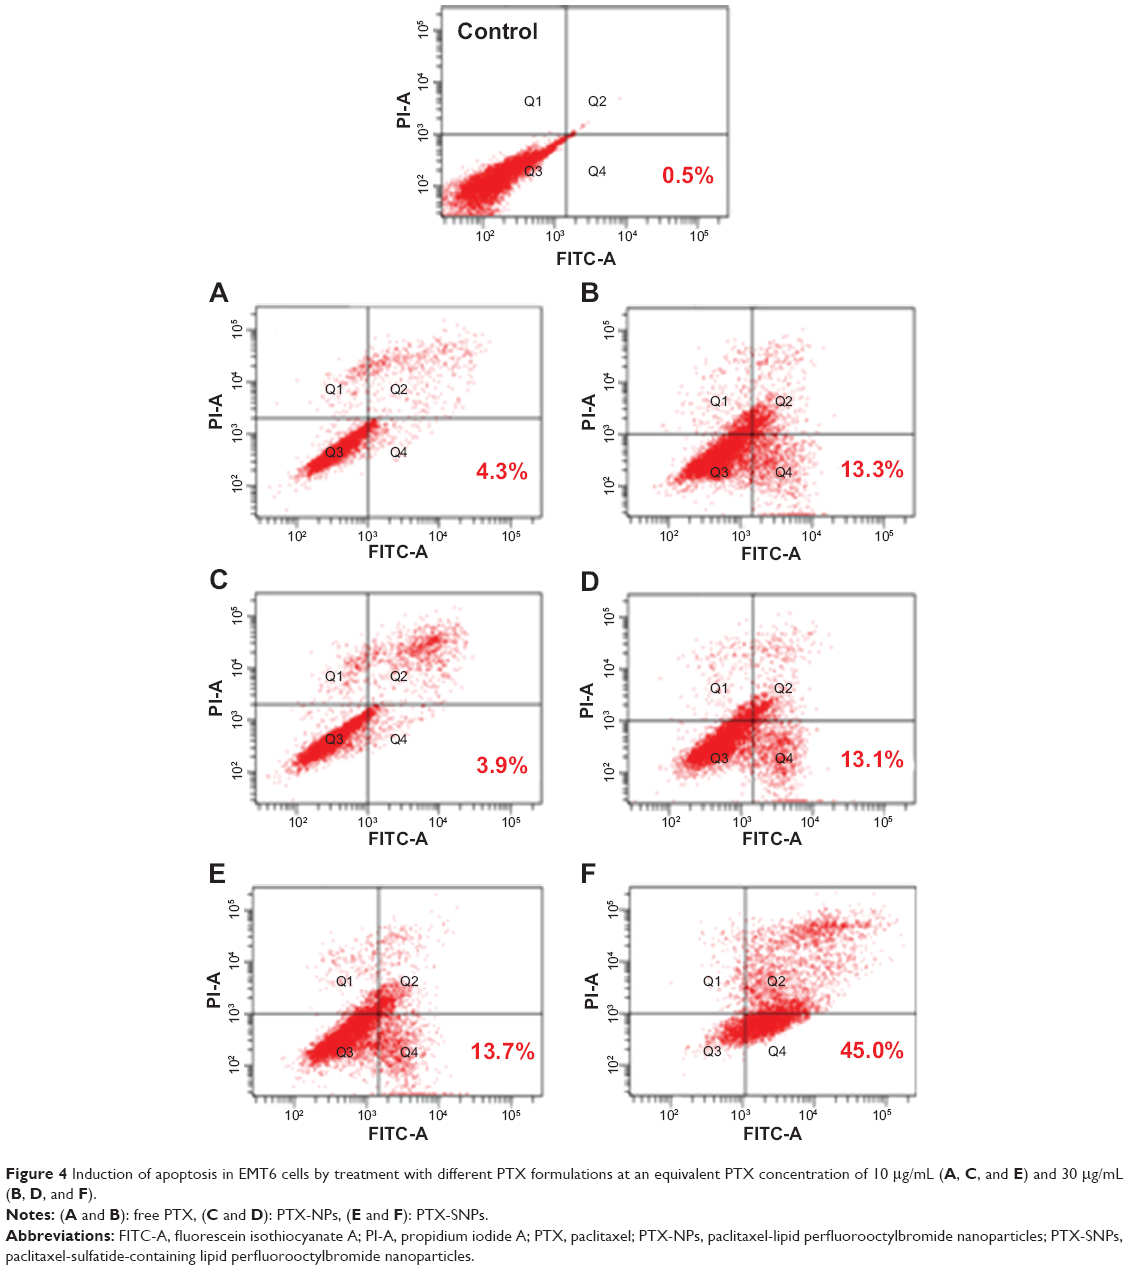 | Figure 4 Induction of apoptosis in EMT6 cells by treatment with different PTX formulations at an equivalent PTX concentration of 10 μg/mL (A, C, and E) and 30 μg/mL (B, D, and F). |
Cellular uptake of payload in SNPs
The cellular uptake studies were performed utilizing coumarin 6 as a fluorescent marker. To assess the entrapment and retention of the fluorescent marker in SNPs, the coumarin 6-loaded SNPs were dialyzed against PBS (pH 7.4) containing 0.01% (v/v) Tween-80, and the fraction of fluorescent marker released after 24 hours was within 1%–2%, suggesting a good entrapment.25 As shown in Figure 5, the fluorescent density of the cells co-cultured with coumarin 6-SNPs for 2 hours was 1.9- and 2.0-fold higher than that of the cells co-cultured with coumarin 6-NPs or free coumarin 6, respectively. Fluorescent density of the cells co-cultured with different formulations for 12 hours showed a similar tendency as that of cells co-cultured for 2 hours. However, fluorescent density of the cells co-cultured with different formulations for 0.5 hours showed no difference (P>0.05). In addition, the uptake of fluorescence could be inhibited by free sulfatide incubation in advance (P<0.01). Fluorescent density of the cells directly co-cultured with coumarin 6-SNPs was 1.6- or 1.3-fold higher than that of the cells co-cultured with free sulfatide in advance at 2 or 12 hours, respectively.
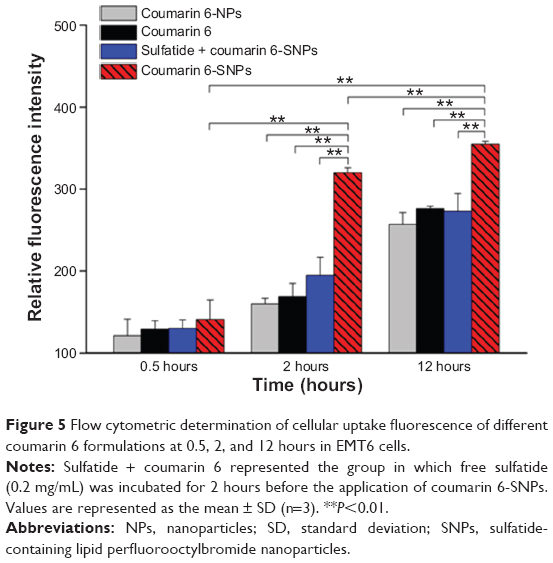 | Figure 5 Flow cytometric determination of cellular uptake fluorescence of different coumarin 6 formulations at 0.5, 2, and 12 hours in EMT6 cells. |
Biodistribution studies
Figure 6A, B, C, and D represent the biodistribution data of different PTX formulation injections at 1, 8, 12, and 24 hours, respectively, in various organs after the injection. Taxol® displayed very low distribution in tumor tissue, while PTX-NPs and PTX-SNPs accumulated mainly in the spleen and liver, respectively. The PTX-SNPs displayed a higher PTX accumulation in the tumor tissue (P<0.01) and a significant reduction in distribution to the liver and spleen (P<0.01) compared to PTX-NPs at each time point. Interestingly, PTX-SNPs showed a 2.4- or 3.2-fold higher PTX concentration in tumor tissue compared to PTX-NPs or Taxol® (P<0.01) at 8 hours after drug administration, respectively.
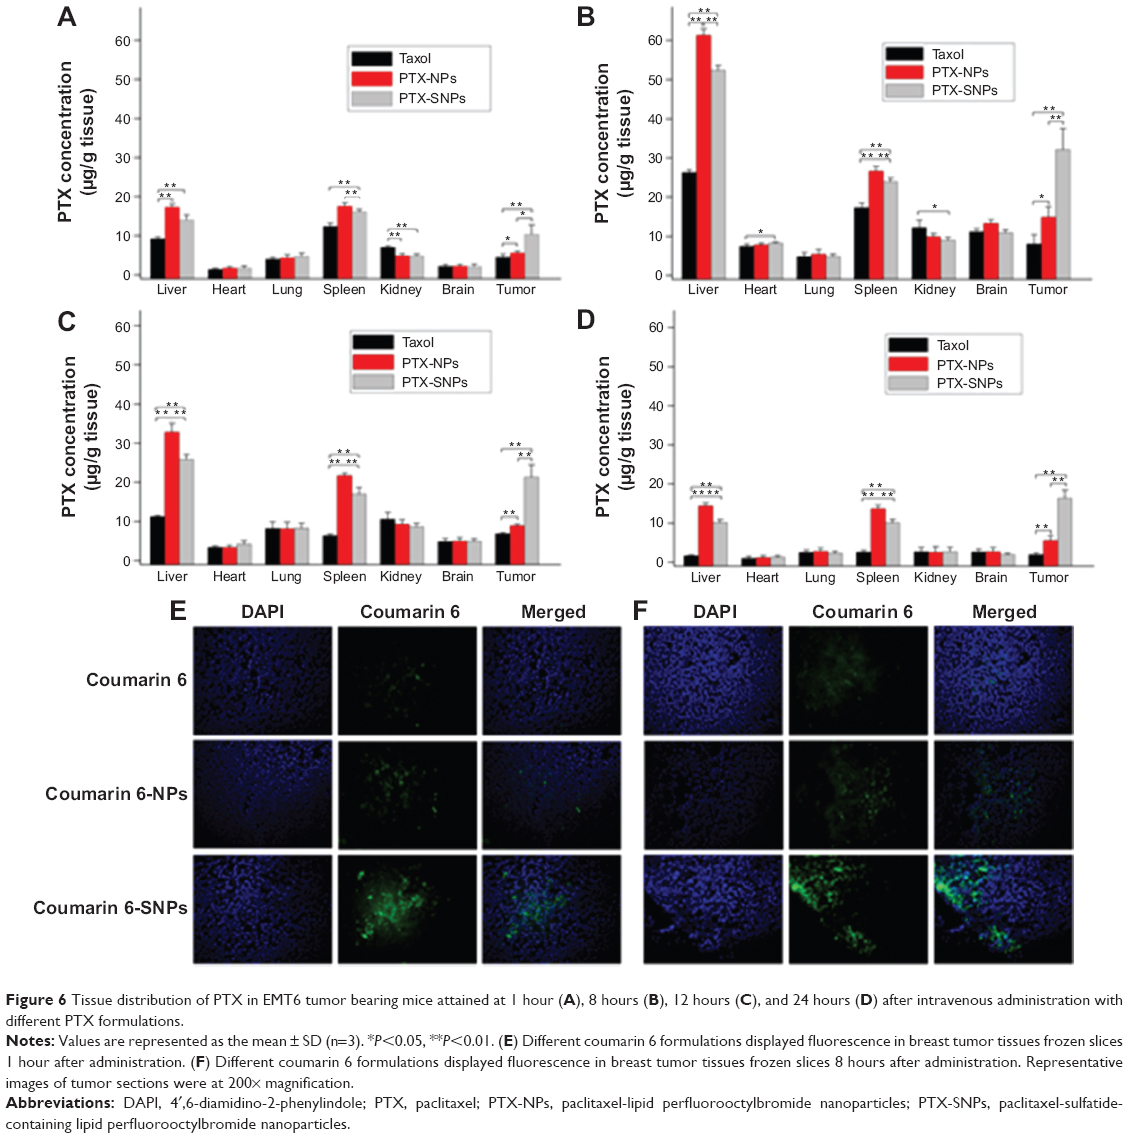 | Figure 6 Tissue distribution of PTX in EMT6 tumor bearing mice attained at 1 hour (A), 8 hours (B), 12 hours (C), and 24 hours (D) after intravenous administration with different PTX formulations. |
To visually observe the distribution of the different NPs in the tumor tissue, we analyzed the fluorescence of the frozen tumor slices. As shown in Figure 6E and F, coumarin 6-SNPs displayed more extensive fluorescence intensity in breast tumor tissues than coumarin 6-NPs and free coumarin 6 at 1 and 8 hours after administration, respectively.
In vivo antitumor efficiency and tumor apoptosis detection
An in vivo antitumor efficiency study was carried out in mice bearing EMT6 breast tumors. The initial tumor volume of the treated groups was not significantly different from the control group (201.42 mm3 ±47.87 mm3). Figure 7 and Table 2 show that PTX-SNPs achieved the best antitumor effects by tail vein injection compared to the other formulations. For the groups receiving the saline and blank SNPs, the tumors grew rapidly with similar tendency during the test period, confirming the inefficacy of blank SNPs. Over the 20 days of observation, the antitumor capability showed with the TIR was 70.8%, 45.6%, and 34.0% in the groups of animals treated with the PTX-SNPs, PTX-NPs, and Taxol®, respectively (Table 2).
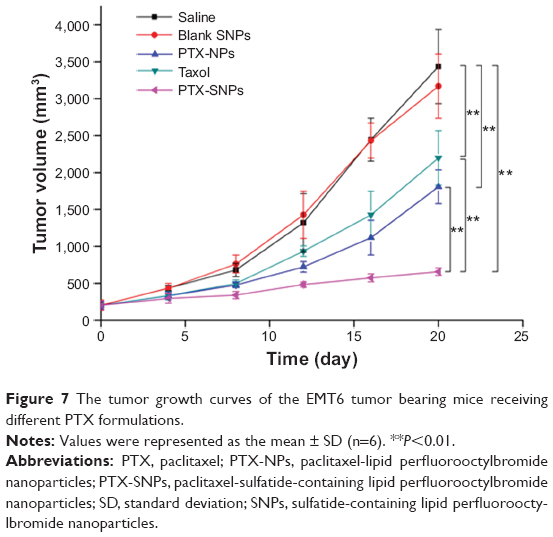 | Figure 7 The tumor growth curves of the EMT6 tumor bearing mice receiving different PTX formulations. |
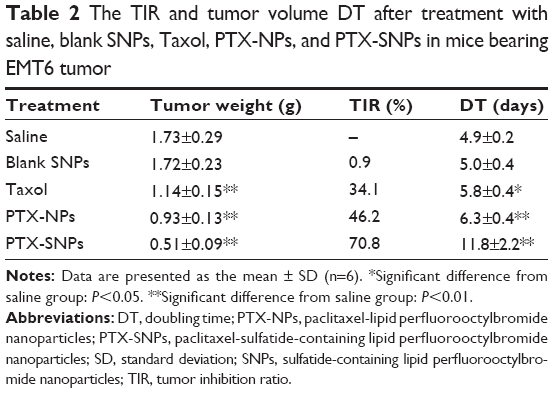 | Table 2 The TIR and tumor volume DT after treatment with saline, blank SNPs, Taxol, PTX-NPs, and PTX-SNPs in mice bearing EMT6 tumor |
A TUNEL assay confirmed that there were very few apoptotic cells in the saline and blank SNPs, with 5.08%±1.07% and 7.69%±1.20% apoptotic cells, respectively (Figure 8A, B, and F). The apoptosis index of tumors treated with PTX-SNPs was 46.83%±4.9% (Figure 8E and F), which was higher than that of treatment with PTX-NPs (30.91%±3.52%; Figure 8D and F) and Taxol® (24.27%±5.32%; Figure 8C and F), respectively (P<0.01). MVD and Bad analysis were also estimated; as shown in Figure 9, treatment with PTX-SNPs resulted in a significant reduction in MVD compared to other formulations, while the treatment with PTX-SNPs resulted in a significant increase in the Bad expression percentage (Figure 10).
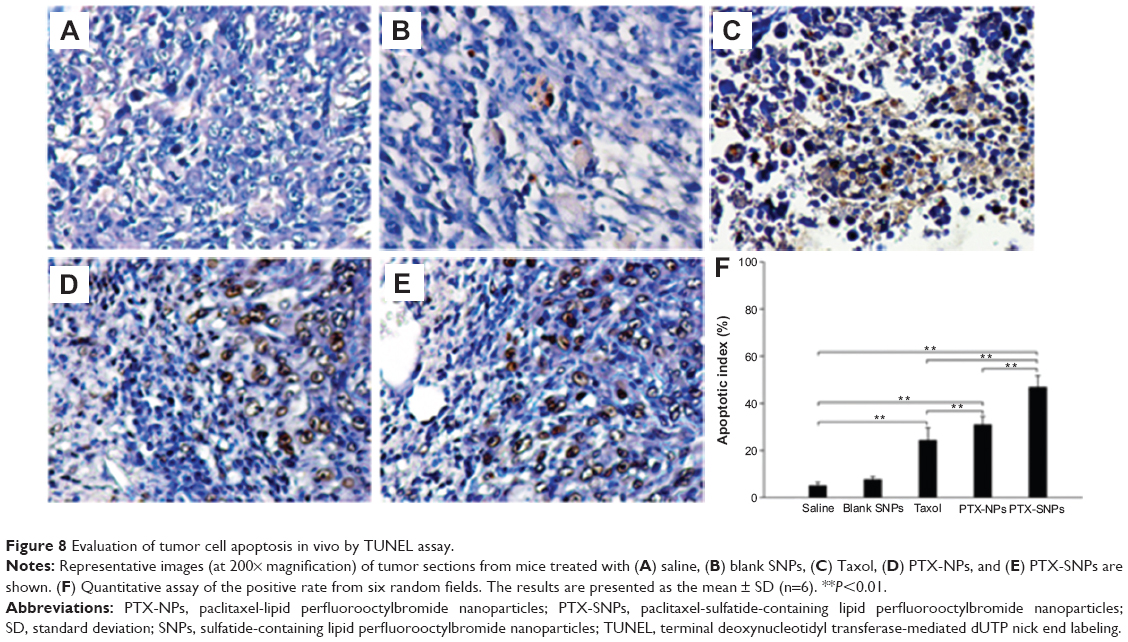 | Figure 8 Evaluation of tumor cell apoptosis in vivo by TUNEL assay. |
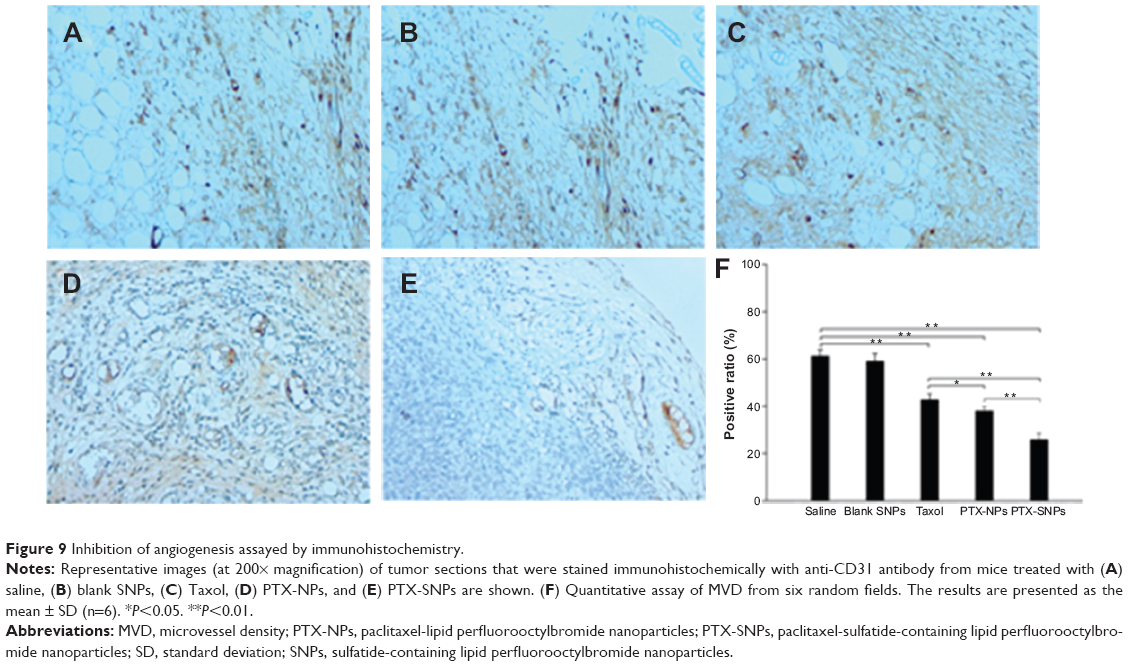 | Figure 9 Inhibition of angiogenesis assayed by immunohistochemistry. |
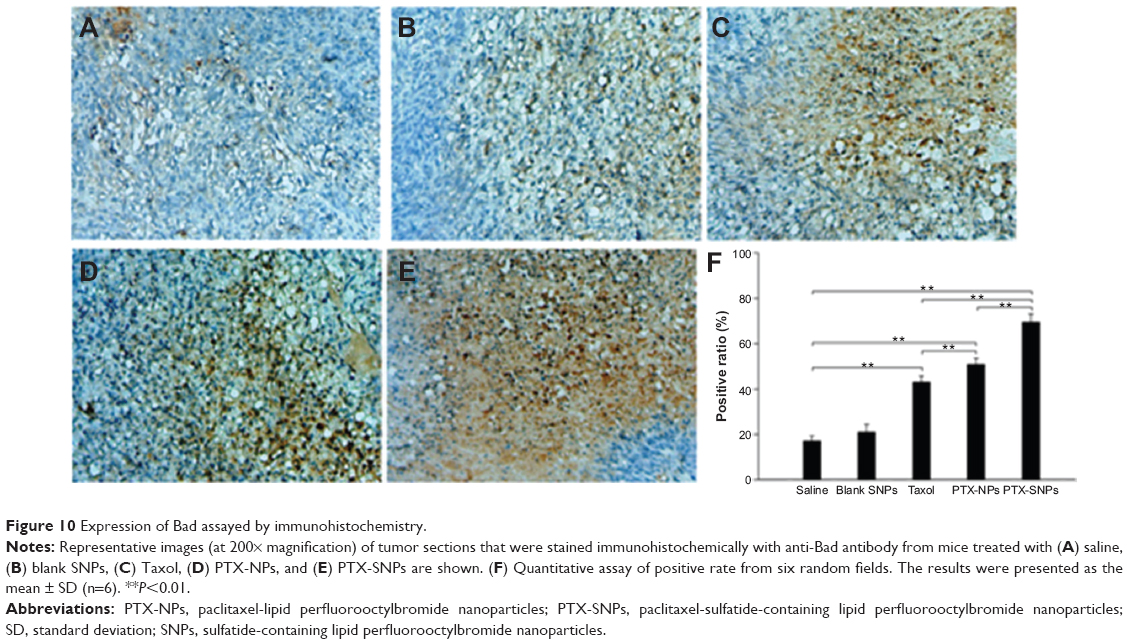 | Figure 10 Expression of Bad assayed by immunohistochemistry. |
In vivo toxicity
None of the animals showed visual signs of fatigue or discomfort and all slowly increased in body weight during the 2-week period (not shown in the text). The hematological results showed that the chosen hematology markers such as white blood cells, red blood cells, platelets, and lymphocytes (%) in the group treated with the blank SNPs appeared to be normal in comparison with the saline group (Table 3). The liver function markers including aspartate transaminase, alanine transaminase, and total bilirubin in the blank SNPs group showed no difference compared to the saline group (Table 3). The histological toxicity results are shown in Figure 11. Major tissues including the heart, liver, spleen, lung, and kidney revealed no obvious lesions in any of the tested animals. The results suggested that blank SNPs did not cause any sort of hepatic or systemic toxicity, even when administered via consecutive intravenous injections for 2 weeks. These studies collectively illustrated the safety and suitability of SNPs for use as drug delivery vehicles.
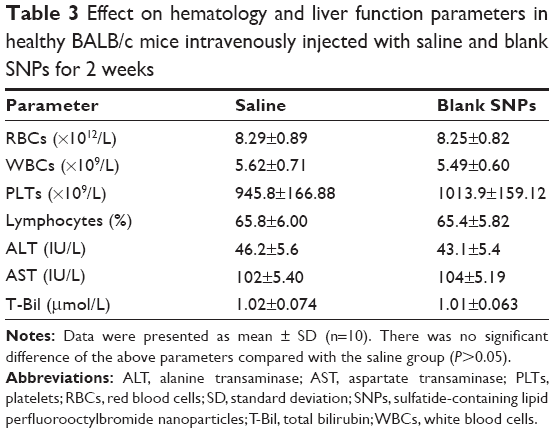 | Table 3 Effect on hematology and liver function parameters in healthy BALB/c mice intravenously injected with saline and blank SNPs for 2 weeks |
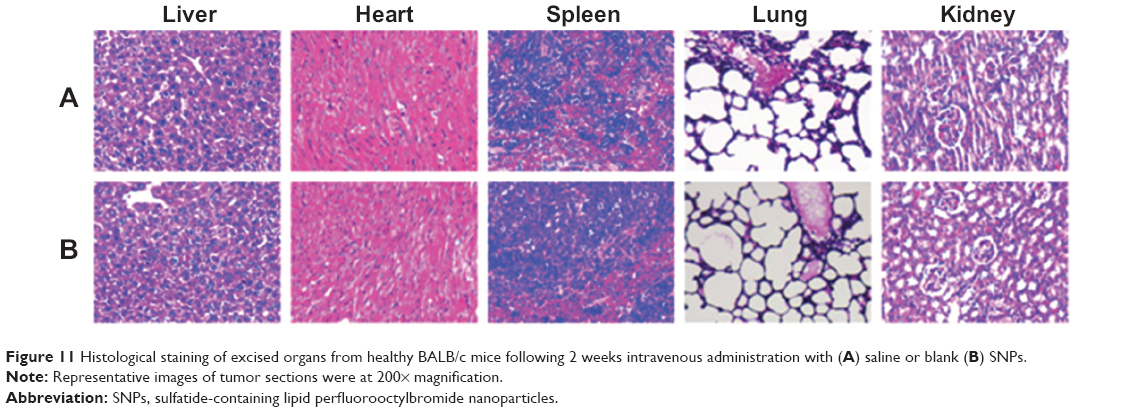 | Figure 11 Histological staining of excised organs from healthy BALB/c mice following 2 weeks intravenous administration with (A) saline or blank (B) SNPs. |
Discussion
Solid tumors such as breast cancer have always provided many challenges to achieving satisfactory therapy.29 The performance and safety of current antineoplastic agents for breast carcinoma such as PTX are still far from satisfactory.30 However, the use of PTX has been limited due to poor selectivity and low uptake efficiency in breast carcinoma tissue. To settle the problems of PTX use, we developed SNPs as a satisfactory targeted delivery of PTX to breast carcinoma cells. In this study, we performed a series of studies to demonstrate that SNPs can deliver more drug to targeted breast tumor and lead to remarkable antitumor efficacy. Our results supported the hypothesis that SNPs may serve as efficient and satisfactory PTX delivery vehicles targeting breast cancer.
The PTX-SNPs and PTX-NPs were developed by an oil-in-water single-emulsion solvent evaporation method. EPC, sulfatide, and PTX were dissolved in chloroform, evaporated, and dispersed in PBS, resulting in a liposome suspension. The outer lipid bilayer of liposome comprised EPC and sulfatide, where the drug was diffused into the bilayer. Next, the liposome suspension was coupled with PFOB, and emulsified, resulting in a monolayer PTX-SNPs. As in the description of Figure 1I, the sulfatide and EPC were localized on the surface of the PTX-SNPs, with the PTX diffusing into the outer lipid monolayer surrounding a PFOB core. The PTX-SNPs had similar particle size (approximately 240 nm) (Table 1), spherical shape, and homogeneous distribution (Figure 1G, H, and D). It has been reported that the 200 nm (smaller than 700 nm) NPs could reach the interstitial fluid surrounding the tumor cells through the leaking endothelium of the tumor microvasculature.31 Coumarin 6 was also loaded into the SNPs as a fluorescence probe to compare the cellular uptake efficiency. It is obvious that incorporating different compositions would affect the nanoparticle size (Table 1). One hundered percent PTX release was observed from Taxol® within the first 14 hours, while 100% PTX release was not observed from PTX-SNPs and PTX-NPs within 60 hours (Figure 2). The delayed release of PTX may be attributed to the presence of the lipid monolayer that serves as a rate-controlling membrane to create a barrier to the release of PTX. Drug release from the PTX-SNPs exhibited a nonlinear release profile characterized by a burst release at the initial stage, followed by a slower continuous release in the later period (Figure 2). The initial burst release of PTX was beneficial for quickly reaching the effective treatment concentration, while the slow release into the release medium was beneficial for maintaining the effective concentration.
PTX-SNPs had greater EMT6 cytotoxicity levels than PTX-NPs and free PTX (Figure 3) in the MTT assay. The early apoptosis rates of EMT6 cells treated with PTX-SNPs were also significantly higher than those of cells treated with PTX-NPs and free PTX (Figure 4) for 48 hours. The apoptosis of EMT6 cells includes intrinsic and extrinsic pathway apoptosis. We utilized the control experiment to exclude the influence of intrinsic pathway apoptosis. The percentage of early apoptosis of EMT6 cells in the blank SNPs group and control group were approximately 0.5%, while the percentage of early apoptosis of EMT6 cells in different PTX formulations was significantly higher than the control group (Figure 4). These results illustrated that EMT6 cells trapped the PTX from different formulations, directly producing tumor cell apoptosis. The PTX-SNPs improved the antitumor ability, which was likely attributed to the high intracellular drug concentration. When reaching into the solid tumor, cellular uptake efficiency of the drug dominated the intracellular drug concentration and cytotoxicity. The fluorescent uptake efficiency study of coumarin 6-SNPs, coumarin 6-NPs, and free coumarin 6 was utilized as a method to assess the ability of different NPs to deliver the upload into EMT6 cells. The results (Figure 5) revealed that SNPs, NPs, and free coumarin 6 delivered similar amounts of payload to EMT6 cells after co-cultivation for 0.5 hours, while SNPs delivered more payload to EMT6 cells compared with NPs and free coumarin 6 after co-cultivation for 2 and 12 hours. The different cellular fluorescence intensity of all test formulations may be attributed to the different cell uptake mechanisms among all the formulations. It has been reported that sulfatide served as the targeting motif that would guide the SNPs to the ECM of the tumor cells by interacting with ECM glycoproteins such as TN-C.32 Hence, SNPs, a type of targeted NP, can deliver lipophilic drugs directly to the target cell membrane with subsequent trafficking via lipid-raft-dependent pathways.33 The result is delivery of greater amounts of drug with more efficient and immediate access to intracellular targets. For free drug, the cell uptake mechanism is a passive diffusion process,29 while for conventional NPs, as a nontargeted delivery system, a possible endocytosis mechanism could be involved.34 At the initial time, these three different mechanisms may show similar comprehensive effects. Thus, the three different formulations delivered similar amounts of payload to cells at 0.5 hours. In the later part of the study, the passive diffusion process or endocytosis mechanism of free drug or NPs was weakened, which was caused by decreases of drug concentrations in the medium, while the SNPs continued to effectively deliver the payload via lipid-raft-dependent pathways to the EMT6 cells. This effect may be the reason for the higher concentrations of the payload in the EMT6 cells at 2 and 12 hours. In addition, because the sites on EMT6 cells to which sulfatide was bound were specific for sulfatide, excessive free sulfatide (0.2 mg/mL) was also added and incubated for 2 hours before the application of coumarin 6-SNPs. The amounts of payload delivered by SNPs could be inhibited by free sulfatide incubation in advance (P<0.01). The results confirmed that sulfatide, serving as the targeting motif, would increase the intracellular drug concentration by guiding the SNPs to bind to the targeted tumor cells.
With regard to the in vivo antitumor efficiency, the progressive changes of the volume, TIR, and DT in the female mice bearing EMT6 breast tumor confirmed the higher antitumor activity of PTX-SNPs compared to the other formulations at comparable dosages of PTX (Figure 7 and Table 2). The histological results also showed that PTX-SNPs appeared to result in increased apoptosis and Bad expression and reduced angiogenesis in the tumor (Figures 8 and 9). All results confirmed that PTX-SNPs presented excellent antitumor efficiency in vivo. This phenomenon may be the result of a high drug concentration in the tumor tissue. It is worth noting that even a small difference in the intratumoral concentration of an agent can make a large difference in therapeutic effects.35 In vivo, the PTX-triggered antitumor effect is a more complex biological process than in vitro, in which PTX should first be targeted to the tumor site and then exert inhibitory effects on tumor cells.36 In vivo tissue distribution studies revealed that the distribution of PTX was altered when delivered through the PTX-SNPs, which resulted in significantly higher PTX accumulations in tumors than PTX-NPs and Taxol® (Figure 6A, B, C, and D). To visually observe and confirm the targeted tumor tissue ability of SNPs, we chose coumarin 6 as the fluorescence probe and observed the frozen tumor tissue slices at 1 (Figure 6E) and 8 hours (Figure 6F) after administration of different formulations. The results agreed with the tissue distribution studies, showing that the SNPs could efficiently increase payload accumulation in tumor tissue. After targeting the tumor site, PTX-SNPs can bind to the cancer cells and effectively deliver the PTX to the EMT6 cells as described above. Thus, the PTX-SNPs did have remarkable antitumor activity in vivo, which may be attributed to improvements in drug concentrations in targeted tumor tissues and effective delivery of the PTX to the EMT6 cells.
The toxicity of delivery systems in biomedicine is always of great concern. In vivo tissue distribution studies revealed that the distribution of PTX was altered when delivered through the SNPs, which resulted in lower accumulation than NPs but still higher accumulation in the liver than other organs (Figure 6A–D). The results of the biodistribution urged us to further investigate the potential pathological lesions on the liver. To reveal any potential toxic effect of SNPs, we conducted blood biochemistry concerning liver function markers, hematology analyses (Table 3), and histological analyses of major tissues (Figure 11) in healthy mice treated with blank SNPs compared to saline controls. Despite the fact that SNPs demonstrated significant drug concentration in the liver, which had been observed in cases of in vivo tissue distribution, all these results showed that blank SNPs did not cause acute hepatic or hematological system toxicity or major organ damage in mice. This study collectively supported the safety and suitability of SNPs for use as drug delivery vehicles.
Conclusion
In this study, we designed a novel targeted drug delivery vehicle that is characterized by breast-tumor-specific targeting, sustained release, and safety in biomedicine. PTX-SNPs significantly increased the concentration of PTX in breast tumor tissues and facilitated the delivery of drug to targeted EMT6 cells, which led to remarkably enhanced cytotoxicity and in vivo antitumor efficacy compared to PTX-NPs and Taxol®. The toxicity studies revealed that the SNPs had no systemic toxicity as a drug delivery vehicle. Our results indicated that SNPs may have great potential to deliver PTX for the targeted treatment of breast cancer.
Acknowledgments
This work was supported by the National New Drug Research Program of China (96-901-05-88) and the Project of Science and Technology of Guangdong province (2003A1070103).
Disclosure
The authors report no conflicts of interest in this work.
References
Anderson BO. Breast cancer–thinking globally. Science. 2014;343(6178):1403. | ||
Sandercock J, Parmar MK, Torri V, Qian W. First-line treatment for advanced ovarian cancer: paclitaxel, platinum and the evidence. Br J Cancer. 2002;87(8):815–824. | ||
Friedrich M, Diesing D, Villena-Heinsen C, Felberbaum R, Kolberg HC, Diedrich K. Taxanes in the first-line chemotherapy of metastatic breast cancer: review. Eur J Gynaecol Oncol. 2004;25(1):66–70. | ||
Keresztes RS, Port JL, Pasmantier MW, Korst RJ, Altorki NK. Preoperative chemotherapy for esophageal cancer with paclitaxel and carboplatin: results of a phase II trial. J Thorac Cardiovasc Surg. 2003;126(5):1603–1608. | ||
Spencer CM, Faulds D. Paclitaxel. A review of its pharmacodynamic and pharmacokinetic properties and therapeutic potential in the treatment of cancer. Drugs. 1994;48(5):794–847. | ||
Xiao H, Verdier-Pinard P, Fernandez-Fuentes N, et al. Insights into the mechanism of microtubule stabilization by Taxol. Proc Natl Acad Sci U S A. 2006;103(27):10166–10173. | ||
McGrogan BT, Gilmartin B, Carney DN, McCann A. Taxanes, microtubules and chemoresistant breast cancer. Biochim Biophys Acta. 2008;1785(2):96–132. | ||
Toiyama Y, Inoue Y, Hiro J, et al. Paclitaxel inhibits radiation induced VEGF secretion and enhances radiosensitizing effects in human colon cancer cell HT29. Cancer Ther. 2009;7:123–132. | ||
Yao HJ, Ju RJ, Wang XX, et al. The antitumor efficacy of functional paclitaxel nanomicelles in treating resistant breast cancers by oral delivery. Biomaterials. 2011;32(12):3285–3302. | ||
Lanza GM, Yu X, Winter PM, et al. Targeted antiproliferative drug delivery to vascular smooth muscle cells with a magnetic resonance imaging nanoparticle contrast agent: implications for rational therapy of restenosis. Circulation. 2002;106(22):2842–2847. | ||
Winter PM, Neubauer AM, Caruthers SD, et al. Endothelial alpha(v)beta3 integrin-targeted fumagillin nanoparticles inhibit angiogenesis in atherosclerosis. Arterioscler Thromb Vasc Biol. 2006;26(9):2103–2109. | ||
Soman NR, Baldwin SL, Hu G, et al. Molecularly targeted nanocarriers deliver the cytolytic peptide melittin specifically to tumor cells in mice, reducing tumor growth. J Clin Invest. 2009;119(9):2830–2842. | ||
Marsh JN, Senpan A, Hu G, et al. Fibrin-targeted perfluorocarbon nanoparticles for targeted thrombolysis. Nanomedicine (Lond). 2007;2(4):533–543. | ||
Krafft MP. Fluorocarbons and fluorinated amphiphiles in drug delivery and biomedical research. Adv Drug Deliv Rev. 2001;47(2–3):209–228. | ||
Wu X, Li QT. Hydration and stability of sulfatide-containing phosphatidylethanolamine small unilamellar vesicles. Biochim Biophys Acta. 1999;1416(1–2):285–294. | ||
Crossin KL, Edelman GM. Specific binding of cytotactin to sulfated glycolipids. J Neuroscience Res. 1992;33(4):631–638. | ||
Chiquet-Ehrismann R, Chiquet M. Tenascins: regulation and putative functions during pathological stress. J Pathol. 2003;200(4):488–499. | ||
Byrne JD, Betancourt T, Brannon-Peppas L. Active targeting schemes for nanoparticle systems in cancer therapeutics. Adv Drug Deliv Rev. 2008;60(15):1615–1626. | ||
Allen TM. Ligand-targeted therapeutic in anticancer therapy. Nat Rev Cancer. 2002;2(10):750–763. | ||
Yagi K, Naoi M. Glycolipid insertion into liposomes for their targeting to specific organs. In: Yagi K, editor. Medical Application of Liposomes. Tokyo: Japan Scientific Societies Press; 1986:91–97. | ||
Chen D, Lee KH. Biodistribution of calcitonin encapsulated in liposomes in mice with particular reference to the central nervous system. Biochim Biophys Acta. 1993;1158(3):244–250. | ||
Wu X, Lee KH, Li QT. Stability and pH sensitivity of sulfatide-containing phosphatidylethanolamine small unilamellar vesicles. Biochim Biophys Acta. 1996;1284(1):13–19. | ||
Lanza GM, Wallace KD, Scott MJ, et al. A novel site-targeted ultrasonic contrast agent with broad biomedical application. Circulation. 1996;94(12):3334–3340. | ||
Mo LQ, Hou LB, Guo D, Xiao XY, Mao P, Yang X. Preparation and characterization of teniposide PLGA nanoparticles and their uptake in human gliblastoma U87MG cells. Int J Pharm. 2012;436(1–2):815–824. | ||
Jain V, Swarnakar NK, Mishra PR, et al. Paclitaxel loaded PEGylated gleceryl monooleate based nanoparticulate carriers in chemotherapy. Biomaterials. 2012;33(29):7206–7220. | ||
Jain AK, Swarnakar NK, Godugu C, Singh RP, Jain S. The effect of the oral administration of polymeric nanoparticles on the efficacy and toxicity of tamoxifen. Biomaterials. 2011;32(2):503–515. | ||
Guo DD, Xu CX, Quan JS, et al. Synergistic anti-tumor activity of paclitaxel-incorporated conjugated linoleic acid-coupled poloxamer thermosensitive hydrogel in vitro and in vivo. Biomaterials. 2009;30(27):4777–4785. | ||
Shi L, Tang C, Yin C. Glycyrrhizin-modified O-carboxymethyl chitosan nanoparticles as drug vehicles targeting hepatocellular carcinoma. Biomaterials. 2012;33(30):7594–7604. | ||
Yan F, Li L, Deng Z, et al. Paclitaxel-liposome-microbubble complexes as ultrasound-triggered therapeutic drug delivery carriers. J Control Release. 2013;166(3):246–255. | ||
Zhang R, Luo K, Yang J, et al. Synthesis and evaluation of a backbone biodegradable multiblock HPMA copolymer nanocarrier for the systemic delivery of paclitaxel. J Control Release. 2013;166(1):66–74. | ||
Oeffinger BE, Wheatley MA. Development and characterization of a nano-scale contrast agent. Ultrasonics. 2004;42(1–9):343–347. | ||
Shao K, Hou Q, Duan W, Go ML, Wong KP, Li QT. Intracellular drug delivery by sulfatide-mediated liposomes to gliomas. J Control Release. 2006;115(2):150–157. | ||
Partlow KC, Lanza GM, Wickline SA. Exploiting lipid raft transport with membrane targeted nanoparticles: a strategy for cytosolic drug delivery. Biomaterials. 2008;29(23):3367–3375. | ||
Iyer AK, Khaled G, Fang J, Maeda H. Exploiting the enhanced permeability and retention effect for tumor targeting. Drug Discov Today. 2006;11(17–18):812–818. | ||
Frei E, Canellos GP. Dose: a critical factor in cancer chemotherapy. Am J Med. 1980;69(4):585–594. | ||
Wang G, Yu B, Wu Y, Huang B, Yuan Y, Liu CS. Controlled preparation and antitumor efficacy of vitamin E TPGS-functionalized PLGA nanoparticles for delivery of paclitaxel. Int J Pharm. 2013;446(1–2):24–33. |
 © 2014 The Author(s). This work is published and licensed by Dove Medical Press Limited. The full terms of this license are available at https://www.dovepress.com/terms.php and incorporate the Creative Commons Attribution - Non Commercial (unported, v3.0) License.
By accessing the work you hereby accept the Terms. Non-commercial uses of the work are permitted without any further permission from Dove Medical Press Limited, provided the work is properly attributed. For permission for commercial use of this work, please see paragraphs 4.2 and 5 of our Terms.
© 2014 The Author(s). This work is published and licensed by Dove Medical Press Limited. The full terms of this license are available at https://www.dovepress.com/terms.php and incorporate the Creative Commons Attribution - Non Commercial (unported, v3.0) License.
By accessing the work you hereby accept the Terms. Non-commercial uses of the work are permitted without any further permission from Dove Medical Press Limited, provided the work is properly attributed. For permission for commercial use of this work, please see paragraphs 4.2 and 5 of our Terms.